
How Agriculture, Connectivity and Water Management Can Affect Water Quality of a Mediterranean Coastal Wetland


Abstract
:1. Introduction
2. Methods
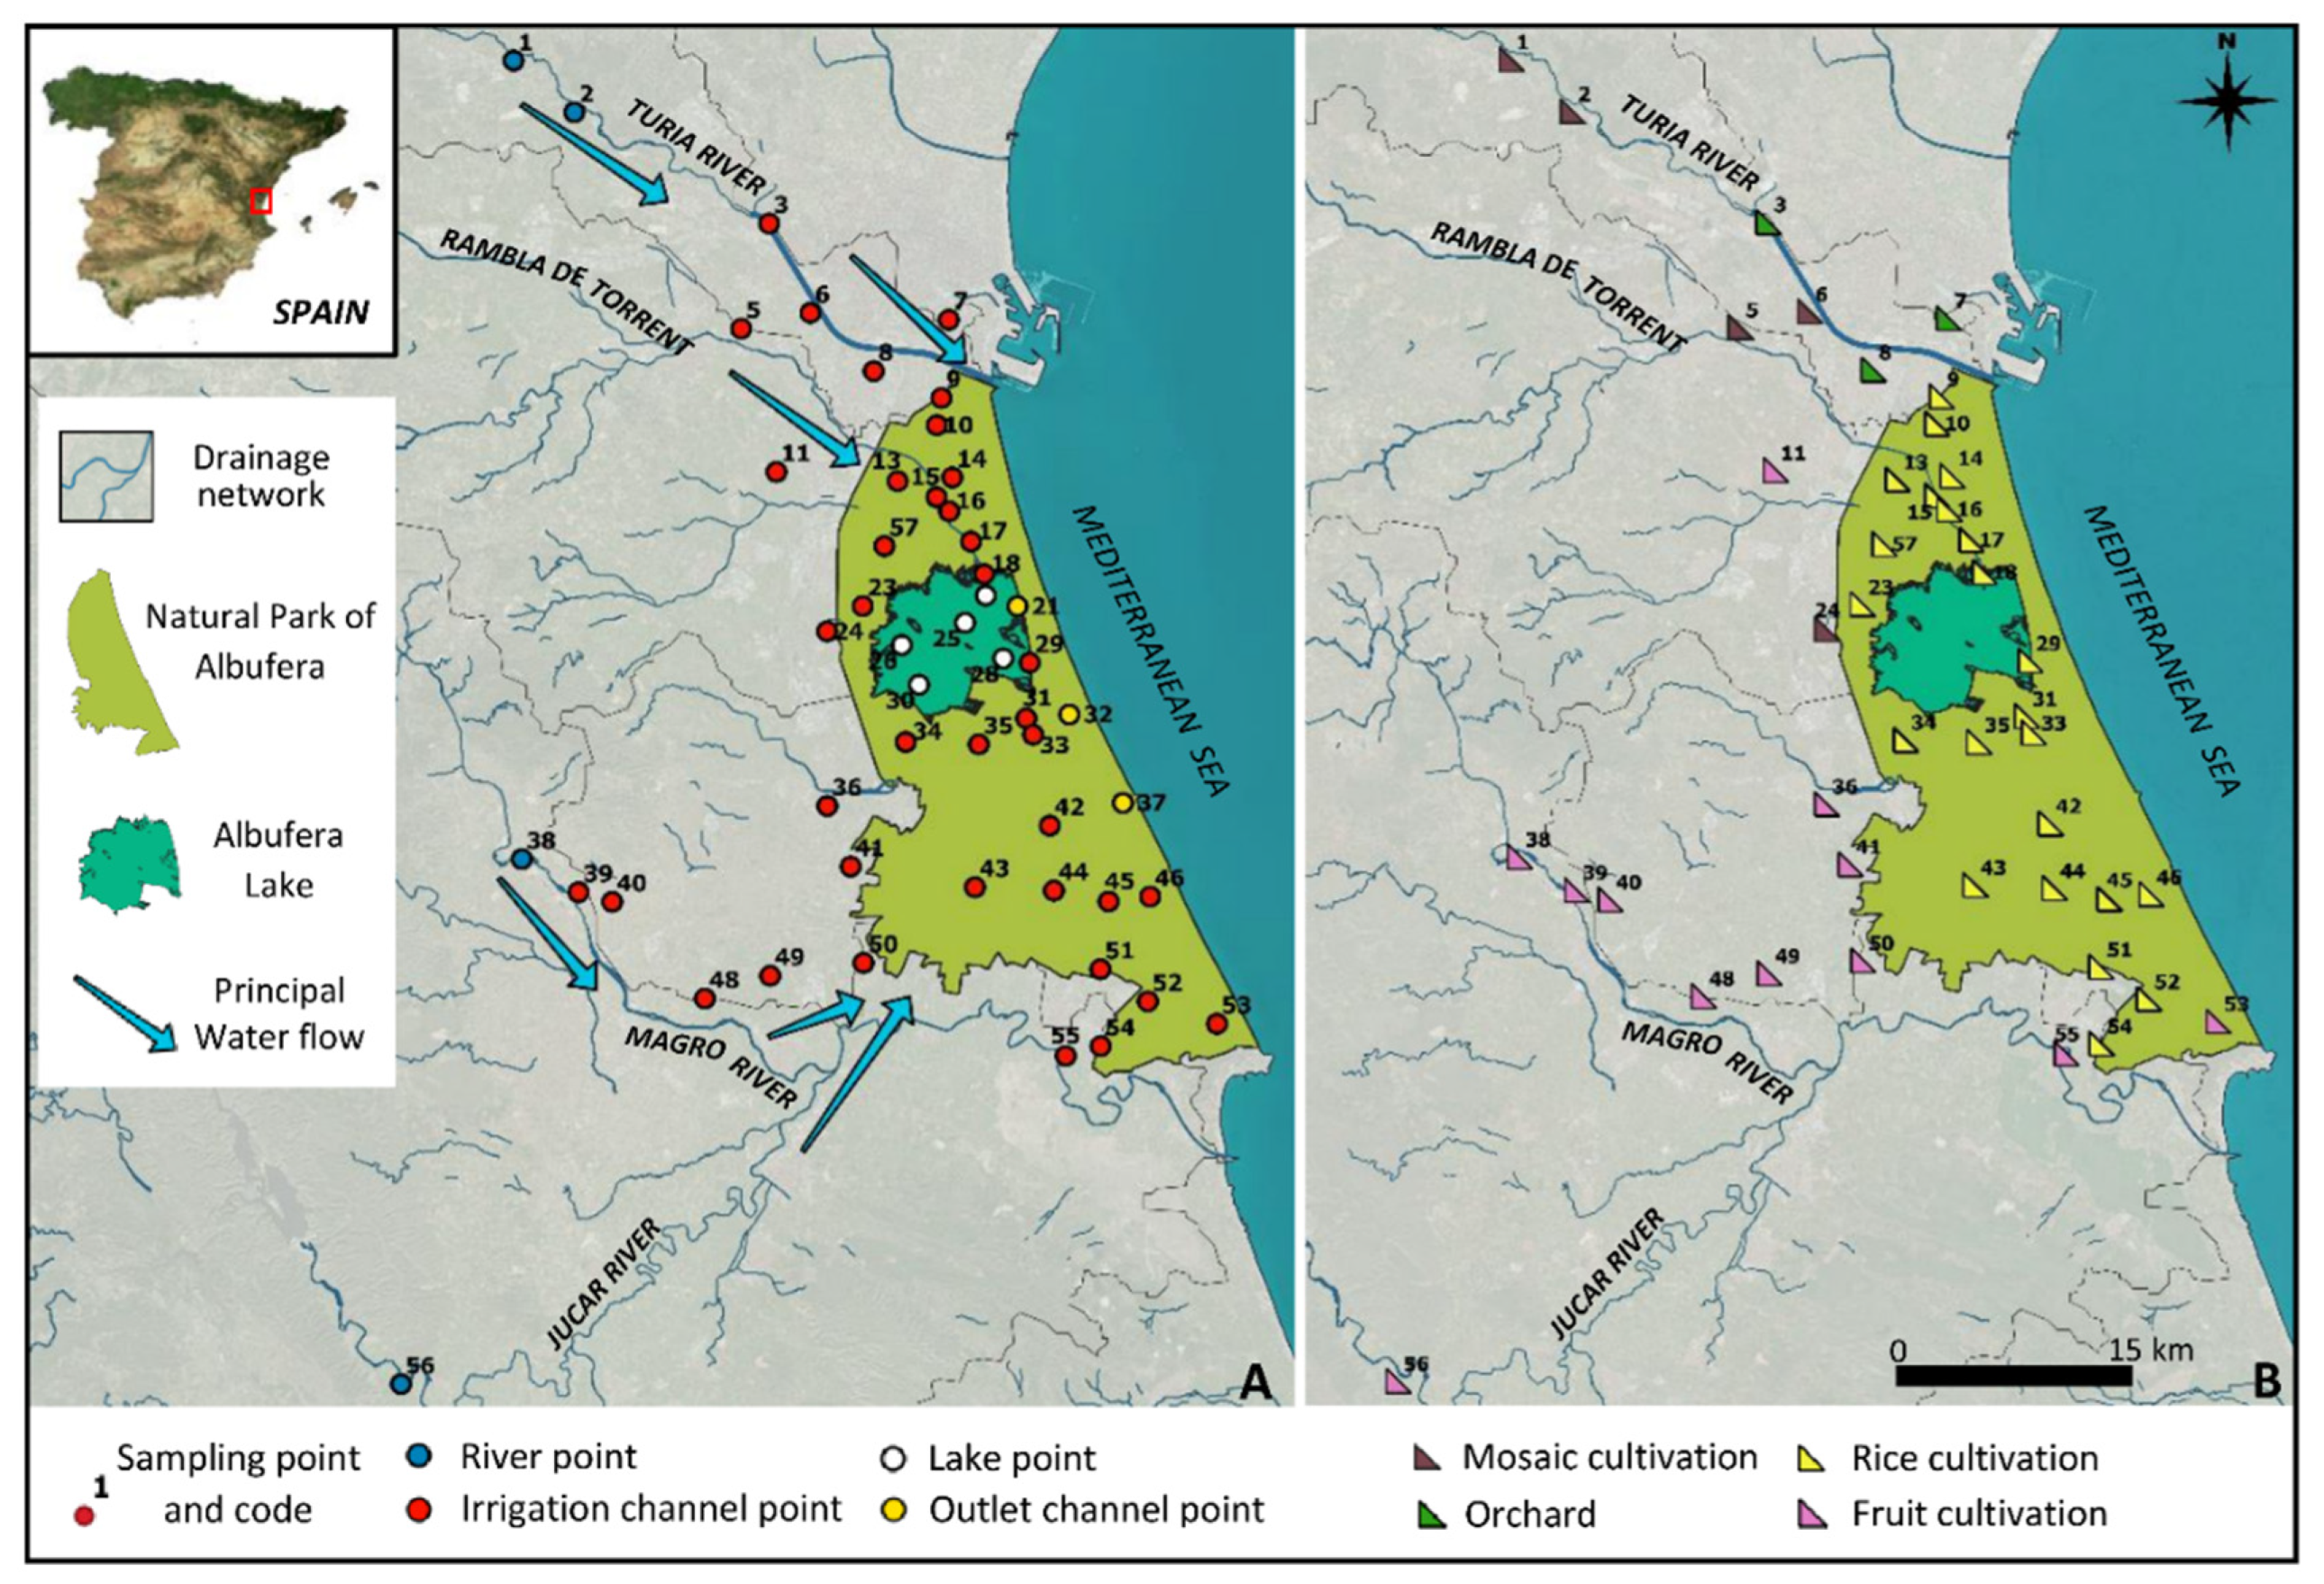
2.1. Study Area
2.2. Sampling Points and Water Collection
2.3. Water Analyses
2.4. Water Quality Assessment
2.5. Meteorological Data
2.6. Statistical Analyses
3. Results
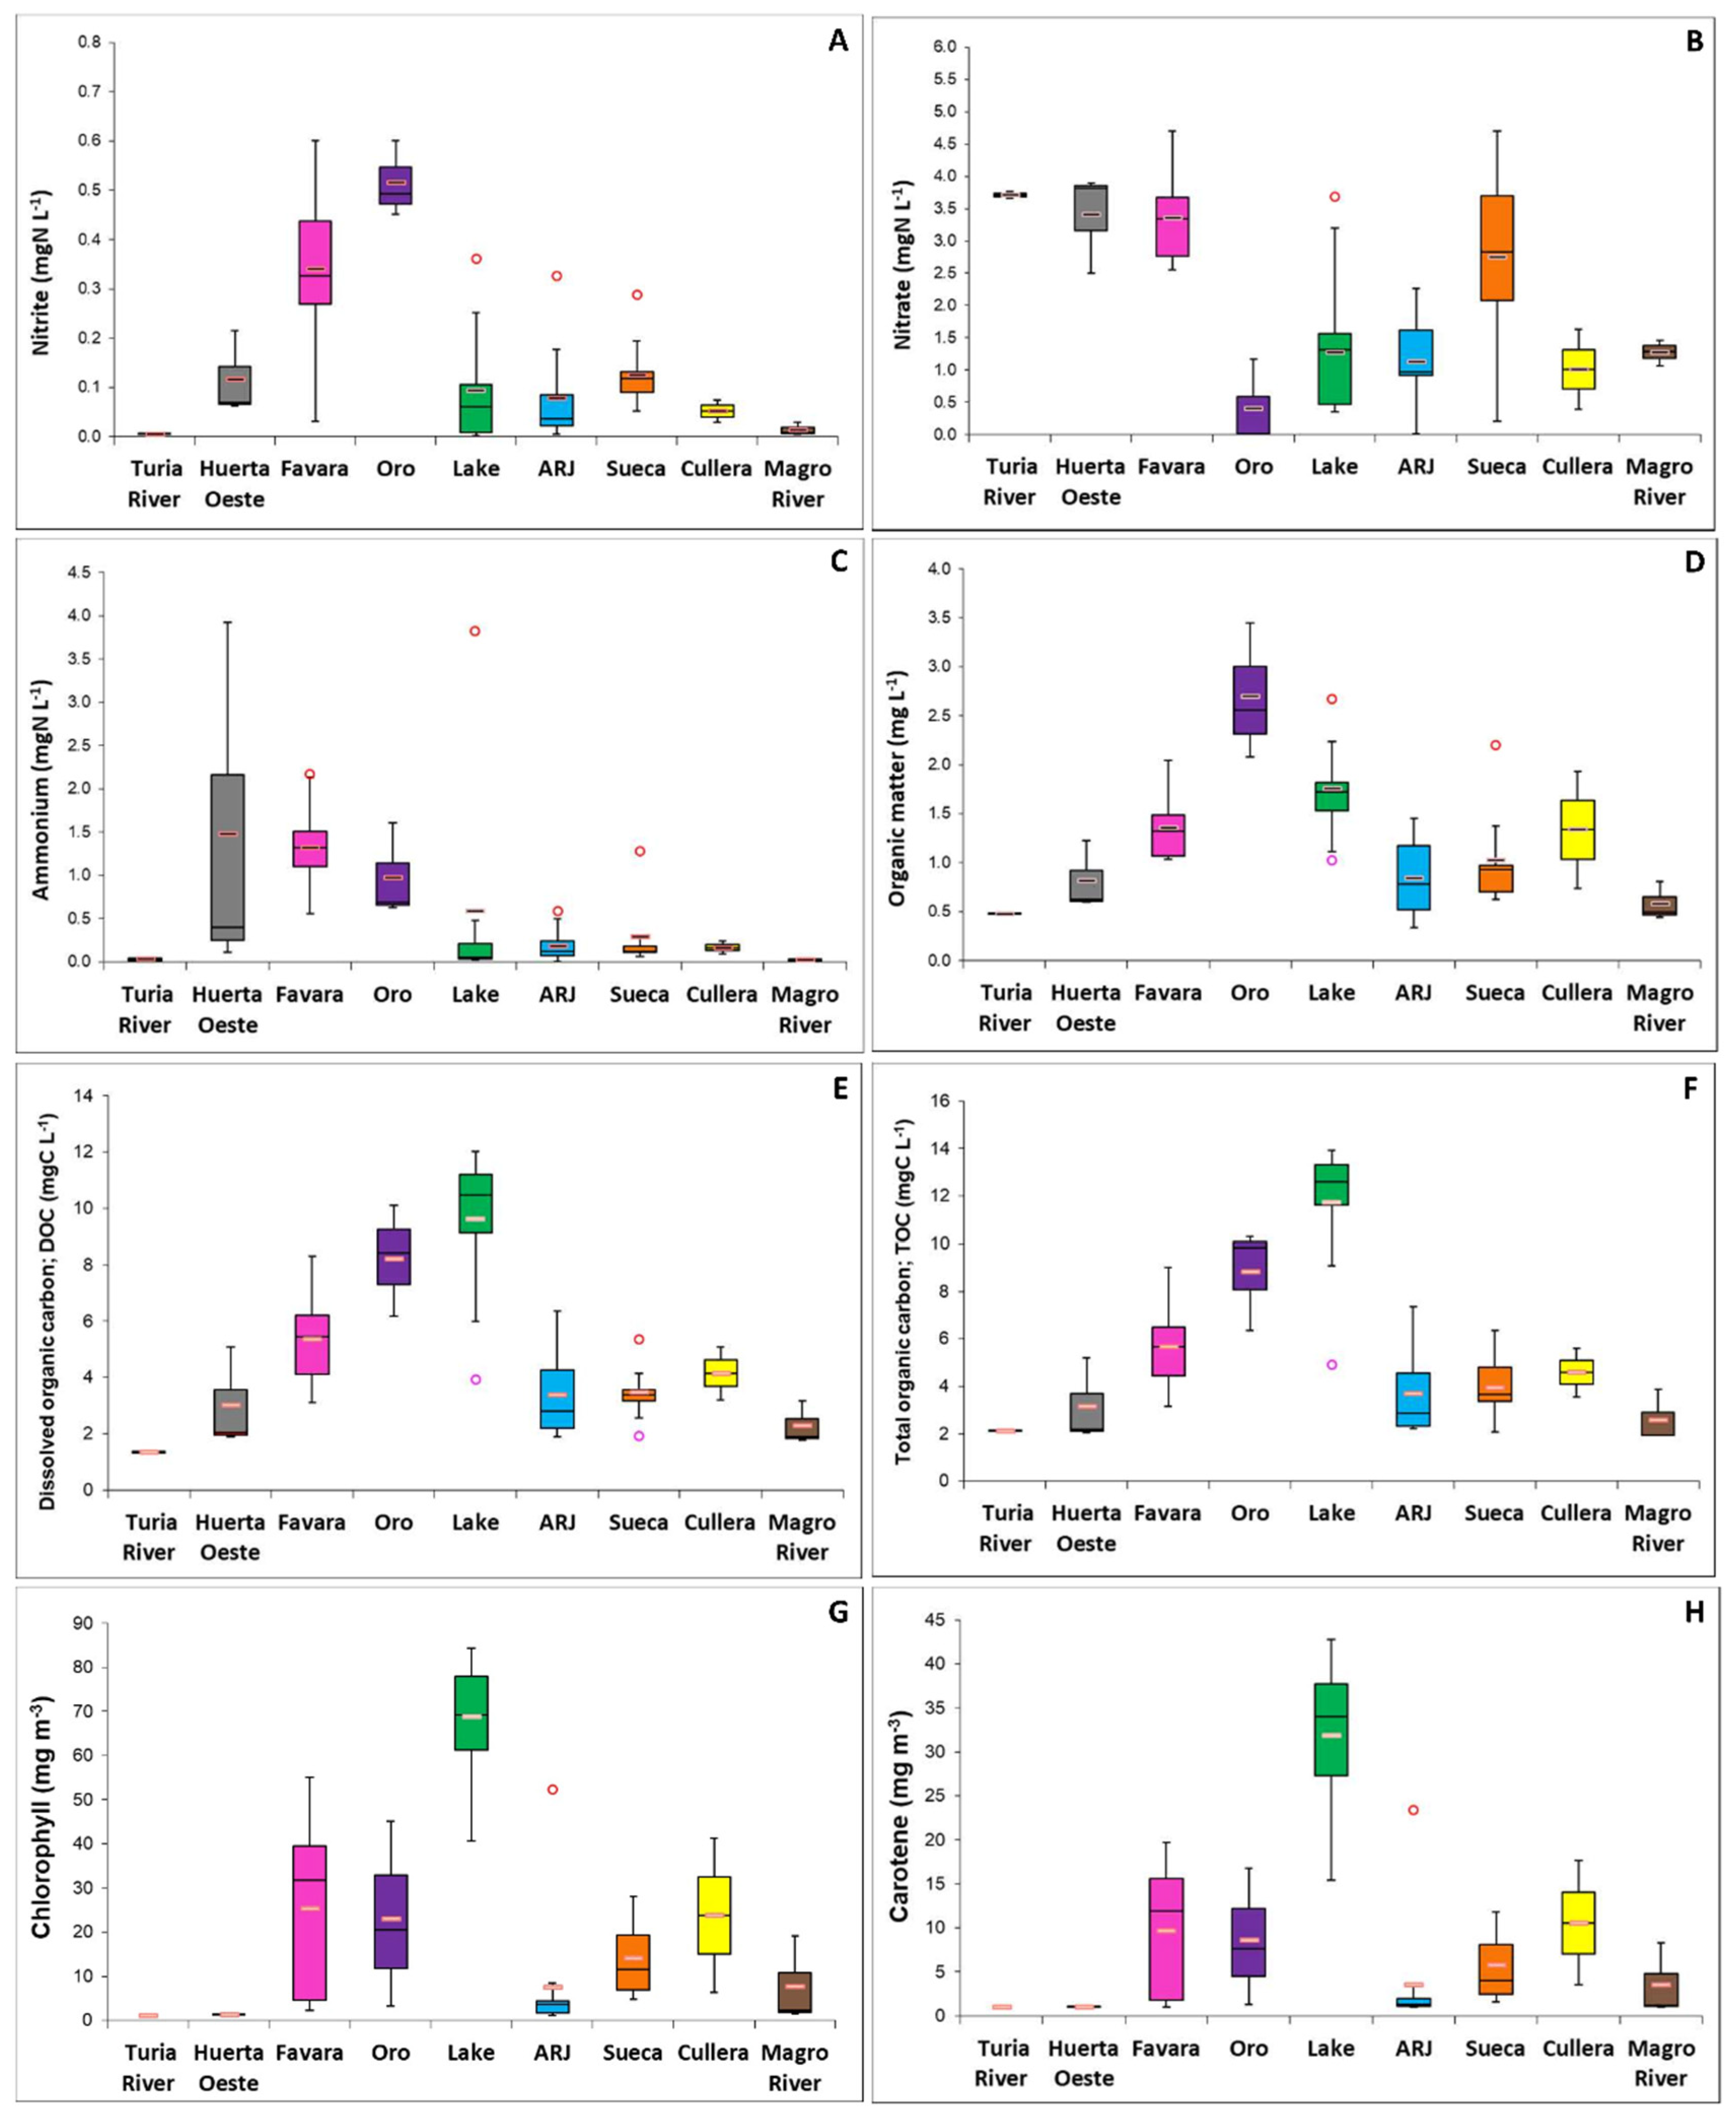
3.1. Effects of Rice Cultivation on Water Quality
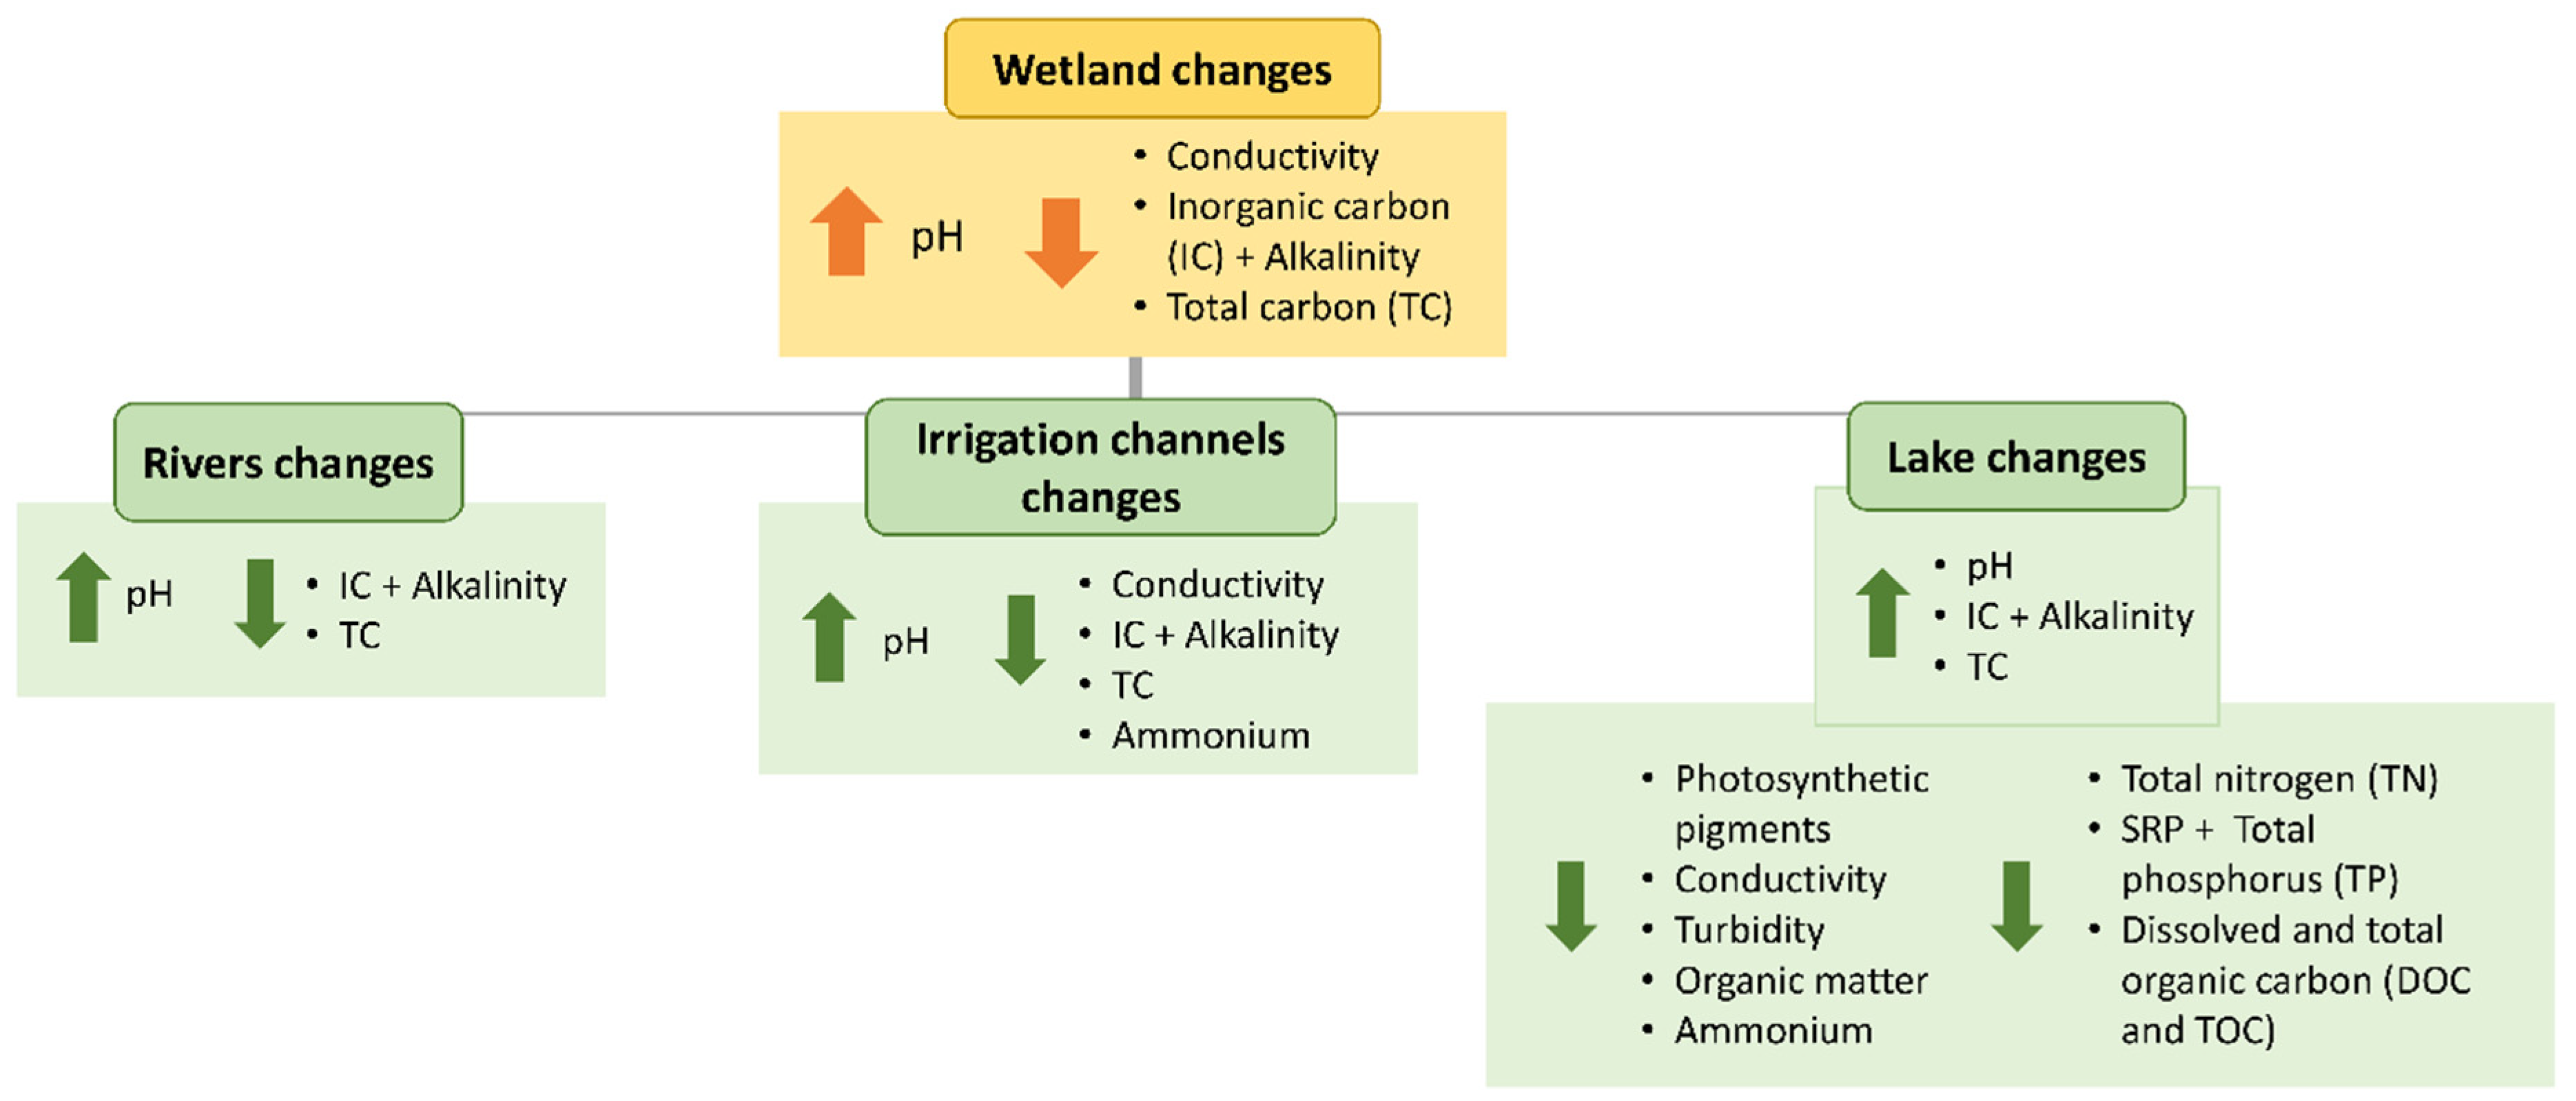
3.2. Global Wetland Approach
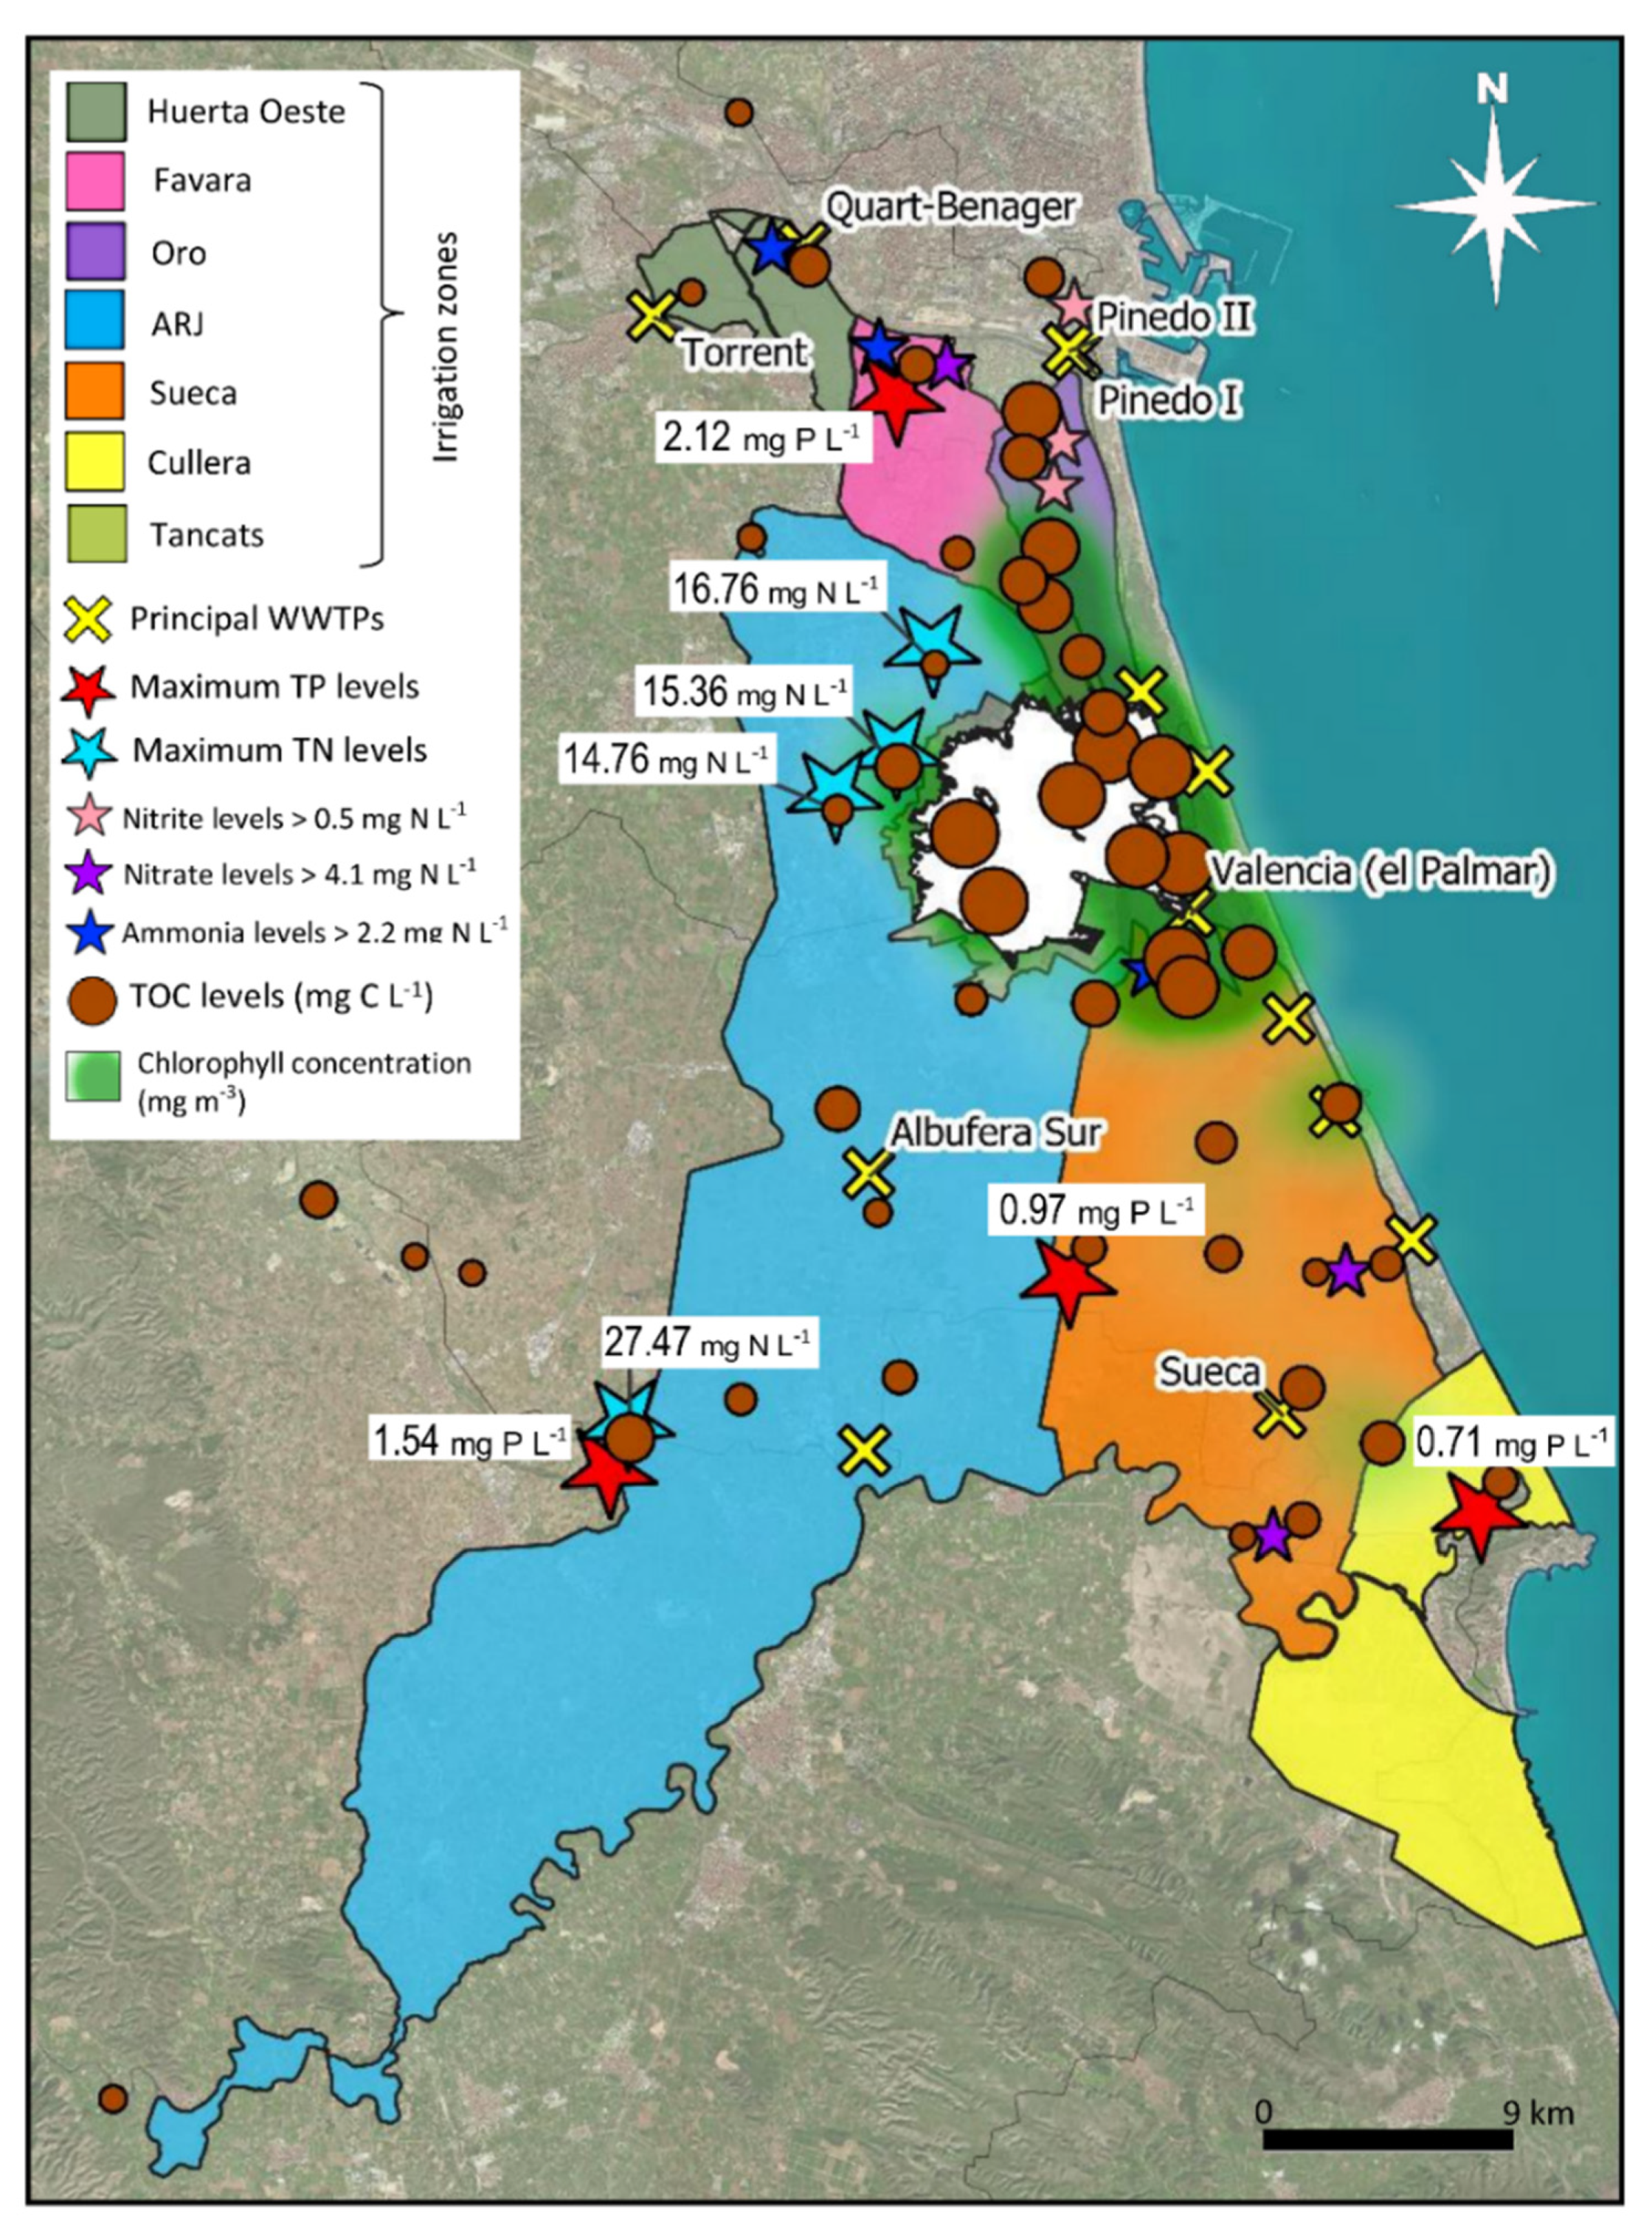
3.3. Spatial Mapping of the Variables
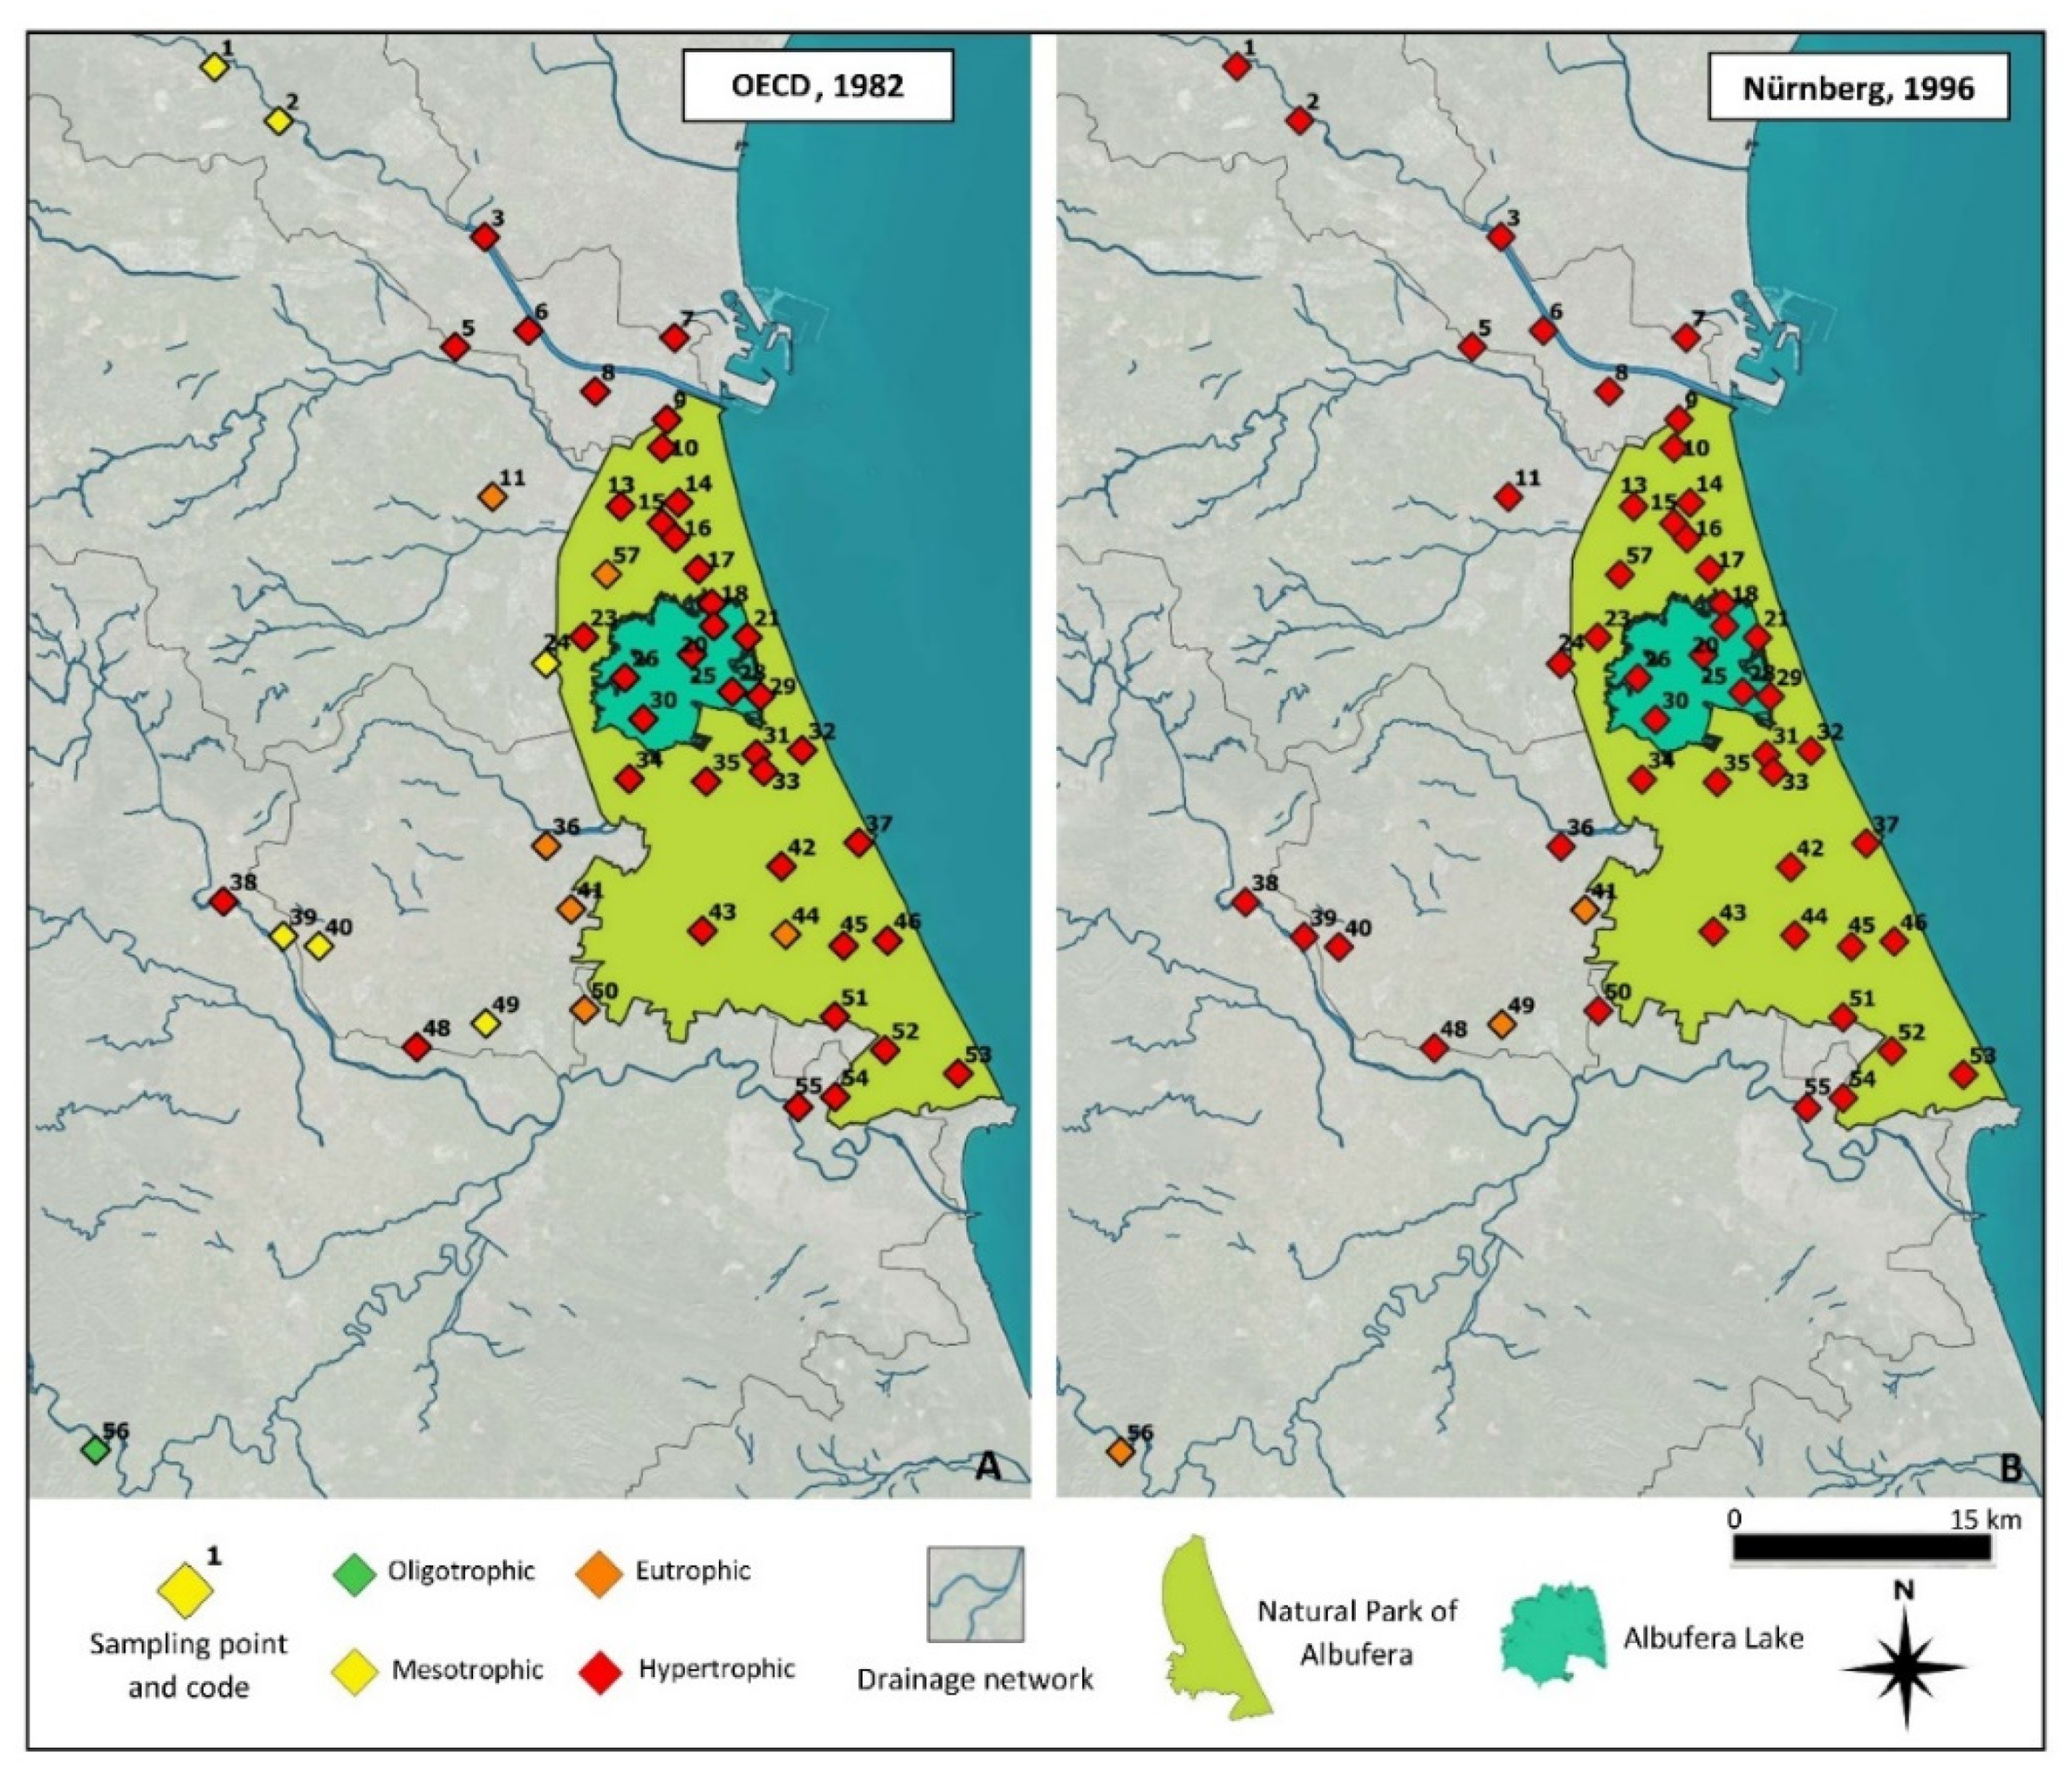
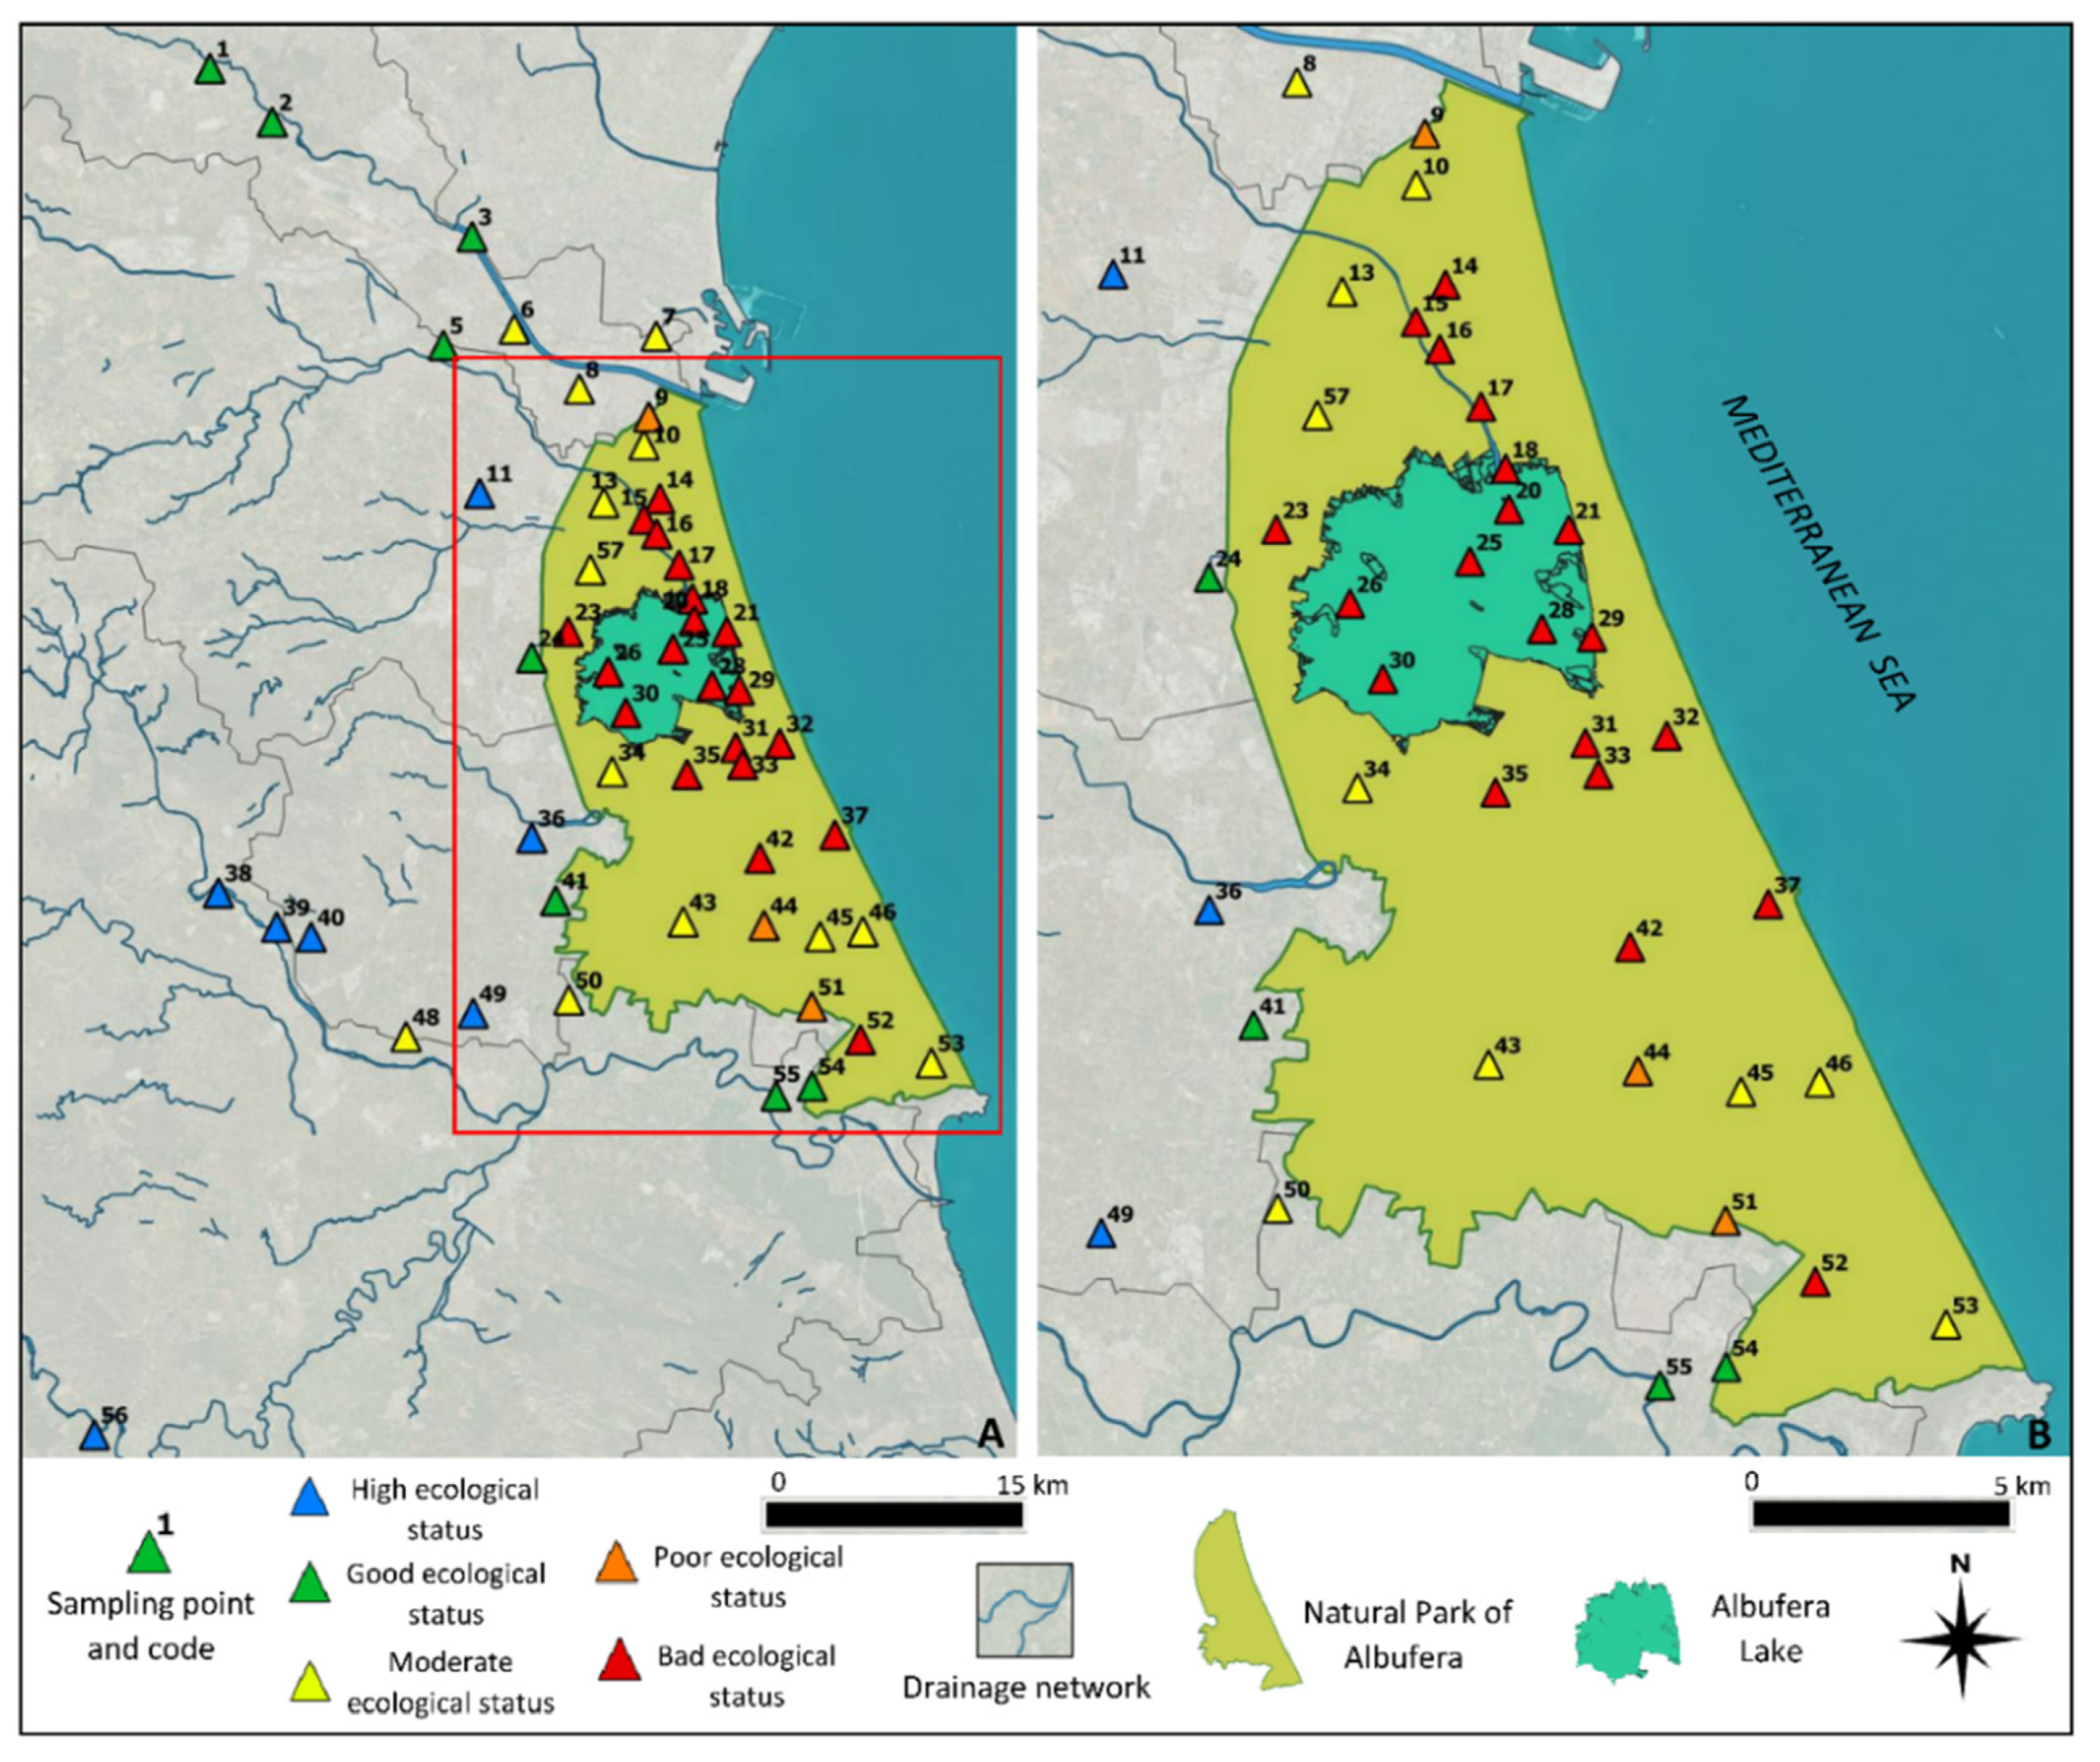
3.4. Trophic State and Ecological Potential of the Wetland
4. Discussion
5. Conclusions
Supplementary Materials
Author Contributions
Funding
Institutional Review Board Statement
Informed Consent Statement
Data Availability Statement
Acknowledgments
Conflicts of Interest
References
- Chiaia-Hernández, A.C.; Günthardt, B.F.; Frey, M.P.; Hollender, J. Unravelling Contaminants in the Anthropocene Using Statistical Analysis of Liquid Chromatography–High-Resolution Mass Spectrometry Nontarget Screening Data Recorded in Lake Sediments. Environ. Sci. Technol. 2017, 51, 12547–12556. [Google Scholar] [CrossRef] [PubMed]
- Yuan, X.; Zhang, M.; Wang, L.; Zhou, T. Understanding and Seasonal Forecasting of Hydrological Drought in the Anthropocene. Hydrol. Earth Syst. Sci. 2017, 21, 5477–5492. [Google Scholar] [CrossRef] [Green Version]
- Mitsch, W.J.; Gosselink, J.G. Wetlands, 4th ed.; John Wiley & Sons: Hoboken, NJ, USA, 2007. [Google Scholar]
- Moss, B. Fresh Waters, Climate Change and UK Nature Conservation. Freshw. Rev. 2014, 7, 25–75. [Google Scholar] [CrossRef]
- Raymond, P.A.; Hartmann, J.; Lauerwald, R.; Sobek, S.; McDonald, C.; Hoover, M.; Butman, D.; Striegl, R.; Mayorga, E.; Humborg, C. Global Carbon Dioxide Emissions from Inland Waters. Nature 2013, 503, 355–359. [Google Scholar] [CrossRef] [Green Version]
- Romo, S.; Soria, J.; Olmo, C.; Flor, J.; Calvo, S.; Ortells, R.; Armengol, X. Nutrients and Carbon in Some Mediterranean Dune Ponds. Hydrobiologia 2016, 782, 97–109. [Google Scholar] [CrossRef]
- Shaltout, K.; El-Bana, M.; Galal, T. Coastal Lakes as Hot Spots for Plant Diversity in Egypt. In Egyptian Coastal Lakes and Wetlands: Part II; Negm, A.M., Beck, M.A., Abdel-Fattah, S., Eds.; Springer: Berlin/Heidelberg, Germany, 2017; pp. 129–146. [Google Scholar]
- Were, D.; Kansiime, F.; Fetahi, T.; Cooper, A.; Jjuuko, C. Carbon Sequestration by Wetlands: A Critical Review of Enhancement Measures for Climate Change Mitigation. Earth Syst. Environ. 2019, 3, 327–340. [Google Scholar] [CrossRef]
- Gardner, R.C.; Finlayson, C.M. Global Wetland Outlook: State of the World’s Wetlands and Their Services to People 2018; Secretariat of the Ramsar Convention: Gland, Switzerland, 2018. [Google Scholar]
- Pascual-Aguilar, J.A.; Andreu Pérez, V.; Gimeno-García, E.; Picó, Y. Current Anthropogenic Pressures on Agro-Ecological Protected Coastal Wetlands. Sci. Total Environ. 2015, 503, 190–199. [Google Scholar] [CrossRef]
- Leberger, R.; Geijzendorffer, I.R.; Gaget, E.; Gwelmami, A.; Galewski, T.; Pereira, H.M.; Guerra, C.A. Mediterranean Wetland Conservation in the Context of Climate and Land Cover Change. Reg. Environ. Chang. 2020, 20, 67. [Google Scholar] [CrossRef]
- Myers, N.; Mittermeier, R.A.; Mittermeier, C.G.; da Fonseca, G.A.B.; Kent, J. Biodiversity Hotspots for Conservation Priorities. Nature 2000, 403, 853–858. [Google Scholar] [CrossRef]
- Cuttelod, A.; García, N.; Malak, D.A.; Temple, H.J.; Stuart, S.N. The Mediterranean: A Biodiversity Hotspot under Threat. In Wildlife in a Changing World: An Analysis of the 2008 IUCN Red List of Threatened Species; Vié, J.C., Hilton-Taylor, C., Stuart, S.N., Eds.; IUCN: Gland, Switzerland, 2009. [Google Scholar]
- Li, Y.; Zhu, X.; Sun, X.; Wang, F. Landscape Effects of Environmental Impact on Bay-Area Wetlands under Rapid Urban Expansion and Development Policy: A Case Study of Lianyungang, China. Landsc. Urban Plan. 2010, 94, 218–227. [Google Scholar] [CrossRef]
- García-Ruiz, J.M.; López-Moreno, J.I.; Vicente-Serrano, S.M.; Lasanta–Martínez, T.; Beguería, S. Mediterranean Water Resources in a Global Change Scenario. Earth-Sci. Rev. 2011, 105, 121–139. [Google Scholar] [CrossRef] [Green Version]
- Guiot, J.; Cramer, W. Climate Change: The 2015 Paris Agreement Thresholds and Mediterranean Basin Ecosystems. Science 2016, 354, 465–468. [Google Scholar] [CrossRef] [PubMed]
- Klausmeyer, K.R.; Shaw, M.R. Climate Change, Habitat Loss, Protected Areas and the Climate Adaptation Potential of Species in Mediterranean Ecosystems Worldwide. PLoS ONE 2009, 4, e6392. [Google Scholar] [CrossRef] [Green Version]
- Mariotti, A.; Zeng, N.; Yoon, J.-H.; Artale, V.; Navarra, A.; Alpert, P.; Li, L.Z. Mediterranean Water Cycle Changes: Transition to Drier 21st Century Conditions in Observations and CMIP3 Simulations. Environ. Res. Lett. 2008, 3, 044001. [Google Scholar] [CrossRef]
- Geijzendorffer, I.; Chazée, L.; Gaget, E.; Galewski, T.; Guelmami, A.; Perennou, C.; Davidson, N.; McInnes, R. Mediterranean Wetlands Outlook 2: Solutions for Sustainable Mediterranean Wetlands; Secretariat of the Ramsar Convention: Arles, France, 2018. [Google Scholar]
- Jégou, A.; Sanchis-Ibor, C. The Opaque Lagoon. Water Management and Governance in l’Albufera de València Wetland (Spain). Limnetica 2019, 38, 503–515. [Google Scholar] [CrossRef]
- Pascual-Aguilar, J.A.; Campo, J.; Meneu, S.N.; Gimeno-García, E.; Andreu, V. Analysis of Existing Water Information for the Applicability of Water Quality Indices in the Fluvial-Littoral Area of Turia and Jucar Rivers, Valencia, Spain. Appl. Geogr. 2019, 111, 102062. [Google Scholar] [CrossRef]
- EEC. Council Directive 91/676/EEC, of 12 December 1991, concerning the protection of waters against pollution caused by nitrates from agricultural sources. Off. J. Eur. Comm. 1991, L375, 1–8. Available online: https://eur-lex.europa.eu/legal-content/EN/TXT/?uri=OJ:L:1991:375:TOC (accessed on 10 May 2021).
- EEC. Council Directive 91/271/EEC, of 21 May 1991, concerning urban wastewater. Off. J. Eur. Comm. 1991, L135, 40–52. Available online: https://eur-lex.europa.eu/legal-content/EN/TXT/?uri=OJ:L:1991:135:TOC (accessed on 10 May 2021).
- EC. Council Directive 2000/60/EC, of 23 October 2000, establishing a framework for Community action in the field of water policy. Off. J. Eur. Comm. 2000, L327, 1–73. Available online: https://eur-lex.europa.eu/legal-content/EN/TXT/?uri=OJ:L:2000:327:TOC (accessed on 9 May 2021).
- Carlson, R.E. A Trophic State Index for Lakes. Limnol. Oceanogr. 1977, 22, 361–369. [Google Scholar] [CrossRef] [Green Version]
- Li, B.; Yang, G.; Wan, R.; Hörmann, G. Dynamic Water Quality Evaluation Based on Fuzzy Matter–Element Model and Functional Data Analysis, a Case Study in Poyang Lake. Environ. Sci. Pollut. Res. 2017, 24, 19138–19148. [Google Scholar] [CrossRef] [PubMed]
- Şener, Ş.; Şener, E.; Davraz, A. Evaluation of Water Quality Using Water Quality Index (WQI) Method and GIS in Aksu River (SW-Turkey). Sci. Total Environ. 2017, 584–585, 131–144. [Google Scholar] [CrossRef]
- Sun, W.; Xia, C.; Xu, M.; Guo, J.; Sun, G. Application of Modified Water Quality Indices as Indicators to Assess the Spatial and Temporal Trends of Water Quality in the Dongjiang River. Ecol. Indic. 2016, 66, 306–312. [Google Scholar] [CrossRef]
- Escribano-Francés, G.; Quevauviller, P.; San Martín González, E.; Vargas Amelin, E. Climate Change Policy and Water Resources in the EU and Spain. A Closer Look into the Water Framework Directive. Environ. Sci. Policy 2017, 69, 1–12. [Google Scholar] [CrossRef]
- Hestir, E.L.; Brando, V.E.; Bresciani, M.; Giardino, C.; Matta, E.; Villa, P.; Dekker, A.G. Measuring Freshwater Aquatic Ecosystems: The Need for a Hyperspectral Global Mapping Satellite Mission. Remote Sens. Environ. 2015, 167, 181–195. [Google Scholar] [CrossRef] [Green Version]
- Dominguez, J.A. Estudio de La Calidad Del Agua de Las Lagunas de Gravera Mediante Teledetección. Doctoral Thesis, Universidad de Alcalá, Alcalá de Henares, Spain, 2003. [Google Scholar]
- Osorio, R.J.; Linhoss, A.; Dash, P. Evaluation of Marsh Terraces for Wetland Restoration: A Remote Sensing Approach. Water 2020, 12, 336. [Google Scholar] [CrossRef] [Green Version]
- Sòria-Perpinyà, X.; Vicente, E.; Urrego, P.; Pereira-Sandoval, M.; Tenjo, C.; Ruíz-Verdú, A.; Delegido, J.; Soria, J.M.; Peña, R.; Moreno, J. Validation of Water Quality Monitoring Algorithms for Sentinel-2 and Sentinel-3 in Mediterranean Inland Waters with In Situ Reflectance Data. Water 2021, 13, 686. [Google Scholar] [CrossRef]
- Vera-Herrera, L.; Soria, J.; Pérez, J.; Romo, S. Long-Term Hydrological Regime Monitoring of a Mediterranean Agro-Ecological Wetland Using Landsat Imagery: Correlation with the Water Renewal Rate of a Shallow Lake. Hydrology 2021, 8, 172. [Google Scholar] [CrossRef]
- Foltête, J.-C.; Vuidel, G. Using Landscape Graphs to Delineate Ecologically Functional Areas. Landsc. Ecol. 2017, 32, 249–263. [Google Scholar] [CrossRef]
- Wang, X.; Zhang, J.; Babovic, V.; Gin, K.Y.H. A Comprehensive Integrated Catchment-Scale Monitoring and Modelling Approach for Facilitating Management of Water Quality. Environ. Model. Softw. 2019, 120, 104489. [Google Scholar] [CrossRef]
- Roche, K.R.; Aubeneau, A.F.; Xie, M.; Aquino, T.; Bolster, D.; Packman, A.I. An Integrated Experimental and Modeling Approach to Predict Sediment Mixing from Benthic Burrowing Behavior. Environ. Sci. Technol. 2016, 50, 10047–10054. [Google Scholar] [CrossRef] [PubMed]
- Çevirgen, S.; Elwany, H.; Pesce, M.; Zirino, A. Managing Nutrient Pollution in Venice Lagoon (Italy): A Practical Tool for Assessment of Water Quality. Sustain. Water Resour. Manag. 2020, 6, 33. [Google Scholar] [CrossRef]
- Elshemy, M.; Zeidan, B.; Assar, W. Water Quality Mitigation Scenarios for Burullus Coastal Lake, Egypt. In Estuaries and Coastal Zones in Times of Global Change; Nguyen, K.D., Guillou, S., Gourbesville, P., Thiébot, J., Eds.; Springer: Berlin, Germany, 2020; pp. 89–110. [Google Scholar]
- Shalby, A.; Elshemy, M.; Zeidan, B.A. Assessment of Climate Change Impacts on Water Quality Parameters of Lake Burullus, Egypt. Egypt. Environ. Sci. Pollut. Res. 2020, 27, 32157–32178. [Google Scholar] [CrossRef]
- Generalitat Valenciana. Parc Natural de l´Albufera. 2015. Available online: http://www.parquesnaturales.gva.es/es/web/pn-l-albufera (accessed on 10 January 2021).
- Pascual-Aguilar, J.A. Cambios de Usos del Suelo y Régimen Hídrico en la Rambla de Poyo y el Barranc de Carraixet. Doctoral Thesis, Universitat de València, Valencia, Spain, 2004. [Google Scholar]
- Gil Olcina, A.; Rico, A. El Problema Del Agua En La Comunidad Valenciana; Fundación de la Comunidad Valenciana Agua y Progreso: Valencia, Spain, 2007; ISBN 84-611-5317-0. [Google Scholar]
- Pascual-Aguilar, J.A.; Andreu, V.; Vázquez, P.; Picó, Y. Presence and Spatial Distribution of Emerging Contaminants (Drugs of Abuse) in Protected Agroecological Systems (L’Albufera de Valencia Coastal Wetland, Spain). Environ. Earth Sci. 2014, 71, 31–37. [Google Scholar] [CrossRef]
- Martín, M.; Hernández-Crespo, C.; Andrés-Doménech, I.; Benedito-Durá, V. Fifty Years of Eutrophication in the Albufera Lake (Valencia, Spain): Causes, Evolution and Remediation Strategies. Ecol. Eng. 2020, 155, 105932. [Google Scholar] [CrossRef]
- Aznar, R.; Sánchez-Brunete, C.; Albero, B.; Moreno-Ramón, H.; Tadeo, J.L. Pyrethroids Levels in Paddy Field Water under Mediterranean Conditions: Measurements and Distribution Modelling. Paddy Water Environ. 2017, 15, 307–316. [Google Scholar] [CrossRef]
- Campo, J.; Masiá, A.; Picó, Y.; Farré, M.; Barceló, D. Distribution and Fate of Perfluoroalkyl Substances in Mediterranean Spanish Sewage Treatment Plants. Sci. Total Environ. 2014, 472, 912–922. [Google Scholar] [CrossRef]
- Lorenzo, M.; Campo, J.; Morales Suárez-Varela, M.; Picó, Y. Occurrence, Distribution and Behavior of Emerging Persistent Organic Pollutants (POPs) in a Mediterranean Wetland Protected Area. Sci. Total Environ. 2019, 646, 1009–1020. [Google Scholar] [CrossRef]
- Sadutto, D.; Andreu, V.; Ilo, T.; Akkanen, J.; Picó, Y. Pharmaceuticals and Personal Care Products in a Mediterranean Coastal Wetland: Impact of Anthropogenic and Spatial Factors and Environmental Risk Assessment. Environ. Pollut. 2021, 271, 116353. [Google Scholar] [CrossRef]
- Sadutto, D.; Andreu, V.; Ilo, T.; Akkanen, J.; Picó, Y. Dataset of Pharmaceuticals and Personal Care Products in a Mediterranean Coastal Wetland. Data Brief 2021, 36, 106934. [Google Scholar] [CrossRef]
- Romo, S.; Villena, M.-J.; Sahuquillo, M.; Soria, J.M.; Giménez, M.; Alfonso, T.; Vicente, E.; Miracle, M.R. Response of a Shallow Mediterranean Lake to Nutrient Diversion: Does It Follow Similar Patterns as in Northern Shallow Lakes? Freshw. Biol. 2005, 50, 1706–1717. [Google Scholar] [CrossRef]
- Soria, J.; Vicente, E.; Miracle, M. The Influence of Flash Floods on the Limnology of the Albufera of Valencia Lagoon (Spain). SIL Proc. 2000, 27, 2232–2235. [Google Scholar] [CrossRef]
- Soria, J.M.; Vicente, E. Estudio de Los Aportes Hídricos al Parque Natural de La Albufera de Valencia. Limnetica 2002, 21, 105–115. [Google Scholar] [CrossRef]
- Soria, J.; Vera-Herrera, L.; Calvo, S.; Romo, S.; Vicente, E.; Sahuquillo, M.; Sòria-Perpinyà, X. Residence Time Analysis in the Albufera of Valencia, a Mediterranean Coastal Lagoon, Spain. Hydrology 2021, 8, 37. [Google Scholar] [CrossRef]
- Arévalo, C. Introducción al Estudio de Los Cladóceros Del Plankton de La Albufera de Valencia; Anales del Instituto General y Técnico de Valencia, 1; Imprenta Hijos de Francisco Vives Mora: Valencia, Spain, 1916. [Google Scholar]
- Blanco, C. Estudio de La Contaminación de La Albufera de Valencia y de Los Efectos de Dicha Contaminación Sobre La Fauna y Flora Del Lago. Doctoral Thesis, Universitat de València, Valencia, Spain, 1974. [Google Scholar]
- Dafauce Ruiz, C. La Albufera de Valencia: Un Estudio Piloto. In Monografías; Instituto para la Conservación de la Naturaleza (ICONA): Valencia, España, 1975; Volume 4, pp. 1–127. [Google Scholar]
- Pardo, L. La Albufera de Valencia. Biología de Las Aguas Continentales II; Instituto Forestal de Investigaciones y Experiencias: Madrid, Spain, 1942. [Google Scholar]
- Onandia, G.; Gudimov, A.; Miracle, M.R.; Arhonditsis, G. Towards the Development of a Biogeochemical Model for Addressing the Eutrophication Problems in the Shallow Hypertrophic Lagoon of Albufera de Valencia, Spain. Ecol. Inform. 2015, 26, 70–89. [Google Scholar] [CrossRef]
- Segura, J.B.M.; Ibor, C.S.; Vázquez, A.V. Regadío y Saneamiento Urbano En l’Albufera de València: Análisis Cartográfico. Cuad. Geogr. 1999, 65, 61–80. [Google Scholar]
- Romo, S.; Soria, J.; Fernández, F.; Ouahid, Y.; Barón-Solá, Á. Water Residence Time and the Dynamics of Toxic Cyanobacteria. Freshw. Biol. 2013, 58, 513–522. [Google Scholar] [CrossRef]
- Copernicus Land Monitoring Service. CORINE Land Cover 2018. Available online: https://land.copernicus.eu/pan-european/corine-land-cover/clc2018 (accessed on 30 December 2020).
- Mondría, M. Estudio Para El Desarrollo Sostenible de L´Albufera de Valencia. Síntesis de Los Estudios Técnicos; Confederación Hidrográfica Del Júcar: Madrid, Spain, 2004. [Google Scholar]
- APHA. Standard Methods for the Examination of Water and Wastewater; General Books LLC: Memphis, TN, USA, 2011. [Google Scholar]
- UNE-EN 1484:1998; Water Analysis—Guidelines for the Determination of Total Organic Carbon (TOC) and Dissolved Organic Carbon (DOC). European Committee for Standardization: Bruxelles, Belgium, 1997.
- Murphy, J.; Riley, J.P. A Modified Single Solution Method for the Determination of Phosphate in Natural Waters. Anal. Chim. Acta 1962, 27, 31–36. [Google Scholar] [CrossRef]
- Jeffrey, E.; Humphrey, G.F. New Spectrophotometric Equations for Determining Chlorophyll a, b, c1 and c2 in Higher Plants, Algae and Natural Phytoplankton. Biochem. Physiol. 1975, 167, 91–194. [Google Scholar] [CrossRef]
- OECD. Organisation for Economic Co-Operation and Development. 1982. Available online: http://www.oecd.org/ (accessed on 10 March 2021).
- Nürnberg, G.K. Trophic State of Clear and Colored, Soft-and Hardwater Lakes with Special Consideration of Nutrients, Anoxia, Phytoplankton and Fish. Lake Reserv. Manag. 1996, 12, 432–447. [Google Scholar] [CrossRef]
- Decret 817/2015. BOE. Real Decreto 817/2015, de 11 de Septiembre, Por El Que Se Establecen Los Criterios de Seguimiento y Evaluación Del Estado de Las Aguas Superficiales y Las Normas de Calidad Ambiental. Available online: https://www.boe.es/diario_boe/txt.php?id=BOE-A-2015-9806 (accessed on 12 April 2021).
- AVAMET Meteorological Historical Database. Available online: https://www.avamet.org/ (accessed on 10 February 2021).
- Hammer, Ø.; Harper, D.A.; Ryan, P.D. PAST: Paleontological Statistics Software Package for Education and Data Analysis. Palaeontol. Electron. 2001, 4, 9. [Google Scholar]
- Decret 509/1996. BOE. Real Decreto 509/1996, de 15 de Marzo, de Desarrollo Del Real Decreto-Ley 11/1995, de 28 de Diciembre, Por El Que Se Establecen Las Normas Aplicables al Tratamiento de Las Aguas Residuales Urbanas. Available online: https://www.boe.es/diario_boe/txt.php?id=BOE-A-1996-7159 (accessed on 10 April 2021).
- Jeppesen, E.; Søndergaard, M.; Meerhoff, M.; Lauridsen, T.L.; Jensen, J.P. Shallow Lake Restoration by Nutrient Loading Reduction—Some Recent Findings and Challenges Ahead. Hydrobiologia 2007, 584, 239–252. [Google Scholar] [CrossRef]
- Romo, S.; Miracle, M.R.; Villena, M.; Rueda, J.; Ferriol, C.; Vicente, E. Mesocosm Experiments on Nutrient and Fish Effects on Shallow Lake Food Webs in a Mediterranean Climate. Freshw. Biol. 2004, 49, 1593–1607. [Google Scholar] [CrossRef] [Green Version]
- Soria, J.; Romo, S.; Vera-Herrera, L.; Calvo, S.; Sòria-Perpinyà, X. Evolución de la conductividad en la Albufera de Valencia entre 1985 y 2018. Limnetica 2021, 40, 223–232. [Google Scholar] [CrossRef]
- Sòria-Perpinyà, X. Remote Sensing Application for the Study of Rapid Flushing to Remediate Eutrophication in Shallow Lagoons (Albufera of Valencia). Hydrobiologia 2019, 829, 125–132. [Google Scholar] [CrossRef]
- Calvo, S.; Romo, S.; Soria, J.; Picó, Y. Pesticide Contamination in Water and Sediment of the Aquatic Systems of The Natural Park of the Albufera of Valencia (Spain) during the Rice Cultivation Period. Sci. Total Environ. 2021, 774, 145009. [Google Scholar] [CrossRef]
- Pérez-Ruzafa, A.; Campillo, S.; Fernández-Palacios, J.M.; García-Lacunza, A.; García-Oliva, M.; Ibañez, H.; Navarro-Martínez, P.C.; Pérez-Marcos, M.; Pérez-Ruzafa, I.M.; Quispe-Becerra, J.I.; et al. Long-Term Dynamic in Nutrients, Chlorophyll a, and Water Quality Parameters in a Coastal Lagoon During a Process of Eutrophication for Decades, a Sudden Break and a Relatively Rapid Recovery. Front. Mar. Sci. 2019, 6, 26. [Google Scholar] [CrossRef] [Green Version]
- Paredes Losada, I. Anthropogenic Pressures and Eutrophication in the Doñana Marsh and Its Watershed. Doctoral Thesis, Universidad de Sevilla, Sevilla, Spain, 2020. [Google Scholar]
- Rizk, R.; Juzsakova, T.; Cretescu, I.; Rawash, M.; Sebestyén, V.; Le Phuoc, C.; Kovács, Z.; Domokos, E.; Rédey, Á.; Shafik, H. Environmental Assessment of Physical-Chemical Features of Lake Nasser, Egypt. Environ. Sci. Pollut. Res. 2020, 27, 20136–20148. [Google Scholar] [CrossRef] [Green Version]
- Sebastiá-Frasquet, M.-T.; Aguilar-Maldonado, J.A.; Santamaría-Del-Ángel, E.; Estornell, J. Sentinel 2 Analysis of Turbidity Patterns in a Coastal Lagoon. Remote Sens. 2019, 11, 2926. [Google Scholar] [CrossRef] [Green Version]
- Soria, J.; Jover-Cerdá, M.; Gómez, J. Influence of Wind on Suspended Matter in the Water of the Albufera of Valencia (Spain). J. Mar. Sci. Eng. 2021, 9, 343. [Google Scholar] [CrossRef]
- Mondría, M. Infraestructuras y Eutrofización en L’Albufera de València. El Modelo Cabhal. Doctoral Thesis, Universidad Politécnica de Valencia, Valencia, Spain, 2010. [Google Scholar]
- Vazquez-Roig, P.; Andreu, V.; Blasco, C.; Picó, Y. SPE and LC-MS/MS Determination of 14 Illicit Drugs in Surface Waters from the Natural Park of L’Albufera (València, Spain). Anal. Bioanal. Chem. 2010, 397, 2851–2864. [Google Scholar] [CrossRef] [PubMed]
- Rodríguez-Hernández, L.; Esteban-García, A.L.; Lobo, A.; Temprano, J.; Álvaro, C.; Mariel, A.; Tejero, I. Evaluation of a Hybrid Vertical Membrane Bioreactor (HVMBR) for Wastewater Treat-ment. Water Sci. Technol. 2012, 65, 1109–1115. [Google Scholar] [CrossRef] [PubMed]
- Vasistha, S.; Khanra, A.; Rai, M.P. Influence of Microalgae-ZnO Nanoparticle Association on Sewage Wastewater towards Efficient Nutrient Removal and Improved Biodiesel Application: An Integrated Approach. J. Water Process. Eng. 2021, 39, 101711. [Google Scholar] [CrossRef]
- Nguyen, N.C.; Nguyen, H.T.; Duong, H.C.; Chen, S.-S.; Le, H.Q.; Duong, C.C.; Trang, L.T.; Chen, C.-K.; Nguyen, P.D.; Bui, X.T.; et al. A Breakthrough Dynamic-Osmotic Membrane Bioreactor/Nanofiltration Hybrid System for Real Municipal Wastewater Treatment and Reuse. Bioresour. Technol. 2021, 342, 125930. [Google Scholar] [CrossRef]
- Cerralbo, P.; F-Pedrera Balsells, M.; Mestres, M.; Fernandez, M.; Espino, M.; Grifoll, M.; Sanchez-Arcilla, A. Use of a Hydrodynamic Model for the Management of Water Renovation in a Coastal System. Ocean Sci. 2019, 15, 215–226. [Google Scholar] [CrossRef] [Green Version]
- Mañosa, S.; Mateo, R.; Guitart, R. A Review of the Effects of Agricultural and Industrial Contamination on the Ebro Delta Biota and Wildlife. Environ. Monit. Assess. 2001, 71, 187–205. [Google Scholar] [CrossRef]
- Camacho-Muñoz, D.; Martín, J.; Santos, J.; Aparicio, I.; Alonso, E. Distribution and Risk Assessment of Pharmaceutical Compounds in River Sediments from Doñana Park (Spain). Water Air Soil Pollut. 2013, 224, 1665. [Google Scholar] [CrossRef]
- Álvarez-Rogel, J.; Jiménez-Cárceles, F.; Nicolás, C.E. Phosphorus and Nitrogen Content in the Water of a Coastal Wetland in the Mar Menor Lagoon (SE Spain): Relationships with Effluents from Urban and Agricultural Areas. Water Air Soil Pollut. 2006, 173, 21–38. [Google Scholar] [CrossRef]
- Day, J.W.; Ibáñez, C.; Pont, D.; Scarton, F. Status and Sustainability of Mediterranean Deltas: The Case of the Ebro, Rhône, and Po Deltas and Venice Lagoon. In Coasts and Estuaries; Wolanski, E., Day, J.W., Elliot, M., Ramachandran, R., Eds.; Elsevier: Amsterdam, The Netherlands, 2019; pp. 237–249. [Google Scholar]
- Tórz, A.; Bonisławska, M.; Rybczyk, A.; Nędzarek, A.; Tański, A. Susceptibility to Degradation, the Causes of Degradation, and Trophic State of Three Lakes in North-West Poland. Water 2020, 12, 1635. [Google Scholar] [CrossRef]

| Variable | Mean | SE | Maximum | Minimum | (A) | (B) | (C) |
|---|---|---|---|---|---|---|---|
| p-Value | p-Value | p-Value | |||||
| Turbidity (NTU) | 11.57 | 1.46 | 50.80 | 0.60 | ns | ** | ns |
| pH | 7.86 | 0.04 | 8.80 | 7.30 | ns | * | ns |
| Conductivity (μS cm−1) | 1550.3 | 86.7 | 5136.0 | 663.0 | ** | * | ** |
| Organic matter (mg L−1) | 1.240 | 0.095 | 3.449 | 0.340 | ** | ** | ** |
| Ammonium nitrogen (mgN L−1) | 0.551 | 0.123 | 3.920 | 0.005 | ** | ** | ** |
| Nitrite nitrogen (mgN L−1) | 0.141 | 0.021 | 0.600 | 0.001 | ** | ** | ** |
| Nitrate nitrogen (mgN L−1) | 1.947 | 0.188 | 4.705 | 0.013 | ns | * | ** |
| Dissolved inorganic nitrogen (DIN; mgN L−1) | 2.639 | 0.247 | 7.155 | 0.358 | * | ** | ** |
| Dissolved organic nitrogen (DON; mgN L−1) | 2.972 | 0.675 | 26.075 | 0.021 | ns | * | ns |
| Dissolved nitrogen (DN; mgN L−1) | 5.61 | 0.67 | 26.51 | 0.70 | ** | ns | ns |
| Total nitrogen (TN; mgN L−1) | 6.30 | 0.67 | 27.47 | 1.07 | ns | * | ns |
| Soluble reactive phosphorus (SRP; mgP L−1) | 0.073 | 0.029 | 1.451 | 0.001 | ** | ns | ** |
| Particulate phosphorus (Ppart; mgP L−1) | 0.153 | 0.043 | 2.018 | 0.004 | ns | ** | ** |
| Total phosphorus (TP; mgP L−1) | 0.226 | 0.052 | 2.121 | 0.009 | * | ** | ** |
| Chorophyll-a (Chl-a; mg m−3) | 25.3 | 3.9 | 84.3 | 1.0 | ** | ** | ** |
| Carotene (mg m−3) | 11.2 | 1.8 | 42.7 | 1.0 | ** | ** | ** |
| Inorganic carbon (TIC; mgC L−1) | 29.90 | 1.43 | 53.05 | 12.84 | * | ns | ** |
| Dissolved organic carbon (DOC; mgC L−1) | 5.16 | 0.45 | 12.02 | 1.32 | ** | ** | ** |
| Total organic carbon (TOC; mgC L−1) | 5.91 | 0.54 | 13.94 | 1.94 | ** | ** | ** |
| Total carbon (TC; mgC L−1) | 35.82 | 1.48 | 59.76 | 22.33 | ns | * | ** |
| Alkalinity (meq L−1) | 2.49 | 0.12 | 4.42 | 1.07 | * | ns | ** |
| TN and TP Concentrations in the Rivers Sampled | ||
|---|---|---|
| Mean TN (mg N L−1) | Mean TP (mg P L−1) | |
| Turia River-Masía Traver | 5.66 | 0.01 |
| Turia River-La Presa | 5.44 | 0.02 |
| Magro River | 2.80 | 0.11 |
| Júcar River | 1.08 | 0.01 |
| % Ecosystems According to Nutrients Levels * | |||||
|---|---|---|---|---|---|
| Total Nitrogen (TN) | |||||
| Habitats | n Total | >10 mgN L−1 [73] | >2 mgN L−1 [74] | >0.65 mgN L−1 [69] | |
| Global | 51 | 16% | 90% | 100% | |
| River | 4 | 0% | 75% | 100% | |
| Irrigation channel | 39 | 21% | 90% | 100% | |
| Lake | 8 | 0% | 100% | 100% | |
| Total Phosphorus (TP) | |||||
| Habitats | n Total | >1 mgP L−1 [73] | >0.1mgP L−1 [63] | >0.05 mgP L−1 [75] | >0.035 mgP L−1 [68] |
| Global | 51 | 4% | 61% | 82% | 86% |
| River | 4 | 0% | 25% | 25% | 75% |
| Irrigation channel | 39 | 5% | 69% | 85% | 90% |
| Lake | 8 | 0% | 38% | 100% | 100% |
Publisher’s Note: MDPI stays neutral with regard to jurisdictional claims in published maps and institutional affiliations. |
© 2022 by the authors. Licensee MDPI, Basel, Switzerland. This article is an open access article distributed under the terms and conditions of the Creative Commons Attribution (CC BY) license (https://creativecommons.org/licenses/by/4.0/).
Share and Cite
Vera-Herrera, L.; Romo, S.; Soria, J. How Agriculture, Connectivity and Water Management Can Affect Water Quality of a Mediterranean Coastal Wetland. Agronomy 2022, 12, 486. https://doi.org/10.3390/agronomy12020486
Vera-Herrera L, Romo S, Soria J. How Agriculture, Connectivity and Water Management Can Affect Water Quality of a Mediterranean Coastal Wetland. Agronomy. 2022; 12(2):486. https://doi.org/10.3390/agronomy12020486
Chicago/Turabian StyleVera-Herrera, Lucía, Susana Romo, and Juan Soria. 2022. "How Agriculture, Connectivity and Water Management Can Affect Water Quality of a Mediterranean Coastal Wetland" Agronomy 12, no. 2: 486. https://doi.org/10.3390/agronomy12020486
APA StyleVera-Herrera, L., Romo, S., & Soria, J. (2022). How Agriculture, Connectivity and Water Management Can Affect Water Quality of a Mediterranean Coastal Wetland. Agronomy, 12(2), 486. https://doi.org/10.3390/agronomy12020486