Abstract
The aim of the study was to evaluate the effect of planting density and row spacing in pea on the plant growth, yield, structural seed yield components, and some plant indices in the central-and-northern part of Poland. Field experiments were performed in 2016–2019. The study involved a Polish pea cultivar, Batuta (semi-leafless). Three planting densities were applied (70, 90, and 110 seeds per 1 m2), with two row spacings (16 and 32 cm), in four replications on 20 m2 plots There was considerable pea sensitivity to precipitation deficit; in higher precipitation years, the seed yield was almost half higher than in the dry years. There was no recorded effect of planting density or the row spacing (except in 2019) on pea yield, and their variation in successive research years was nonsignificant. Similar conclusions also applied to the protein yield; however, its significantly highest value was recorded in the hottest vegetation period with the lowest total precipitation. The deteriorating precipitation conditions across the years were accompanied by a lower number of pods per plant, the number of seeds and their weight per pod, and 1000 seed weight. Moreover, those results were not significantly correlated with the factors under study except for the planting density in HI.
1. Introduction
Legumes should be used as a source of N, as unrenewable sources of energy are being exhausted [1]. They play a key role as a source of protein; however, the yields undergo greater fluctuations than in other crops, the reasons for which are not yet sufficiently known, and this can have a negative impact on the way they are perceived [2]. Pea is grown in Europe for both human consumption and animal feed [3]. It is one of the most important legume species [4,5,6], with a high sensitivity to water stress, especially when the plants increase the share of dry weight in the vegetative organs, including the roots, decrease the allocation of dry weight to pods and seeds, and increase flower shedding [1,7], which limits the number of pods, the number of seeds per pod, and 1000 seed weight considerably [8]. According to Martin et al. [9] and Grabowska and Banaszkiewicz [10], water stress is the key cause of a decrease in pea yield in a temperate climate.
Under Mediterranean conditions [8], the planting density of 40 pea plants per 1 m2 is most appropriate, and a further increase in the sowing density does not lead to a significant increase in the seed yield. In South-East Poland, Gugała and Zarzecka [11] obtained the highest pea yield from a sowing density of 125 pea plants per 1 m2 and the lowest from a density of 75 plants per 1 m2. In Croatia, on the other hand, Krizmanić et al. [5] found that pea sowing at a varied density considerably modified the seed yield, plant height, and the number of pods per plant, and that it affected neither the number of seeds per pod nor the 1000 seed weight.
The planting density in pea modifies the dynamics of mass accumulation in the respective organs, and the decrease in row spacing from 35 to 25 cm in Poland resulted in an increase in the pea biomass yield [12]. The pea plants grown at a wider row spacing were higher, and their leaf area was lower. In Pakistan, Shaukat et al. [13] reported a higher number of branches, pods per plant, and seeds per pod in pea at a wider row spacing, and the row spacing did not have a significant effect on the protein content in seeds.
The aim of the present research has been to evaluate the effect of row spacing and sowing density on pea yield and structural components in Poland.
2. Materials and Methods
2.1. Experimental Design and Conditions
The research oon the effect of the row spacing (first factor) and sowing density (second factor) on Batuta pea (semi-leafless) yielding was performed in Poland in 2016–2019, 53°13′ N and 17°51′ E (north-central Poland), at 89.8 m above sea level. Batuta plants reach up to 95 cm in height, the stems are rigid at flowering (white flowers), and they maintain a good rigidity at harvest. Batuta is a general-purpose cultivar with a high protein content and with plants also resistant to fusarium wilt, powdery mildew, and anthracnose. Pods include numerous large and very large yellow seeds with a high 1000 seed weight. The experiments were located in Haplic Luvisol, the profile of which included horizons Ap, Eet, Bt, and C. The grain size composition of the soil was loamy sand in the surface horizon and sandy loam in horizon C, of very good rye complex. The soil type classified according to the WRB, as Haplic Luvisols (Cutanic), was a typical lessive soil formed with light loamy sand, deposited in a shallow layer on light loam [14]. The content of phosphorus was very high, potassium was high, and magnesium was low. The content of available forms of potassium and phosphorus was assayed with the Egner-Rhiem DL method, and magnesium with the Schachtschabel method. The content of nitrate and ammonium ions was determined with colorimetric tests with the Behelot and Griess-Ilosvay reactions. The soil pH was potentiometrically measured in 1 mol·L−1 KCl. In all the research years, the soil pH was adequate for pea cultivation (Table 1).

Table 1.
Chemical properties of soil prior to pea sowing in 2016–2019.
In the present study, a high and well-distributed total precipitation was recorded in June and July 2016 (98.8 mm and 133.8 mm) and in 2017 (118.9 mm and 126.1 mm) (Table 2), which facilitated a very good growth of pea plants, their development, and yield. However, in the successive research years, soil drought occurred; in 2018, there was a single rainfall of 86 mm in July and 23.7 mm in August, and in 2019, only 22.4 mm and 37.7 mm, respectively. Each year, the peas were planted on 23 March, 28 March, 6 April, and 28 March, while the following harvest occurred at 122, 128, 103, and 111 days after sowing.
Table 2.
Weather conditions at the experiment site.
2.2. Crop Management
The experiment forecrop in all the years was winter barley. Pre-sowing, 60 kg P, and 80 kg K kg·ha−1, as well as 30 kg N·ha−1 were applied. The plots for sowing were 21.24 m2 in size, and the plots for harvest were 20.0 m2, with a row spacing of 16 and 32 cm, and a sowing rate of 70, 90, and 110 of germinating seeds per m2. The seeds were sown at the depth of 3–5 cm. Right before sowing, the sowing material was inoculated with Nitragina. Stomp Aqua-pendimetalina (di-nitroanilina_ at 45 g·L−1 (39%) at 2.5–3.5 L·ha−1 was applied after sowing (BBCH 00-01), while Corum 502.4 SL-bentazon (group of diazin) at 480 g·L−1 (43.0%) and immazamoks (a compound from the group of immidazolinones) at 22.4 g·L−1 (2%) were applied after plan emergence. The yield of pea seed was given at 15% of the moisture content.
2.3. Measurements and Observations Made during Pea Growth
Pea plant density after full emergence (BBCH 13) and before harvest (BBCH 89) was calculated to 1 m2 in four replications at each field. At the full flowering stage (BBCH 65), the SunScan Canopy Analysis System (∆T Devices Ltd., Burwell, UK) was used to determine the LAI (Leaf Area Index), while N-tester determined the content of chlorophyll in leaves. Right before harvest, the number of pods per plant, the number of seeds per pod, the weight of seeds per pod, and the 1000 seed weight were evaluated. Moreover, the yield of the dry weight of straw from each plot was assessed to calculate the HI value (Harvest Index), and SPAD was used to measure the crop nitrogen status.
2.4. Data Analysis Methods
The data were collected from a two-factor experiment design in randomized complete blocks with four replications. For the statistical evaluation, the two-way analysis of variance (ANOVA) was used; while the significance of the results was verified with the HSD (honestly significant difference) Tukey’s test at the significance level of α = 0.01 and 0.05. For the purpose of analysis, long-term observations involved repeated ANOVA measures. The Pearson correlation coefficients were used for the dependence between precipitation and seed yield. The data were processed using STATISTICA version 13.3 software (StatSoft, Tulsa, OK, USA). The means in the tables and the charts provided with the same letters did not differ significantly.
3. Results and Discussion
3.1. Pea Seed Yield
Pea production provides several agronomic advantages in the Mediterranean region supporting more sustainable cropping systems and reduced nitrogen fertilizer use [3]. The recent studies by Reckling et al. [15] point to the legume yields being the same as other spring crops in Europe, and the yielding instability, according to the latest research, is only slightly lower than, e.g., in cereal crops and, therefore, their share in the crop structure should keep on growing. According to Karkanis et al. [3], the shorter vegetation season in Europe puts pea in an unfavorable situation in comparison to cereals.
One of the reasons for legume yield instability is varied-across-years precipitation and precipitation distribution. Krizmanić et al. [5] and Martin et al. [9] claimed that water stress was the key reason for decreased pea yield; hence, use of the appropriate variety depends on the agroclimatic conditions of the growing region [6]. For the strongly varied total precipitation across the years of the present research, the mean 4-year Batuta pea seed yield was high (3.98 t·ha−1), mostly due to high and well-distributed precipitation in 2016 and 2017 (Table 3). We confirmed a significant effect of the weather pattern on pea yield; in 2016 and 2017, with high favorably-distributed precipitation, the seed yield was significantly higher (4.80 and 5.58 t·ha−1, respectively), while in the unfavorable conditions, in 2018 and 2019, it was significantly lower (2.47 and 3.08 t·ha−1, respectively). It is also worth noting that the higher pea yields were accompanied by a lower average air temperature during the growing season. However, in our own earlier studies, despite a significant humidity differentiation during the vegetation period in following years, especially during generative development, pea crop did not vary significantly [16]. Interestingly, only in 2019, a significantly higher yield of pea seeds grown in 16 cm than in 32 cm rows was found.
Table 3.
Effect of row spacing and planting density on the pea seed yield (t·ha−1) in 2016–2019.
The flowering rate and beginning of the filling of pea seeds in pods according to Dumoulin et al. [17] do not differ significantly and do not depend significantly on environmental conditions, which was also observed in our own studies. What is interesting here is the effect of the mean monthly temperature and the total precipitation on pea yield. In the years with a lower mean monthly temperature in June and July, the pea seed yield was significantly higher than in the years with a higher temperature (except for 2018–2019 in June). According to Silim et al. [18], drought stress during flowering (BBCH 60–69) in June shows a stronger effect on decreasing the seed yield than in July (BBCH 71–79) at pod filling.
Importantly, in the present research the mean temperature in June and July in the research years was quite even at 18.7 °C (from 17.2 °C in 2017 to 20.2 °C in 2019), whereas the total precipitation decreased linearly from 116 mm in 2016 to only 20 mm in 2019, which decreased the pea yield considerably, similar to that reported by Martin and Jamieson [19]. Grabowska and Banaszkiewicz [10] stated that the air temperature and, more importantly, the sum of rainfall determined, on average, 84.5% of the level of pea yield. Therefore, favorable precipitation conditions affected the pea seed yield more than the other yield components [18,20]. According to Kuznetsov et al. [21] there was a correlation between the length of the growing season and the pea yield, which was also found in the presented research. The many-year total precipitation in May–June and May–July was highly but non-significantly correlated with the pea seed yield, and only in the in the last third of July was there a high significant correlation of the factors under study (Table 4). In the successive parts of the vegetation period, in most cases, we observed a quite high but nonsignificant effect of the total precipitation on pea yield.
Table 4.
Pearson correlation coefficients (r) for the total precipitation in months, the entire pea vegetative period, and seed yield.
In the present research, we did not find a significant effect of the row spacing (with one exception in 2019) or the planting density on pea yield, which was also confirmed by the results reported by some authors [4,22]. Podleśny [12], said that row spacing modifies the dynamics of mass accumulation by respective organs, and a decrease in the width between rows from 35 to 25 cm only results in an increase in the pea biomass yield.
According to Spies et al. [23], the recommended pea sowing density is 59–88 plants per m2, and a further increase in the planting density results only in lower plant branching. Martin et al. [9], on the other hand, reported that a higher planting density increased the pea plant weight yield, and its effect on the seed yield was inconsiderable; this was similar to the present research. Kuczkowski et al. [24] recorded a higher pea yield when increasing the field planting density from 75 to 125 seeds per m2; however, in the dry year, for all the cultivars studied, the sowing rate of 75 seeds per m2 was enough. Moreover, Türk et al. [25] and Krizmanić et al. [5] observed a significant increase in the pea seed yield when increasing the planting density from 75 to 150 plants per m2; however, they did not find a permanent relationship between the pea seed yield and the planting density, similar to Salter and Williams [22].
3.2. Pea Protein Yield
The mean pea protein yield was 892 kg·ha−1; only in 2019, it was significantly higher when pea was grown in narrow rows; however, the planting density did not differentiate that feature significantly (Table 5). In 2017, the protein yield was significantly higher than in 2016, and it was significantly higher in 2019 than in 2018. With that in mind, one must note that temperature, the total precipitation, and precipitation distribution were the key factors lowering not only the pea seed yield but also the protein yield, similar to other Fabaceae (2, 15, 20, 21).
Table 5.
Effect of row spacing and planting density on the protein yield (kg·ha−1) in 2016–2019.
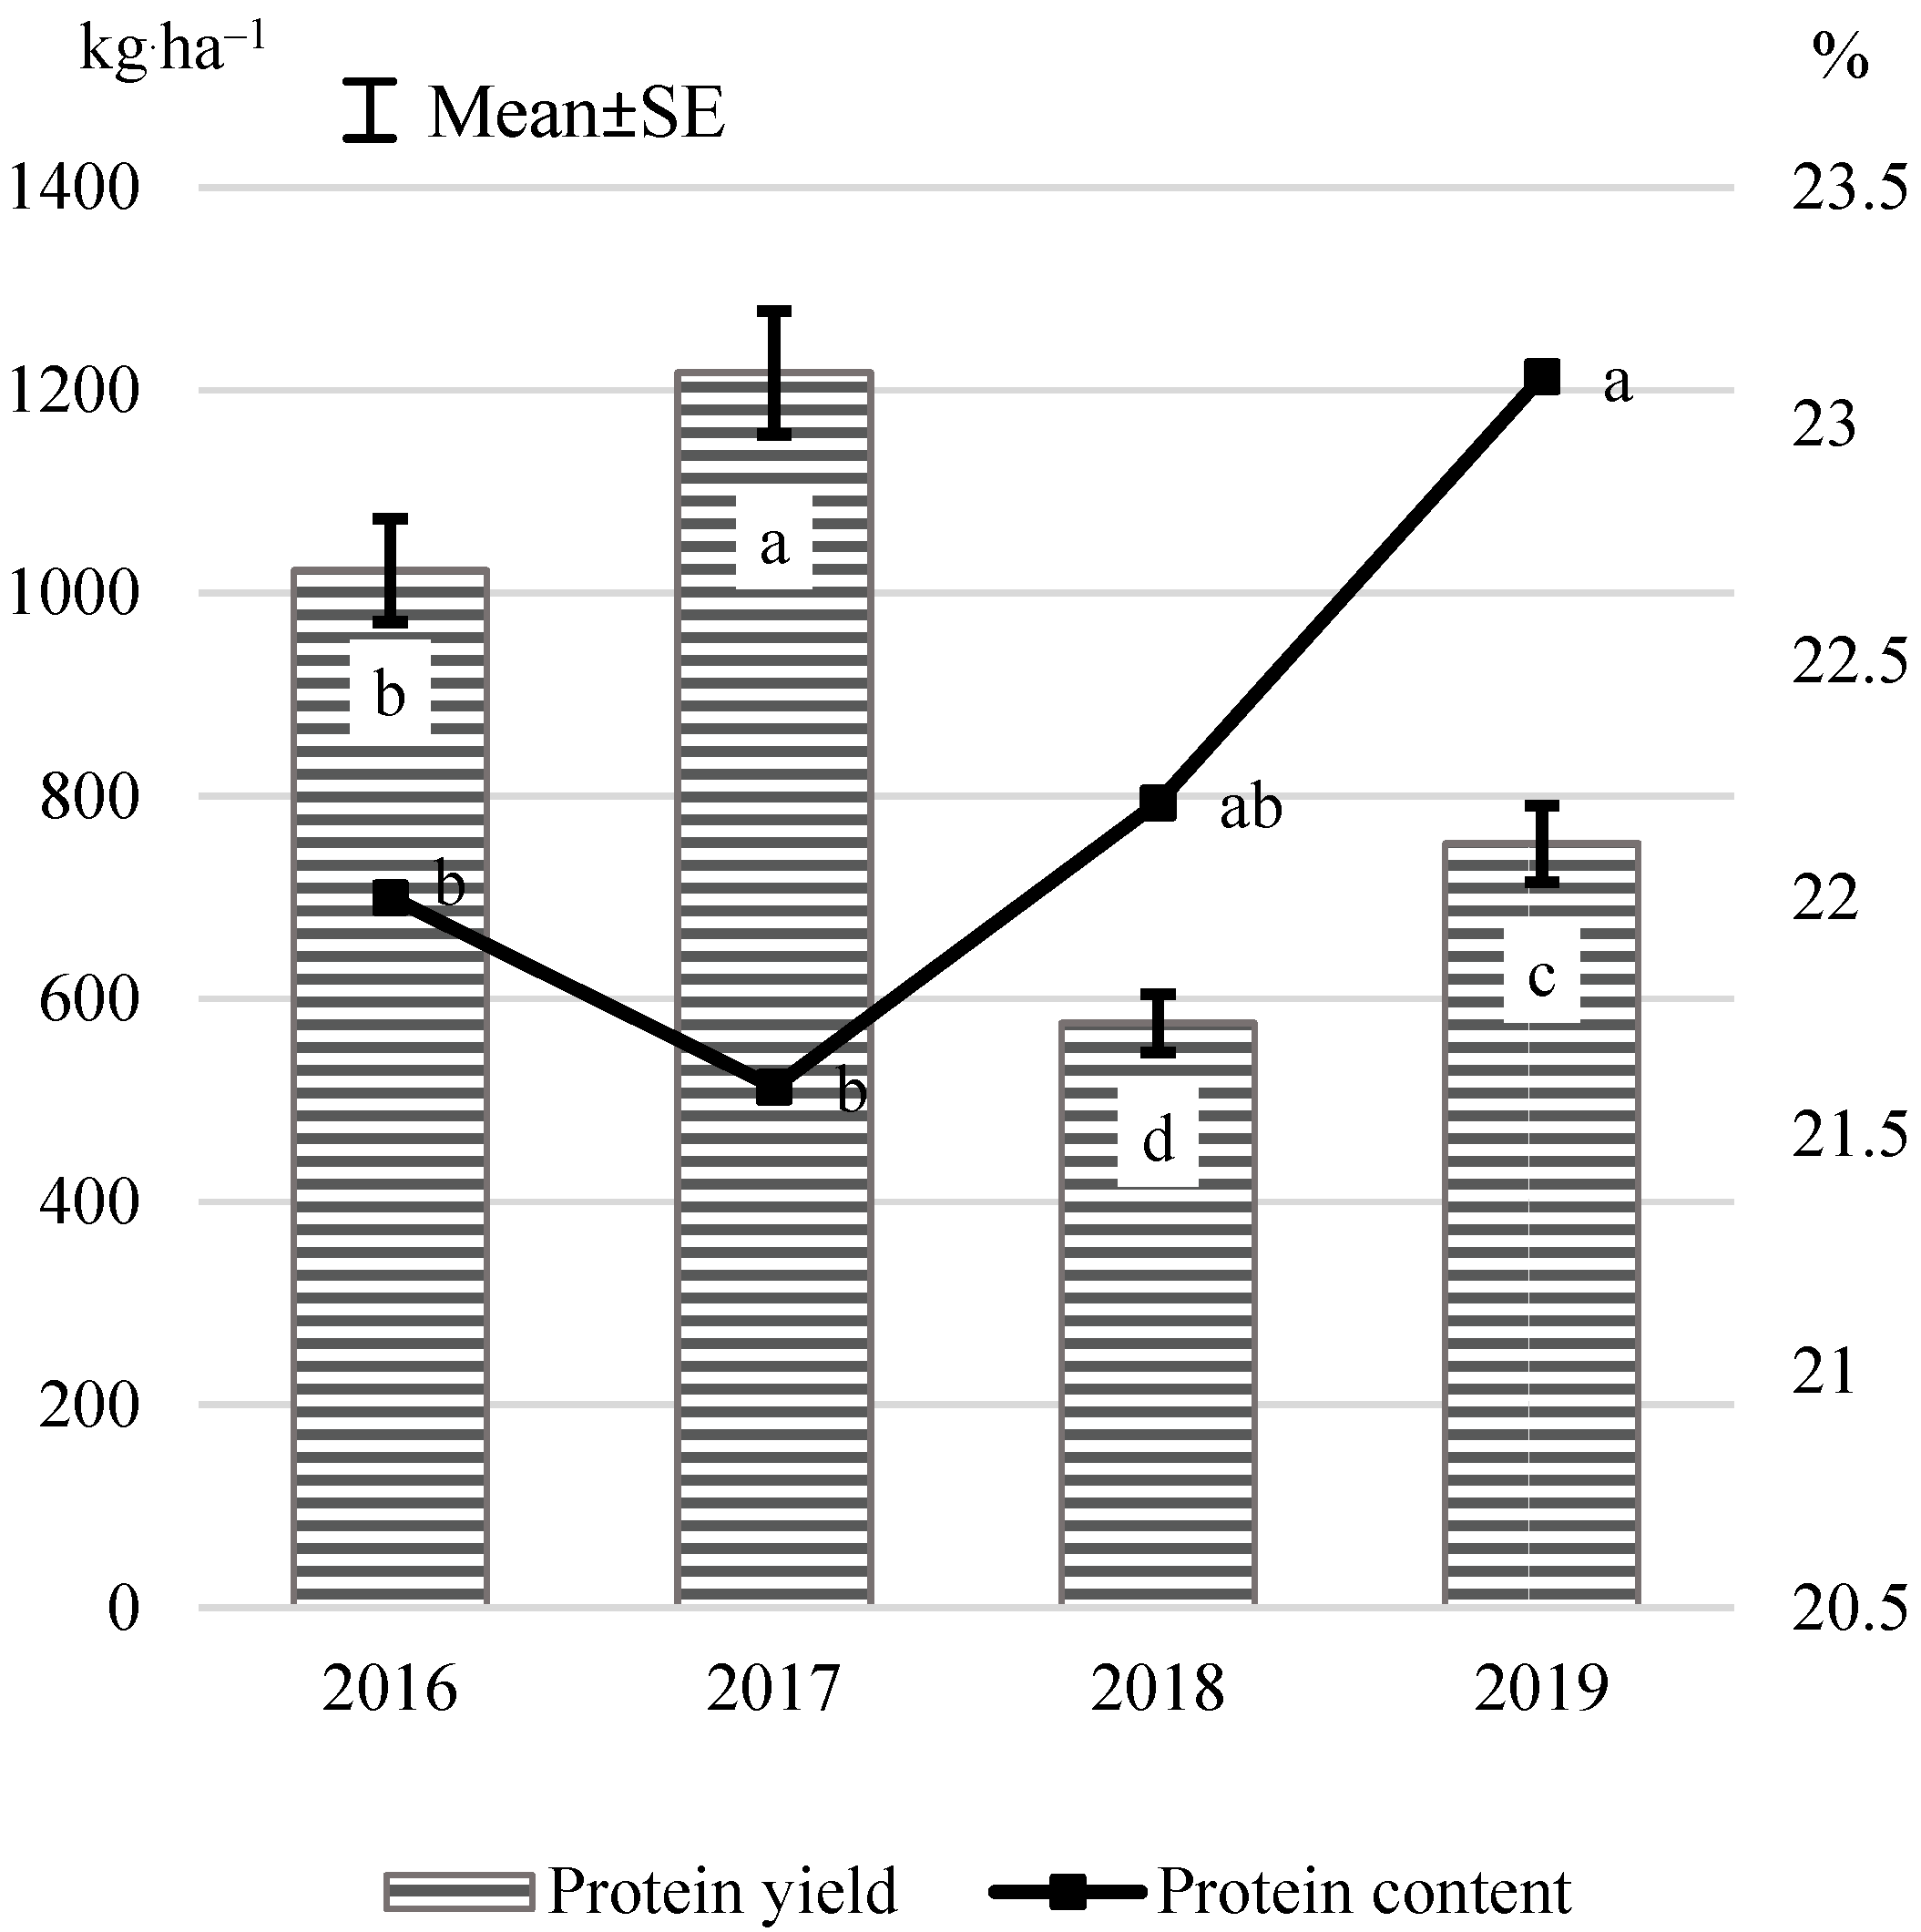
Water stress has a strong negative impact on the dry weight of seeds and N accumulation in seeds, although it does not have a special effect on the N allocation between aboveground and underground parts (1); the content of protein in pea seeds varies a lot due to the sowing date, and it is not affected by row spacing (13). The present study identified no significant effect of row spacing, planting density, or their interaction (row spacing × planting density) on the protein content in pea seeds, which in 2016–2019 was, on average, 22.2% (Figure 1). The decrease in the total precipitation (from 116 mm in 2016 to 20 mm in 2019) and increasing temperature (from 18 °C in 2016 to 20.2 °C in 2019) in June and July resulted in a significant increase in the protein content in pea seeds, which is almost opposite to the seed yield.
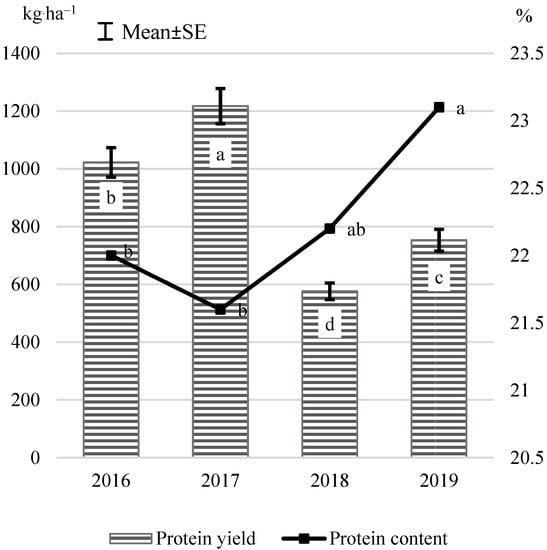
Figure 1.
Yield (kg·ha−1) and protein content (%) in pea in the research years. Values of a parameter followed by the same letter did not differ significantly.
3.3. Pea Yield Components
Unlike the seed yield, the values of the structural pea yield components depended significantly not only on the weather pattern in the research years but also on the row spacing and on the planting density (Table 5). The mean number of pods per plant was 5.26, and in the years favorable in terms of the total precipitation (2016 and 2017), it was higher than in the less favorable years (2018 and 2019), similar to the pea seed yield. The other structural pea yield components differed only slightly less considerably due to the total precipitation. According to Górynowicz at al. [20], favorable precipitation conditions affect the seed yield and the number of pods per plant, as well as the number of seeds per pod and 1000 seed weight, less considerably. The number of pods, seeds per pod, and seed weight per pod were significantly higher when pea was sown in narrow (16 cm) rather than wide (32 cm) rows. Shaukat et al. [13], on the other hand, recorded a higher number of plants and seeds per pod when pea was grown with a wider row spacing; however, Kuczkowski et al. [24] reported the increased row spacing from 15 to 25 cm resulted in a significant increase in the seed weight per plant and 1000 seed weight, which, in the present research, was not confirmed for the seed weight per plant. Krizmanić et al. [5] claimed that a higher planting density had no significant effect on the number of seeds per pod, the number of pods, and 1000 seed weight. According to Górynowicz et al. [20], favorable precipitation conditions affected the number of seeds per pod and 1000 seed weight, less considerably; although, according to Martin and Jamieson [19], water stress, in general, does not affect the number of seeds per pod.
The planting density had a significant effect on most of the pea yield structural components, except for 1000 seed weight (Table 6). With the lowest planting density (70 plants per m2), there were a significantly higher number of pods and number of seeds per pod than for the planting density of 90 plants, and the seed weight per pod was higher than for 110 plants. According to Dumoulin et al. [17] the yield of pea seeds is generally strongly correlated with the number of seeds in a pod, which was observed in the authors’ own research for a smaller row spacing and a lower stocking density. The mean 1000 pea seed weight was 253 g, and neither the row spacing applied at sowing nor the varied planting density made it significantly different. Türk et al. [25] found that increasing the planting density from 75 to 150 per m2 decreased the number of seeds per pod, which was not observed in the present research; whereas, according to Krizmanić et al. [5], the planting density per m2 did not have a significant impact on the number of pods or the number of seeds per pod; neither did it have a significant effect, as in the present research, on 1000 pea seed weight.
Table 6.
Pea yield components depending on row spacing and plant density across the years.
Neither were there identified any significant interactions between the seed yield components under study in the research years and the row spacing or the planting density applied. Yucel [8], on the other hand, reported the planting density of 40–50 in pea had a significant positive effect on the number of pods per plant and the number of seeds, which, in the present study, was only confirmed with the assumed lowest planting density. According to Salter and Williams [22], the seed weight per plant in pea decreased regularly with an increase in planting density, which, in the present study, was observed for the decreasing seed weight per pod, similar to that reported by Türk et al. [25], with a growing planting density 75–100–125–150 per m2 resulting in a significant decrease in the number of seeds per pod and the protein yield.
3.4. Plant Indexes
The mean value of the Harvest Index (HI) for pea in 2016–2019 accounted for 50.8%, and it was decreased linearly in successive research years; yet, the row spacing did not differentiate it significantly. However, for the planting density of 70 and 90 plants, its value was significantly higher than for 110 plants per m2 (Table 7). Similarly, Martin et al. [9] found a decreasing HI value with an increase in the pea planting density.
Table 7.
Harvest Index (HI), Leaf Area Index (LAI), and Soil Plant Analysis System (SPAD) for pea depending on the year, row spacing, and plant density across the years.
At the full flowering stage each year, the LAI value per m2 of soil was measured with the Sun Scan Canopy Analysis System. A significantly higher LAI value was found only for the pea plants cultivated in the years with a high total precipitation (2016 and 2017); however, there was no significant impact of the row spacing and planting density on its value. Richard et al. [26] demonstrated that a higher planting density in a humid period resulted in an increase in the LAI value, which was also confirmed in the present study (in 2016 and 2017) with a high total precipitation the LAI value was almost two-fold higher than in the dry years (2018 and 2019). According to Podleśny [12], in the pea plants grown with a wider row spacing, the LAI value was lower, which was not found in the present research. Only the dry year, 2018, recorded a significantly higher SPAD value; however, neither the row spacing nor the sowing density differentiated its value significantly. In the dry period, with a water deficit, SPAD values can be considered a drought stress marker to evaluate the capacity for water use and the productivity of pea cultivars rather than the extent of stomata resistance [27].
4. Conclusions
The length of the growing season of pea in Middle Europe may limit its yield potential in relation to crops obtained at lower latitude and a longer growing season. In our own research, row spacing and planting density, in the vast majority, had no significant effect on pea yield or protein yield, and the most important factor determining their values was the sum of the rainfall distribution over the plan vegetation period. Most of the results did not depend on the interaction between the two factors significantly, in partial agreement with the many results cited, which were recorded in Europe or in Asia.
Author Contributions
Conceptualization, J.P. and M.B.; data curation, M.B.; formal analysis, M.B.; funding acquisition, J.P.; investigation and methodology, J.P and M.B.; project administration, J.P.; resources, J.P. and M.B.; supervision, J.P.; validation, J.P. and M.B.; visualization, M.B.; writing—original draft, J.P.; writing—review and editing, M.B. All authors have read and agreed to the published version of the manuscript.
Funding
This research was funded by the Polish Ministry of Agriculture and Rural Development, Project: Increasing the use of domestic feed protein for the production of high-quality animal products under sustainable development conditions. Project number HOR 3.3.2/2016/2020.
Institutional Review Board Statement
Not applicable.
Informed Consent Statement
Not applicable.
Data Availability Statement
The data presented in this study are available upon request of the corresponding author. The data is not publicly available because the Polish Ministry of Agriculture and Rural Development owns them.
Acknowledgments
This study was made possible by a grant of the Polish Ministry of Agriculture and Rural Development, Project No. HOR 3.3.2/2016–2020 “Distribution of plants in the canopy, yielding and seed quality of the most fertile varieties of peas, field beans, lupins and soybeans in different regions of the country.” Weather data were developed in the Melioration and Agrometeorology Laboratory at the Faculty of Agriculture and Biotechnology at the Bydgoszcz University of Science and Technology.
Conflicts of Interest
The authors declare no conflict of interest.
References
- Mahieu, S.; Germon, F.; Aveline, A.; Hauggaard-Nielsen, H.; Ambus, P.; Jansen, E.S. The influence of water stress on biomass and N accumulation, N partitioning between above and below ground parts and on N rhizodeposition during reproductive growth of pea (Pisum sativum L.). Soil Biol. Biochem. 2009, 41, 380–387. [Google Scholar] [CrossRef]
- Reckling, M.; Döring, T.; Stein-Bachinger, K.; Bloch, R.; Bachinger, J. Yield stability of grain legumes in an organically managed monitoring experiment. Asp. Appl. Biol. 2015, 128, 57–60. [Google Scholar]
- Karkanis, A.; Ntatsi, G.; Kontopoulou, C.-K.; Pristeri, A.; Bilalis, D.; Savvas, D. Field pea in European Cropping Systems: Adaptability, biological nitrogen fixation and cultivation practices. Not. Bot. Horti Agrobot. Cluj-Napoca 2016, 44, 325–336. [Google Scholar] [CrossRef] [Green Version]
- Azbadbakht, M.; Shamsabadi, H.; Gaol, F.A.; Amiri, E. Effect of planting pattern (row spacing and seed spacing in the row) on some pea physical properties (Pisum sativum var. Pofaki). Int. J. Biosci. 2013, 3, 127–133. [Google Scholar]
- Krizmanić, G.; Tucak, M.; Brkić, M.; Marković, M.; Jovanović, V.; Čupić, T. The impact of plant density on the seed yield and the spring field pea’s yield component. Poljoprivreda 2020, 26, 25–31. [Google Scholar] [CrossRef]
- Olle, M. The yield, height and content of protein of filed peas (Pisum sativum L.) in Estonian agro-climatic condition. Agron. Res. 2017, 15, 1725–1732. [Google Scholar]
- Baigorri, H.; Antolín, M.C.; Sánchez-Díaz, M. Reproductive response of two morphologically different pea cultivars to drought. Eur. J. Agron. 1999, 10, 119–128. [Google Scholar] [CrossRef]
- Yucel, D.O. Impact of plant density and yield and yield components of pea (Pisum sativum ssp. sativum) cultivars. J. Agric. Biol. Sci. 2013, 8, 169–174. [Google Scholar]
- Martin, I.; Tenorio, J.; Ayerbe, L. Yield, growth and water use of conventional and semi-leafless peas semiarid environments. Crop Sci. 1993, 34, 1576–1583. [Google Scholar] [CrossRef]
- Grabowska, K.; Banaszkiewicz, B. Wpływ temperatury powietrza i opadów atmosferycznych na plonowanie grochu siewnego w środkowej Polsce (Effect of air temperature and atmospheric precipitation on yielding of sowing pea in central Poland). Acta Agrophysica 2009, 13, 113–120. [Google Scholar]
- Gugała, M.; Zarzecka, K. Wpływ gęstości siewu sposobu pielęgnacji na plonowanie grochu siewnego (Pisum sativum L.) (The influence of sowing rate and weed control methods on the yielding of field pea (Pisum sativum L.)). Fragm. Agron. 2009, 26, 64–71. [Google Scholar]
- Podleśny, J. Wpływ struktury przestrzennej łanu na wzrost, rozwój i plonowanie wąsolistnej odmiany grochu siewnego (The effect of spatial structure of stand on growth, development and yielding of pea). Fragm. Agron. 2009, 26, 140–149. [Google Scholar]
- Shaukat, S.A.; Ahmad, Z.; Choudhary, Y.A.; Shaukat, S.K. Effect of different sowing dates and row spacing on the growth, seed yield quality of off-season pea (Pisum sativum L. cv. Climax) under temperature conditions of Eawalakot Azad Jammu and Kashmir. Sci. J. Agric. 2012, 1, 117–125. [Google Scholar]
- IUSS Working Group WRB. World reference base for soil resources 2014, update 2015. International soil classification system for naming soils and creating legends for soil maps. In World Soil Resources Reports; FAO: Rome, Italy, 2015; p. 106. [Google Scholar]
- Reckling, M.; Döring, T.F.; Bergkvist, G.; Stoddard, F.L.; Watson, C.A.; Seddig, S.; Chmielewski, F.M.; Bachinger, J. Grain legume yields are as stable as other spring crops in long-term experiments across northern Europe. Agron. Sustain. Dev. 2018, 38, 63. [Google Scholar] [CrossRef] [PubMed] [Green Version]
- Prusiński, J. Wybrane wskaźniki produkcyjności grochu siewnego w warunkach wzrastającej intensywności technologii uprawy (Chosen growth and development indexes of pea under increasing intensity of cultivation technology). Acta Sci. Pol. Agric. 2007, 6, 4. [Google Scholar]
- Dumoulin, V.; Ney, B.; Gerard, E. Variability of seed and plant development in pea. Crop Physiol. Metab. 1999, 34, 992–998. [Google Scholar] [CrossRef]
- Silim, S.N.; Hebblethwaite, P.D.; Jones, C. Irrigation and water use in leafless peas (Pisum sativum). J. Agric. Sci. 2009, 119, 211–222. [Google Scholar] [CrossRef]
- Martin, R.J.; Jamieson, P.D. Effect of timing and intensity of drought on the growth and yield of field peas (Pisum sativum L.). N. Z. J. Crop Hortic. Sci. 1996, 24, 167–174. [Google Scholar] [CrossRef]
- Górynowicz, B.; Święcicki, W.; Pilarczyk, W.; Mikulski, W. The dependence of seed yield and its components on environmental factors in selected legumes. Colloq. Biom. 2014, 44, 127–138. [Google Scholar]
- Kuznetso, I.; Davletov, F.; Anokhina, N.; Akhmadullina, I.; Safin, N. Influence of weather condition on the field peas (Pisum sativum L. ssp. sativum) vegetation period and yield. Agron. Res. 2020, 18, 472–482. [Google Scholar]
- Salter, J.; Williams, J.B. The effect of irrigation on pea crops grown at different plant densities. J. Hortic. Sci. 2015, 42, 59–66. [Google Scholar] [CrossRef]
- Spies, J.M.; Warkentin, T.; Shirtliffe, S.J. Basal branching in field pea cultivars and yield-density relationships. Can. J. Plant Sci. 2010, 90, 679–690. [Google Scholar] [CrossRef] [Green Version]
- Kuczkowski, J.; Kotecki, A.; Kozak, M. Wpływ sposobu siewu na rozwój i plonowanie wąskolistnych odmian grochu. Część I. Rozwój roślin i plony (The effect of sowing method on growth and yielding of narrow-leaf pea cultivars. Part I. Plants’ growth and yielding). Zesz. Nauk. Uniw. Przyr. We Wrocławiu 2006, 89, 187–205. [Google Scholar]
- Türk, M.; Albayrak, S.; Yüksel, O. Effect of seeding rate on the forage yields and quality in pea cultivars of different leaf types. Turk. J. Field Crops 2011, 16, 137–141. [Google Scholar]
- Richard, B.; Bussière, F.; Langrume, C.; Rouault, F.; Jumel, S.; Faivre, R.; Tivoli, B. Effect of pea canopy architecture on microclimate and consequences on ascochyta blight infection under field conditions. Eur. J. Plant Pathol. 2013, 135, 509–524. [Google Scholar] [CrossRef]
- Nemeskéri, E.; Molnár, K.; Vígh, R.; Nagy, J.; Dobos, A. Relationships between stomatal behaviour, spectral traits and water use and productivity of green peas (Pisum sativum L.) in dry seasons. Acta Physiol. Plant. 2015, 37, 34. [Google Scholar] [CrossRef]
Publisher’s Note: MDPI stays neutral with regard to jurisdictional claims in published maps and institutional affiliations. |
© 2022 by the authors. Licensee MDPI, Basel, Switzerland. This article is an open access article distributed under the terms and conditions of the Creative Commons Attribution (CC BY) license (https://creativecommons.org/licenses/by/4.0/).