Abstract
Desalinated seawater (DSW) can provide water resources for irrigation in coastal regions where freshwater is scarce. Reverse osmosis (RO) is the most common technique to obtain DSW worldwide. Nevertheless, using DSW for irrigation could pose an agronomic risk as RO permeates may have a boron concentration above the phytotoxicity thresholds of certain crops, such as woody crops (0.5 to 1.0 mg/L). In this study, an on-farm ion exchange resin system with an average flow of 1 m3/h, designed to reduce the boron concentration of DSW, was evaluated from a technical and economic perspective. The impact of variations in the feed water and operating temperatures on the boron reduction process was assessed. The results show that the system can provide an outflow with a boron concentration below the threshold of 0.5 mg/L over 92 h of operation, with boron rejections of up to 99% during the first 41 h. The estimated cost of boron removal with the on-farm system of the trial was EUR 0.992/m3. However, this cost is expected to decrease to EUR 0.226/m3 for a commercial ion exchange resin (IX) plant (20 m3/h), highlighting the importance of the scale factor. Our results provide novel guidance on the viability of using boron removal IX systems for farms irrigated with DSW, when it is provided by coastal plants with boron concentrations above the crop tolerance.
1. Introduction
In some regions affected by chronic water scarcity, seawater desalination is becoming an attractive option to sustain both domestic and agricultural needs, as desalinated seawater (DSW) is considered an inexhaustible and non-climate-dependent resource [1,2].
Globally, some 100 million m3 is desalinated per day, of which 61% corresponds to DSW, with about two thirds produced by the technique of reverse osmosis (RO) [1]. This technique removes salts by supplying pressure on the feed water to permeate through a semi-permeable membrane [3,4], which has a high energy consumption and production cost [5]. If only one RO stage is performed, the DSW may have a relatively high boron concentration (between 0.5 and 2.0 mg/L), due to the low specificity of membranes for boron [6,7,8,9]. The presence of boron in seawater is characterized by its non-ionic form of boric acid (H3BO3), which exists at a physiological pH (≈6) [10,11] and is a very stable uncharged molecule that conventional RO desalination methods cannot effectively remove [12,13]. In fact, at the typical pH of DSW (pH ≈ 8), more than 90% of boron appears as H3BO3 [14]. Therefore, the final boron concentration in the RO permeate mainly depends on the greater or lesser specificity of the used membranes and the technical configuration of the process (one or two stages), which is often ruled by the legal framework that regulates its use, if any: domestic or agriculture. In the case of Spain, the Royal Decree 140/2003 regulates the water quality standards for drinking water, setting the maximum boron concentration at 1.0 mg/L. The DSW produced in Spain fulfills this threshold, but this is above the tolerance level of certain crops, since there is no specific regulation of DSW for irrigation.
Boron is an essential nutrient for plants, since it is involved in many physiological processes [15,16]. It has different roles in the cytoskeleton and membrane, maintaining the structure and the correct behavior of the cell wall. Boron also participates in the metabolism of nucleic acids, hormonal regulation and synthesis of proteins [16]. Its chargeless form [11] allows the small neutral solutes to easily permeate through the lipid bilayer of cellular membranes driven by the transpiration process. Its accumulation in mature leaves usually leads to chlorotic and necrotic patches when the absorbed boron exceeds the plant toxicity threshold [11]. Moreover, high concentrations of boron may provoke a reduction in stomatal conductance and the inhibition of photosynthesis [17]. As a consequence, the boron toxicity threshold in irrigation water for most woody crops has been set between 0.5 and 0.7 mg/L [18], and even lower for citrus crops (0.3–0.5 mg/L) [2,19]. These values are well below the legal threshold for DSW in Spain. However, other countries such as Israel, Saudi Arabia and the US (only the state of Minnesota) have adopted solutions to provide non-hazardous levels of boron concentration (lower than 0.5–0.6 mg/L) in DSW, such as a second stage in RO [20,21,22,23].
Apart from reducing boron using a second RO stage, the use of boron-selective resins has made substantial progress [24,25,26,27,28,29]. Although ion exchange resin systems (IX) are not frequently used in direct desalination [30], they have been studied as an option to further reduce the boron concentration in DSW [7,31,32,33], especially in combination with RO [34,35,36,37]. Their use is still not widespread [1,30], but they are mostly used for RO feed pre-softening to reduce the levels of sparingly soluble salts [24,33,38]. This is also related to the high cost of the resin and reagents for periodic washing [7,19,35,37], in spite of their potential high efficiency [39,40,41].
Among the different types of resin, boron-selective weak-base anion resins based on crosslinked macroporous polystyrene matrixes with the N-methylglucamine (NMG) ligand have shown the highest boron removal efficiency [24]. The NMG active group of the resin captures the boron through a covalent bond and forms a complex of internal coordination due to the amine group protonation occurrence with the borate ion (B(OH−)4) [7,31]. The boron adsorption mechanism of NMG resins is shown in Appendix A. Amberlite IRA 743 [7,32,33], calix[4]arene [42], Dowex (XUS 43594.00) [43] and other chelating resins [12] with an NMG functional group have been mainly used and investigated. For example, Yilmaz et al. [32] suggested the use of a resin for boron removal in wastewater treatment and analyzed its behavior at different flows (10, 20 and 30 mL/min), concentrations of boron (200, 5000 and 1000 mg/L) and temperatures (10, 20, 30 and 40 °C). They observed the greatest differences in boron reduction when modifying the flow rate of the feed water, in relation to the rest of the parameters. Kabay et al. [24] conducted studies at the laboratory scale using a column with a height of 10 cm and a resin volume of 0.5 mL. They treated a concentration of boron of around 1.5 mg/L using several resin particle sizes and determined that maximum boron reductions were obtained for the smallest resin size. Chillón et al. [7] characterized and compared the behavior of the resins Amberlite IRA 743, Purolite S108 and Dowex (XUS 43954.00) by plotting saturation curves, and they conducted 220 h trials with an effluent flow of 160 L/h. Significant differences in the capacity of the resins to adsorb boron were observed, with saturation points between 134 and 167 h of operation, depending on the resin.
Boron adsorption by resins may occur in the form of either boric acid or borate ions, depending on the pH of the solution [31,32]. Typical boron-removal weak-base anion exchange resins have been investigated at different pH values ranging from 4 to 12 [24,32,44,45,46], and there is no general agreement on whether higher or lower pH values may increase or decrease boron adsorption. For example, Öztürk and Köse [47], Yan et al. [46] and Hussain et al. [12] evaluated the adsorption of boron by the resins Dowex 2 × 8, XCS-800 and other novel chelating resins, respectively. They showed that increasing the pH from 6 to 9 [47], from 4 to 12 [46] and from 7 to 10 [12] achieved the highest adsorption of boron in all cases. They justified the increase by the high presence of borate ions, for which the resin seemed to have more affinity. In particular, Yan et al. [46] showed an increase in the adsorption of boron of 33.3% when the pH increased from 4 to 12. On the contrary, for the resins calix[(4)]arene [42] and Amberlite IRA743 [33], it was observed that increasing the pH from 5.5 to 8.5 and from 8 to 10.5 led to a decrease in boron adsorption from 84% to 71% and from 84% to 72%, respectively. Such a decrease was justified by the abundance of hydroxyl ions in the solution, which can compete with borate ions for the adsorption sites. Thus, the greater or lesser adsorption of boron for a given pH seems to be related to the molecular structure of the used resin.
Concerning the influence of the water temperature on resin boron adsorption, higher temperatures could be beneficial, since both its chemical activity and the kinetics of the process increase with temperature [33]. Significant increases in boron reduction have been observed for different resins and temperature variations between 20 and 40 °C [19,32,33,46,48], which could be explained by the acceleration of the Brownian motion of boron species in solution at elevated temperature [33,46]. However, similar (25 to 45 °C) and higher (from 25 to 70 °C) variations of the operating temperature have been observed to have the opposite effect for other resins. Öztürk and Köse [47] and Hussain et al. [12] reported a reduction in the adsorption of boron from 47 to 33% and from 80 to 61%, respectively. Therefore, the relationship between the temperature and boron removal capacity seems to also depend on parameters such as the type of resin, the particle size or the chemical composition of the feed water [7,44]. Further research is required to assess the influence of the type of resin, the pH, the water temperature, and the flow rate volume on the boron reduction efficiency [7,19,33,44].
The vast majority of research focused on boron removal by NMG-based resins has been performed at the laboratory scale using low flow rate volumes (below 200 L/h) [7,19,24,31,32] and/or synthetic aqueous solutions [33,47,49]. To the best of our knowledge, the present study characterizes, for the first time, the reduction in boron from DSW by means of an on-farm IX system composed of an AmberLiteTM PWA10 resin in field conditions. The technical and economic viability of this system is assessed in order to provide guidance for farms that receive DSW from desalination plants with only one RO stage with boron concentrations close to 1 mg/L, and that have the need to reduce it at least up to 0.5 mg/L to avoid phytotoxicity problems in their crops.
2. Materials and Methods
2.1. Experimental Site and Desalinated Water
The experimental work was carried out between April 2021 and January 2022 at a commercial farm located in Torre Pacheco, Murcia, Spain (37°47′30″ N; 1°03′85″ W; 30 m above sea level). The DSW for the trial was provided by the coastal desalination plant of Escombreras, located in Cartagena (southeast of Spain), which supplies 20 hm3/year for irrigation [50]. Table 1 shows the physical and chemical properties of the DSW supplied by the plant.

Table 1.
Values of physical and chemical properties of the desalinated seawater supplied by the Escombreras desalination plant.
2.2. Description of on-Farm Ion Exchange Resin Pilot Plant
An experimental on-farm IX system was designed to reduce the boron concentration of DSW for irrigation. The goal of the trial was to assess the boron removal efficacy of the system and the impact of the variation in the water temperature on the system performance. Figure 1 shows the experimental system installed. It consisted of: (i) a 2.5-bar feed pump (Grundfos, Model CM3-3, 0.5 kW) working at a flow rate of 1.0 m3/h; (ii) a pretreatment system, with a zeolite and pyrolusite bed filter (250 L capacity), an activated carbon microfilter (big type, compressed and sealed by thermoplastic, 20″ length with 10 µm pore size), used for both the elimination of chlorine and turbidity, and a microfilter (big type, extruded polypropylene) to retain particles up to 0.1 µm; (iii) a pH meter (Burkert, pH measurement device Model 561686); (iv) a dosing pump (SEKO automatic pump, 2 L/h) to inject HCl for the acid stage of the regeneration process of the resin; (v) a dosing pump (SEKO automatic pump, 2 L/h) to inject NaOH for the caustic stage of the regeneration process of the resin; (vi) an ion exchange resin column (Duppont, resin AmberLiteTM PWA10). The resin had a macroporous matrix with the N-methylglucamine ligand as the functional group and an average particle size of 525 µm. The capacity of the column was 100 L and contained a bed volume (BV) of 44 L of resin.
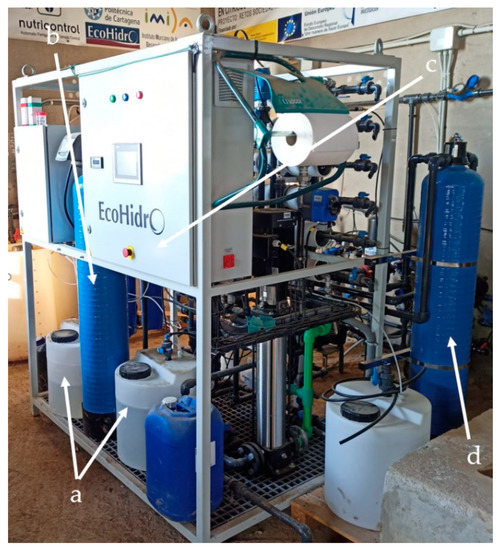
Figure 1.
Picture of the experimental on-farm ion exchange resin system: (a) HCl and NaOH tanks; (b) zeolite and pyrolusite bed filter; (c) control panel; (d) ion exchange resin column.
During the operation, the outflow water (effluent) was accumulated in a regulator reservoir. Figure 2 shows the configuration of the experimental system and the sampling procedure of the experiment, and Table 2 shows the most relevant characteristics of the resin.
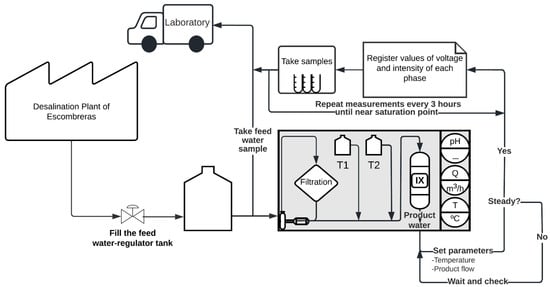
Figure 2.
Configuration of experimental on-farm ion exchange system and sampling procedure of the experiment. IX: ion exchange column; T1: HCl tank; T2: NaOH tank.
Table 2.
Characteristics of the ion exchange resin selected for the trial.
The average flow of the experimental system was 1 m3/h (D1). For the analysis, we considered the system to work for 7000 h/year and to produce 7000 m3/year, which could irrigate one hectare of a citrus crop in the study area. Additionally, an analogous on-farm IX system, with a higher flow of 20 m3/h (D2), was considered for the economic evaluation in order to simulate a more realistic scale. This commercial-size system was estimated to have an annual production capacity of 140,000 m3/year, which would allow irrigating 20 hectares of citrus crops.
2.3. Tests Performed and Boron Characterization
Two tests were performed at two different DSW temperatures (6 °C and 26 °C), with three repetitions each. As they were conducted in January 2022 and August 2021, respectively, the values of the pH and boron concentration of the DSW varied slightly (Table 1). Each trial was performed at a flow rate of 1 m3/h and took 156 h.
In order to characterize the effect of the resin on the reduction in boron and other ions in the DSW, samples of the feed and the effluent water were taken at the beginning of the trial and then after every 3 h of operation. A total of 106 water samples per trial were collected in 500 mL glass bottles, transported in an icebox to the laboratory and stored at 5 °C before being processed for physical and chemical analyses. An inductively coupled plasma (ICP-MS Agilent Technologies, Model 7900, Santa Clara, CA, USA) was used to determine the concentration of Na+, K+, Ca2+, Mg2+ and B3+. Anions (Cl−, NO3−, PO43− and SO42−) were quantified by ion chromatography with a liquid chromatograph (Thermo Scientific Dionex, Model ICS-2100, Thermo Scientific, Basel, Switzerland). The electrical conductivity of the water (EC) was determined by means of a conductivity instrument, GLP-31 (Crison Instruments S.A., Barcelona, Spain). The pH was measured with a pH meter, GLP-21 (Crison Instruments S.A., Barcelona, Spain). The boron reduction was calculated as follows:
where [Beffluent] and [Bfeed water] are the boron concentrations of the effluent and the feed water (mg/L), respectively.
Additionally, a complete characterization of the boron reduction capacity of the resin was carried out with Equations (2) and (3), which define the kinetics of the boron adsorption process. Firstly, a relationship between the concentration of boron in the feed water and the effluent and the operating time of the process was established as follows [32]:
where [B] and [Bfeed water] are the boron concentrations of the effluent and the feed water (mg/L), respectively, and t is the operating time.
From Equation (2), represented as ln([B]/([Bfeed water] − [B])) = t·m + n, the parameter n was also retrieved, which represents the 50% adsorbate breakthrough (saturation of the resin) time (τ), which is required in the following equation [32]:
where We is the capacity of boron adsorption by the column of the resin (g B/Lresin), [B] is the concentration of boron in the effluent (g/L) and F is the flow of the feed water (BV/h).
2.4. Regeneration Procedure
As the resin adsorbs boron and reaches an ionic saturation point, the concentration of boron in the effluent increases. In order to continue using the IX system and to avoid boron phytotoxicity in crops irrigated with this water, the resin needs to be regenerated to the initial ionic state [7,49]. Appendix B presents the regeneration procedure conducted during the experiment after each test, when the resin seemed to reach a point close to the saturation state, after 156 h of operation. It consisted of a two-stage regeneration process, by using 32 wt% HCl for the acid stage to remove the adsorbed boron, and 50 wt% NaOH for the caustic stage to neutralize the resin, causing a stable ionic form.
2.5. Specific Energy Consumption of the on-Farm Ion Exchange Resin System
In order to determine the energy consumption (EC; kW·h) associated with the boron reduction for each test, the current intensity of the electrical panel was measured with a current clamp (TENMA, Model 72-2985) and the voltage between phases was registered using a digital multimeter (UNI-I, Model YT33A). Then, EC and the specific energy consumption (ES) associated with the boron reduction (kW·h/m3) were calculated according to the following equations:
where IR, IS and IT are the current intensity (A), VN−R, VN−S and VN−T are the voltages between the neutral and the phases R, S and T, respectively (V), Qeffluent is the effluent flow (m3/h) and t is the time (hours).
For the case of the D2 IX design, the energy consumption (kW·h) and the specific energy (kW·h/m3) were determined according to the manufacturer’s instructions and based on both the electricity consumption of the plant and its treatment flow.
2.6. On-Farm Ion Exchange Resin Economic Cost
Both the fixed and the variable costs were considered in the economic evaluation of the on-farm reduction in boron. The fixed costs included the depreciation costs of the equipment, whereas the variable costs included all the operation costs, i.e., the cost of chemical products and energy used in the operating process, and the maintenance costs of the equipment.
2.6.1. Depreciation Cost
The amortization cost was calculated as the annual payment fee, as follows:
where C (EUR/year) is the annual payment fee (EUR), Vad is the equipment acquisition value (EUR), i is the interest and a is the equipment lifespan (years).
For the calculation, a lifespan of 15 years for the IX equipment was taken into account according to the manufacturer, which considered 7000 h of annual operation and an interest rate of 5%. The acquisition value of this on-farm equipment (D1, 1 m3/h) provided by the manufacturer was EUR 51,493. The previously mentioned more realistic design with a higher permeate flow, D2 (20 m3/h), had an investment cost of EUR 94,180.50.
2.6.2. Cost of Reagents
The volumes of reagents for the regeneration process, hydrochloric acid (HCl; EUR 0.77/L) and sodium hydroxide (NaOH; EUR 2.12/L), are shown in Appendix B, according to the manufacturer’s guidelines.
2.6.3. Energy Cost
The energy cost was computed with Equation (4), considering the average energy price (EUR 0.134/kW·h) paid during the trial. Additionally, considering the recent increase in the energy price up to EUR 0.30/kW·h in 2022, a sensitivity analysis was carried out to study the effect of such a variation in the total economic cost.
2.6.4. Maintenance Cost
The maintenance cost considered the spare parts that had to be replaced to avoid malfunction according to the manufacturer’s guidelines. It included filters, vent plugs, bearings, mechanical seals, dosing maintenance kits and level, pH and electrical conductivity probes (Table 3). Taking into consideration that some elements need to be replaced every 1, 2 or 5 years, the costs were calculated annually for the equipment lifespan.
Table 3.
Spare parts needed for the two IX systems considered in this study.
2.7. Statistical Analysis
The statistical analysis performed was a weighted analysis of variance (ANOVA), using the statistical software IBM SPSS Statistics v. 21, as well as a Shapiro–Wilk test to evaluate the normality of the data and a Tukey’s honestly significant difference (HSD) test to check differences among means for significance (significance level p ≤ 0.05).
3. Results and Discussion
3.1. pH and CE in the Effluent
Figure 3 shows the evolution of the pH in the feed water and the effluent. Prior to each trial, a complete regeneration process was carried out in order to reset the resin to a non-saturated state. As the second stage of the regeneration was the addition of NaOH to neutralize the molecular structure of the resin [7,12,31,51], the effluent at the beginning of the trials was around 10.6 (Figure 3), although the pH of the DSW ranged from 8.35 to 8.45 (Table 1). In each trial, as the operating time advanced, the pH of the effluent decreased, reaching the original value of the feed water after 14–18 h of operation, and remaining steady afterwards. During the hours of pH decrease, the efficacy of the system was not affected (Figure 3 and Figure 4). In fact, unlike other methods such as RO that require pH adjustments to achieve a higher boron removal capacity, IX does not require any further pH modifications during operation.
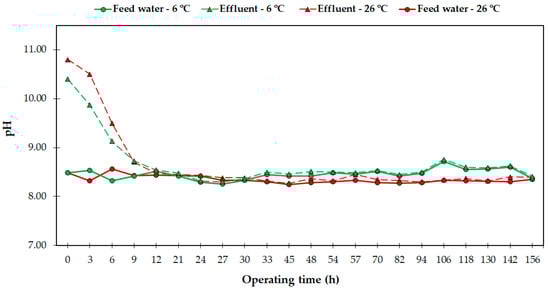
Figure 3.
pH of the feed water and effluent during the tests performed.
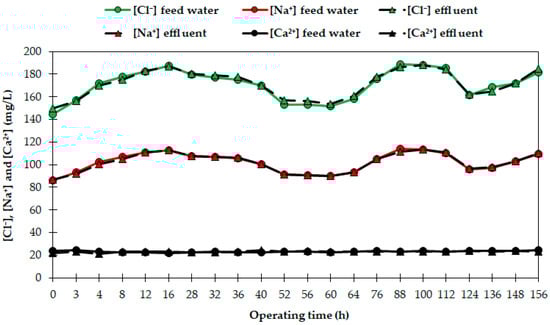
Figure 4.
[Cl−], [Na+] and [Ca2+] in the feed water and effluent during the tests performed at 26 °C.
Several studies have investigated the use of alkaline compounds during regeneration, in order to optimize and diminish the use of reagents, since excessive addition may harm the chemical structure of the resin and endanger its adsorption capacity [52,53]. This would avoid the use of acidifying compounds to recondition the water for irrigation, meaning a reduction in its production costs [9] (see epigraph 3.5). Kalaitzidou et al. [49] studied the influence of different regeneration procedures and observed that the regeneration and stabilization of the resin using several compounds provoked higher or lower pH values in bed volumes, depending on the utilized reagent. This aspect is also conditioned by the resin itself, whose greater or lesser regeneration depends on the used reagents [31,52]. In this context, Chandrasekara and Pashley [54] suggested that resins have two types of active binding sites that can be employed during the ion exchange process, some of which are accessible and easily exchangeable while others are less readily exchangeable, which can affect the efficacy of the regeneration procedure. However, and despite the fact that the neutralization stage is not mandatory for the regeneration of the resin, its use seems to be recommended to increase its structural durability and maintain its boron adsorption potential after successive regeneration processes [49,53]. Considering all these reported facts, in our study, we used a two-step acid–caustic regeneration process to keep the boron adsorption capacity of the resin stable in successive trials, and as a recommendation from the manufacturer, as shown in Appendix B.
Similar to the pH, the EC of the effluent was not affected and maintained the same values measured in the feed water, around 0.62 dS/m (data not shown). This fact also indicates the absence of interference between the resin and the major ions present in the water, as many other authors have previously reported [7,19,31,34,55].
3.2. Effect of the Resin Column on Major Ions’ Concentration
The selective behavior of the resin AmberLiteTM PWA10 for boron was evaluated, and the concentration of major anions and cations in the water samples (Na+, K+, Ca2+, Mg2+, Cl−, NO3−, PO43− and SO42−) was analyzed. Figure 4 shows the evolution of [Cl−], [Na+] and [Ca2+] in the feed water and the effluent during the test performed at 26 °C. All trials showed similar results, with major ions’ concentration unaffected by the resin, since it was specifically selective for boron. Our results are in agreement with previous studies, in which no interaction with major ions of different feed waters (DSW, wastewater, brine water) was observed with boron removal resins, such as Amberlite IRA 743 [7,32,56], Dowex 2 × 8 [51], XCS-800 [46] or Diaion CR B 02 [24]. Nevertheless, it has been demonstrated that boron removal may be considerably influenced by the presence of Na2SO4, CaCl2 and NaCl [51], and by the different compounds used in the regeneration procedure [49]. Nonetheless, the lack of interaction of the resin with the rest of the ions implies less need for nutrients for reconditioning DSW for irrigation. Therefore, reconditioning costs are lower [9], especially compared to the RO technique, which produces a substantial demineralization of the feed water [2,37].
3.3. Effect of the Temperature and Feed Boron Concentration on Adsorption Capacity
In order to characterize the boron removal performance of the AmberLiteTM PWA10 resin, the evolution of the adsorbed boron at different operating temperatures was studied. In each of the trials, as the feed DSW ran through the column, the resin began to adsorb boron ions, forming a covalent bond between the NMG group and boron [7, Appendix A]. During the first 38–45 h of operation, the resin was able to maintain the boron concentration of the effluent at 0 mg/L (Figure 5). Subsequently, its concentration increased steadily as the operating time advanced, reaching the woody crop boron threshold (0.5 mg/L) after 84–93 h, and approaching the maximum saturation state after 150 h.
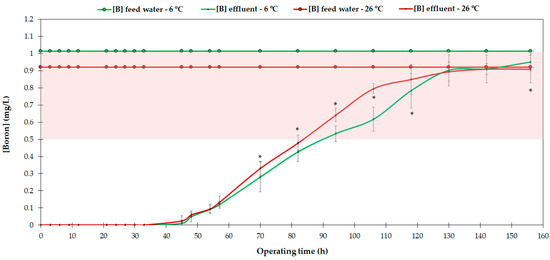
Figure 5.
Boron concentration in the feed water and effluent during the test performed. The shaded area represents the phytotoxicity threshold of woody crops. * Significant differences at p ≤ 0.05.
The total boron removal after 160 h of operation was similar at 6 and 26 °C (Figure 5). The main difference was that during the trial at higher temperature, the boron concentration in the effluent increased more rapidly. In contrast, some authors showed the opposite behavior and suggested several hypotheses. Firstly, the difference in the boron adsorption of AmberLiteTM PWA10 could be due to the feed boron concentrations used in the trials (Table 1). The amount of boron adsorption increases with an increase in the feed concentration, as it provokes an increase in the concentration gradient of boron across the liquid–solid interface at higher concentrations, which facilities overall mass transfer of boron from the liquid phase to the solid (resin) phase [32]. However, the studies that evaluated and showed this behavior used feed boron concentrations that ranged from 250 mg/L to 1000 mg/L [32] or from 100 mg/L to 1000 mg/L [47], among others. In our case, the difference in the feed boron concentration between the trials was insignificant. Therefore, it is very likely that the observed variation in the adsorbed boron was due to different reasons.
Concerning other parameters, the kinetic activity of the resin increases as the temperature rises, which seems to also increase the adsorption of boron [32,33,46]. However, the opposite effect has also been observed, in which the temperature caused a decrease in the percentage of boron adsorbed by the resin [12,47]. Therefore, it is presumable that boron adsorption is determined by a conjunction of operating parameters such as the temperature, pH and boron concentration of the feed water, but also by the resin itself, its molecular structure and its particle size [7,44]. In our case, a slight difference in boron adsorption was observed related to the operating temperature, causing a more rapid saturation of the resin at 26 °C. However, the saturation point was reached nearly after the same operating time, since the feed boron concentration was very similar during the trials (0.9–1.0 mg/L). This may be due to the abovementioned increase in the kinetic activity of the resin which seemed to increase not only the adsorption of boron, but also the removal of other elements present in the water. The effluent analysis showed an escalated reduction in Fe, Mn, Cu and Zn with the temperature (data not shown), presumably due to their metallic character, quasi-similar to boron, and their apparent capacity to form bonds with hydroxyl ions and the NMG group of the resin. This could cause, to a certain extent, a faster saturation of the resin.
Figure 6 shows that the resin reached 50% of its saturation capacity after 5827 and 5028.8 min of operation, which means a volume of 2207 and 1905 Ltreated/Lresin, for the 6 and 26 °C trials, respectively. This also indicates that AmberLiteTM PWA10 achieved an apparent higher saturation rate as the temperature increased. These adsorption results are similar to those of other resin studies. For example, Chillón et al. [7] studied the boron removal behavior of Amberlite IRA 743, Purolite S-108 and Dow XU-43594.00, which kept the boron concentration of the effluent below 0.5 mg/L over 75, 71 and 66 h, retaining 1.9, 2.0 and 2.0 g B/Lresin, respectively, compared to the average of 88 h achieved by AmberLiteTM PWA10 and the maximum adsorption of 2.2 g B/Lresin found in our study (Figure 5). Several authors showed similar results for various resins [24,31,32]. However, as mentioned previously, others observed the contrary effect, i.e., decreased adsorbed boron as the temperature increased [12,46], which points to the fact that the relationship between the operating temperature and the adsorption of boron also depends on each resin. In any case, it must be highlighted that there were differences in operating conditions (bed volume, flow rate or boron concentration in the feed water) between our study and other studies; hence, comparisons need to be contextualized.
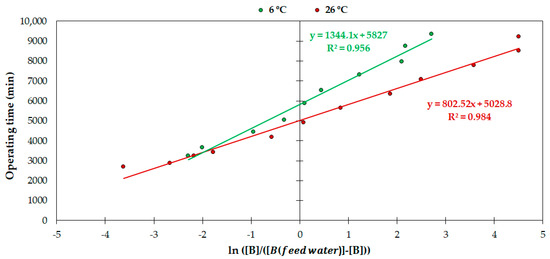
Figure 6.
Correlation between time and ln([B]/([Bfeed water] − [B])) at 6 and 26 °C.
3.4. Management of the Boron Concentration in the Effluent Water and Regeneration Process
Before each trial, a two-stage (acid–caustic) regeneration process was performed, in order to reset the initial ionic state of the resin (Appendix B). Firstly, 32 wt% HCl was used to remove the adsorbed boron by the resin, breaking the covalent bond, and therefore the complex of internal coordination between the NMG group and boron. This leads the resin to an unsaturated state, which allows it to adsorb boron once again. Secondly, 50 wt% NaOH was used to neutralize and stabilize its chemical structure. The latter is not a mandatory stage; however, it has been demonstrated that neutralization improves the gross uniformity of resins’ chemical potential and avoids their physical deterioration [31,49,53], but at the expense of considerably increasing the cost of reagents [39] (see epigraph 3.5).
After 84–93 h of operating time (B ≈ 0.5 mg/L, Figure 5), regeneration is necessary in order to produce water with boron concentrations below the threshold of sensitive crops. Nevertheless, and on a regular basis, especially in regions such as the Spanish southeast, the water used in irrigation is accumulated in regulator on-farm reservoirs, which allow water to be available in times of scarcity [57]. In this way, the water produced by means of an IX resin system at on-farm scale should be equally accumulated, and its concentration of boron will depend on the flow rate and total volume. Furthermore, this procedure must be mandatory, since boron is an essential element for plants [15,16,17], and low concentrations of boron (around 0.1–0.4 mg/L) are required to be supplied for adequate woody crop development.
In order to estimate the boron concentration of this volume and the optimal moment for the regeneration procedure, the behavior curves obtained for the resin (Figure 5) can be used. Figure 7 shows the concentration of boron in a theoretical effluent-regulator reservoir.
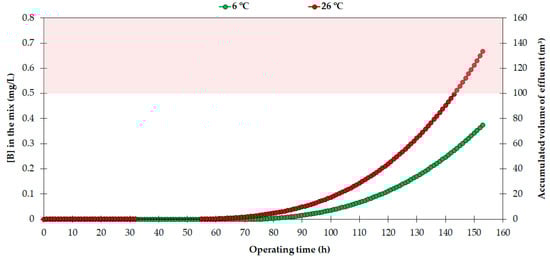
Figure 7.
Boron concentration in a theoretical effluent-regulator reservoir. The shaded area represents the phytotoxicity threshold of woody crops.
As Figure 7 shows, the concentration of boron in the accumulated volume would not exceed 0.5 mg/L for the following scenario: flow rate = 1 m3/h, operating time = 156 h, temperature 6–26 °C, feed boron concentration ≈1 mg/L, except for the last 12 h of operation at 26 °C. This would allow fewer regeneration treatments, since the resin does not require continuously being in a lower saturation state, and its molecular structure should not be harmed.
A priori, this could be useful for two reasons: Firstly, typical resin use leads to the need to reincorporate a percentage of the volume of the resin used in the column per year, according to the manufacturer’s recommendations. However, successive regeneration procedures provoke a considerable decrease in the adsorption capacity of the resin [49,53] and could also increase the volume of resin to be incorporated. In this context, the lower the number of resin regenerations, the less intensive the loss of adsorption capacity [13], which may imply a lower proportion of reincorporation. Secondly, this number of regenerations also requires less use of reagents, therefore bringing a reduction in the total costs of water production. Overall, this would optimize the resin regeneration procedure, which would be required only every 156 h, when the concentration of boron in the total accumulated effluent exceeds the phytotoxicity threshold.
3.5. On-Farm Ion Exchange Resin Economic Cost
The costs of the studied on-farm boron reduction system, D1, and the scaled-up system, D2, are summarized in Figure 8. The depreciation costs depended mainly on the type of resin selected and on the scale of the equipment [39]. D1 showed a depreciation cost of EUR 0.709/m3 (EUR 4963/year), whereas D2 showed a lower depreciation cost of EUR 0.065/m3 (EUR 9100/year). The reagent costs were principally influenced by the amount of HCl and NaOH needed to regenerate the resin and the number of regenerations performed, which mainly depended on the volume of resin in the column, the boron concentration in the feed water, the flow rate established and the passage of operating time. In this case, reagent costs were EUR 0.070/m3 (EUR 490/year) and EUR 0.140/m3 (EUR 19,600/year) for D1 and D2, respectively. The costs for D1 considered a regeneration procedure every 50 h. Great variability in terms of the cost of reagents has also been observed depending on the type of reagents used for regeneration [49], and the resin itself [39]. Nevertheless, optimization of the used reagents considering a regeneration every 156 h in D1 (Figure 7) diminished the cost to EUR 0.022/m3 (EUR 154/year). Furthermore, this management would also avoid the need to supply boron during the reconditioning of the water produced for irrigation, since DSW is highly demineralized [2] during the desalination process at coastal plants. The maintenance costs decreased from EUR 0.123/m3 (EUR 861/year) in the case of D1 to EUR 0.020/m3 (EUR 2800/year) in the case of D2.
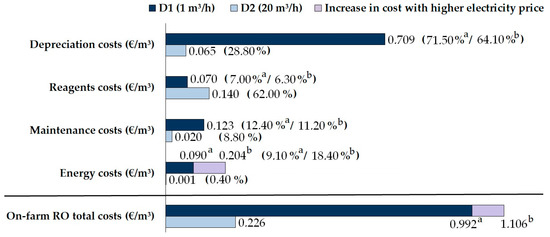
Figure 8.
Depreciation and specific operating costs for the D1 (with regeneration every 50 h) and D2 boron removal systems. The superscripts a and b indicate the variation in each cost considering lower (EUR 0.134/kW·h) and higher electricity prices (EUR 0.30/kW·h), respectively.
The energy cost was also substantially high for D1 (EUR 0.090/m3) compared to D2 since higher operating flows could diminish it by 99% (EUR 0.001/m3). This is due to the low energy consumed by the system to run the water through the resin column [19,39,40]. However, the energy cost for D1 when the electricity price reached EUR 0.30/kW·h was EUR 0.204/m3, i.e., an increase in the energy cost of 127%. This variation caused an increase in the energy cost from 9.10% to 18.40% in relation to the total production cost and, in proportion, a decrease in the depreciation cost (from 71.50% to 64.10%) and a slight reduction in the reagent and maintenance costs (from 12.40% to 11.20% and from 7% to 6.30%, respectively).
In summary, assuming an energy cost of EUR 0.134/kW·h, the total production costs for D1 were EUR 0.992/m3 (EUR 6944/year) with regeneration every 50 h, and EUR 0.944/m3 (EUR 6608/year) with regeneration every 156 h. The abovementioned increase in the electricity price would increase the total costs to EUR 1.106/m3 and EUR 1.058/m3, respectively. The total cost for D2 was substantially lower, at EUR 0.226/m3 (EUR 31,640/year), highlighting the importance of scaling up the results to a commercial size. In particular, the depreciation costs represented 71.5% of the total costs in D1, in contrast to only 28.8% in the case of D2, in which the reagent costs were 62% of the total costs (Figure 8).
When comparing with previous studies, significant differences between two-stage (RO–IX) desalination processes at coastal plants and lower-scale systems were found. Chillón et al. [39] estimated an overall cost of around EUR 0.1/m3 at the laboratory scale, treating a flow rate below 160 L/h and a feed boron concentration of around 1.9 mg/L. On a larger scale, Nadav [31] showed slightly higher costs (between EUR 0.053 and EUR 0.071/m3) considering a feed boron concentration of around 1.8 mg/L and a treated production of 10,000 m3/day. In this context, Jacob [19] built an economic model to study the cost of boron removal systems with a two-stage RO–IX procedure, finding a total cost of EUR 0.027/m3 for the IX stage, considering a feed boron concentration of around 8 mg/L and a treated production of 37,270 m3/day. These results are in agreement with the higher overall costs of small–medium-scale systems such as D1, and the cost reductions achieved by other larger-scale systems such as D2.
4. Conclusions
This work assessed the technical and economic viability of performing boron removal with a novel on-farm ion exchange resin system (IX; AmberLiteTM PWA10), with a flow capacity of 1 m3/h, an operation pressure of 2.5–3 bar, a neutral pH and two feed water temperatures of 6 and 26 °C, to achieve a boron concentration below the threshold of sensitive crops (0.5 mg/L). The IX column kept the ion concentrations of the feed water constant, except for boron which was effectively removed. The total concentration of boron was eliminated over 41 h of operation, without being affected by the water temperature variation. However, in the tests at 26 °C, a more rapid saturation of the resin was observed, although the saturation point was reached at very similar operating times. This study also showed that the effluent should be managed with the aid of reservoirs, as this allows reducing the number of regeneration processes and hence the reagent costs while obtaining a minimum concentration of boron in the irrigation water, which is necessary for the development of crops. Concerning economic costs, depreciation was the most significant cost for the trial-scale system (flow = 1 m3/h), which can be significantly reduced for a commercial-scale system such as D2 (flow = 20 m3/h). The estimated on-farm values (D1: EUR 0.992/m3; D2: EUR 0.226/m3) still exceeded the reported cost of boron removal at coastal desalination plants.
The results presented in this article provide novel guidance on the feasibility of implementing on-farm boron removal by IX resin systems when DSW is provided by coastal desalination plants with boron concentrations above the crop tolerance. However, further research is needed to assess how several regeneration procedures may reduce the performance and durability of the resin, and the costs incurred by the need for its continuous regeneration and its reincorporation every year. In addition, other alternative systems such as hybrid RO and IX processes could also be evaluated at a farm scale.
Author Contributions
Conceptualization, J.F.M.-V.; data curation, A.I.-M. and J.F.M.-V.; formal analysis, A.I.-M.; funding acquisition, B.G.-E. and J.F.M.-V.; investigation, B.G.-E., V.M.-Á., B.M.-G., R.M.-d.-T. and F.J.J.-C.; methodology, B.G.-E., V.M.-Á., B.M.-G., R.M.-d.-T., F.J.J.-C. and J.F.M.-V.; project administration, J.F.M.-V.; writing—original draft, A.I.-M.; writing—review and editing, A.I.-M., B.G.-E., V.M.-Á., B.M.-G., F.J.J.-C. and J.F.M.-V. All authors have read and agreed to the published version of the manuscript.
Funding
This research and the APC were funded by the Ministry for Science and Innovation and the State Research Agency (MCIN/AEI/10.13039/501100011033, Spain) and the European Regional Development Fund (ERDF, EU) under the projects SEARRISOST (RTC-2017-6192-2) and SEA4CROP (PID2020-118492RA-C22). Imbernón-Mulero acknowledges the support for his PhD work from the project SEA4CROP and the predoctoral program of the Technical University of Cartagena (RV-484/21, UPCT, Spain). B. Gallego-Elvira acknowledges the support from the Spanish Ministry of Universities (“Beatriz Galindo” Fellowship BEAGAL18/00081).
Institutional Review Board Statement
Not applicable.
Informed Consent Statement
Not applicable.
Data Availability Statement
Not applicable.
Acknowledgments
The collaboration of Catedra Trasvase y Sostenibilidad—Jose Manuel Claver Valderas is acknowledged.
Conflicts of Interest
The authors declare no conflict of interest.
Appendix A
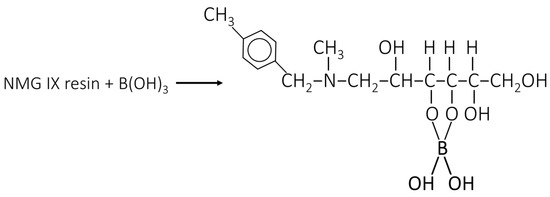
Figure A1.
Boron adsorption mechanism of NMG IX resins [12].
Appendix B
This appendix presents the volumes of HCl and NaOH to be added to the input DSW during the two-stage regeneration procedure. The regeneration summary was provided by the manufacturer according to the resin column characteristics, and it was suggested after 50 h of operation. The density of 32 wt% HCl is 1.49 kg/L, and that of 50 wt% NaOH is 1.52 kg/L.
Table A1.
Regeneration procedure suggested for AmberLiteTM PWA10.
Table A1.
Regeneration procedure suggested for AmberLiteTM PWA10.
| Phase | Volume | Time |
|---|---|---|
| Backwash water (optional) | ||
| Backwash flow rate | 0.30 m3/h | 5 min |
| Backwash water volume | 0.03 m3/h | |
| Acid injection (32 wt% HCl) | ||
| Flow rate | 0.07 m3/h | 40 min |
| Water volume | 0.05 m3/h | |
| Acid volume | 1.8 L | |
| Rinse (acid displacement) | ||
| Flow rate | 0.13 m3/h | 45 min |
| Water volume | 0.01 m3 | |
| Caustic injection (50 wt% NaOH) | ||
| Flow rate | 0.11 m3/h | 30 min |
| Water volume | 0.05 m3 | |
| Caustic volume | 1 L | |
| Rinse (caustic displacement) | ||
| Flow rate | 0.13 m3/h | 45 min |
| Water volume | 0.01 m3 | |
| Final rinse | ||
| Flow rate | 1 m3/h | 10 min |
| Water volume | 0.17 m3/h | |
| Total | 0.32 m3/h | 175 min |
References
- Jones, E.; Qadir, M.; van Vliet, M.T.; Smakhtin, V.; Kang, S.M. The state of desalination and brine production: A global outlook. Sci. Total Environ. 2019, 657, 1343–1356. [Google Scholar] [CrossRef] [PubMed]
- Martínez-Álvarez, V.; Maestre-Valero, J.F.; González-Ortega, M.J.; Gallego-Elvira, B.; Martín-Gorriz, B. Characterization of the Agricultural Supply of Desalinated Seawater in Southeastern Spain. Water 2019, 11, 1233. [Google Scholar] [CrossRef] [Green Version]
- Borokhov-Akerman, E.; Simhon, M.V.; Gitis, V. Advanced treatment options to remove boron from seawater. Desalin. Water Treat. 2012, 46, 285–294. [Google Scholar] [CrossRef]
- Freger, V.; Shemer, H.; Sagiv, A.; Semiat, R. Chapter 8–Boron Removal Using Membranes. In Boron Separation Processes; Elsevier: Amsterdam, The Netherlands, 2015; pp. 199–217. [Google Scholar]
- Martínez-Álvarez, V.; Martín-Gorriz, B.; Soto-García, M. Seawater desalination for crop irrigation—A review of current experiences and revealed key issues. Desalination 2016, 381, 58–70. [Google Scholar] [CrossRef]
- Koseoglu, H.; Kabay, N.; Yüksel, M.; Sarp, S.; Arar, Ö.; Kitis, M. Boron removal from seawater using high rejection SWRO membranes—Impact of pH, feed concentration, pressure, and cross-flow velocity. Desalination 2008, 227, 253–263. [Google Scholar] [CrossRef]
- Chillón-Arias, M.F.; Valero i Bru, L.; Prats-Rico, D.; Varó-Galvañ, P. Comparison of ion exchange resins used in re-duction of boron in desalinated water for human consumption. Desalination 2011, 278, 244–249. [Google Scholar] [CrossRef]
- Farhat, A.; Ahmad, F.; Hilal, N.; Arafat, H.A. Boron removal in new generation reverse osmosis (RO) membranes using two-pass RO without pH adjustment. Desalination 2013, 310, 50–59. [Google Scholar] [CrossRef]
- Kürklü, S.; Velioğlu, S.; Ahunbay, M.G.; Tantekin-Ersolmaz, S.B.; Krantz, W.B. A novel energy-efficient concurrent desalination and boron removal (CDBR) process. Desalination 2017, 423, 79–94. [Google Scholar] [CrossRef]
- Kurkdjian, A.; Guern, J. Intracellular pH: Measurement and Importance in Cell Activity. Annu. Rev. Plant Physiol. Plant Mol. Biol. 1989, 40, 271–303. [Google Scholar] [CrossRef]
- García-Sánchez, F.; Simón-Grao, S.; Martínez-Nicolás, J.J.; Alfosea-Simón, M.; Liu, C.; Chatzissavvidis, C.; Pérez-Pérez, J.G.; Cámara-Zapata, J.C. Multiple stresses occurring with boron toxicity and deficiency in plants. J. Hazard. Mater. 2020, 397, 122713. [Google Scholar] [CrossRef]
- Hussain, A.; Sharma, R.; Minier-Matar, J.; Hirani, Z.; Adham, S. Application of emerging ion exchange resin for boron removal from saline groundwater. J. Water Process 2009, 32, 100906. [Google Scholar] [CrossRef]
- Wang, Z.; Jia, Y.; Song, W.; Li, S.; Xu, K.; Wang, Z. Optimization of boron adsorption from desalinated seawater onto UiO-66-NH2/GO composite adsorbent using response surface methodology. J. Clean. Prod. 2021, 300, 126974. [Google Scholar] [CrossRef]
- Rioyo, J.; Aravinthan, V.; Bundschuh, J.; Lynch, M. ‘High-pH softening pretreatment’ for boron removal in inland desalination systems. Sep. Purif. Technol. 2018, 205, 308–316. [Google Scholar] [CrossRef]
- Rodríguez Pastor, M.; Ferrándiz-Ruiz, A.; Chillón, M.F.; Prats-Rico, D. Influence of pH in the elimination of boron by means of reverse osmosis. Desalination 2001, 140, 145–152. [Google Scholar] [CrossRef]
- Gimeno, V.; Simón, I.; Nieves, M.; Martínez, V.; Cámara-Zapata, J.M.; García-Torres, A.L.; García-Sánchez, F. The physiological and nutritional responses to an excess of boron by Verna lemon trees that were grafted on four contrasting rootstocks. Trees 2012, 26, 1513–1526. [Google Scholar] [CrossRef]
- Yoshinari, A.; Takano, J. Insights into the mechanisms underlying boron homeostasis in plants. Front. Plant Sci. 2017, 8, 1951. [Google Scholar] [CrossRef] [Green Version]
- Nable, R.O.; Banuelos, G.S.; Paull, J.G. Boron toxicity. Plant Soil 1997, 193, 181–198. [Google Scholar] [CrossRef]
- Jacob, C. Seawater desalination: Boron removal by ion exchange technology. Desalination 2007, 205, 47–52. [Google Scholar] [CrossRef]
- Gorenflo, A.; Brusilovsky, M.; Faigon, M.; Liberman, B. High pH operation in seawater reverse osmosis permeate: First results from the world’s largest SWRO plant in Ashkelon. Desalination 2007, 203, 82–90. [Google Scholar] [CrossRef]
- Hilal, N.; Kim, G.J.; Somerfield, C. Boron removal from saline water: A comprehensive review. Desalination 2011, 273, 23–35. [Google Scholar] [CrossRef]
- Güler, E.; Kaya, C.; Kabay, N.; Arda, M. Boron removal from seawater: State-of-the-art review. Desalination 2015, 356, 85–93. [Google Scholar] [CrossRef]
- Najid, N.; Kouzbour, S.; Ruiz-García, A.; Fellaou, S.; Gourich, B.; Stiriba, Y. Comparison analysis of different technologies for the removal of boron from seawater: A review. J. Environ. Chem. Eng. 2021, 9, 105133. [Google Scholar] [CrossRef]
- Kabay, N.; Sarp, S.; Yuksel, M.; Kitis, M.; Koseiglu, H.; Arar, O.; Brujak, M.; Semiat, R. Removal of boron from SWRO permeate by boron selective ion exchange resins containing N-methyl glucamine groups. Desalination 2008, 223, 49–56. [Google Scholar] [CrossRef]
- Jing, Z.; Peng, Y.; He, R.; Xu, Y.; Yu, T.; Hu, K. Popular leaves reclamation for porous granules and their application in nitrobenzene removal from aqueous solution. Desalin. Water Treat. 2016, 57, 449–458. [Google Scholar]
- Myachina, M.A.; Polyakova, Y.A.; Gavrilova, N.N.; Nazarov, V.V.; Kolesnikov, V.A. ZrO2–Carbon nanotubes composite sorbent for treatment of aqueous solutions to remove boron. Russ. J. Appl. Chem. 2017, 90, 895–900. [Google Scholar] [CrossRef]
- Bang, Y.-K.; Park, C.; Hang, J.; Lee, T.; Choi, Y.; Jung, J.; Kim, H.-L. Synthesis of chelate resins with multiple functional groups based on simplified reaction using mixed solvent and their improved boron adsorption characteristics. Polymer-Korea 2020, 44, 334–341. [Google Scholar] [CrossRef]
- Korkmaz, M.; Ozmetin, C.; Ozmetin, E.; Suzen, Y. Modelling of boron removal from solutions by ion exchange for column reactor design in boron mine wastewater treatment. Desalin. Water Treat. 2020, 179, 63–74. [Google Scholar] [CrossRef]
- Zhang, W.; Liu, C.; Chen, Y.; Wu, W. Removal of boron from water by Mg-Al-Ce hydrotalcite adsorption. J. Inorg. Mater. 2020, 35, 337–344. [Google Scholar]
- Bornak, B. Desalination by Ion Exchange. In Desalination: Water from Water; John Wiley & Sons, Inc.: Hoboken, NJ, USA, 2014; pp. 503–520. [Google Scholar]
- Nadav, N. Boron removal from seawater reverse osmosis permeate utilizing selective ion exchange resin. Desalination 1999, 124, 131–135. [Google Scholar] [CrossRef]
- Yılmaz, A.; Boncukcuoglu, R.; Yılmaz, M.; Kocakerim, M. Adsorption of boron from boron-containing wastewaters by ion exchange in a continuous reactor. J. Hazard. Mater. 2005, 117, 221–226. [Google Scholar] [CrossRef]
- Darwish, N.; Kochkodan, V.; Hilal, N. Boron removal from water with fractionized Amberlite IRA743 resin. Desalination 2015, 370, 1–6. [Google Scholar] [CrossRef]
- Glueckstern, P.; Priel, M. Optimization of boron removal in old and new SWRO systems. Desalination 2003, 156, 219–228. [Google Scholar] [CrossRef]
- Kabay, N.; Bryjak, M.; Chosser, S.; Kitis, M.; Avlonitis, S.; Matejka, Z.; Mitaz, A.; Tuksel, M. Adsoption-membrane filtration (AMF) hybrid process for boron removal from seawater. An overview. Desalination 2008, 223, 38–48. [Google Scholar] [CrossRef]
- Turek, M.; Bandura, B.; Dydo, P. Electroanalytic boron removal from SWRO permeate. Desalination 2008, 223, 17–22. [Google Scholar] [CrossRef]
- Kayaci, S.; Tantekin-Ersolmaz, M.; Ahunbay, G.; Krantz, W.B. Technical and economic feasibility of the concurrent desalination and boron removal (CDBR) process. Desalination 2020, 486, 114474. [Google Scholar] [CrossRef]
- Subban, C.V.; Gadgil, A.J. Electrically regenerated ion-exchange technology for desalination of low-salinity water sources. Desalination 2019, 465, 38–43. [Google Scholar] [CrossRef]
- Chillón-Arias, M.F.; Valero-i-Bru, L.; Prats-Rico, D.; Varó-Galvañ, P. Approximate cost of the elimination of boron in desalinated water by reverse osmosis and ion exchange resins. Desalination 2011, 273, 421–427. [Google Scholar] [CrossRef]
- Nadav, N.; Koutsakos, E. Innovative design of the UF and SWRO Limassol desalination plant in Cyprus. Desalin. Water Treat. 2013, 51, 95–100. [Google Scholar] [CrossRef]
- Soliman, M.N.; Guen, F.; Ahmed, S.; Saleem, H.; Khalil, M.; Zaidi, S. Energy consumption and environmental impact assessment of desalination plants and brine disposal strategies. Process Saf. Environ. Prot. 2021, 147, 589–608. [Google Scholar] [CrossRef]
- Kamboh, M.; Yilmaz, M. Synthesis of N-methylglucamine functionalized calix[4]arene based magnetic sporopollenin for the removal of boron from aqueous environment. Desalination 2013, 310, 67–74. [Google Scholar] [CrossRef]
- Yilmaz, I.; Kabay, N.; Yüksel, M. Modeling of fixed bed column studies for removal of boron from geothermal water by selective chelating ion exchange resins. Desalination 2013, 310, 151–157. [Google Scholar] [CrossRef]
- De la Fuente, M.M. Diseño y Desarrollo de un Sistema de Tratamiento para la Eliminación de boro en Vertidos Industriales. Ph.D. Thesis, Autonomous University of Madrid, Madrid, Spain, 2000. [Google Scholar]
- Simonnot, M.O.; Castel, C.; Nicolai, M.; Rosin, C.; Sardin, M.; Jauffret, H. Boron removal from drinking water with a boron selective resin: Is the treatment really selective? Water Res. 2000, 34, 109–116. [Google Scholar] [CrossRef]
- Yan, C.; Yi, W.; Ma, P.; Deng, X.; Li, F. Removal of boron from refined brine by using selective ion exchange resins. J. Hazard. Mater. 2008, 154, 564–571. [Google Scholar] [CrossRef] [PubMed]
- Öztürk, N.; Köse, T.E. Boron removal from aqueous solutions by ion-exchange resin: Batch studies. Desalination 2008, 227, 233–240. [Google Scholar] [CrossRef]
- Parada, F.; Dreisinger, D.; Wilkomirsky, I. Evaluación de resinas de intercambio iónico para el control del hierro en soluciones de electro-obtención de cobre. Rev. Metal. 2010, 46, 331–339. [Google Scholar] [CrossRef] [Green Version]
- Kalaitzidou, K.; Tzika, A.M.; Simeonidis, K.; Mitrakas, M. Evaluation of boron uptake by anion exchange resins in tap and geothermal water matrix. Mater. Today Proc. 2018, 5, 27599–27606. [Google Scholar] [CrossRef]
- Disposiciones Normativas del Plan Hidrológico de la Demarcación Hidrográfica del Segura. Tercer Ciclo (2022–2027). Available online: https://www.chsegura.es/export/sites/chs/descargas/planificacionydma/planificacion21-27/docsdescarga/docplan2127/Normativa/Normativa_PH_Segura_2022-2027.pdf (accessed on 28 April 2022).
- Köse, T.E.; Öztürk, N. Boron removal from aqueous solutions by ion-exchange resin: Column sorption–elution studies. J. Hazard. Mater. 2008, 152, 744–749. [Google Scholar] [CrossRef]
- Liu, Y.L.; Sun, M. Ion exchange removal and resin regeneration to treat per- and polyfluoroalkyl ether acids and other emerging PFAS in drinking water. Water Res. 2021, 207, 11781. [Google Scholar] [CrossRef]
- Pinelli, D.; Bovina, S.; Rubertelli, G.; Martinelli, A.; Guida, S.; Soares, A.; Frascari, D. Regeneration and modelling of a phosphorous removal and recovery hybrid ion exchange resin after long term operation with municipal wastewater. Chemosphere 2022, 286, 1331581. [Google Scholar] [CrossRef]
- Chandrasekara, N.P.G.N.; Pashley, R.M. Study of a new process for the efficient regeneration of ion exchange resins. Desalination 2015, 357, 131–139. [Google Scholar] [CrossRef] [Green Version]
- Taniguchi, M.; Fusaoka, Y.; Nishikawa, T.; Kurihara, M. Boron removal in RO seawater desalination. Desalination 2004, 167, 419–426. [Google Scholar] [CrossRef]
- Bonin, L.; Deduytsche, D.; Wolthers, M.; Flexer, V.; Rabaey, K. Boron extraction using selective ion exchange resins enables effective magnesium recovery from lithium rich brines with minimal lithium los. Sep. Purif. Technol. 2021, 275, 119177. [Google Scholar] [CrossRef]
- Gallego-Elvira, B.; Martínez-Álvarez, V.; Pittaway, P.; Brink, G.; Martin-Gorriz, B. Impact of Micrometeorological Conditions on the Efficiency of Artificial Monolayers in Reducing Evaporation. Water Resour. Manag. 2013, 27, 2251–2266. [Google Scholar] [CrossRef]
Publisher’s Note: MDPI stays neutral with regard to jurisdictional claims in published maps and institutional affiliations. |
© 2022 by the authors. Licensee MDPI, Basel, Switzerland. This article is an open access article distributed under the terms and conditions of the Creative Commons Attribution (CC BY) license (https://creativecommons.org/licenses/by/4.0/).