Article

Evaluation of Pedotransfer Functions for Estimating Soil Water Retention Curve of Ap Horizon Soils for Various Soil Series of Reclaimed Tidal Flat Soil

1
Department of Bio-Environmental Chemistry, College of Agriculture and Life Sciences, Chungnam National University, Daejeon 34134, Korea
2
Institute of Agriculture Science, Chungnam National University, Daejeon 34134, Korea
3
National Agricultural Cooperative Federation, Seoul 04517, Korea
4
Kangwon Institute of Inclusive Technology, Kangwon National University, Chuncheon 24341, Korea
5
National Institute of Crop Science, Rural Development Administration (RDA), Wanju-Gun 55365, Korea
6
Department of Rural and Bio-Systems Engineering & Education and Research Unit for Climate-Smart Reclaimed-Tideland Agriculture (Brain Korea 21), Chonnam National University, Gwangju 61186, Korea
7
Department of Biological Environment, College of Agriculture and Life Science, Kangwon National University, Chuncheon 24341, Korea
*
Authors to whom correspondence should be addressed.
Agronomy 2022, 12(7), 1507; https://doi.org/10.3390/agronomy12071507
Submission received: 26 May 2022 / Revised: 22 June 2022 / Accepted: 22 June 2022 / Published: 23 June 2022

Abstract

:
This investigation was to evaluate the applicability and prediction accuracy of pedotransfer function (PTF) to estimate the water retention curves of Ap horizon soils for five soil series which cannot be directly used to cultivate upland crops other than rice because of their high salinity. Soil water retention curves (SWRCs) were obtained from 150 undisturbed soil samples collected from the Ap horizons of which soil textures were grouped into sandy loam with high contents of sand (>60%) and low clay contents (<10%) and silt loam with relatively high silt content (>60%) and low sand content (<10%). Soil-water retention characteristics between 0 to −50 kPa and −50 to −1500 kPa were measured using the sandbox, kaolin-plate, and pressure chamber methods, respectively. The SWRCs were also estimated by Rawls and Brakensiek PTF (RB-PTF). The measured SWRCs of sandy loam and silt loam were compared against those obtained from RB-PTF. The SWRCs estimated with the modeled data closely fit the measured data of sandy loam and silt loam although saturated volume water content (θs) and residual volume water content (θr) of RB-PTF were higher than those of the measured mean for both soil textures. The air entry point (α) and the steepness of the water-retention curve (n) were higher in sandy loam than those of silt loam. SWRCS estimated by the RB-PTF yielded the best fit of all soil samples from the five series, whereas the MBE values less than zero indicate that θv measured at the water potentials is under-predicted. The r2 values greater than 0.9 for sandy loam and silt loam represent RB-PTF and are suitable for predicting SWRCs in RTFS because the measured data points do not vary around the estimated regression line.

1. Introduction

In Korea, most of the physical properties of Ap horizon soils in reclaimed tidal flat soils (RTFS) which are typically sandy soils with low organic matter contents (<1.0%) cannot be directly used to cultivate upland crops other than rice because of their high salinity (>6 dS m−1) caused by a capillary rise from the shallow saline water table close to Ap horizon in RTFS. Considering the importance of the importance of soil water retention curves for crop production and soil management in RTFS, we need to develop the best method in order to estimate the soil hydraulic properties of Ap horizon soils of various soil series in RTFS. However, these properties are hard to measure and usually require the use of both indirect and direct methods to properly describe them. However, few studies related to the estimation of soil hydraulic properties have been performed for soils in RTFS because direct measurements of the soil water content for each matric potential are time and labor consuming and unfeasible over RTFS consisting of various soil series. Thus, alternative methods must be developed to estimate the SWRC for RTFS.
Soil hydraulic properties can be estimated by a representative set of soils with associated descriptions and measurements that are readily available from detailed laboratory measurements of soil hydraulic properties. Then, based on laboratory data, a mathematical function is chosen to estimate soil hydraulic parameters for other soils with similar field information [1]. For larger areas, the most widely used method to obtain hydraulic properties is the use of Pedotransfer functions (PTFs) [2].
Pedotransfer functions (PTFs) can be used to predict the water content at a particular matric potential [3,4,5,6] or available water capacity (AWC) [6]. Other PTFs have been developed to predict the parameters of equations, such as those of Brooks and Corey [7] and van Genuchten [8], which describe the SWRCs, e.g., Rawls and Brakensiek [9], van den Berg et al. [6], and Tomasella et al. [10]. Most of the PTFs to predict Brooks and Corey (BC) or vG parameters have been developed using extensive databases for the soils to estimate the full range of SWRC (0 to −1500 kPa) [11,12]. The vG equation proposed by van Genuchten needs four independent parameters (α, n, θs, and θr). Most of the PTFs to predict vG parameters have been developed using extensive databases for the soils. The PTF of Rawls and Brakensiek [9] has been known to be valid for soils with a clay content of 5–60% and a sand content of 5–70% [13].
The parameters such as α, n, and θr for the vG equation are obtained by the non-linear regression of the equation using measured SWRC data [14], whereas saturated volume water content (θs) is obtained by the weight–volume relationships (θs = porosity) [15]. The RETC (RETention Curve) code, a widely used computer program, uses a nonlinear least-squares optimization approach to estimate the unknown model parameters from observed retention data when measured soil water content, along with soil water retention data are available [11,16].
The aim of this study was to evaluate the general applicability and the prediction accuracy of Rawls and Brakensiek PTF (RB-PTF) to estimate the water retention curve of Ap horizon soils for five soil series using the parameters of the vG equation obtained from the measured SWRC corresponding absolute value of matric potential h from permanent wilting point to saturation in the laboratory

2. Materials and Methods

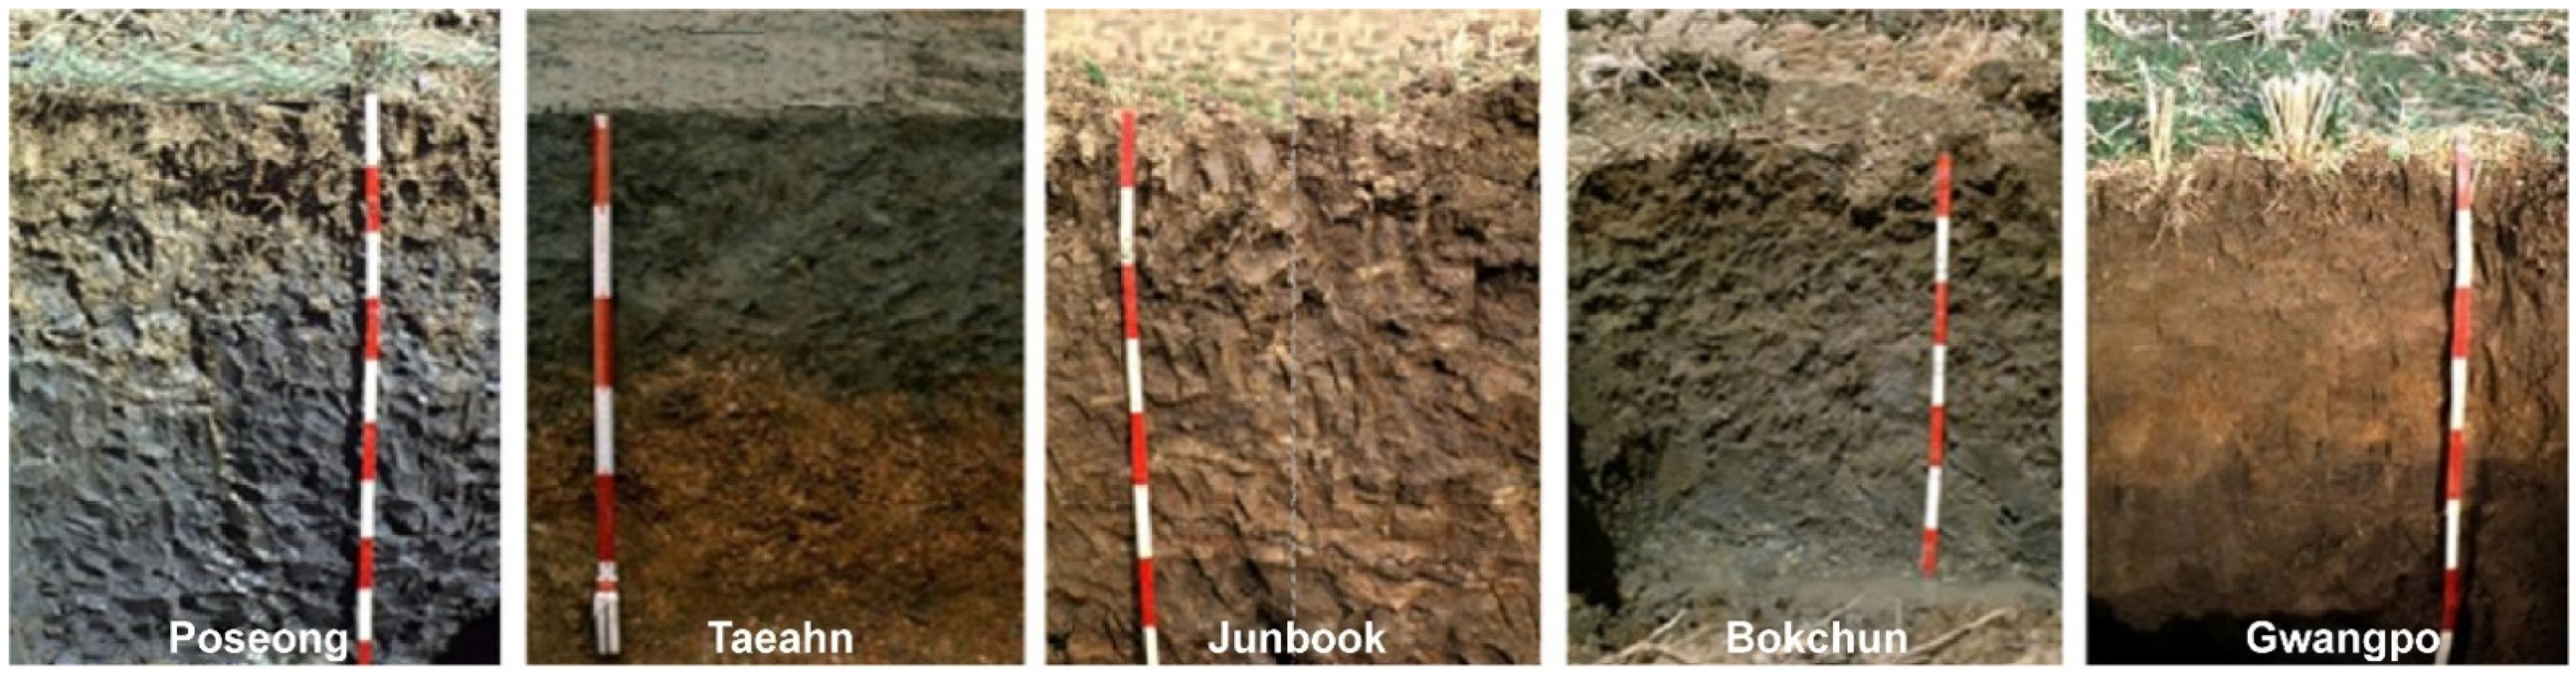
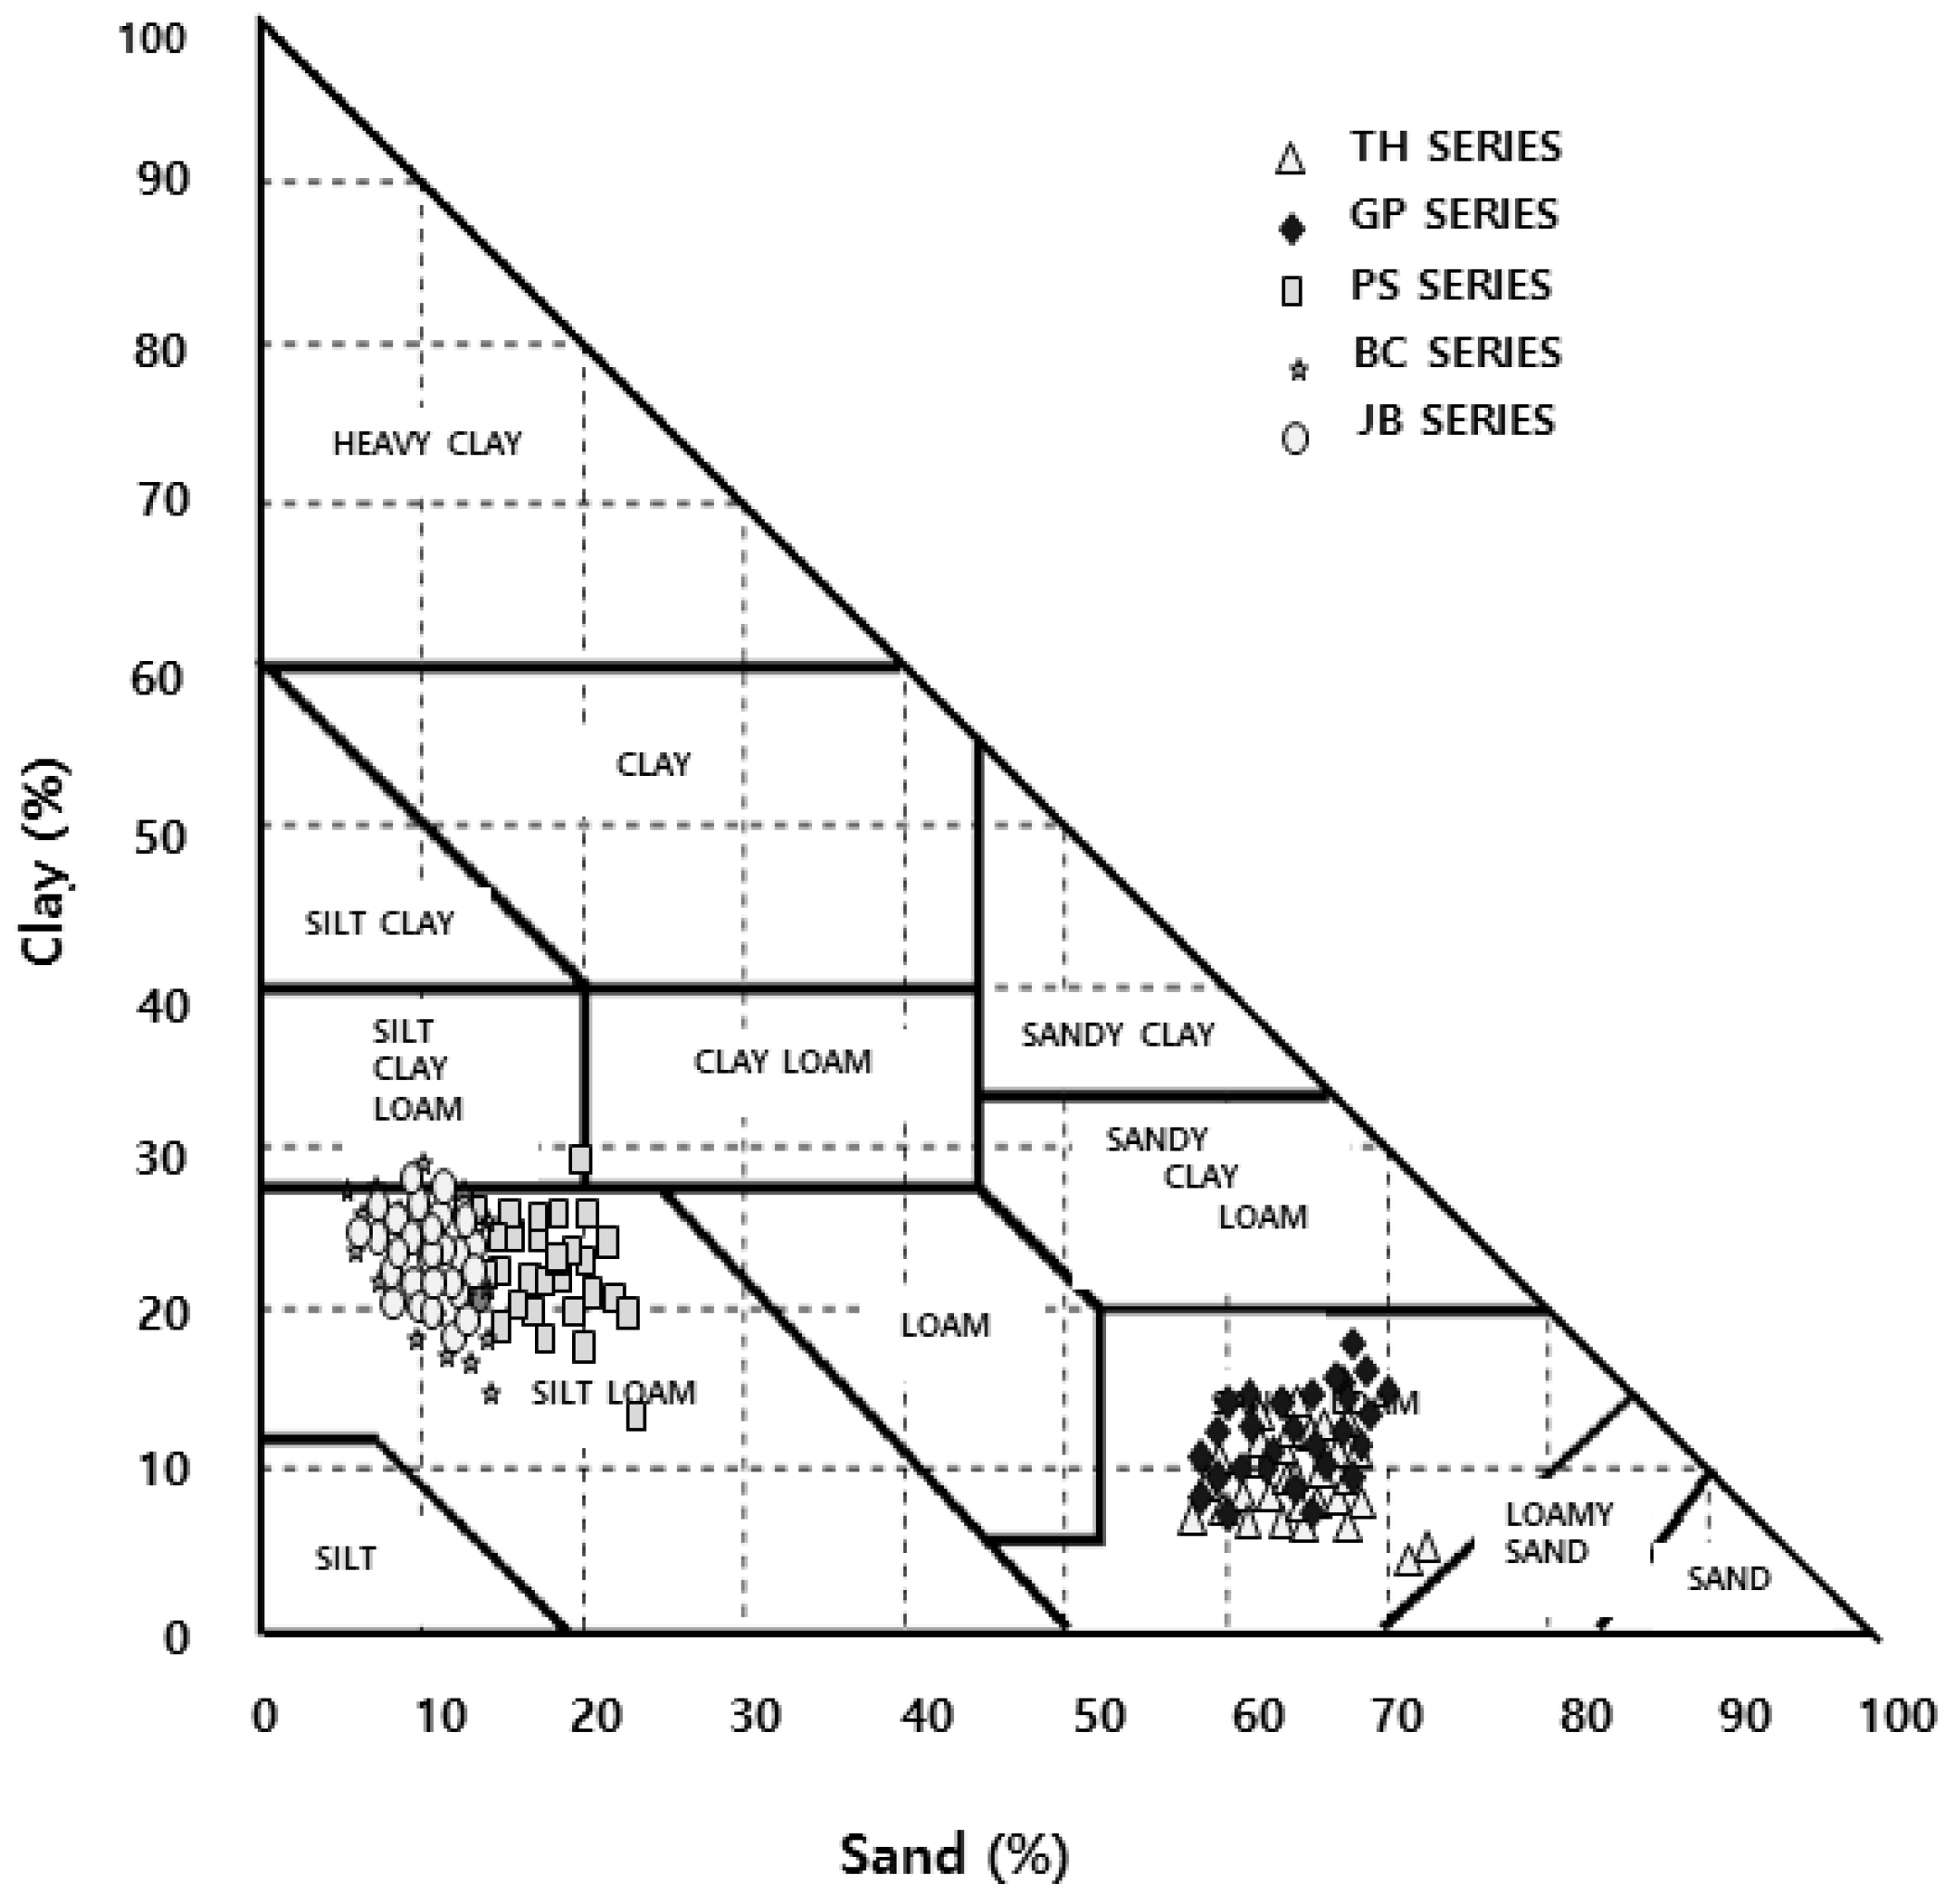
2.1. Geographical Study Area, Soil Sampling, and Soil Properties

The investigated area of RTFS which consists of five different soil series was located in Haenam Bay (Latitude: 34°38′31.09″ N, Longitude: 126°30′13.10″ E) was approximately 750 ha in which there are no salt marshes, barrier islands, or major river drainage systems [17]. The soil series in RTFS are; Taeahn (TH, coarse loamy, mixed, and mesic family of Aquic Udorthents), Gwangpo (GP, coarse loamy, mixed, nonacid, and mesic family of Fluventic Haplaquepts), Poseong (PS, fine silty, mixed, nonacid, and mesic family of Typic Haplaquepts), Junbook (JB, fine, silty mixed, nonacid, and mesic family of Typic Haplaquepts), and Bokchun (BC, fine, silty mixed, nonacid, and mesic family of Typic Haplaquepts). The profiles of each soil series are shown in Figure 1.
For soil properties (sand, silt, clay, BD, and OM), a total of 150 undisturbed soil core samples (US) were collected using stainless steel cylinders (5.1 cm diameter and 5.0 cm height) at 30 identifiable Ap horizons from each soil series for five soil series. Another 150 US were also taken for measurement of soil water retention curves using a soil core sampler with two wedge coring tips (Soil sampler 200, Soil moisture Equipment Corp., Goleta, CA, USA). Table 1 and Table 2 present the soil profile descriptions including soil horizon, soil texture, and soil structure for the five-soil series that were obtained by the procedures of the Soil Survey Manual [18], and Figure 1 shows the texture distribution plotted on the textural triangle. The soil texture and organic matter (OM) were determined by the hydrometer [19] and the Walkley–Black [20] methods, respectively. BD was determined after drying the US at 105 °C for 48 h. The porosities were calculated in accordance with the measured bulk density and particle density (2.65 g cm−3) [21].

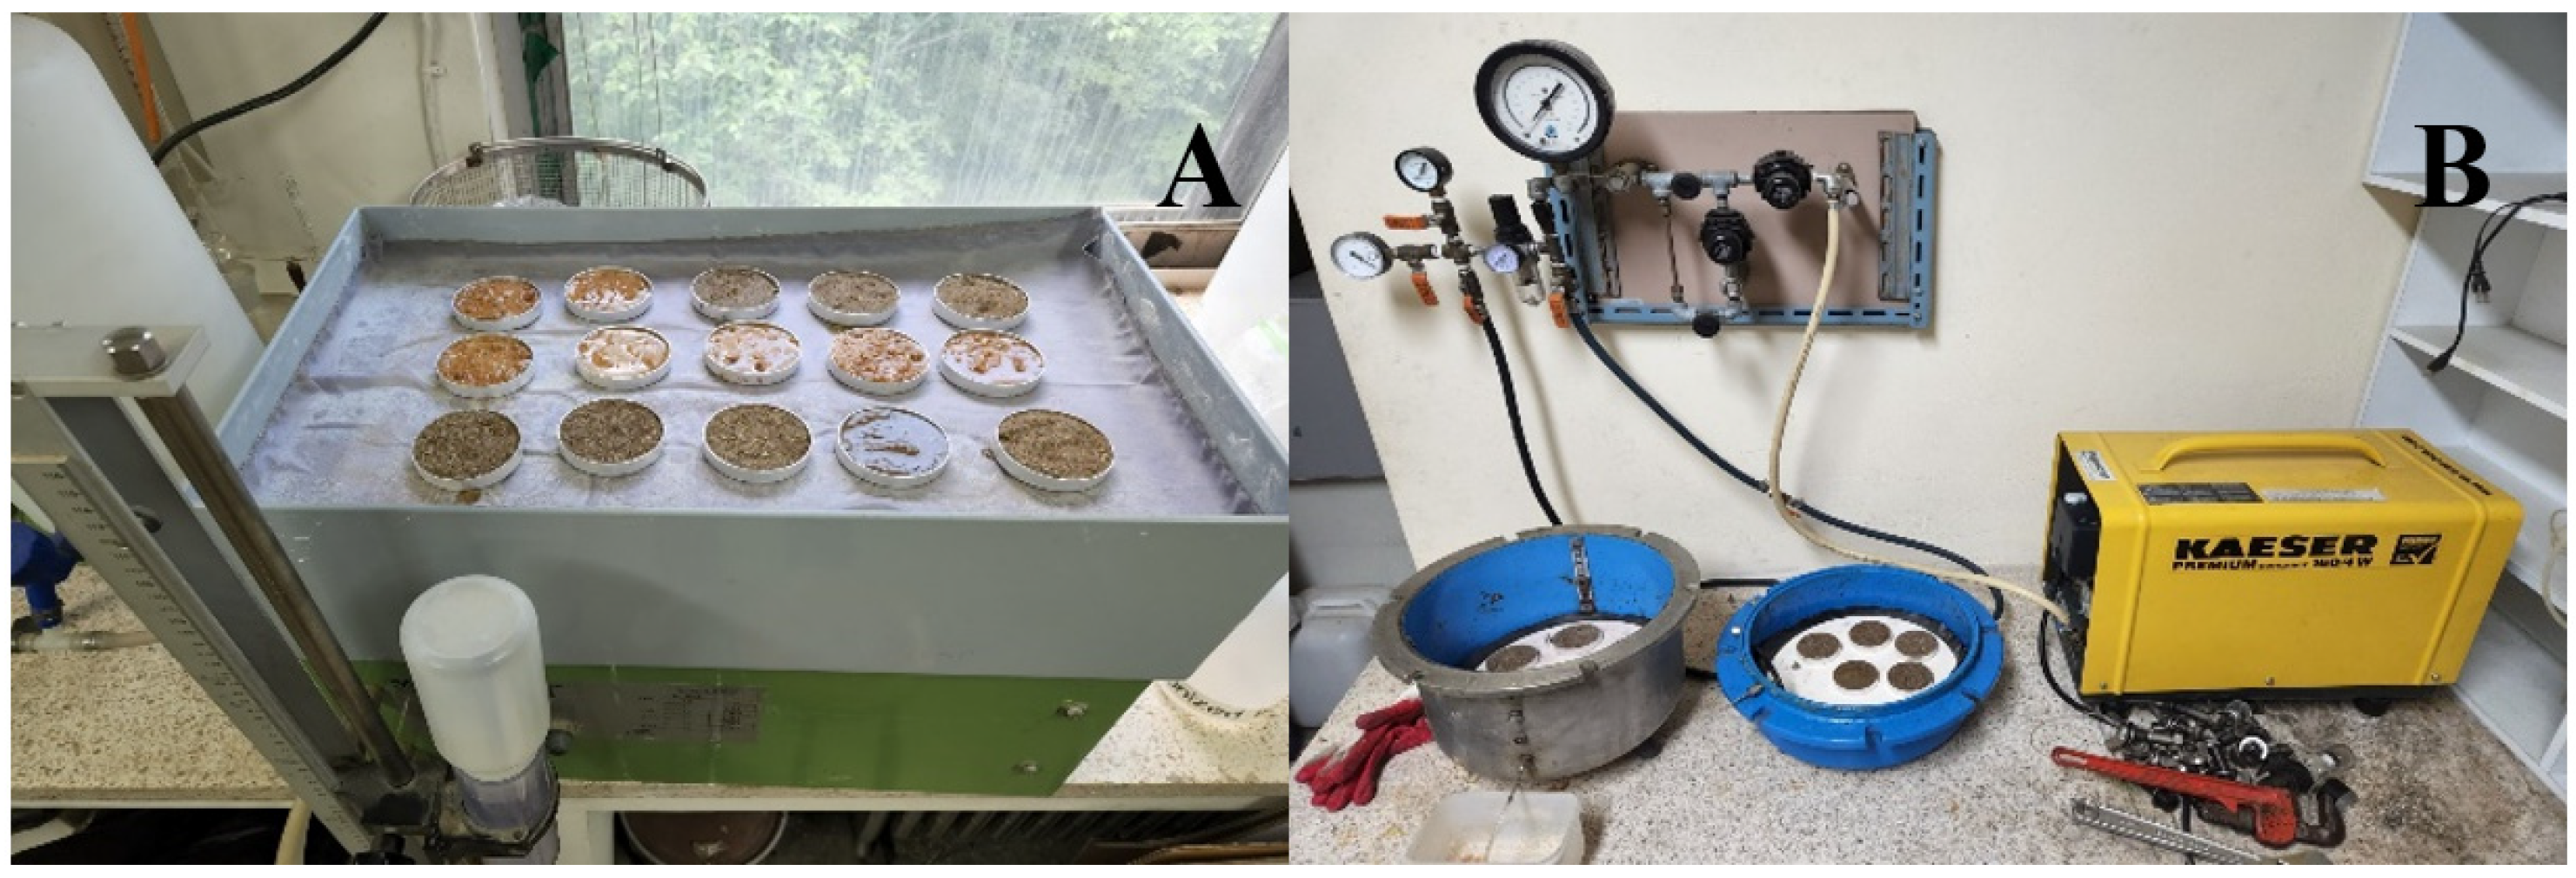
2.2. Measurement of Soil Water Retention Curves

According to the method described by [22], the undisturbed soil samples in open-ended stainless round rings were wetted slowly from the bottom by capillarity to saturation to measure soil water contents of Ap horizon soils for five soil series. The volumetric water content (θv) was measured at 11 matric potentials (0, −1, −5, −10, −30, −50, −100, −300, −500, −1000, −1500 kPa) (Table 3). The soil water retention characteristics between 0 and −50 kPa and −50 and −1500 kPa were measured by the sandbox and kaolin-plate and the pressure chamber method (Figure 2), respectively. Five replicate samples were measured for each Ap soil sample at each matric potential. The water contents were then measured gravimetrically by drying the samples at 105 °C for 24 h.

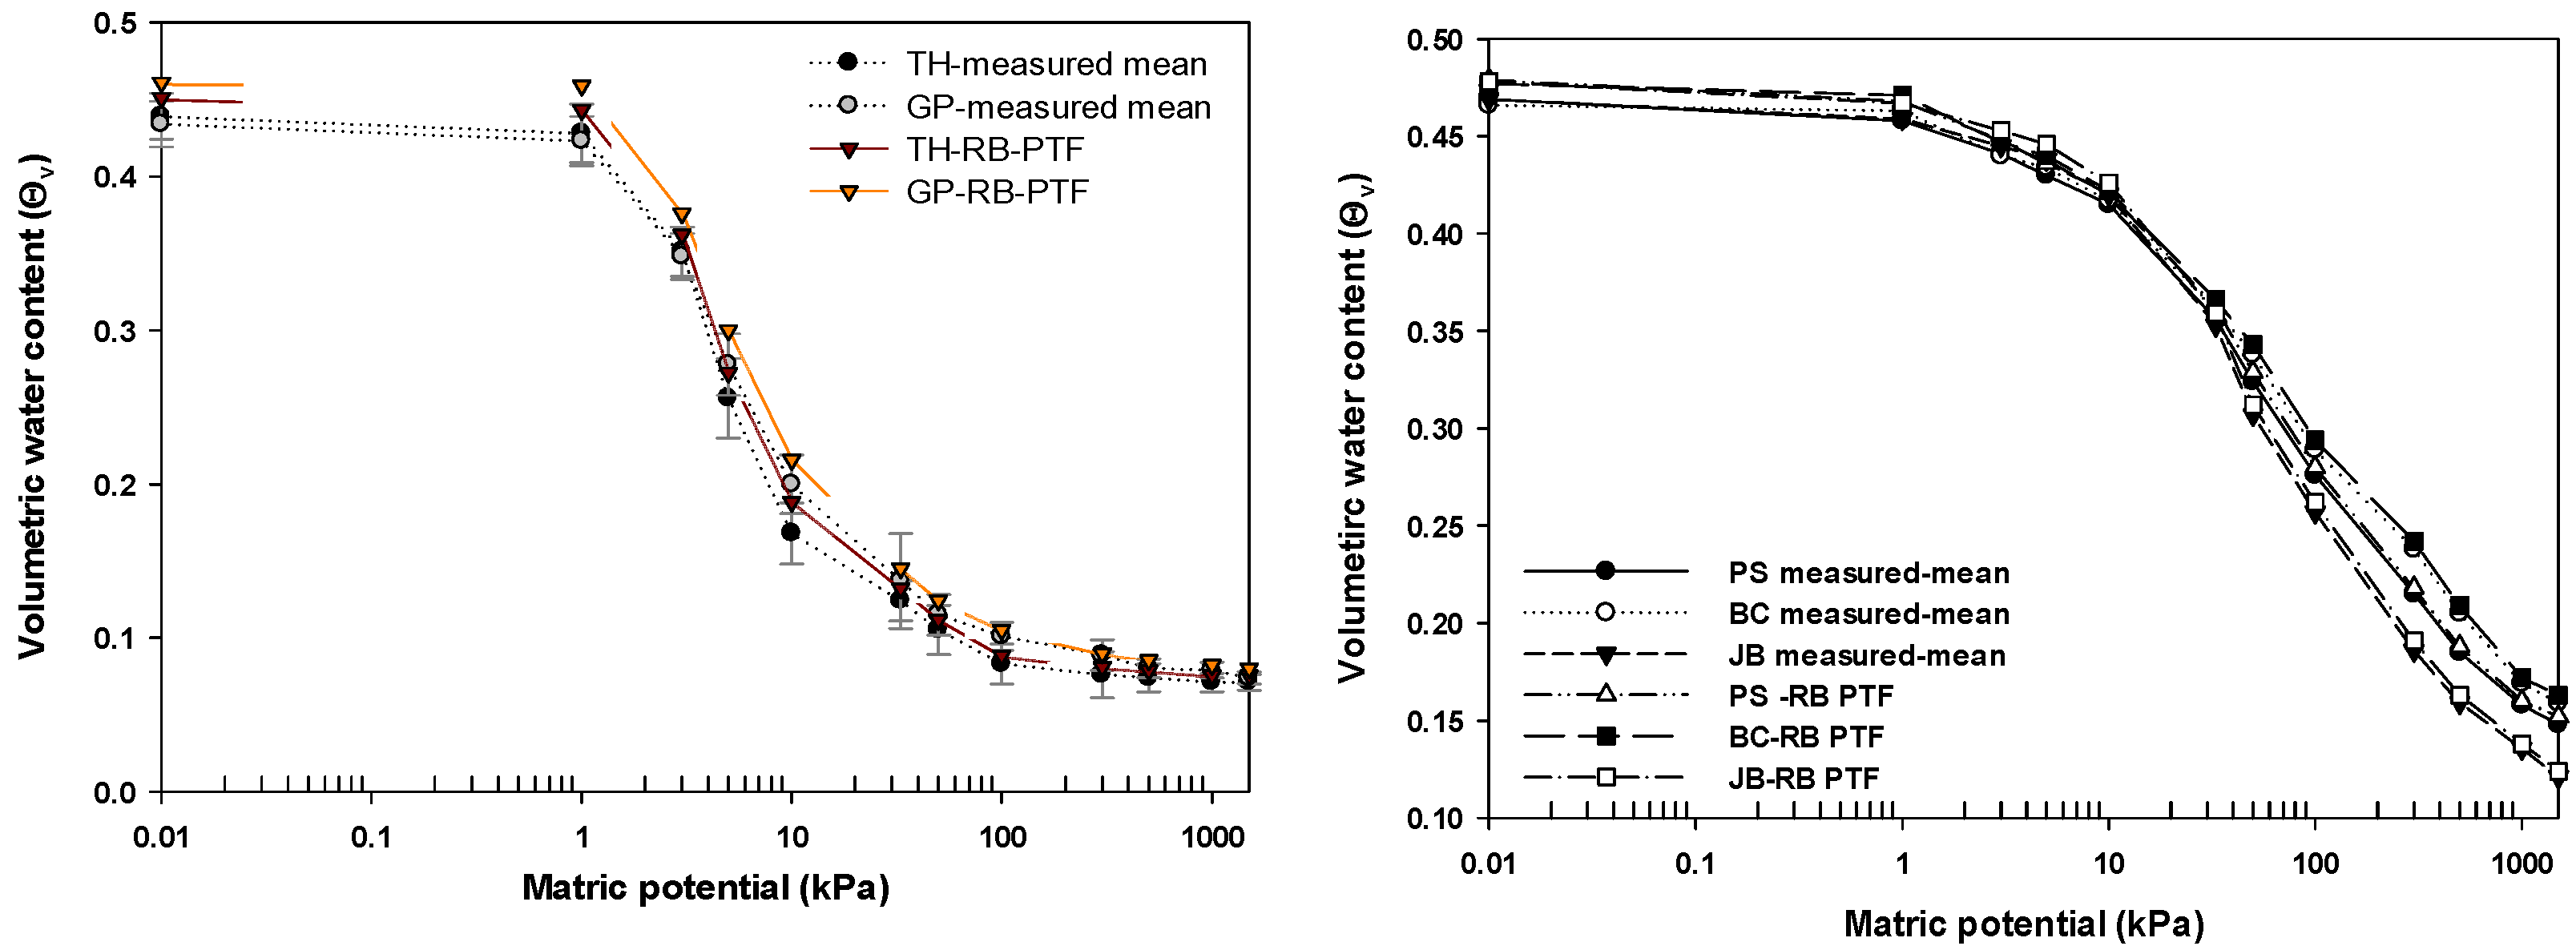
2.3. Estimated Soil Retention Curve: Rawls and Brakensiek PTF

A PTF is a function that uses basic data describing the soil, such as particle size distribution and bulk density, as inputs and its outputs are an estimation of the water retention curve [23]. In this study, Rawls and Brakensiek [24] PTF (RB-PTF) was applied and which are mainly based on the same input data: soil texture and bulk density which estimates the parameters of the van Genuchten retention function (Equation (1)) in particular residual water content (θr) and saturated water content (θs). The van Genuchten retention function is also expressed as the relative saturation (Se) as shown in Equations (2) and (3).
θ h = θ r + [ θ s θ r 1 1 + α h n m ]
Se = 1 1 + α h n m
Se = θ θ r θ s θ r
where θs and θr are the saturated and residual water contents, respectively, expressed on a volume basis (cm−3 cm−3). θs was selected as an intermediate value of θ corresponding to a water potential close to zero, whereas the value of θr was the lower limit of the water content in the soil with the following constraints: θr ≥ 0 m3 m−3 [25,26,27,28]. h and α (kPa−1) are soil water potential (kPa) and an empirical parameter (cm−1) whose inverse is often referred to as the air entry value. Small α values indicate little change of water content as h becomes more negative, which is generally more likely in fine grained and unstructured soils. Large values of α indicate a sudden change in water content, with some pores emptying under very small negative heads: this is generally more typical of sands or well-structured soils [13]. The parameter n and m (dimensionless) are shape parameters subjected to the restriction m = 1 − 1/n and determines the steepness of the water-release curve [11]. If the value of n is large (e.g., 3), the curve is steep, with a rapid decrease in water content as h becomes more negative. If the value of n is low (e.g., 1.1), the change in water content is very gradual [13]. Also, the α parameter refers to a parallel shift of the retention curve, while parameter n affects the scheme of the retention curve [29]. α and n were estimated, 0.0001 ≤ α ≤ 1 h Pa−1, and 1.01 ≤ n ≤ 10.

2.4. Van Genuchten Model: RETC Code

The unknown parameters (θs, θr, n, α, and m) were calculated directly by fitting the vG model to the measured soil water retention data in the laboratory using the nonlinear least-squares optimization program RETC (RETention Curve) program [30], given the condition that m = 1 − 1/n.

2.5. Statistical Analysis

The minimum, maximum, and mean values of sand, silt, clay, BD, and porosity, along with their standard deviations (SD) and standard error (SE) were calculated for each soil series (Table 2). The performances of PTF and laboratory in predicting measured data were assessed using four error measures. To test the match between fitted and predicted parameters, a coefficient of determination (R2) was calculated. The root mean square error (RMSE) between estimated and field measured water content with different methods was computed as:
R 2 = 1 1 N Mi Pi 2 1 N Mi M ¯ 2
RMSE = 1 n   i = 1 N Pi Mi 2
In addition to these two criteria, mean bias error (MBE) was used in the evaluation of estimation accuracy and regression and calculated.
MBE = 1 N 1 N Pi Mi
where Pi and Mi are the predicted and measured values of the i-th measured data point, respectively, and M ¯ is the mean of the measured values.

3. Results and Discussion

The profiles for the five soil series consisted of Ap, Bg, and Cg horizons, whereas the depth of the Ap horizon of TH was deeper by 8 cm than those of the other four series (Table 1). Most of the soil structures for Ap, Bg, and Cg horizons were massive, whereas those of the Bg horizon were large blocky and weakly blocky for GP and JB, respectively. The platy and massive soil structures which have no observable aggregation, and no definite arrangement of soil particles inhibit the vertical movement of water down the soil profile, resulting in determining the water retention curve. The soil textures of the Ap horizon for the five-soil series showed that TH and GP were sandy loam with high sand contents (>60%) and low clay contents (<10%), while PS, BC, and JB were silt loam with relatively high silt contents (>60%) and low sand contents (<10%). But the soil texture of PS belonging to silt loam contains a relatively higher content of silt compared with those of TH and GP investigated in this study. For the PSD, the highest SDs for sand, silt, and clay were 6.20, 6.45, and 6.05 for GP, BC, and BC, respectively, whereas the lowest SDs were 1.85, 3.54, and 1.80 for JB, TH, and TH, respectively. The SE of PSDs for the five-soil series were primarily less than 1%, except for the sand (1.13%) of TH and the silt (1.18%) and clay (1.11%) of BC. Soil structure affects hydraulic parameters [31]. These results indicate that the measured values were relatively well grouped around the population. The mean OM for all soil series was less than 1%, along with the highest SE of less than 0.05% in PS. The mean BDs of TH and GP with relatively high sand contents were 1.48 and 1.49 g cm−3, which were slightly higher than those of PS, BS, and JP, resulting in mean porosities of TH and GP were lower than those of PS, BS, and JB.
The texture distribution of the Ap horizon for the five-soil series were grouped into sandy loam for TH and GP and silt loam for PS, BC, and JB as shown in Figure 3. The most marked difference in the texture distributions was the percentages of samples in the sand class: 63.6% and 64.3% for the TH and GP and 8.43% and 9.89% for BC and JB.
Table 3 shows θv of the measured minimum, maximum, and mean values at the water potential from 0 to −1500 kPa for five soil series. The mean θs and θr were lower in TH and GP than those of PS, BC, and JB with relatively very lower sand and higher clay contents. The highest mean θs and θr were 0.474 at 0 kPa and 0.159 at −1500 kPa in BC, with the lowest sand content and relatively high clay contents classified as silt loam, whereas the lowest θs and θr were 0.434 and 0.071 in TH with very high sand contents (63.6%) and the lowest clay content (6.87%) classified as sandy loam. The largest and smallest differences of θs between maximum and minimum were observed from TH (0.038) and GP (0.028) soil series, respectively, while those of θr were observed from BC (0.033) and TH (0.006) soil series, respectively. The largest SD(SE) values of θs and θr were observed at 0.022 (0.004) and 0.016 (0.003) both in JB, respectively. These results represent that θv was closely related to the contents of sand and clay of Ap horizon soils in the soil series.
The vG equation parameters (θs, θr, α, n) of Ap horizon soils which were grouped into two textural classes of sandy loam (TH and GP) and silt loam (PS, BC, and JB) were obtained by fitting the model to the measured data using RETC (Table 4). The estimated mean values of θs and θr for sandy loam were lower than those of silt loam with the relatively higher clay content, while α and n, which represent the air entry point and the steepness of the water-retention curve, were higher in sandy loam than those of silt loam. The SD(SE) values of θs and θr of sandy loam and silt loam were less than 0.013 (0.002) and 0.071 (0.005) and 0.016 (0.004) and 0.021 (0.006), respectively. Generally, large values of α, which is proportional to the inverse of the value of matric potential, indicate a sudden change in water content, with some pores emptying under very small negative matric potentials: this is generally more typical of sands or well-structured soils. The parameter α was higher in sandy loam than that of silt loam, indicating that the air entry point could have appeared earlier than that of silt loam and the change of water content corresponding to increasing negative matric potential was much larger than that of silt loam. The parameter n determines the steepness of the water-release curve. If the value of n is large than 3, the SWRC is steep, with a rapid decrease in water content as h becomes more negative. If the value of n is lower than 1.1, the change in water content is very gradual [13]. The mean n values of sandy loam and silt loam were larger than 3.15 and 1.903, respectively, indicating that the SWRC of silt loam was a broader distribution due to pore sizes of silt loam soil.
Figure 4 shows the measured and estimated SWRCs at water potentials ranging from 0 to −1500 kPa for Ap horizon soils grouped into sandy loam (TH and GP) and silt loam (PS, BC, and JB) for the five-soil series. The matrix potential of θs was selected at a water potential close to zero. θv, corresponding to each matric potential, decreased to the residual water content, θr, as the matric potential increased from 0 to −1500 kPa for all soil series. The SWRCs of respective soil textures showed a fairly consistent slope. The SWRCs of sandy loam were steeper with a more substantial decline between −1 and −100 kPa, although the decrease in θv was very small as the matric suction increased from zero (corresponding to the saturation state) to −1 KPa whereas the SWRCs of silt loam including PS, BC, and JB showed a decline after −5 kPa (Figure 4). The sudden steepening of the slope which is common for coarse soils or highly aggregated soils and indicates a distinct air-entry tension value was observed in sandy loam. Comparing the mean measured θv between sandy loam and silt loam corresponding to each matric potential, θv of sandy loam was lower than those of silt loam containing relatively high silt and clay contents. Generally, sandy soils involving capillary binding release most of the water, even at lower matric potentials, whereas clay-rich soils having adhesive and osmotic binding release water at a higher matric potential [15,28,32].
The RB-PTF SWRCs of sandy loam and silt loam were similar to those of the measured mean of sandy loam and silt loam, while the θv obtained by RB-PTF were higher than those of the measured mean for sandy loam and silt loam. The differences of θv between the measured and the RB-PTF at each matric potential were slightly decreased with decreasing matric potential for sandy loam and silt loam while the greatest difference of θv was observed at saturation for both soil texture classes.
Hysteresis of the SWRC, manifested as a difference between equilibrium curves of soil wetting and drying (hysteresis loop), is a phenomenon specific to soil hydrology. We attempted to derive a model of the drying curve from the wetting curve. The SWRCs estimated with the modeled data closely fit the measured data of sandy loam and silt loam (Figure 5) although θs and θr of RB-PTF were higher than those of the measured mean for both soil textures (Figure 5). Compared with θv of the measured mean at each matric potential for sandy loam and silt loam, the RB-PTF θv was slightly higher at lower matric potentials (0 to −3 kPa) than those of θv measured higher matric potentials (−500 to −1500 kPa). The correlations of θv between the estimated and the measured mean showed a satisfactory coherence with r2 values higher than 0.99 for the Ap horizon soils of the five-soil series. Wassar et al. [33] reported that the PTF of Rawls and Brakensiek [9] was accurate for soils with a 5–70% clay and sand content Therefore, the correspondence between the RB-PTF and the measured mean θv was reasonably good, except for θv in the lower matric potential (0 to −3 kPa).
The RMSE, MBE, and r2 values for sandy loam and silt loam based on the predicted value (Pi), the sample mean ( M ¯ ), and the data points (Mi), are presented in Table 5. The mean RMSE values of 0.0117 and 0.0141 of sandy loam and silt loam indicate that SWRCS estimated by the RB-PTF yielded the best fit of all soil samples from the five series, whereas the MBE values less than zero indicate that θv measured at the water potentials is under-predicted. These results indicate that RB-PTF based on the soil texture can be applied to determine θv in RTFS because its performance increases when RMSE approaches zero [25]. Based on r2 as an indicator of the predictive capacity of the RB-PTF, the trend could be divided into two parts depending on the soil PSD. The r2 values for sandy loam and silt loam were greater than 0.9. Accordingly, the r2 values that represent RB-PTF are suitable for predicting SWRCs in RTFS because the measured data points do not vary around the estimated regression line. Following Rajkai et al. [34], we consider an SWRC prediction good if the mean estimation error (ME) for all measured retention data is less than 2.5%. This means that the mean absolute difference between the estimated and measured retention data values is less than 2.5%.

4. Conclusions

Considering the comparison and the evaluation of the laboratory and the estimated methods to obtain the soil retention curve parameters for SWRCs of the five soil series in RTFS, the coefficient of determination (r2) and RMSE were used to quantify the differences between the estimated values and the measured values. The measured and the estimated SWRCs showed that θv displayed a correlation between the estimated and measured data from the SWRCs for the five-soil series. The RMSE values indicate that the measured θv yielded the best fit of all Ap horizon soils of the five series, whereas the MBE values of PS and JB indicate that θv measured at the water potentials is under-predicted. The RB-PTF SWRCs which were calculated using vG parameters were similar to those of the measured mean of sandy loam and silt loam while the θv obtained by RB-PTF were higher than those of the measured mean for sandy loam and silt loam. The r2 values represent RB-PTF are suitable for predicting SWRCs in RTFS because the measured data points do not vary around the estimated regression line. The very low mean RMSE values of sandy loam and silt loam indicate that SWRCS estimated by the RB-PTF yielded the best fit of all soil samples from the five series. The RB-PTF which could be valid for soils with broad ranges of clay (5–60%) and sand (5–70%) can be applied to determine θv of Ap horizon soils in RTFS because the contents of sand and clay of Ap horizon of which the soil textures were sandy loam and silt loam were within the range of RB-PTF. Therefore, RB-PTF can replace laboratory measurements as a better estimator for Ap horizon soils in RTFS.

Author Contributions

Conceptualization, K.-S.L., S.-P.L. and D.-Y.C.; methodology, K.-S.L., D.-S.L., H.-G.J. and S.-P.L.; software, K.-S.L. and S.-P.L.; validation, K.-S.L., D.-S.L. and S.-P.L.; writing—original draft, K.-S.L. and D.-S.L.; writing—review and editing, J.-H.R., W.-J.C., J.-E.Y. and D.-Y.C. All authors have read and agreed to the published version of the manuscript.

Funding

This work was supported by the Rural Development Administration, grant number PJ013873032022 and Korea Ministry of Environment as “The SS (Surface Soil conservation and management) projects; 2019002820004”.

Institutional Review Board Statement

Not applicable.

Data Availability Statement

Not applicable.

Conflicts of Interest

The authors declare that they have no conflict of interest. The funder had no role in the design of the study; in the collection, analyses, or interpretation of data; in the writing of the manuscript, or in the decision to publish the results.

References

  1. Vereecken, H.; Maes, J.; Feyen, J. Estimating unsaturated hydraulic conductivity from easily measured soil properties. Soil Sci. 1990, 149, 1–12. [Google Scholar] [CrossRef]
  2. Bouma, J.; van Lanen, H.A.J. Transfer functions and threshold values: From soil characteristics to land qualities. In Proceedings of the International Workshop on Quantified Land Evaluation Procedures, Washington, DC, USA, 27 April–2 May 1987. [Google Scholar]
  3. Porêbska, D.; Slawiñski, C.; Lamorski, K.; Walczak, R.T. Relationship between van Genuchten’s parameters of the retention curve equation and physical properties of soil solid phase. Int. Agrophys. 2006, 20, 153–159. [Google Scholar]
  4. van Genuchten, M.T. On estimating the hydraulic properties of unsaturated soils. In Indirect Methods for Estimating the Hydraulic Properties of Unsaturated Soils; van Genuchten, M.T., Leij, F.J., Eds.; Univercity of California: Riverside, CA, USA, 1992; pp. 1–14. [Google Scholar]
  5. Agyare, W.A.; Park, S.J.; Vlek, P.L.G. Artificial neural network estimation of saturated hydraulic conductivity. Vadose Zone J. 2007, 6, 423–431. [Google Scholar] [CrossRef]
  6. van den Berg, M.; Klamt, E.; van Reeuwijk, L.P.; Sombroek, W.G. Pedotransfer fuctions for the estimation of moisture retention characteristics of Ferralsols and related soils. Geoderma 1997, 78, 161–180. [Google Scholar] [CrossRef]
  7. Brooks, R.H.; Corey, A.T. Hydraulic Properties of Porous Media, 3rd ed.; Hydrology Paper; Colorado State University: Fort Collins, CO, USA, 1964. [Google Scholar]
  8. van Genuchten, M.T. A closed-form equation for predicting the hydraulic conductivity of unsaturated soils. Soil Sci. Soc. Am. J. 1980, 44, 892–898. [Google Scholar] [CrossRef] [Green Version]
  9. Rawls, W.J.; Brakensiek, D.L. Prediction of soil water properties for hydrologic modeling. In Watershed Managementinthe Eighties, Proceedings of the Symposium of Irrigation and Drainage Division ASCE, Denver, CO, USA, 30 April–1 May 1985; Jones, E., Ward, T.J., Denver, Eds.; ASCE: New York, NY, USA, 1985. [Google Scholar]
  10. Tomasella, J.; Hodnett, M.G.; Rossato, L. Pedo-transfer functions for the estimation of soil water retention in Brazilian soils. Soil Sci. Soc. Am. J. 2000, 64, 327–338. [Google Scholar] [CrossRef]
  11. Bouma, J. Using soil survey data for quantitative land evaluation. Adv. Soil Sci. 1989, 9, 177–213. [Google Scholar]
  12. Merdun, H.; Cinar, O.; Meral, R.; Apan, M. Comparison of artificial neural network and regression pedotransfer functions for prediction of soil water retention and saturated hydraulic conductivity. Soil Tillage Res. 2006, 90, 108–116. [Google Scholar] [CrossRef]
  13. Hodnett, M.G.; Tomasella, J. Marked differences between van Genuchten soil water-retention parameters for temperate and tropical soils: A new water-retention pedotransfer function developed for tropical soils. Geoderma 2002, 108, 155–180. [Google Scholar] [CrossRef]
  14. Leij, F.J.; Ghezzehei, T.A.; Or, D. Analytical Models for Soil Pore-Size Distribution after Tillage. Soil Sci. Soc. Am. J. 2002, 66, 1104–1114. [Google Scholar] [CrossRef] [Green Version]
  15. Benson, C.H.; Chiang, I.; Chalermyanont, T.; Sawangsuriya, A. Estimating van Genuchten Parameters α and n for Clean Sands from Particle Size Distribution Data. In Soil Behavior Fundamentals to Innovations in Geotechnical Engineering; Iskander, M., Garlanger, J.E., Hussein, M.H., Eds.; ASCE: Reston, VA, USA, 2014; pp. 410–427. [Google Scholar]
  16. Yates, S.R.; van Genuchten, M.T.; Warick, A.W.; Leij, F.J. Analysis of measured, predicted and estimated hydraulic conductivity using the RETC program. Soil Sci. Soc. Am. J. 1992, 56, 347–354. [Google Scholar] [CrossRef]
  17. RDA. Soil Series of a Reclaimed Tidal Soil. Available online: http://www.nongsaro.go.kr/portal/ps/psb/psbk/kidofcomdtyDtl.ps;jsessionid=Lc3cJtjh1sW6QdwMOvjgejWK0WLhvjXAOEPcSzAVZUarp3BcM6OFgxoebEBT74wD.nongsaro-web_servlet_engine1?menuId=PS00067&kidofcomdtyNo=20506 (accessed on 14 July 2021).
  18. Soil Survey Staff. Keys to Soil Taxonomy, 12th ed.; US Gov. Print Office: Washington, DC, USA, 2014. [Google Scholar]
  19. ASTM. ASTM D422-63 1965. In Particle Size Analysis of Soils; ASTM International: Philadelphia, PA, USA, 1965; pp. 87–93. [Google Scholar]
  20. Walkley, A.; Black, I.A. An examination of the Degtjareffmethod for determining soil organic matter, and a proposed modification of the chromic acid titration method. Soil Sci. 1934, 37, 29–38. [Google Scholar] [CrossRef]
  21. Yuhan, L.; Zhang, C.; Chen, C.; Chen, H. Calculation of Capillary Rise Height of Soils by SWCC Model. Adv. Civ. Eng. 2018, 2018, 5190354. [Google Scholar]
  22. Pachepsky, Y.A.; Rawls, W.J. Development of pedotransfer functions in soil hydrology. In Developments in Soil Science; Elsevier: Amsterdam, The Netherland, 2004; Volume 30, ISBN 978-0-444-51705-0. [Google Scholar]
  23. Tietje, O.; Tapkenhinrichs, M. Evaluation of pedotransfer functions. Soil Sci. Soc. Am. J. 1993, 57, 1088–1095. [Google Scholar] [CrossRef]
  24. Rawls, W.J.; Brakensiek, D.L. Estimation oss oil water retention and hydraulic properties. In Unsaturated Flow in Hydrologic Modeling the Ory and Practicesed; H.J. Morel-Seytoux275-300; Kluwer Academic Publishers: Dordrecht, The Netherland, 1989. [Google Scholar]
  25. Barros, A.H.C.; de Jong van Lier, Q.; de Holanda Nunes Maia, A.; Vale Scarpare, F. Pedotransfer functions to estimate water retention parameters of soils in northeastern Brazil. Rev. Bras. Ciênc. Solo 2013, 37, 379–391. [Google Scholar] [CrossRef]
  26. Zhang, J.; Wang, Z.; Luo, X. Parameter estimation for soil water retention curve using the salp swarm algorithm. Water 2018, 10, 815. [Google Scholar] [CrossRef] [Green Version]
  27. Satyanaga, A.; Rahardjo, H.; Leong, E.C.; Wang, J.Y. Water characteristic curve of soil with bimodal particle-size distribution. Comput. Geotech. 2013, 48, 51–61. [Google Scholar] [CrossRef]
  28. Baker, L.; Ellison, D. Optimisation of pedotransfer functions using an artificial neural network ensemble method. Geoderma 2008, 144, 212–224. [Google Scholar] [CrossRef]
  29. Angelaki, A.; Sihag, P.; Sakellariou-Makrantonaki, M.; Tzimopoulos, C. The effect of sorptivity on cumulative infiltration. Water Supply 2021, 21, 606–614. [Google Scholar] [CrossRef]
  30. van Genuchten, M.T.; Leij, F.J.; Yates, S.R. The RETC Code for Quantifying the Hydraulic Functions of Unsaturated Ssoils; EPA/600/2-91/065 (NTIS 92-119668); U.S. Environmental Protection Agency: Washington, DC, USA, 1991. [Google Scholar]
  31. Guellouz, L.; Askri, B.; Jaffré, J.; Bouhlila, R. Estimation of the soil hydraulic properties from field data by solving an inverse problem. Sci. Rep. 2020, 10, 9359. [Google Scholar] [CrossRef]
  32. Rahardjo, H.; Satyanaga, A.; Leong, E.C.; Ng, Y.S. Variability of residual soil properties. J. Eng. Geol. 2012, 141, 124–140. [Google Scholar] [CrossRef]
  33. Wassar, F.; Claudio, G.; Rienzner, M.; Chiaradia, E.A.; Bernardoni, E. Predicted and measured soil retention curve parameters in Lombardy region north of Italy. Int. Soil Water Conserv. Res. 2016, 4, 207–214. [Google Scholar] [CrossRef] [Green Version]
  34. Rajkai, K.; Kabos, S.; van Genuchten, M.T.; Jansson, P.E. Estimation of water retention characteristics from the bulk density and particle-size distribution of Swedish soils. Soil Sci. 1996, 161, 832–845. [Google Scholar] [CrossRef]
Figure 1. Photographs of the profiles of five soil series recovered from the investigation site.
Agronomy 12 01507 g001
Figure 2. Photos of the sand-box (A) and the pressure chamber (B) used to measure the volume water contents.
Agronomy 12 01507 g002
Figure 3. Soil textural distribution of the data set used for estimating the PTFs for five soil series in the RTFS. TH, Taeahn soil series; GP, Gwangpo soil series; PS, Poseong soil series; BC, Bokchun soil series; JB, Junbook soil series.
Agronomy 12 01507 g003
Figure 4. Measured and estimated SWRCs plotted using semi-logarithmic coordinates for matric potential from θs to θr for the five-soil series. The curves were obtained by drainage. TH, Taeahn series; GP, Gwangpo series; PS, Poseong series; BC, Bokchun series; JB, Junbook series.
Agronomy 12 01507 g004
Figure 5. Estimated and mean measured SWRCs of sandy loam and silt loam soil and comparison of volumetric water content between the estimated and the measured mean for both soil textures for Ap horizon soils of five soil series.
Agronomy 12 01507 g005
Table 1. Description of soil profiles of the five-soil series at the investigation site.
Soil SeriesHorizon (Depth, cm)Soil
Texture
Soil
Color
Mottle ColorSoil
Structure
Remarks
THAp1 (0–8)SL7.5YR 4/17.5YR 5/6Mtiny quartz particles
Ap2 (8–27)SL7.5YR 5/1 Platysharp boundary between Ap2 and C
Cg (27–120)LFS10YR 6/4 Mmica, weathered granite gravel
GPAp (0–12)SL10YR 4/410YR 4/4Mtiny quartz particles, Mn mottle
B1g (12–24)SL10YR 3/210YR 3/2LBmanganese mottle
B2g (24–39)SL10YR 3/210YR 3/2LBmanganese mottle
B3g (39–60)SL10YR 3/310YR 3/3LA
Cg (60–120)SL5Y 4/15Y 4/1M
PSAp (0–12)SL2.5Y 4/27.5YR 8/5M
B1g (12–20)SiL5Y 4/27.5YR 5/8M
B21g (20–32)SiCL5Y 5/27.5YR 5/8M
B22g (32–56)SL5Y 4/1 M
B23g (56–91)SiL5Y 5/1 M
Cg (91–140)SiL10BG 5/1 M
BCAp (0–15)SiL5Y 4/15Y 8/4M
B1g (15–30)SiL5Y 3/17.5YR 4/4Mdistinctive boundary
B2g (30–65)SiL5Y 5/15YR 5/8M
C1g (65–90)SiCL10GB 5/110YR 4.4M
C2g (90–110)SiL10GB 5/1 M
JBAp1g (0–10)SiL5Y 4/1 MMica
Ap2g (10–19)SiL5Y 4/1 MMica
B1g (19–27)SiL10YR 3/1 WBMica
B2g (27–85)SiCL5Y 4/1 WBMica
B3g (85–120)SiL5Y 4/2 WBMica
Cg (120–160)SiL5Y 4/1 MMica
TH, Taeahn series; GP, Gwangpo series; PS, Poseong series; BC, Bokchun series; JB, Junbook series; SL, sandy loam; LFS, loamy fine sand; SiL, Silt loam; SiCL, Silty clay loam; M, Massive; LB, Large blocky; LA, Large angular; WB, Weak blocky.
Table 2. Ranges of soil texture and other information of Ap horizons of five-soil series used for PTF.
Soil Series
(No. of Samples)
Measured Database (30 Values for Each Soil Series)
SandSiltClaySoil
Texture
OMBDPorosity
(%) (g cm−3)(%)
TH
(30)
Min58.827.45.30sandy loam0.591.4642.1
Max68.334.38.90 0.771.5145.9
Mean63.629.56.87 0.681.4843.9
SD4.533.541.80 0.110.052.18
SE0.870.650.33 0.020.010.35
GP
(30)
Min58.120.88.01sandy loam0.581.4742.8
Max70.529.113.2 0.811.5345.6
Mean64.325.310.5 0.701.4943.4
SD6.204.112.60 0.130.052.27
SE1.130.750.47 0.020.010.32
PS
(30)
Min13.852.921.1silt loam0.791.3946.1
Max21.262.929.1 1.031.4249.1
Mean16.857.125.6 0.911.4046.9
SD3.725.024.01 0.180.061.93
SE0.680.920.73 0.050.010.28
BC
(30)
Min6.2062.117.5silt loam0.761.4045.8
Max10.475.029.6 1.081.4348.9
Mean8.4368.423.2 0.921.4146.6
SD2.106.456.05 0.160.052.57
SE0.381.181.11 0.040.010.29
JB
(30)
Min7.9063.417.8silt loam0.841.4145.5
Max11.674.226.2 1.051.4448.9
Mean9.8968.621.6 0.951.4246.9
SD1.855.404.21 0.150.052.09
SE0.340.990.77 0.020.010.31
TH, Taeahn series; GP, Gwangpo series; PS, Poseong series; BC, Bokchun series; JB, Junbook series; OM, organic matter; BD, Bulk density; SD, Standard deviation; SE, Standard error.
Table 3. Laboratory measured soil water contents at water potential ranging from 0 to −1500 kPa for the five soil series.
Soil Seriesθ
(cm3 cm−3)
Water Potential (kPa)
0−1−3−5−10−30−50−100−300−500−1000−1500
Sandy loamTHMin0.4210.4090.3410.2240.1570.1170.0920.0730.0710.0710.0690.068
Max0.4590.4390.3550.2420.1780.1350.1110.1010.0890.0820.0780.074
Mean0.4390.4210.3280.2350.1680.1240.1050.0830.0760.0740.0710.071
SD0.0150.0190.0160.0260.020.0130.0160.0130.0150.0090.0060.005
SE0.0030.0030.0030.0050.0040.0020.0030.0020.0030.0020.0010.001
GPMin0.4280.4170.3460.2380.1780.1280.1060.1010.0830.0760.0740.07
Max0.4560.4480.3630.2570.1950.1490.1220.1280.1020.0890.0840.083
Mean0.4430.4250.3590.2470.1860.1370.1150.1160.0940.0820.0790.074
SD0.0150.0160.0150.020.0190.0310.0130.0090.010.0060.0050.004
SE0.0030.0030.0030.0040.0050.0080.0040.0030.0020.0010.0010.002
Mean0.4410.4280.3510.2400.1770.1320.1080.1010.0860.0800.0760.074
SD0.0190.0180.0100.0140.0160.0130.0120.0220.0130.0080.0060.007
SE0.0020.0020.0010.0020.0020.0020.0020.0030.0020.0010.0010.001
Silt loamPSMin0.4610.4350.420.4010.3650.3010.2720.2290.1790.1580.1420.138
Max0.4910.4660.4490.4250.3880.3150.3030.2610.2090.1880.1670.158
Mean0.4770.4490.4410.430.4020.3230.2870.2430.1950.1740.1590.148
SD0.0140.0160.0150.0140.0120.010.0160.0160.0150.0150.0130.01
SE0.0020.0030.0030.0030.0020.0020.0030.0030.0030.0030.0020.002
BCMin0.4580.4510.4320.4230.4020.3440.3140.2740.2150.1870.1480.142
Max0.4890.4710.4630.4480.4280.3720.3450.2950.2510.2210.1790.175
Mean0.4740.4630.440.4340.4170.3610.3380.2890.2380.2050.1690.159
SD0.0110.010.0160.0130.0130.0140.0160.0110.0180.0170.0160.017
SE0.0020.0020.0030.0020.0020.0030.0030.0020.0030.0030.0030.003
JBMin0.4550.4250.4170.4010.3790.2810.2510.2150.1680.1440.120.108
Max0.4890.4730.4580.4410.4210.3390.3090.2490.2030.1670.1480.139
Mean0.4720.4490.4450.4380.420.3480.3070.2570.1910.1530.1360.121
SD0.0220.0240.0210.020.0250.0290.0290.0170.0170.0110.0140.016
SE0.0040.0040.0040.0040.0050.0050.0050.0030.0030.0020.0030.003
Mean0.4740.4550.4420.4340.4130.3440.3010.2630.1990.1720.1490.143
SD0.0360.0420.0410.0410.0460.0710.0720.0640.0630.0600.0450.050
SE0.0040.0040.0040.0040.0050.0070.0080.0070.0070.0060.0050.005
TH, Taeahn soil series; GP, Gwangpo soil series; PS, Poseong soil series; BC, Bokchun soil series; JB, Junbook soil series; SD, Standard deviation; SE, Standard error.
Table 4. Estimated vG model parameters using RETC for five soil series.
Soil TextureSoil Seriesθsθrαnm
Sandy loamTHMean0.4240.0690.7423.050.672
GPMean0.4210.0720.7083.250.692
Mean0.4220.0710.7253.1500.682
SD0.0110.0050.0810.2940.029
SE0.0020.0010.010.0380.004
Silt loamPSMean0.4570.1410.3712.280.561
BCMean0.4550.1540.3331.680.405
JBMean0.4530.1190.3211.750.429
Mean0.4550.1380.3421.9030.465
SD0.0160.0210.040.3090.083
SE0.0020.0020.0040.0330.009
TH, Taeahn soil series; GP, Gwangpo soil series; PS, Poseong soil series; BC, Bokchun soil series; JB, Junbook soil series; SD, Standard deviation; SE, Standard error.
Table 5. Root mean square error (RMSE), mean bias error (MBE), and coefficient of determination (r2) of median, minimum, and maximum water contents measured at matric potentials ranging from 0 to −1500 kPa.
Soil TextureSoil SeriesRMSEMBEr2
Sandy loamTHMean0.0013−0.00120.903
GPMean0.0003−0.00090.925
Mean 0.0117−0.00460.9092
SD 0.01010.00700.0095
SE 0.00130.00090.0012
Silt loamPSMean0.006−0.00020.929
BCMean0.00090.00010.917
JBMean0.0103−0.00580.958
Mean 0.0141−0.00510.9184
SD 0.00940.00600.0199
SE 0.00100.00060.0021
TH, Taeahn series; GP, Gwangpo series; PS, Poseong series; BC, Bokchun series; JB, Junbook series; RMSE, root mean square error; MBE, mean bias error.
Publisher’s Note: MDPI stays neutral with regard to jurisdictional claims in published maps and institutional affiliations.

