Article

Low Temperature Rather Than Nitrogen Application Mainly Modulates the Floral Initiation of Different Ecotypes of Rapeseed (Brassica napus L.)

1
College of Plant Science and Technology, Huazhong Agricultural University, Wuhan 430070, China
2
Rapeseed Office of Hubei Province, Wuhan 430073, China
*
Author to whom correspondence should be addressed.
These authors contributed equally to this work.
Agronomy 2022, 12(7), 1624; https://doi.org/10.3390/agronomy12071624
Submission received: 17 June 2022 / Revised: 30 June 2022 / Accepted: 4 July 2022 / Published: 6 July 2022
(This article belongs to the Special Issue Evolution of Environmental Adaptation in Plants)

Abstract

:
Rapeseed has formed three ecological types, namely winter, semi-winter, and spring during the long domestication process. Different ecotypes have different low-temperature requirements for floral initiation. Rapeseed growth has a large demand for nitrogen, and the amount of nitrogen application significantly impacts the number of flowering. Meanwhile, the time of floral imitation determined the quantity of floral bud, the final number of pods, and yield of rapeseed. Therefore, it is of great significance to understand the regulation of temperature and nitrogen on floral initiation. This experiment selected representative semi-winter and spring rapeseed varieties to study the leaf’s soluble sugar and protein concentration under different nitrogen supplies and the transcriptome reactions to vernalization for spring and semi-winter varieties rapeseed in transition to floral initiation. The results showed that the soluble sugar content and carbon-to-nitrogen ratio changed due to the different growth processes and nitrogen application rates. The increase of the sugar content to a peak could be regarded as the signal to start floral initiation. Reducing the nitrogen application rate increased the peak of sugar content, but the effect on the appearance time of the peak was not obvious. Under normal (20–25 °C) and low temperatures (10–15 °C), the floral initiation time of spring variety “1358” showed no difference, nor did expression of hub gene SOC1, which is involved in the flowering regulation network. The semi-winter variety “Zhongshuang No. 11” did not commence floral initiation under normal temperature because of the lacking of vernalization requirement. Low temperature promoted the floral initiation of semi-winter variety mainly through the FLC, SOC1, and LFY signaling pathways, and the gibberellin also played a positive factor in this process. In essence, the present study provides valuable information on the gene expression differences of vernalization-driven floral transition for spring and semi-winter ecotypes of rapeseed when the photoperiod is not an unlimited factor.

1. Introduction

Rapeseed (Brassica napus L., AACC), derived from interspecific hybridization between B. rapa (AA) and B. oleracea (CC), is grown commercially in the world to produce edible oil for human consumption and protein meal for feeding livestock [1,2]. In adapting to diverse natural environments, rapeseed has formed three ecotypes which diverge on vernalization requirements: spring, semi-winter, and winter [3,4]. The winter ecotype requires obligate vernalization (5–15 °C for 30 days) to commence floral initiation. In contrast, the semi-winter and spring ecotypes have moderate (15–25 °C for 20 days) and weak vernalization requirements, respectively [5]. Floral initiation is an irreversible transition of shoot apical meristem (SAM) from vegetative growth to producing an inflorescence. The first morphological sign of floral initiation is the appearance of dome-like bud primordium on SAM [6]. However, before the occurrence of morphological characteristics, the programmed process of floral initiation was triggered by a series of physiology and molecular biology.
The essence of floral initiation is to relieve the constitutive repressor system in plants blocking floral initiation in response to external environmental stimuli. In Arabidopsis, genes including FLOWERING LOCUS C (FLC), FRIGIDA (FRI), EMBRYONIC FLOWER (EMF), and SHORT VEGETATIVE PHASE (SVP) have been identified as inhibitors of floral initiation during the vegetative stage [7,8,9,10]. CONSTANS (CO) is the hub gene involved in the photoperiodic-driven floral initiation to integrate light quality and day length information, which could upregulate the expression of flowering-promoting genes FLOWERING LOCUS T (FT) and SUPPRESSOR OF OVEREXPRESSION OF CONSTANS 1 (SOC1) under long-day conditions [11,12,13]. The vernalization-driven floral initiation is to downregulate the expression of FLC through DNA demethylation [14,15]. VERNALIZATION INSENSITIVE3 (VIN3), induced after a prolonged period of cold, has been identified to participate in the vernalization pathway to initiate the modification of FLC chromatin structure [16]. The genetic architecture and regulating mechanism of the flowering time have been well described in the model plant A. thaliana [17]. QTL mapping identified many candidate flowering-related genes corresponding to homologous genes in Arabidopsis thaliana, which were associated with photoperiod, circadian clock, vernalization, and gibberellin pathways [18,19,20].
Nitrogen management is an effective strategy to increase plant growth rate and improve the productivity of rapeseed. Meanwhile, nitrogen application changed the carbohydrate and protein content in the leaf. In previous studies, much literature has discussed the potential relationship between the levels of carbohydrate and protein and the commencement of floral initiation. Floral initiation has been shown to coincide with a steep decrease in carbohydrate levels of the major branches in avocado (Persea americana Mill.), since minimum carbohydrate content caused a cessation of vegetative activity and favored floral initiation taking place [21]. In contrast, the soluble sugar and soluble protein content in the leaves of chrysanthemum (Dendranthema grandiflorum) showed a significant increase at the floral initiation stage [22]. The nutrient diversion hypothesis proposed by Raper (1988) demonstrated that the floral onset was stimulated by an imbalance in the relative concentrations of carbohydrates and nitrogen in SAM, rather than their absolute concentration [23]. The resource budget model hypothesized that floral transition is stimulated when the resource level exceeds the threshold level [24]. Whether the soluble sugar and protein concentration could be considered a sign of rapeseed floral initiation still needs further research.
Floral initiation is the most critical time point to determine the sufficient and high-quality floral bud formation and, subsequently, the pod number and seed yield. The Yangtze River Basin in China is the most important and largest rapeseed planting belt globally, accounting for 15% of the global rapeseed production [25]. The rice–rapeseed farming system is widely used in this region, and semi-winter rapeseed is transplanted after rice through seedling raising. In recent years, farmers have begun to use direct sowing in large quantities to save labor and investment. However, the problem is that if the rapeseed is direct-seeded after the late-season rice is harvested, some varieties with a long growth period will be affected by the late sowing and the growth of the seedling stage, and it will be difficult to obtain the yield in severe cases. The selection of spring-type varieties with early maturity and fast growth in the early stage may be an effective strategy to alleviate the time contradiction. Therefore, an in-depth understanding of the different gene expression and regulatory networks driven by vernalization of spring and semi-winter genotypes has scientific and practical implications for rapeseed production.
In this study, we investigated the morphological features of SAM for spring and semi-winter genotypes to determine the timing of floral initiation onset under two experiments. We provided soluble sugar and protein concentration in the leaf under different nitrogen supplies and the transcriptome profiling of SAM under normal and cold conditions. The objectives of the present study were (1) to investigate whether the soluble sugar and protein levels in a leaf could be considered an early sign of floral initiation, and (2) to elucidate the differential gene expression of prior- and post-floral initiation under normal and low-temperature conditions over time. We have focused on genes involved in the flowering regulation network driven by vernalization for spring and semi-winter type cultivars.

2. Materials and Methods

The conventional spring genotype “1358” and semi-winter genotype “Zhongshuang No. 11” used in this study were provided by Hunan Agricultural University and the Chinese Academy of Agricultural Sciences, respectively. “Zhongshuang No. 11” is an intermediate-maturing variety widely planted in the Yangtze River basin, while “1358” could exert its early-ripening advantage to match multiple cropping in this region. Previous field trials across four years indicated that “1358” could start floral initiation when the mean temperature during the vegetative stage was around 24 °C, while “Zhongshuang No. 11” required a low temperature of less than 18 °C to start floral initiation [25].

2.1. Experiment 1: Floral Initiation Response to Soluble Sugar and Protein Levels in the Leaf

A glasshouse experiment was conducted in rectangle boxes to investigate the soluble sugar and protein contents in leaves from the vegetative stage to the floral initiation stage. The soluble sugar and protein contents of the leaf were altered by different amounts of nitrogen application. The boxes of 80 cm in length, 60 cm in width, and 16 cm in height were filled with a sun-dried and sieved (2 mm) mixture of clay and sand (1:1, w/w). The experiment was performed in a completely randomized design with two ecotype cultivars and four nitrogen levels (N0: 0 kg ha−1, N5: 75 kg ha−1, N15: 225 kg ha−1, N25: 375 kg ha−1). In total, there were eight treatments with three replications, and 24 boxes were used in this experiment. The nitrogen was supplied as granular urea and was thoroughly mixed with a full volume of soil in the box before seed sowing. Superphosphate and potassium chloride were applied as basal fertilizers at doses of 75 kg P2O5 ha−1 and 120 kg K ha−1, respectively.
Seeds were sown in rows with a spacing of 10 cm on 1 November 2014 and were finally thinned to 90 plants per box after seedling establishment. The environmental temperature for plant growth is provided in Figure 1. The soil volumetric water content in the boxes was monitored by Fieldscout TDR300 soil moisture meter (Spectrum Technologies Inc., Aurora, IL, USA) in an interval of 3–5 days. When relative soil water content dried down to 40–50%, containers were fully irrigated with tap water and naturally drained through the bottom pores to avoid drought stress throughout the experimental period. When plants reached the two-leaf stage, the youngest fully expanded leaf was taken in three replicates for each treatment at an interval of 5 days. The leaves were sampled from 8:00 a.m. to 9:00 a.m. and immediately frozen in −80 °C ultra-low temperature freezers for subsequent physiological measurement. Soluble sugar and protein contents were determined by using anthrone colourimetry [26] and coomassie brilliant blue [27] with fresh samples, respectively. Three juvenile plants per replicate were dissected under an optical microscope to record the developmental stage of SAM at each assessment time. The commencement of floral initiation was identified when the dome-like protrusions appeared on SAM (Figure 2). The seed yield was determined by harvesting the central ten plants of each box after maturity. Analysis of variance (ANOVA) for nitrogen application treatment was performed using R v4.0.3 (https://www.r-project.org/, accessed on 13 October 2021).

2.2. Experiment 2: Transcriptional Regulation of Floral Initiation in Response to Vernalization

A pot experiment was conducted in a growth chamber to investigate the different gene expressions related to regulating floral initiation in response to normal and low-temperature conditions for spring and semi-winter genotypes. Plastic pots of 20 cm in height and 10 m in diameter were filled with nutrient soil (an average of 15.5 g kg−1 organic matter, 127.2 mg kg−1 alkalystic N, 16.5 mg kg−1 available P, 111.9 mg kg−1 available K, and pH 6.86), and we cultured 80 pots for each variety. Three seeds were sown in each pot, thinned to one plant per pot after seedling establishment. Then, half the pots for each variety were placed in a temperature-controlled chamber (day/night temperature cycle of 25/20 °C) with a 16 h photoperiod (300 µmol photons m−2 s−1), and the other half were placed in a temperature-controlled chamber (day/night temperature cycle of 15/10 °C) with the same light conditions. The pots were arranged in the chamber with a completely randomized design. The plants of spring genotype “1358” were sampled at 1 week, 2 weeks, 3 weeks, and 4 weeks after the commencement of temperature control. The plant of the semi-winter genotype “Zhongshuang No. 11” was sampled at 1 week, 2 weeks, 4 weeks, 6 weeks, and 8 weeks. At each time point, five plants were dissected for each treatment to record the developmental state of SAM, and the shoot tip of nearly 2 mm in height was cut by using an alcohol-sterilized knife and was mixed in a 1 mL centrifugal tube. The sample was quickly frozen in liquid nitrogen and stored in −80 °C ultra-low temperature freezers for subsequent RNA isolation.
The total RNA was extracted and purified using The E.Z.N.A.® RNA reagent according to the protocol. After the separation of mRNA by the magnetic bead method, ion interrupted mRNA was synthesized into double-stranded cDNA. After that, the cDNA fragments were purified and end-repaired, with the addition of A base at the 3’ end and ligation of the index linker. The ligation products were PCR-amplified for 15 cycles, recovered with 2% agarose gel, and quantified with TBS380 (Picogreen). Bridge PCR was performed on cBot and sequenced in 150-bp paired-end reads using Illumina HiSeq2000. For the raw data, we first performed data quality control to obtain high-quality clean data, then aligned the clean data to the reference genome using Hophat2, and obtained the aligned results in BAM format [28]. Based on the comparison results, the transcripts were spliced and assembled using Cufflinks and quantitatively analyzed using RSEM [29]. Since there was no biological duplication, identification of differential gene expression was performed using package edgeR [30]. Genes with FDR (false discovery rate) < 0.05 and fold change > 2 were screened as differentially expressed genes. The KEGG enrichment analysis of differentially expressed genes was performed based on a hypergeometric test. Weighted gene co-expression network analysis (WGCNA), a systematic biological method used to describe gene association patterns among samples, was used to identify gene sets with highly synergistic changes [31]. In constructing a gene co-expression network, WGCNA uses scale-free clustering and a dynamic shearing tree to optimize classification to achieve accurate and efficient data analysis.

3. Results

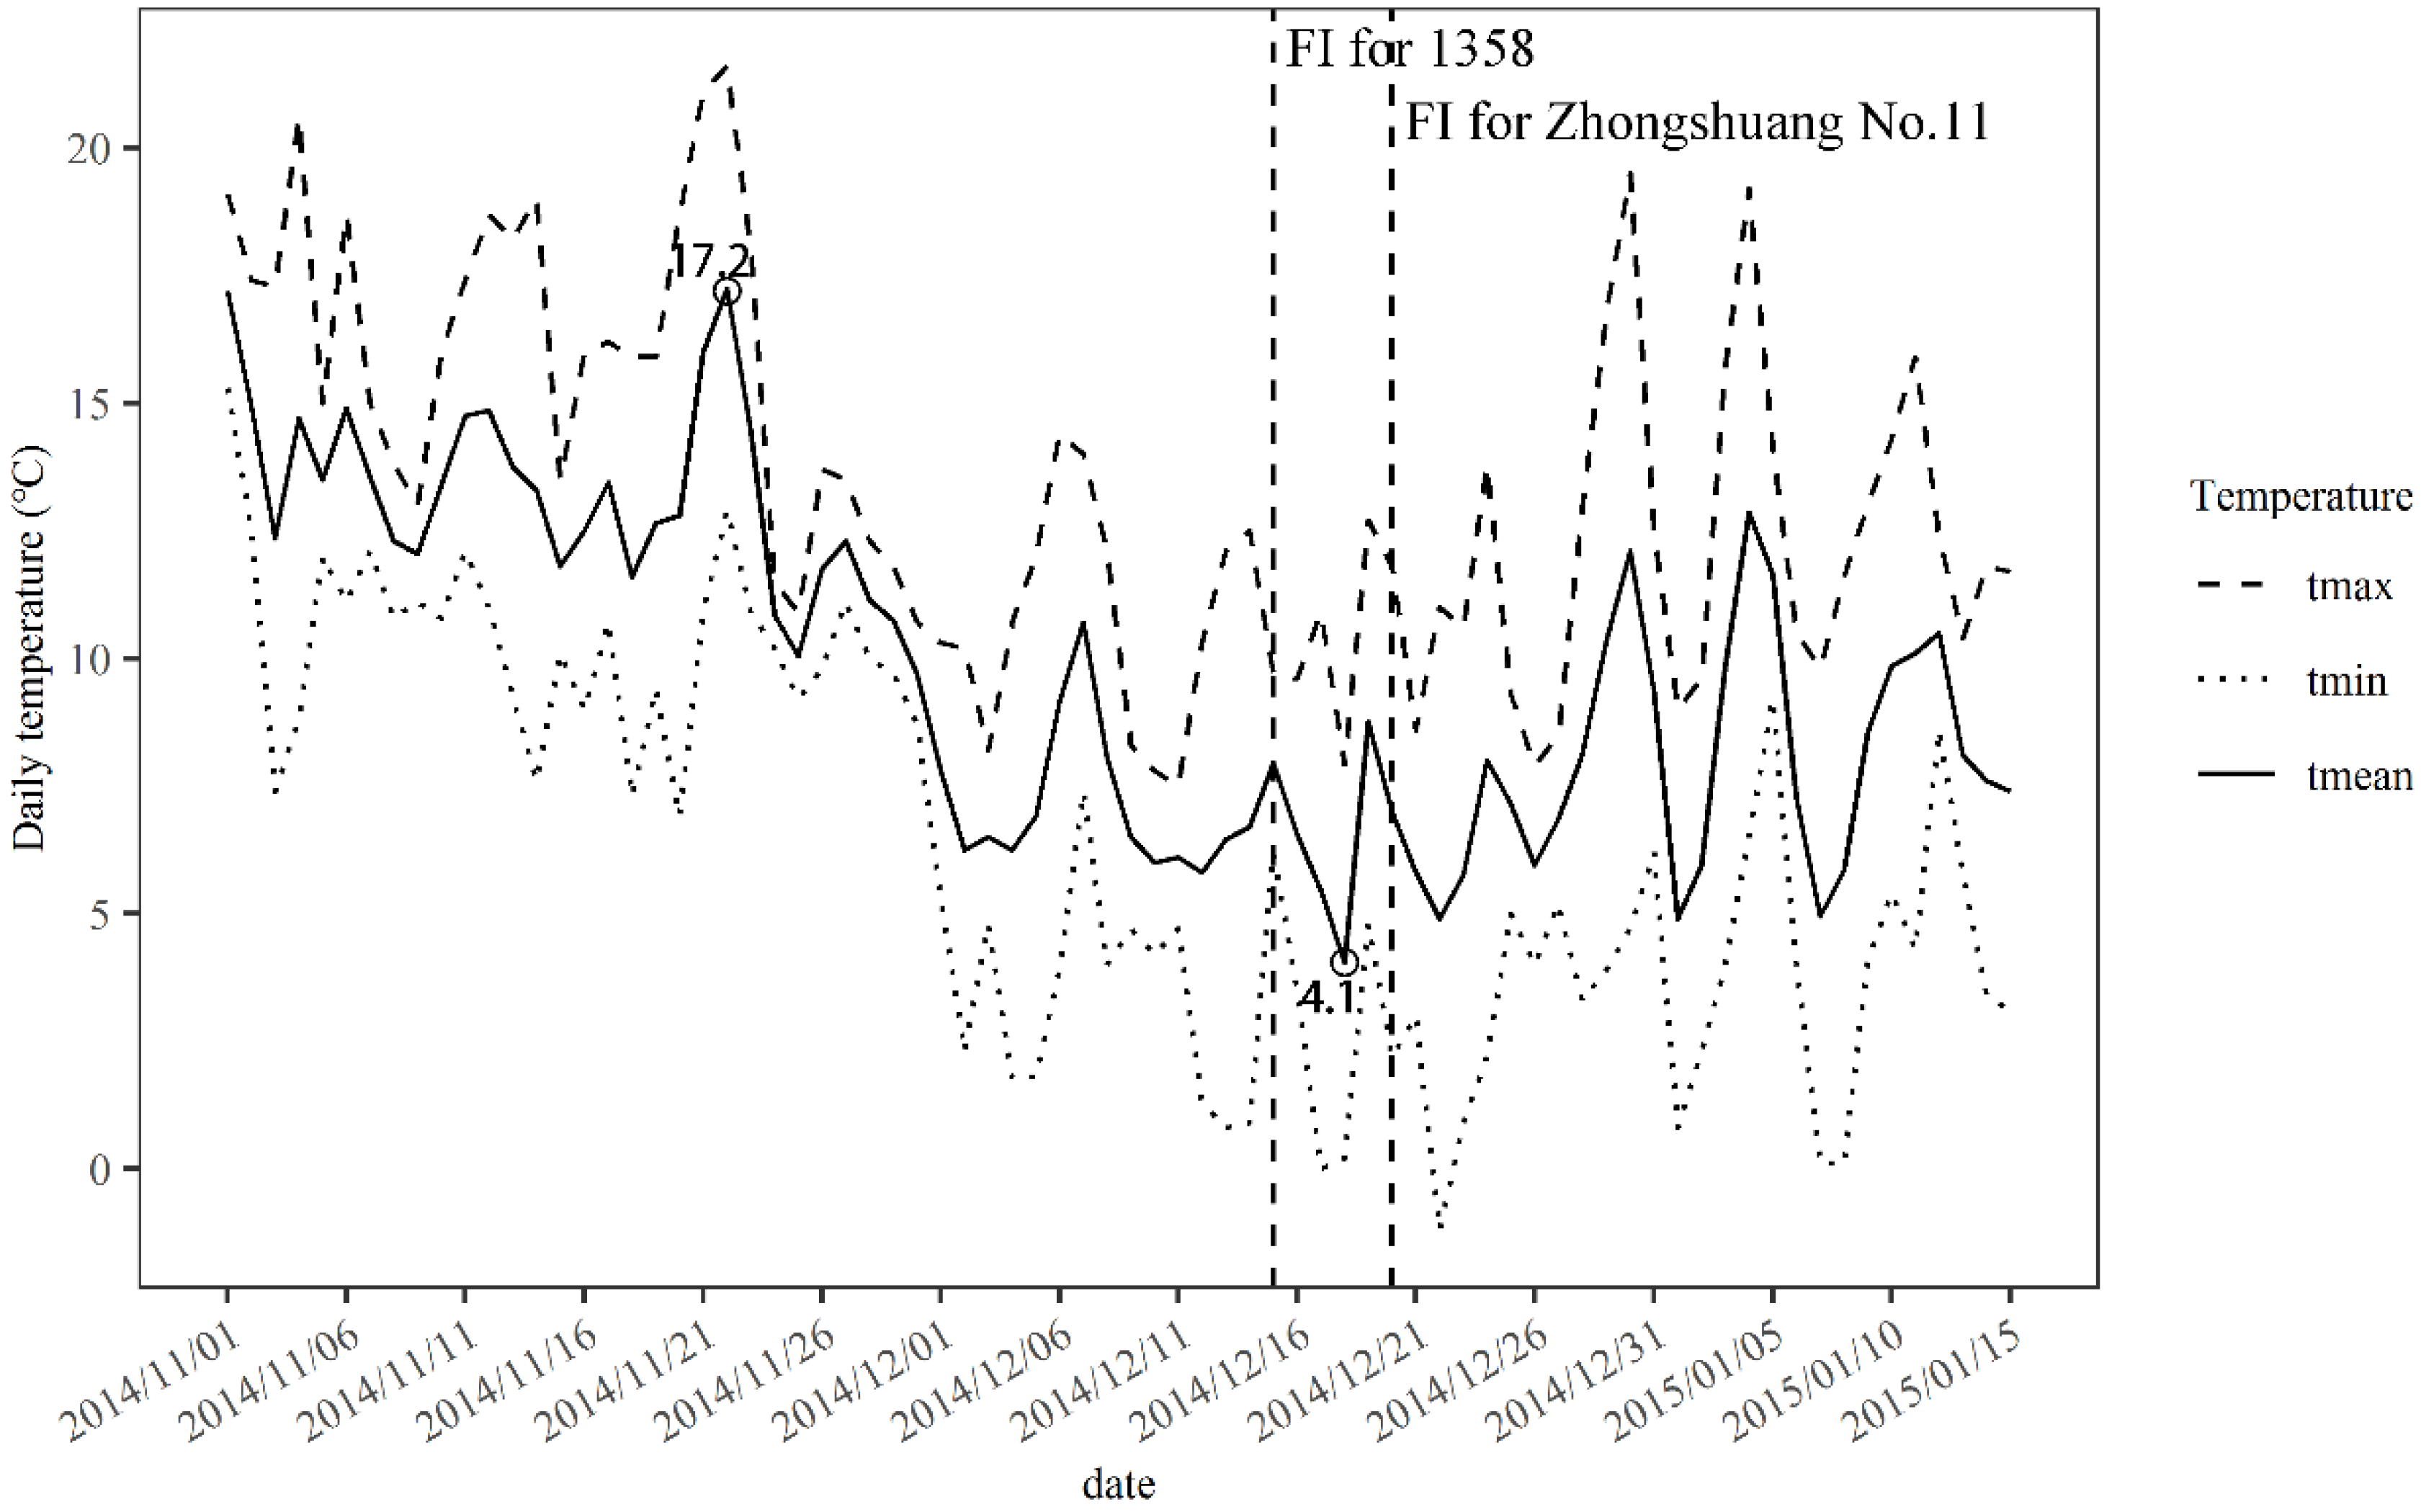
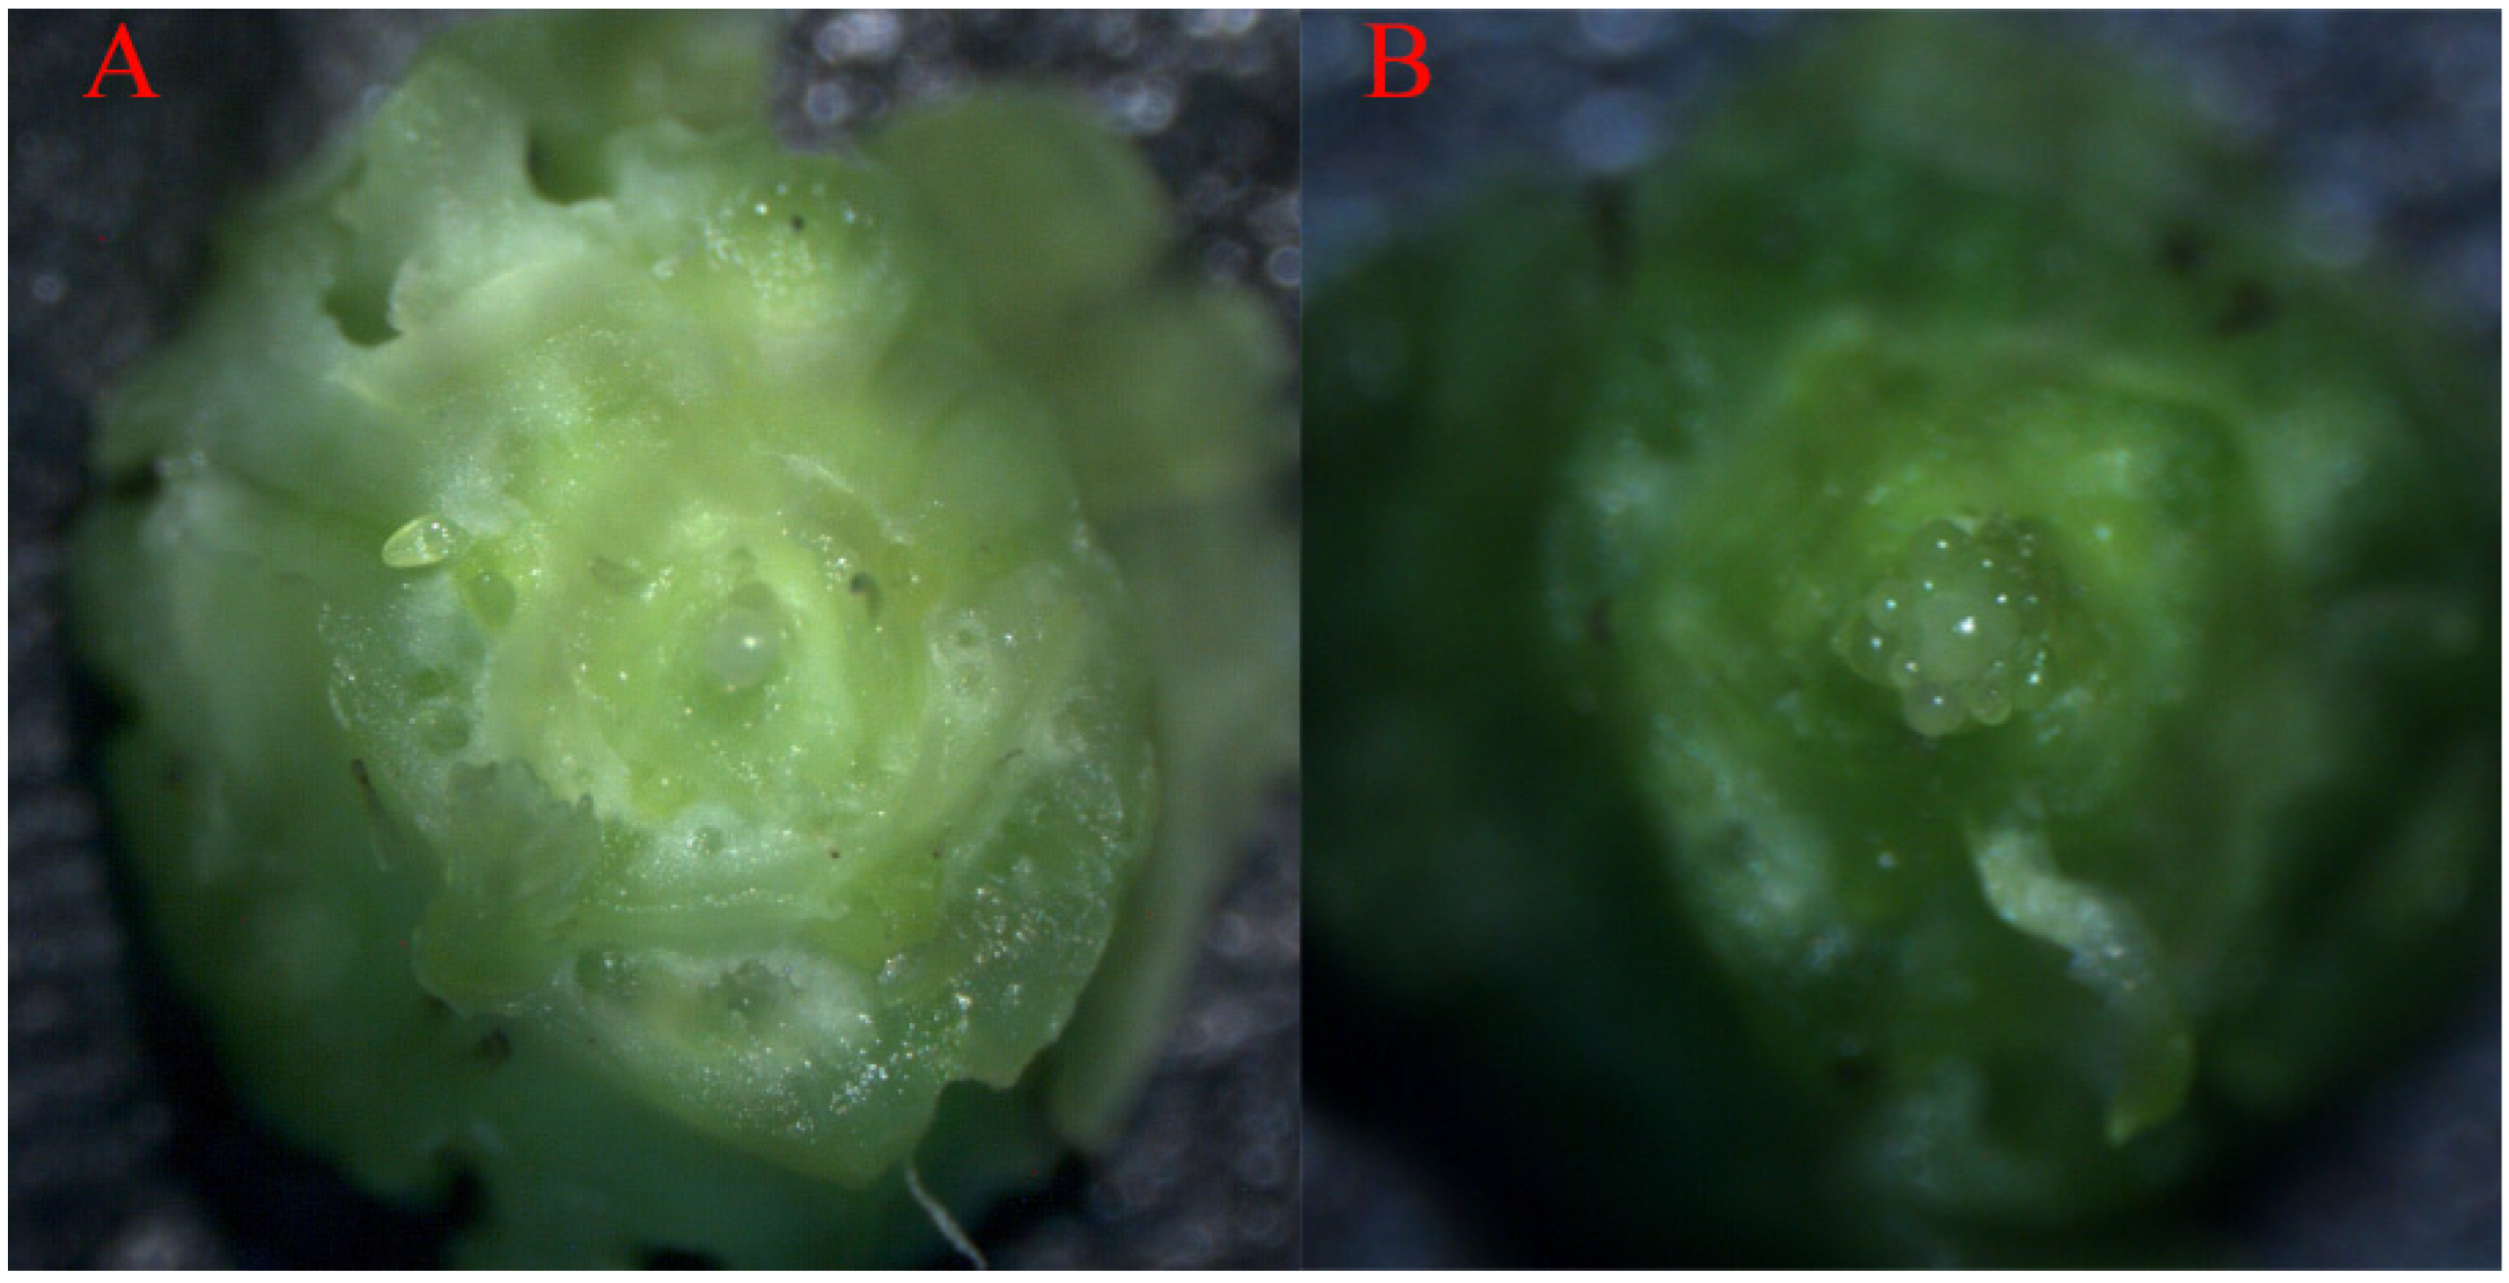
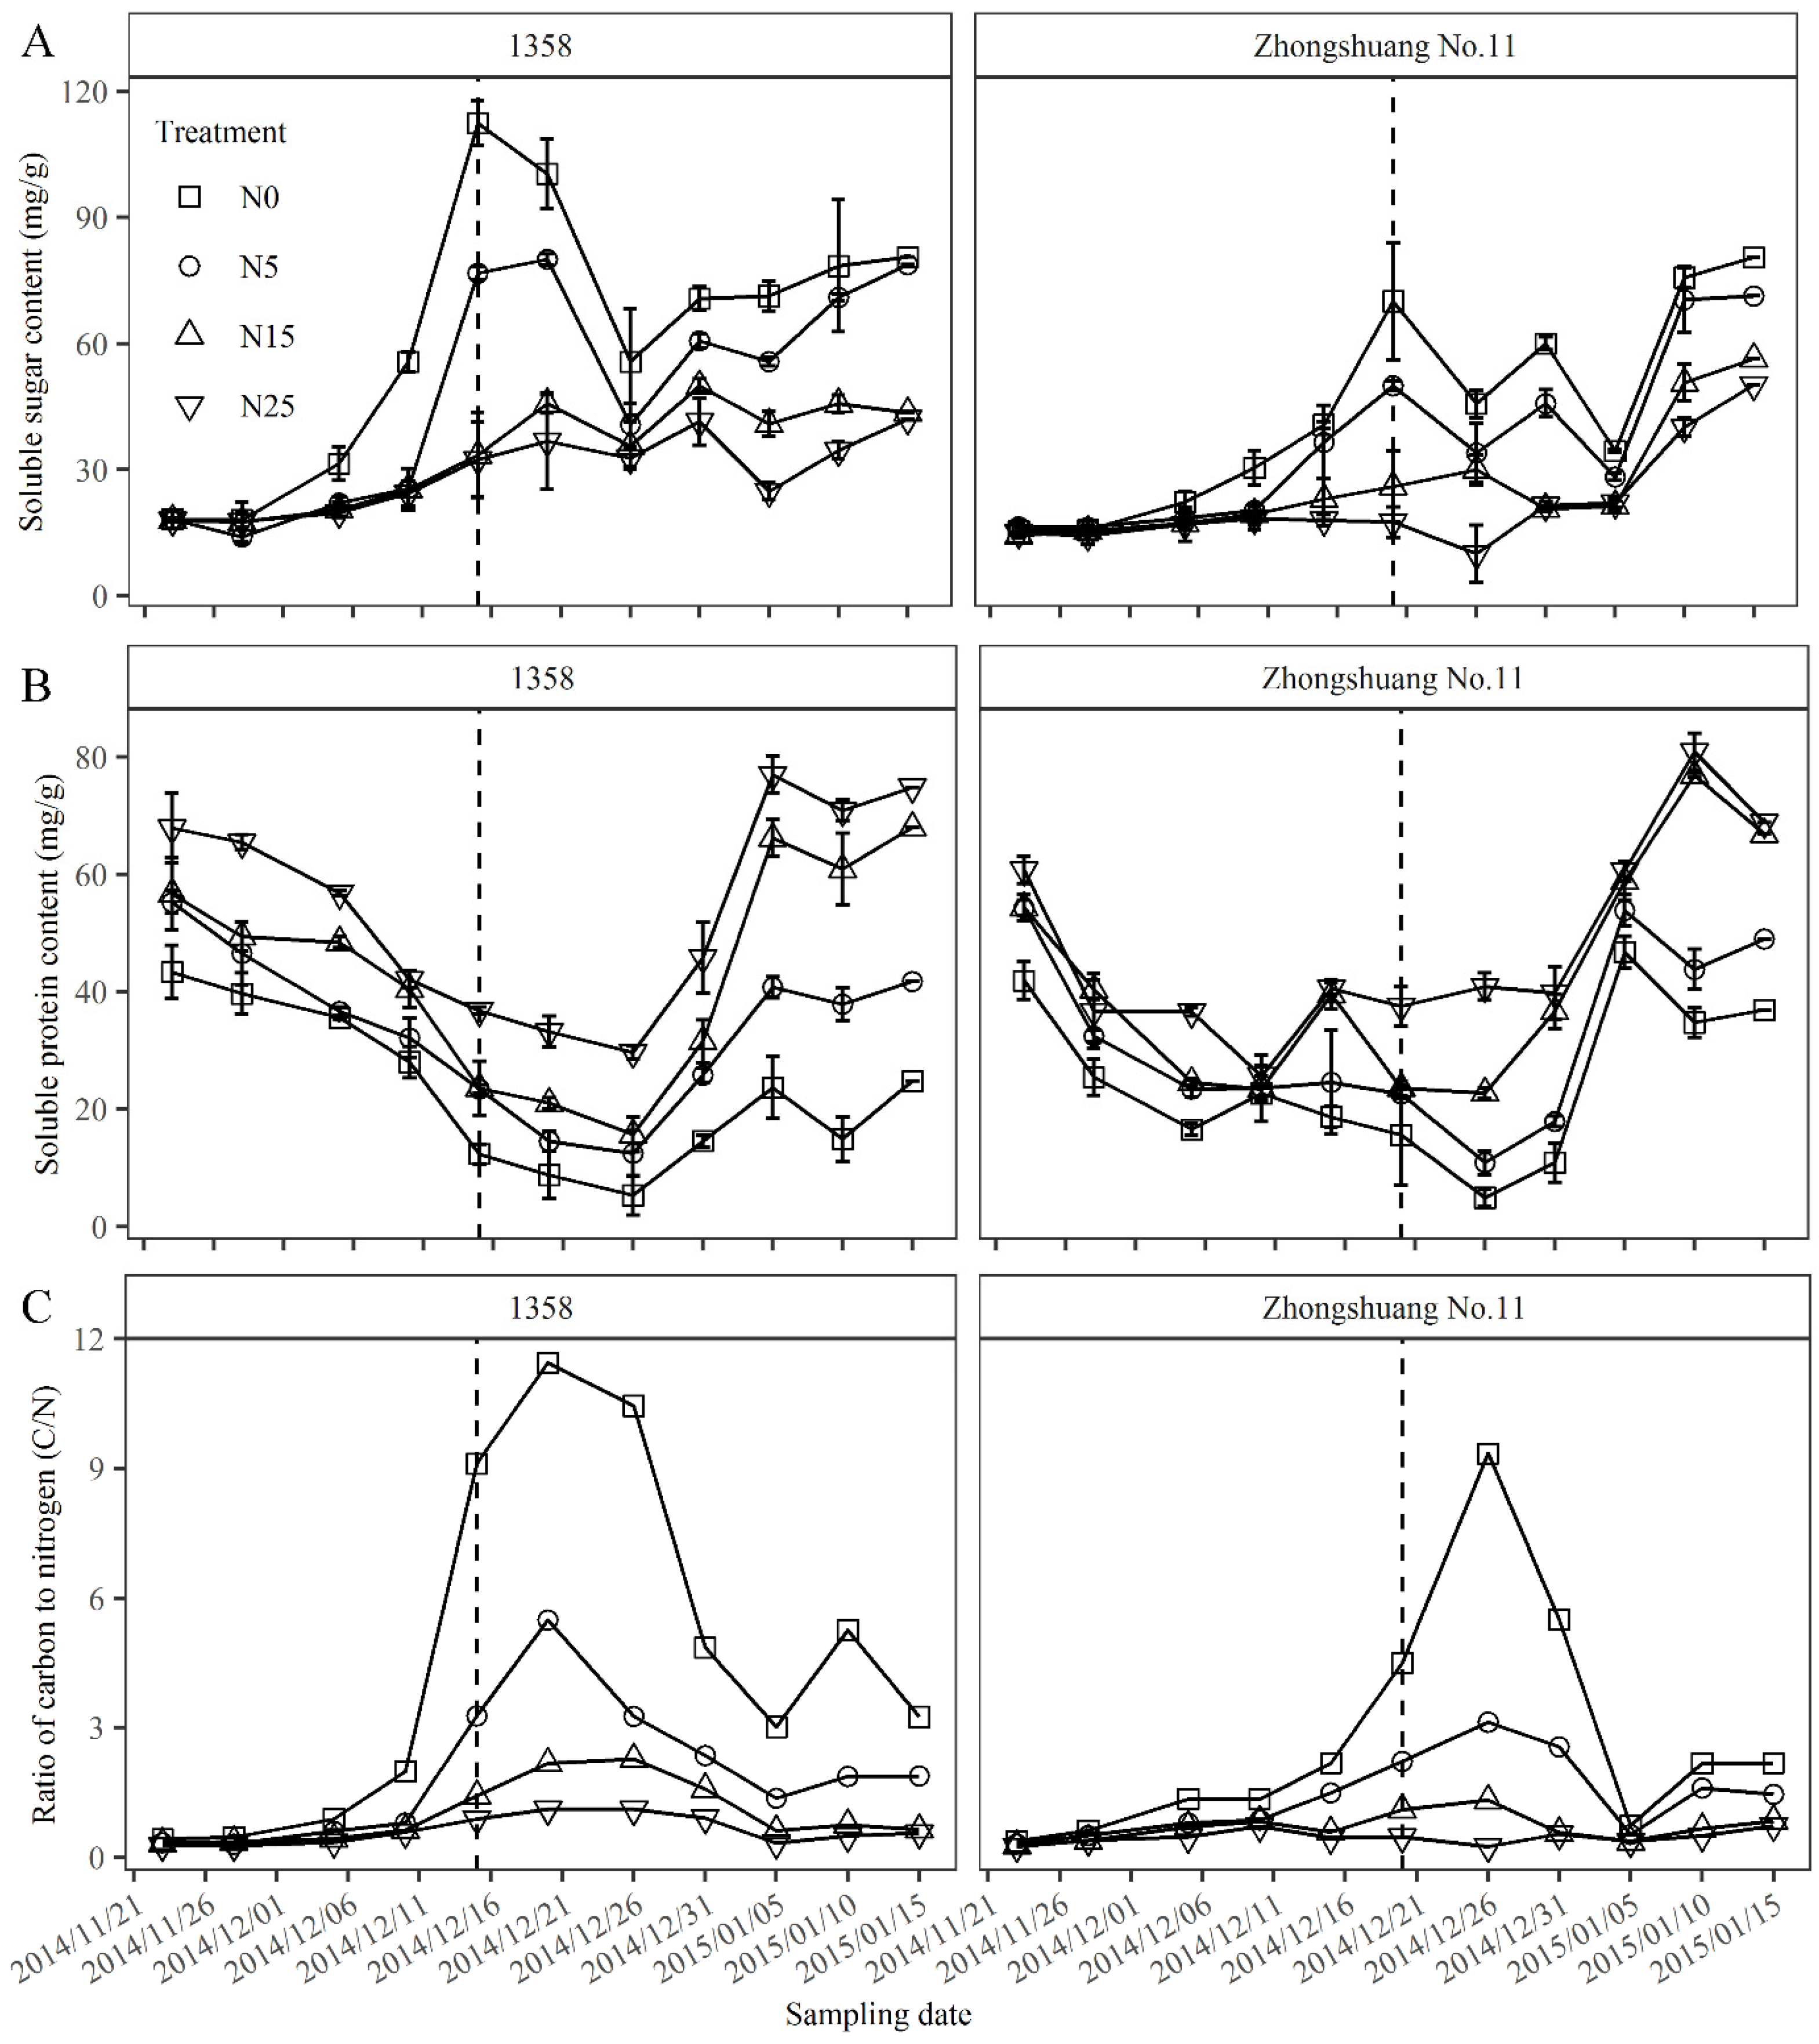
3.1. Floral Initiation Responses to Dynamic Changes of Soluble Sugar and Protein Contents of Leaf

The mean daily temperature fluctuated downward from 17.2 °C to 4.1 °C from sowing to floral initiation in the glasshouse experiment, which could satisfy the vernalization requirement for the semi-winter variety (Figure 1). The floral initiation dates of “1358” and “Zhongshuang No. 11” commenced on 15 December and 20 December in the glasshouse experiment, respectively. Different amounts of nitrogen application changed the magnitude of soluble sugar and protein content of the leaves before and after the floral initiation; however, they did not affect the start time of floral initiation (Figure 3). The seed yield significantly increased with nitrogen application, increasing from N0 to N15, and there was no significant difference when nitrogen application increased from N15 to N20 (Figure 4).
Soluble sugar notably increased before floral initiation and decreased after floral initiation, while the protein content showed an opposite trend. At the time-point of floral initiation, the soluble sugar decreased from 112.3 mg g−1 to 32.4 mg g−1 for “1358” and from 70.1 mg g−1 to 17.5 mg g−1 for “Zhongshuang No. 11” when nitrogen application increased from N0 to N25. In contrast, the soluble protein content increased from 12.3 mg g−1 to 36.7 mg g−1 for “1358” and from 15.6 mg g−1 to 37.5 mg g−1 for “Zhongshuang No. 11” (Figure 3A,B). The ratio of soluble sugar to protein (C/N) showed a first increasing and secondly decreasing trend during the measuring period, reaching a peak value about five days after the appearance of maximum sugar content (Figure 3). The increase of sugar content to a peak could be considered a sign of floral initiation as it showed an uptrend before floral initiation and a downtrend after floral initiation, irrespective of the changing magnitude of different nitrogen applications (Figure 3A).

3.2. Floral Initiation Responses to Low Temperature for Spring and Semi-Winter Genotypes

The floral initiation date of spring variety “1358” was synchronous under normal and low-temperature treatments and started three weeks after the treatments began. For semi-winter variety “Zhongshuang No. 11”, the floral initiation started six weeks after low-temperature treatment began, while it did not start after eight weeks under normal temperature conditions (Table 1).

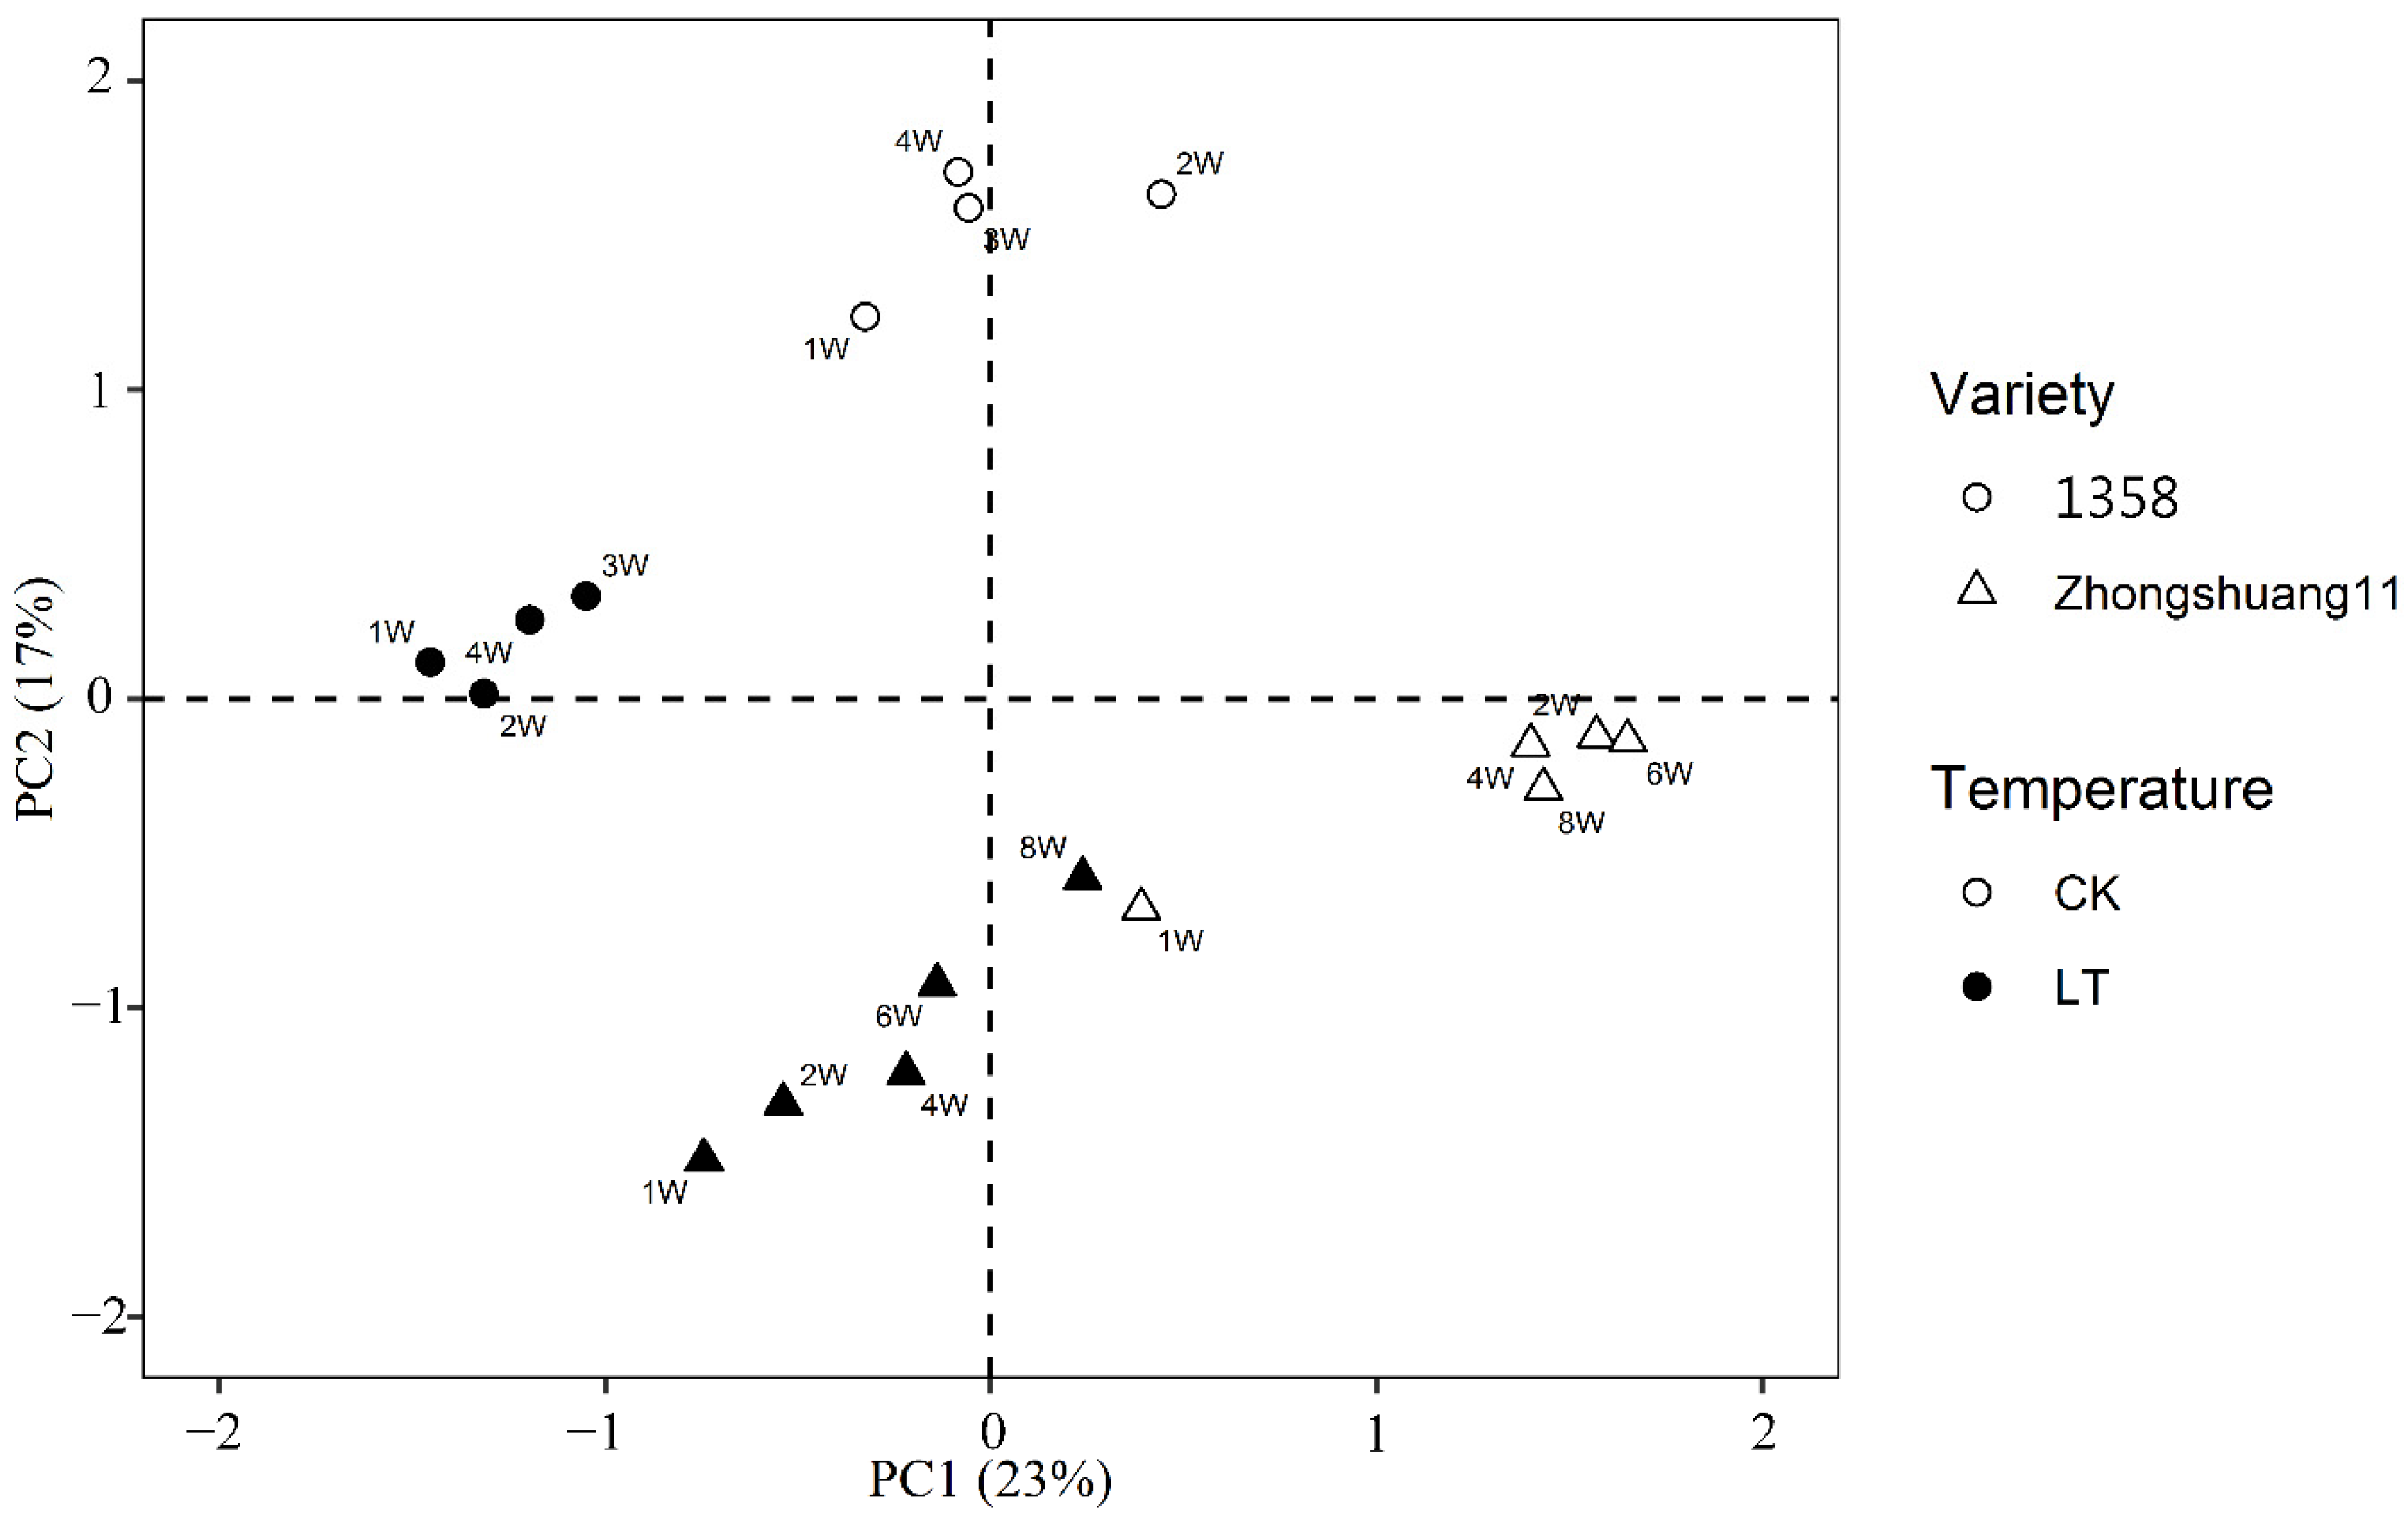
3.3. RNA Sequence Quality and Distribution of Samples under Different Treatments

The 18 samples obtained from shoot apical meristem at different developmental stages generated approximately 130 G raw data through RNA sequencing. The raw sequence data could be accessible in NCBI Short Read Archive database with reference number PRJNA792016. After filtering the raw data, a total of 454,361,680 high-quality reads (average Q30 > 92.7%) were used for further analysis, and about 75% of the total reads were mapped to the reference genome (Table 2). The results of PCA analysis showed that the 18 samples could be divided into four clusters among varieties and between the normal and low-temperature treatments (Figure 5). The closer the distance in PCA biplot between the samples, the smaller the difference in expression. As shown in Figure 5, the transcript profiles of “Zhongshuang No. 11” from week 2 to week 8 under normal temperature conditions were close to each other. In contrast, the samples of “Zhongshuang No. 11” under low-temperature conditions showed significant differences.

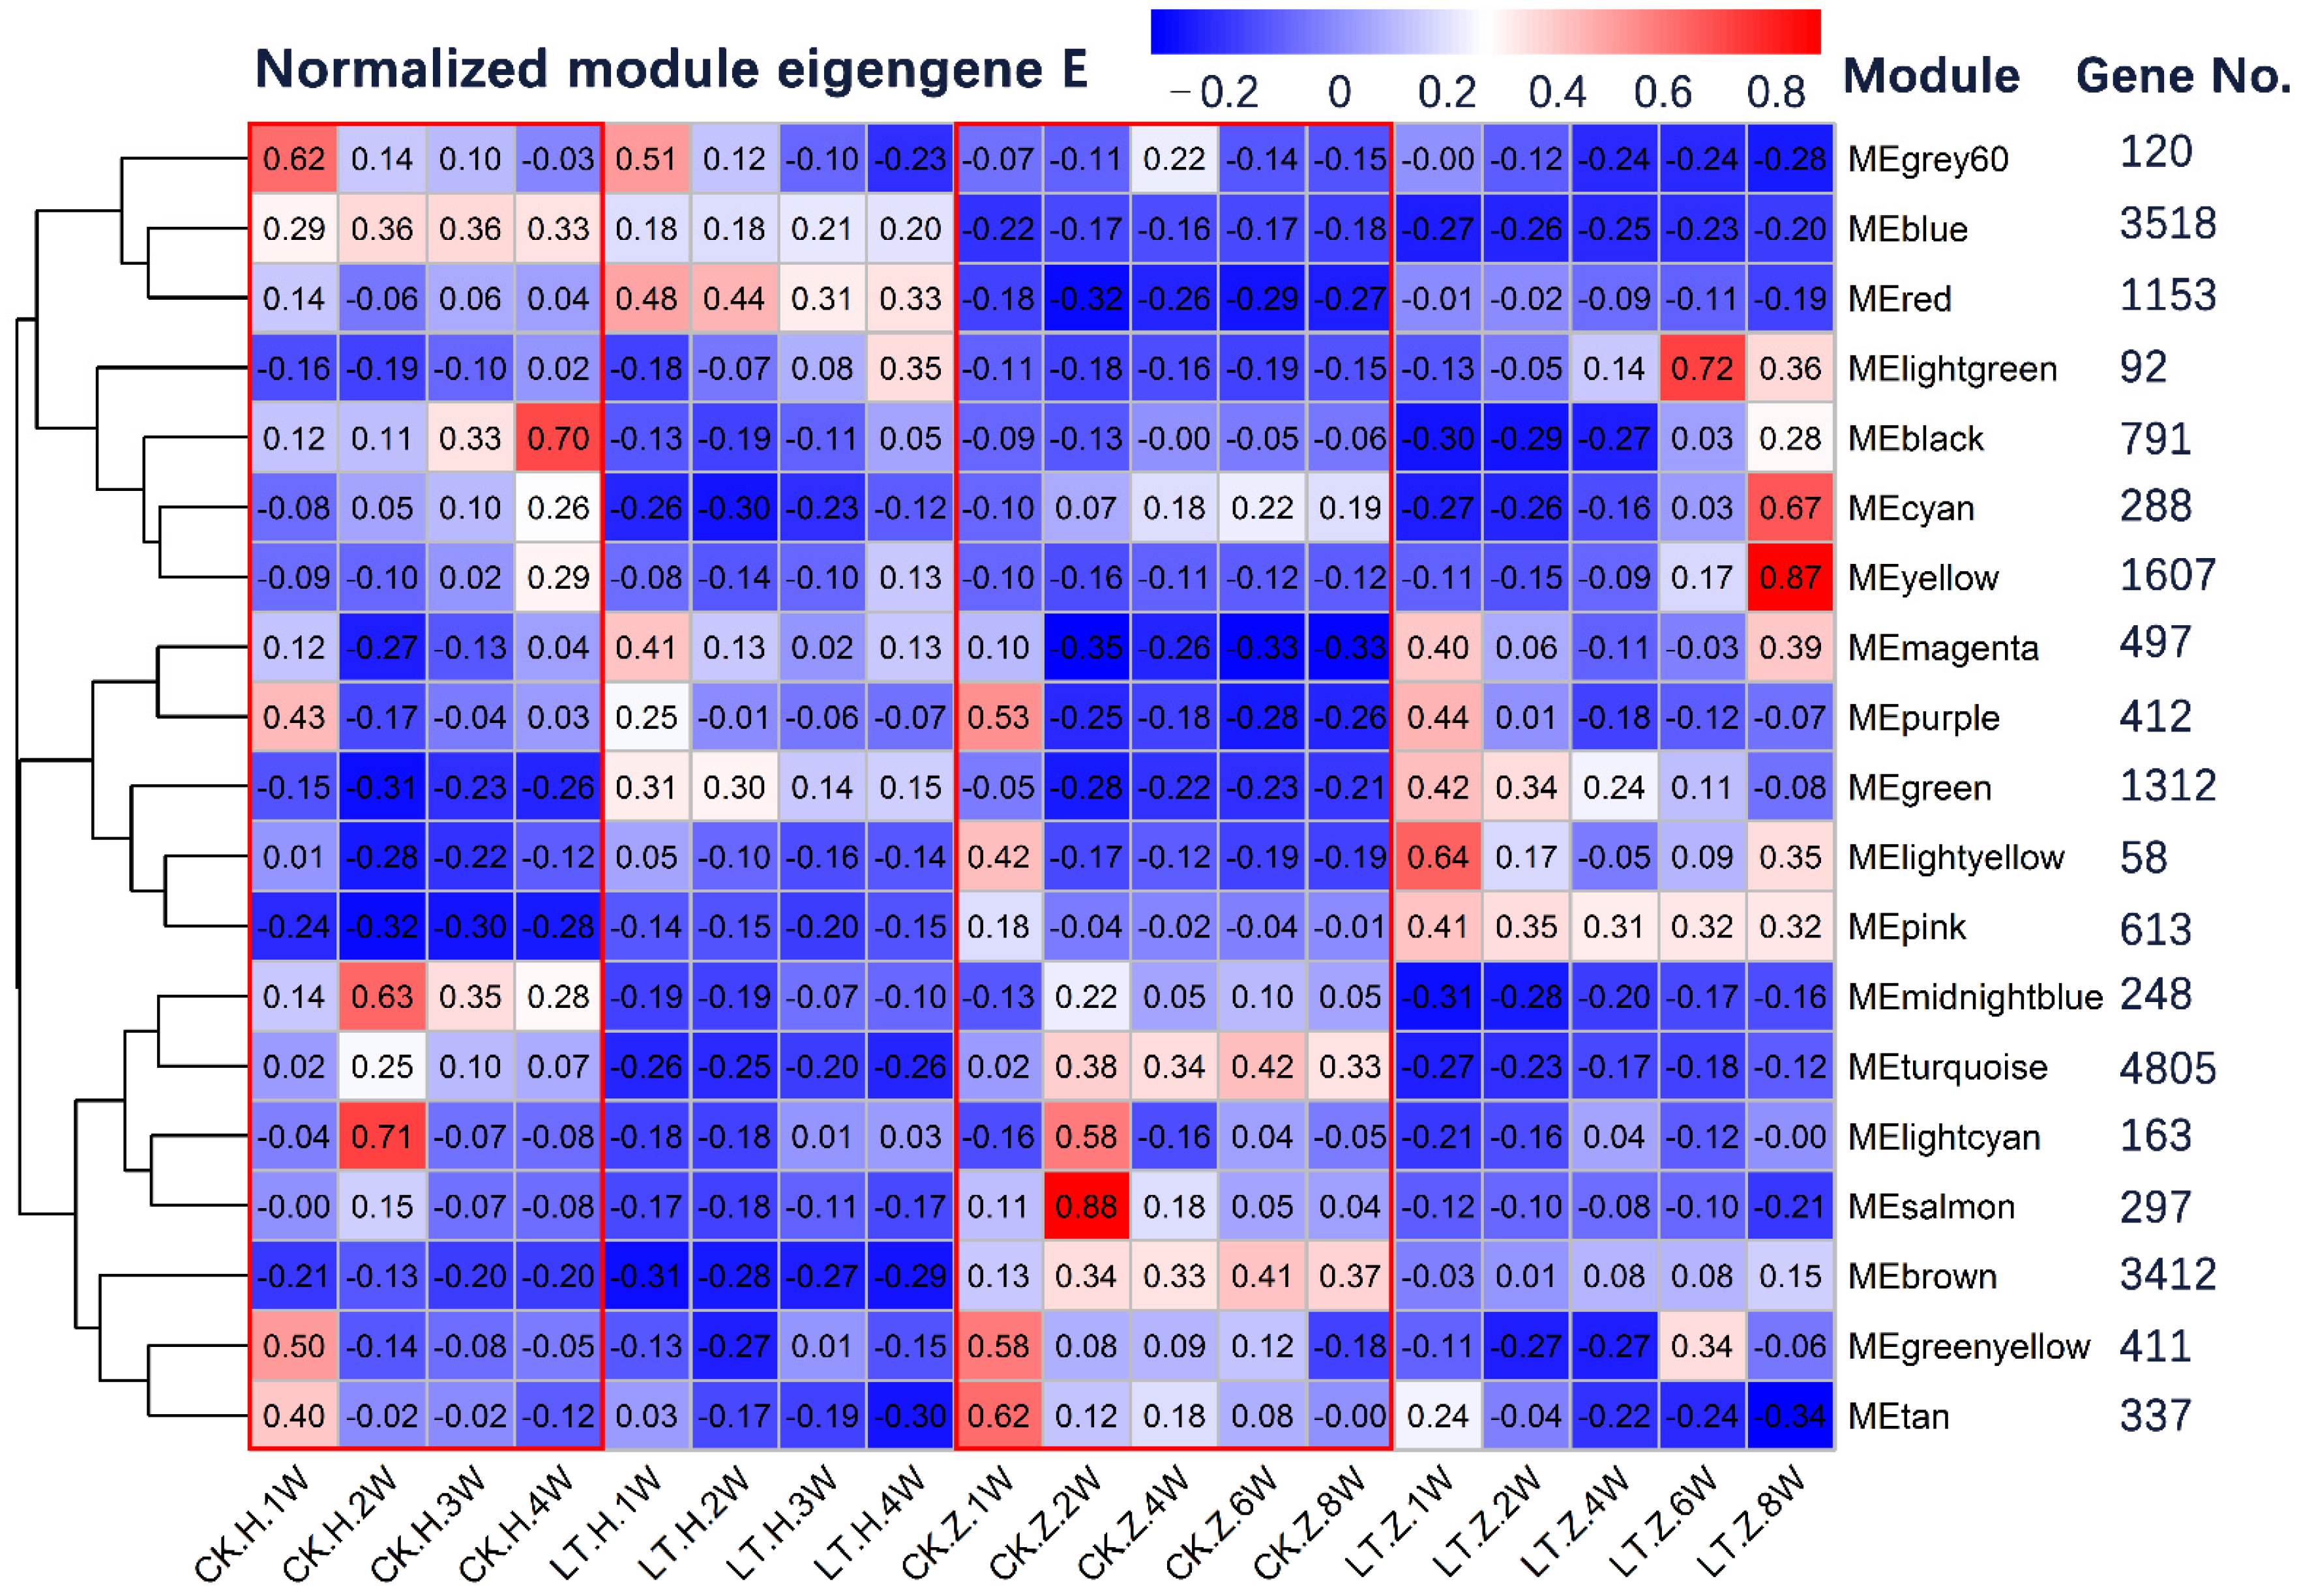
3.4. Modules Constructed by Gene Co-Expression Network Analysis

Weighted Correlation Network Analysis (WGCNA) was used to identify the association between gene expression changes and phenotypic differences to mine the core genes or gene modules that play a crucial role in the process of phenotypic development. In total, 16,251 differential expressed genes among the 18 samples were used for co-expression network analysis and were clustered into 19 modules based on the gene expression patterns (Figure 6). Among them, MEturquoise had the largest number of genes (4805), followed by MEblue (3518) and MEbrown (3412). In both “1358” and “Zhongshuang No. 11”, the gene expression levels in MEturquoise and MEbrown modules at normal temperature were higher than those at low temperature, suggesting that these gene clusters may be involved in the essential vegetative growth of plants and limited by low temperatures. The genes in the MEblue module may determine the earliness characteristic, as the gene expression level of “1358” in this module was higher than that of “Zhongshuang No. 11”, including zinc finger protein, serine/threonine-protein phosphatase/kinase, ubiquitin-associated protein, transmembrane protein, RNA-binding protein, etc. The gene expression level in the MEpink module was higher at low temperature than at normal temperature for both varieties, suggesting that genes in this module might participate in resistance to low temperature. The expression level of the “Zhongshuang No. 11” in the MElightgreen and MEyellow modules increased rapidly after the 6th week of low-temperature treatment, which might be involved in response to vernalization for the semi-winter ecotype.
The functional analysis of each module was analyzed by KEGG pathway enrichment and annotated in 12 categories, including amino acid metabolism, synthesis of secondary metabolites, carbohydrate metabolism, energy metabolism, environmental adaptation, folding, classification and degradation metabolism, lipid metabolism, cofactor and vitamin metabolism, nucleotide metabolism, signal transduction, transcription and translation, and transport and degradation (Figure 7). Gene function within the same module showed high diversity, especially for the MEyellow module, whose functions include amino acid metabolism, phenylpropanoid, fatty acid biosynthesis, peroxisome, etc. These primary metabolisms and biosyntheses are basic life activities in the development process. Many modules showed more or less intersection in gene function, especially between MEcyan and MEgreen, including ribosome, proteasome, fatty acid degradation, selenocompound metabolism, and carbon fixation in photosynthetic organisms, pentose phosphate metabolism, glycolysis, etc.

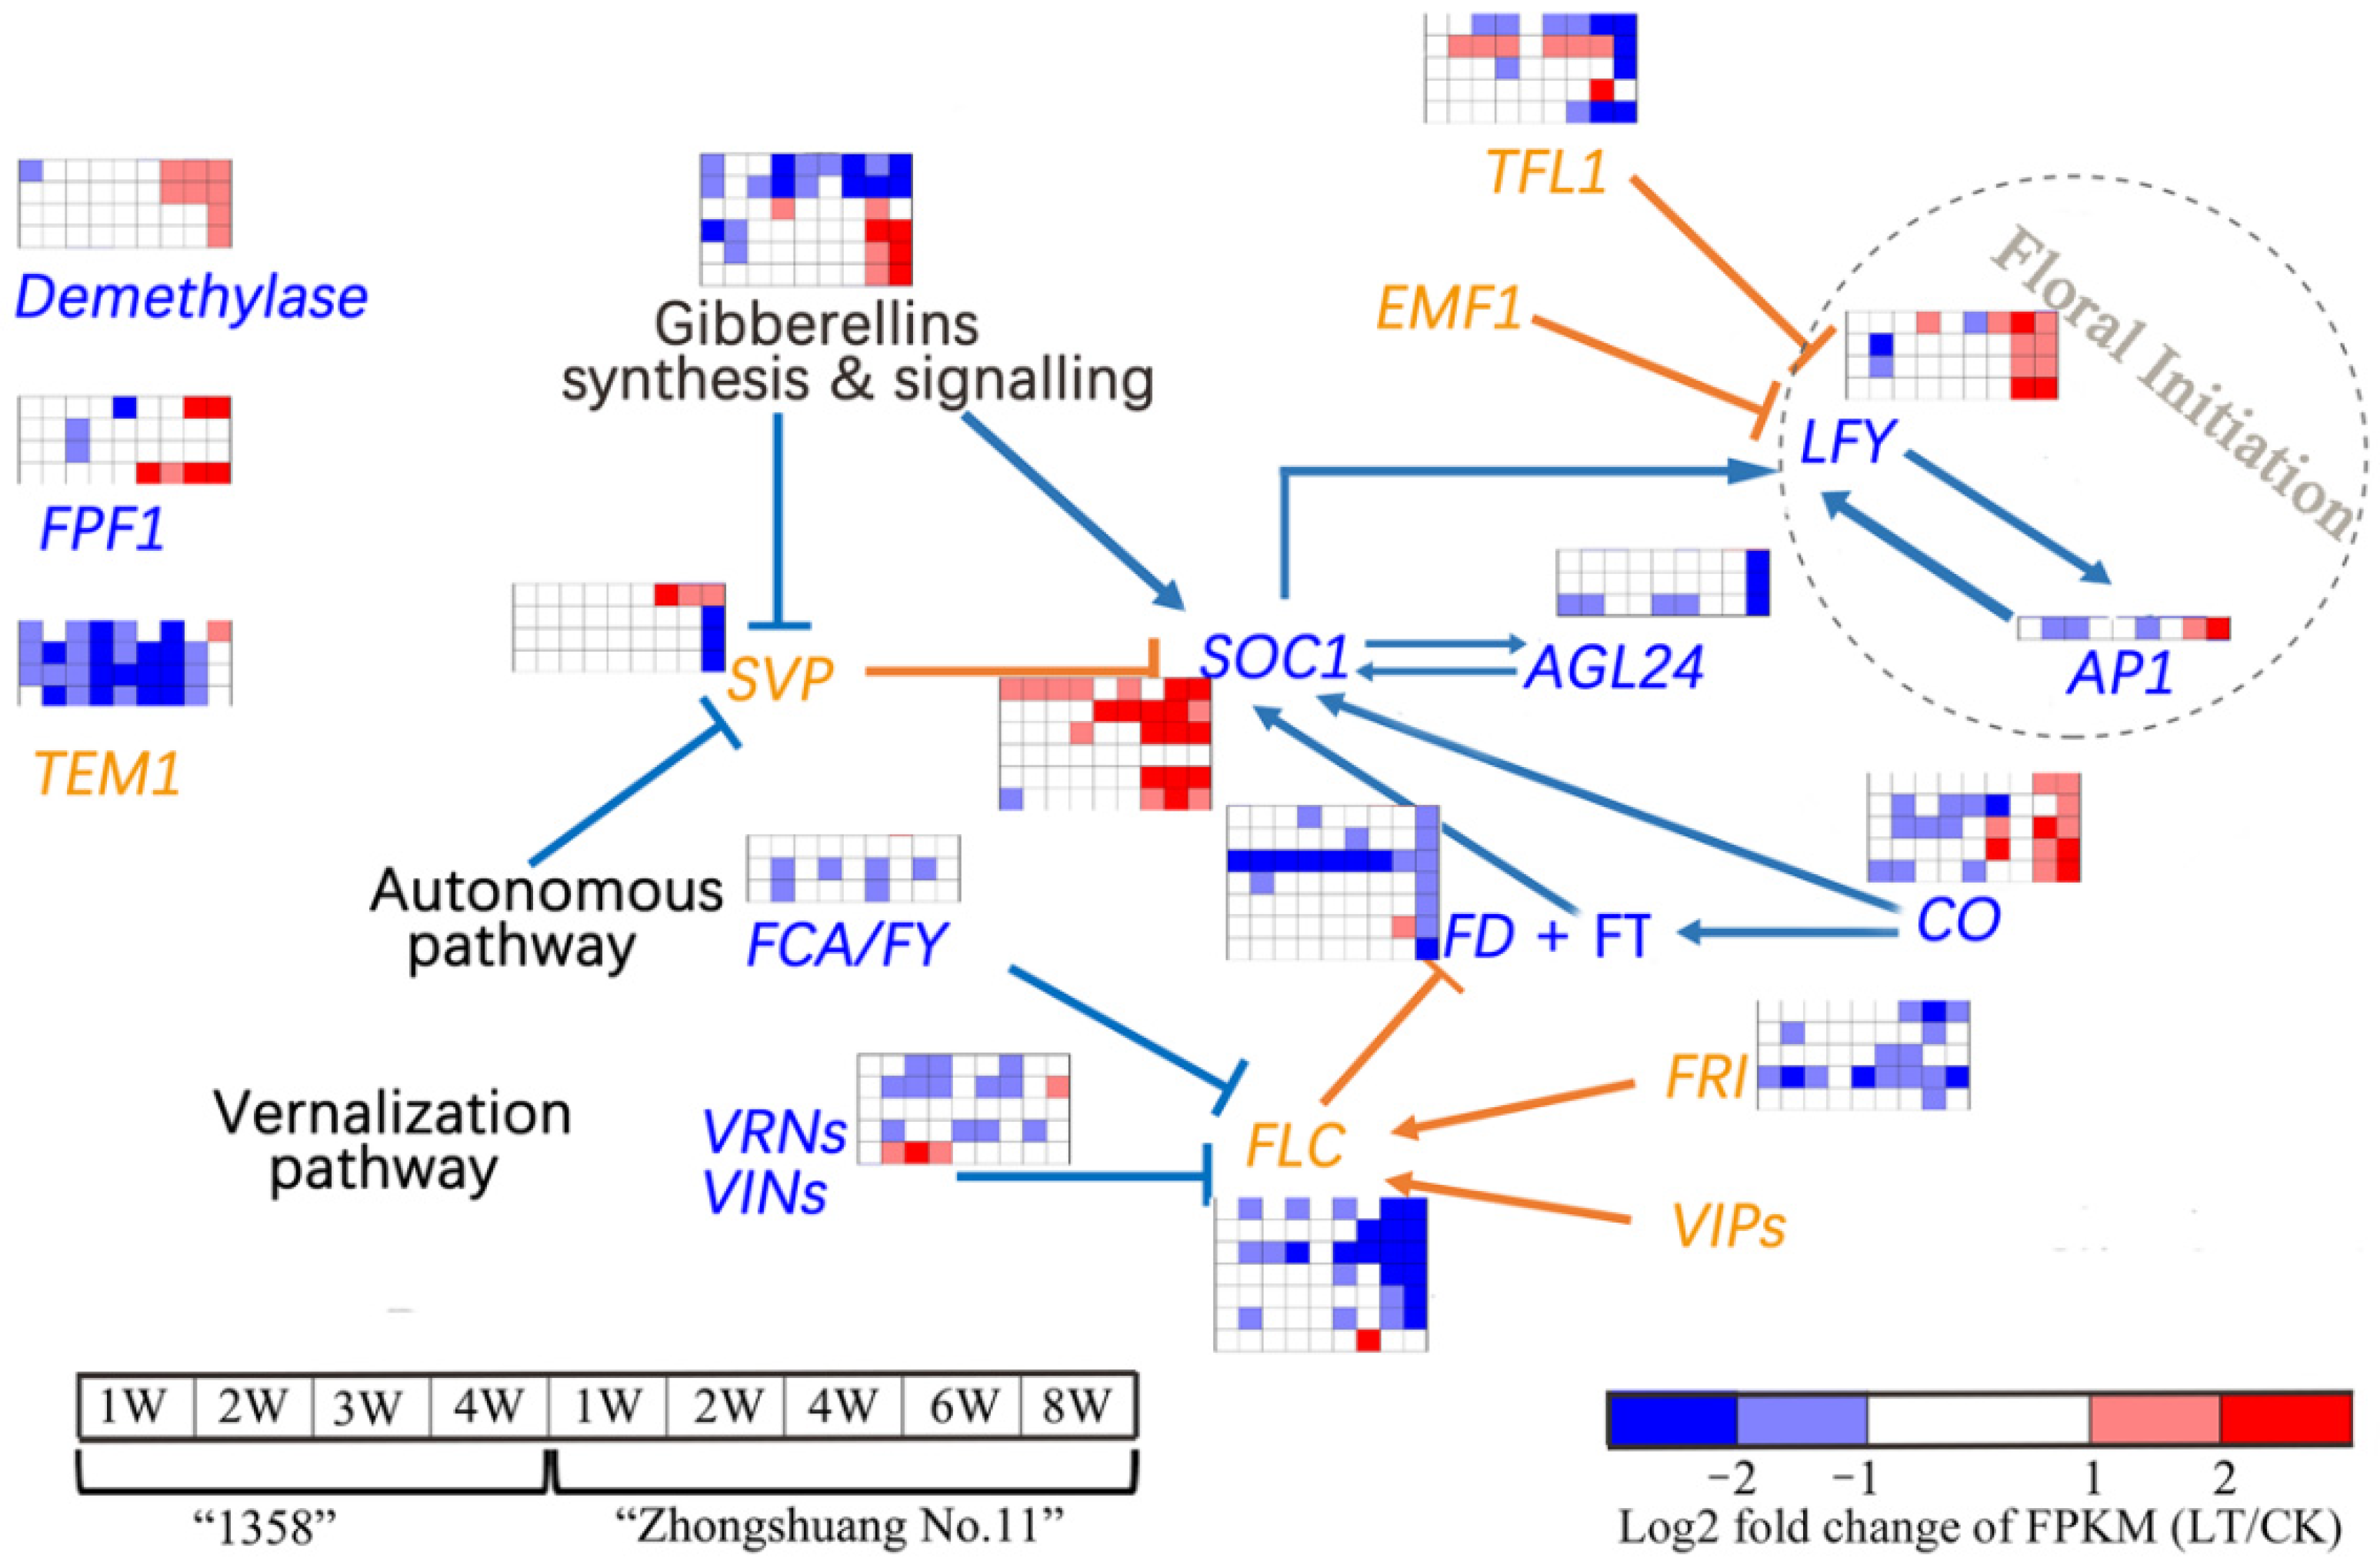
3.5. Expression of Genes Related to Regulatory Network for Floral Initiation

According to the flowering network mechanism of Arabidopsis thaliana, we focused on the expression changes of genes involved in floral initiation in the spring and semi-winter varieties (Figure 8). For spring variety “1358”, the expression of the FLC gene and downstream regulatory gene SOC1 (except for BnaA04g26320D) showed no significant difference under low-temperature treatment compared with control, indicating that low-temperature vernalization had no significant promoting effect on floral initiation of the spring variety. More intriguingly, the expression of SVPs involved in the autonomous pathway also had no significant difference, implying that the autonomous pathway played a dominant role in determining the floral initiation of the early-maturing variety. For the semi-winter variety “Zhongshuang No. 11”, the effect of low-temperature vernalization was mainly to downregulate the expression of flowering inhibition gene FLC, and thus improve the expression of downstream flowering promotion gene SOC1 and increase the expression of genes LFY and AP1, which are related to the initiation of the flowering program. The DNA demethylation gene Demethylase is also involved in the epigenetic process of floral initiation promoted by low temperature. The expression levels of four demethylation-related enzymes in the variety “Zhongshuang 11” increased after 6 to 8 weeks. For the semi-winter ecotype, the expression levels of four gibberellin synthesis-related genes were also increased after 6 to 8 weeks of low-temperature treatment, while for the spring ecotype, there was no significant increase in gibberellin synthesis gene expression. There was no significant difference in expression of the flowering-promoting gene FPF1 in the spring ecotype, and the upregulated expressions of two related genes were detected in the semi-winter ecotype, but the mechanism of its response to the low temperature still needs further study. Under low-temperature treatment, there was no significant difference in the expression of SVP. CO is a gene that senses the length of sunshine and promotes flowering. In this experiment, the photoperiod condition was set as a constant 16 h day length, and the expression level of the CO gene in the spring ecotype was not significantly different under the low-temperature and normal conditions. The expression level of the CO gene in the semi-winter ecotype was increased under low temperature after 6–8 weeks, indicating that low temperature could promote the perception of semi-winter on day length. The interaction mechanism still needs further experiments to verify these findings.

4. Discussion

The key findings from this study revealed that nitrogen application had no effect on inducing floral initiation, and the sugar content increase to a peak could be considered a sign of floral initiation. Regular changes were observed in soluble sugar and protein contents before and after floral initiation for spring and semi-winter ecotypes. The application amount of nitrogen fertilizer can affect the change amplitude of dynamic curves for soluble sugar and protein content, but the floral initiation time showed no significant difference. Under the same temperature conditions in the glasshouse experiment, the intrinsic genetic factor made the spring variety start floral initiation in advance. In our experiment, the temperature was the main factor determining the phenological development of rapeseed. It is an old story to explain the linkage between floral initiation and soluble sugar and protein concentration. Rideout (1992) studied the effects of low-temperature stress, no application of nitrogen fertilizer, and low nitrogen fertilizer stress on the floral initiation of tobacco in a temperature-controlled environment, and the results showed that the stress treatment could change the balance of soluble sugar and soluble protein in plants and reduce the number of leaves in blossom; however, only the low-temperature treatment could accelerate the floral initiation of tobacco [34]. In terms of the energy transport hypothesis for floral initiation, Sachs (1983) believed that carbohydrates could provide the energy and material basis for floral buds, and that increased transportation of carbohydrates to the shoot apical meristem accelerated floral initiation [35]. Raper (1988) concluded that the absolute carbohydrate content of plants was not a factor controlling floral initiation, and that the imbalance of relative contents of soluble sugars and soluble proteins at shoot apical meristem could promote floral initiation [23]. It has been widely reported that the soluble sugar content of rapeseed leaves increases rapidly with decreasing temperature [36], but its contribution to floral initiation is still unknown. The status of cellular metabolite concentrations (such as sugars and amino acids) constitutes crucial signaling to control the growth and development of plants [37]. Our results showed that the content of soluble sugar increased and the content of soluble protein decreased before floral initiation, and then the peak value of the sugar content seemed to coincide with the commencement of floral initiation. However, the molecular linkage between sugar and protein signals and floral initiation needs further research.
The regulating mechanism for temperature and photoperiod has been shown to be important for crops to adapt to the environment and complete their life circle [38,39]. Rapeseed is a long-day crop, and the response to day length ranged from 10.8 h to 16.3 h [40]. In the chamber experiment, the photoperiod was controlled under the condition of 16 h light/8 h dark light and was not a factor limiting the initiation of floral initiation. Therefore, the difference in floral initiation dates between spring and semi-winter ecotypes was mainly determined by temperature conditions and duration in the present study. The floral initiation time of spring variety “1358” showed no difference under normal and low-temperature conditions, and it began two weeks after the beginning of temperature treatment. The expression of hub gene SOC1 involved in the flowering regulation network also showed no difference under normal and low-temperature treatments for “1358”, which was in accordance with the phenotypic result. In Arabidopsis thaliana, the MADS-box protein encoded by the FLC gene is a flowering repressor, and vernalization reduces the levels of the FLC transcript and protein in the plant and promotes late-flowering ecotypes to flower early [41,42,43]. Based on the transcriptome data, we found that compared with the normal temperature conditions, the spring variety showed differential expression of genes related to vernalization under low-temperature conditions, indicating that the early maturing varieties still existed the response mechanism to vernalization under low-temperature conditions. Meanwhile, there was no significant difference in the expression level of FLC under normal and low temperatures for the spring ecotype. We speculated that this might be due to the weakness of the flowering inhibition system in the spring variety.
The semi-winter variety “Zhongshuang No. 11” did not start floral initiation after 8 weeks of treatment at normal temperature, and began floral initiation after 6 weeks of low-temperature treatment. Differential gene expression analysis revealed that the expression levels of FRI and FLC genes in the flowering inhibition system were significantly reduced as the low-temperature treatment progressed. Previous studies have reported that treatment of Arabidopsis thaliana with demethylation agent 5-azacytidine could promote early floral initiation [44,45]. In this study, we observed that the expression levels of demethylase genes in the semi-winter variety began to increase at 4 weeks after low-temperature treatment, compared with normal temperature. The demethylase genes may participate in the downregulation of FRI and FLC.
Under the low-temperature treatment, the expression level of CO, a key gene in the photoperiod regulation pathway, was significantly increased in the semi-winter variety compared with that under normal temperature. In contrast, the spring variety showed a decreasing trend or no significant difference. Upregulated expression of the CO gene can promote the expression of the downstream flowering-promoting gene SOC1, thus promoting early floral initiation [12]. CO is a crucial regulatory vertex in the photoperiod pathway, which integrates circadian rhythm and light signals to regulate floral initiation. The long day length can promote the flowering of Arabidopsis thaliana [46]. It is generally recognized that the leaf is the responsive organ of plants to photoperiod, and the expression product of the CO gene in the leaf is widely considered to be florigen, which can be transported to the shoot apical meristem through the phloem and combined with the FT gene, thus promoting floral initiation [11]. The transcript of the CO gene was also detected at the shoot apical meristem in this experiment, and the expression was increased in the semi-winter variety under low-temperature treatment. However, this experiment could not explain the linked mechanism, and the relationship between CO gene expression and the low temperature still needs further investigation.
Gibberellins (GAs) are a group of naturally synthetic tetracyclic diterpenoid carboxylic acids that promote seed germination, branch elongation, flowering, and fruit development. More than 130 different forms of gibberellins have been found in plants, and the most active ones are GA1, GA3, GA4, and GA7 [47]. GA4 with 3β-OH and without 13-OH group is the primary active hormone to promote internode elongation and flowering [48]. Gibberellin was initially considered necessary to promote flowering under short-day conditions [49]. When the inhibition of FLC by vernalization was insufficient to activate SOC1 fully, the GA pathway provided a positive factor for SOC1 activation in a short time [50]. The expression of the gibberellin synthase gene in the spring variety under low temperature tended to decrease compared with that under normal temperature, mainly because the low temperature would reduce the activities of related enzymes and delay metabolic activities. The upregulation of gene expression of some gibberellin synthesis was observed in the semi-winter variety at 6 weeks after low-temperature treatment, which might represent a starting signal for floral initiation. After that, the expression of these gibberellin genes was also upregulated, which also explained that the process of floral initiation was usually accompanied by the elongation and growth of the stem internodes in rapeseed.

5. Conclusions

The nitrogen application did not induce floral initiation, and the increase in sugar content to a peak could be considered a sign of floral initiation. The spring and semi-winter ecotypes exhibited significant differences in response to low-temperature treatment. There was no significant difference in the floral initiation time or the expression of most genes related to the flowering regulation network between the normal and low-temperature treatments for the spring variety “1358”. The semi-winter variety “Zhongshuang No. 11” did not start floral initiation after 8 weeks under normal-temperature treatment and began floral initiation after 6 weeks under low-temperature treatment, supporting the notion that the semi-winter variety had a solid response to vernalization. Low temperature promoted the floral initiation of semi-winter types mainly through the FLC, SOC1, and LFY signaling pathways, and gibberellin also played a positive factor in this process. These results also have implications for other similar environments around the world.

Author Contributions

Conceptualization, T.L. and L.H.; data curation, T.L.; formal analysis, R.L.; funding acquisition, L.H.; investigation, T.C.; methodology, T.L. and R.L.; supervision, L.H.; visualization, L.H.; writing–original draft, T.L. and R.L.; writing–review and editing, T.C. and L.H. All authors have read and agreed to the published version of the manuscript.

Funding

This research was funded by the National Modern Rapeseed Industry Technology System (NYCYTC-00510) and the Hubei Agricultural Science and Technology Innovation Project (07601903).

Data Availability Statement

The raw sequence data for the transcriptome analysis reported in this paper have been deposited in the NCBI Short Read Archive database with accession number PRJNA792016.

Acknowledgments

Our thanks should be given to Kunpeng Li for his assistance in the glasshouse experiment. We also thank the Hunan Agricultural University and the Oil Crops Research Institute, Chinese Academy of Agricultural Science, for the material supply.

Conflicts of Interest

The authors declare no conflict of interest.

References

  1. Meier, E.; Lilley, J.; Kirkegaard, J.; Whish, J.; McBeath, T. Management practices that maximise gross margins in Australian canola (Brassica napus L.). Field Crops Res. 2020, 252, 107803. [Google Scholar] [CrossRef]
  2. Lu, K.; Wei, L.; Li, X.; Wang, Y.; Wu, J.; Liu, M.; Zhang, C.; Chen, Z.; Xiao, Z.; Jian, H.; et al. Whole-genome resequencing reveals Brassica napus origin and genetic loci involved in its improvement. Nat. Commun. 2019, 10, 1154. [Google Scholar] [CrossRef] [PubMed] [Green Version]
  3. Wu, D.; Liang, Z.; Yan, T.; Xu, Y.; Xuan, L.; Tang, J.; Zhou, G.; Lohwasser, U.; Hua, S.; Wang, H.; et al. Whole-genome resequencing of a worldwide collection of rapeseed accessions reveals the genetic basis of ecotype divergence. Mol. Plant 2019, 12, 30–43. [Google Scholar] [CrossRef] [PubMed] [Green Version]
  4. Wei, D.; Cui, Y.; He, Y.; Xiong, Q.; Qian, L.; Tong, C.; Lu, G.; Ding, Y.; Li, J.; Jung, C.; et al. A genome-wide survey with different rapeseed ecotypes uncovers footprints of domestication and breeding. J. Exp. Bot. 2017, 68, 4791–4801. [Google Scholar] [CrossRef] [PubMed] [Green Version]
  5. Wang, N.; Qian, W.; Suppanz, I.; Wei, L.; Mao, B.; Long, Y.; Meng, J.; Muller, A.E.; Jung, C. Flowering time variation in oilseed rape (Brassica napus L.) is associated with allelic variation in the FRIGIDA homologue BnaA.FRI.a. J. Exp. Bot. 2011, 62, 5641–5658. [Google Scholar] [CrossRef] [Green Version]
  6. Tan, D.K.Y.; Wearing, A.H.; Rickert, K.G.; Birch, C.J. Detection of floral initiation in broccoli (Brassica oleracea L. var. italica Plenck) based on electron micrograph standards of shoot apices. Aust. J. Exp. Agric. 1998, 38, 313. [Google Scholar] [CrossRef]
  7. Kim, S.Y.; Park, B.S.; Kwon, S.J.; Kim, J.; Lim, M.H.; Park, Y.D.; Kim, D.Y.; Suh, S.C.; Jin, Y.M.; Ji, H.A. Delayed flowering time in Arabidopsis and Brassica rapa by the overexpression of FLOWERING LOCUS C (FLC) homologs isolated from Chinese cabbage (Brassica rapa L. ssp. pekinensis). Plant. Cell Rep. 2007, 26, 327–336. [Google Scholar] [CrossRef]
  8. Johanson, U.; West, J.; Lister, C.; Michaels, S.; Amasino, R.; Dean, C. Molecular analysis of FRIGIDA, a major determinant of natural variation in Arabidopsis flowering time. Science 2000, 290, 344–347. [Google Scholar] [CrossRef]
  9. Xu, Y.; Yamaguchi, N.; Gan, E.S.; Ito, T. When to stop: An update on molecular mechanisms of floral meristem termination. J. Exp. Bot. 2019, 70, 1711–1718. [Google Scholar] [CrossRef]
  10. Lee, J.H.; Park, S.H.; Ji, H.A. Functional conservation and diversification between rice OsMADS22/OsMADS55 and Arabidopsis SVP proteins. Plant Sci. 2012, 185–186, 97–104. [Google Scholar] [CrossRef]
  11. An, H.; Roussot, C.; Suárez-López, P.; Corbesier, L.; Vincent, C.; Piñeiro, M.; Hepworth, S.; Mouradov, A.; Justin, S.; Turnbull. CONSTANS acts in the phloem to regulate a systemic signal that induces photoperiodic flowering of Arabidopsis. Development 2004, 131, 3615–3626. [Google Scholar] [CrossRef] [PubMed] [Green Version]
  12. Hepworth, S.R.; Valverde, F.; Ravenscroft, D.; Mouradov, A.; Coupland, G. Antagonistic regulation of flowering-time gene SOC1 by CONSTANS and FLC via separate promoter motifs. EMBO J. 2002, 21, 4327–4337. [Google Scholar] [CrossRef] [PubMed] [Green Version]
  13. Huang, T.; Böhlenius, H.; Eriksson, S.; Parcy, F.; Nilsson, O. The mRNA of the Arabidopsis gene FT moves from leaf to shoot apex and induces flowering. Science 2005, 309, 1694–1696. [Google Scholar] [CrossRef] [Green Version]
  14. Finnegan, E.; Genger, R.K.; Kovac, K.; Peacock, W.; Dennis, E. DNA methylation and the promotion of flowering by vernalization. Proc. Natl. Acad. Sci. USA 1998, 95, 5824–5829. [Google Scholar] [CrossRef] [PubMed] [Green Version]
  15. Tudor, E.H.; Jones, D.M.; He, Z.; Bancroft, I.; Trick, M.; Wells, R.; Irwin, J.A.; Dean, C. QTL-seq identifies BnaFT. A02 and BnaFLC. A02 as candidates for variation in vernalization requirement and response in winter oilseed rape (Brassica napus). Plant Biotechnol. J. 2020, 18, 2466–2481. [Google Scholar] [CrossRef] [PubMed]
  16. Sung, S.; Amasino, R.M. Vernalization and epigenetics: How plants remember winter. Curr. Opin. Plant Biol. 2004, 7, 4–10. [Google Scholar] [CrossRef]
  17. Bouché, F.; Lobet, G.; Tocquin, P.; Périlleux, C. FLOR-ID: An interactive database of flowering-time gene networks in Arabidopsis thaliana. Nucleic Acids Res. 2016, 44, D1167–D1171. [Google Scholar] [CrossRef] [Green Version]
  18. Xu, Y.; Zhang, B.; Ma, N.; Liu, X.; Qin, M.; Zhang, Y.; Wang, K.; Guo, N.; Zuo, K.; Liu, X. Quantitative trait locus mapping and identification of candidate genes controlling flowering time in Brassica napus L. Front. Plant Sci. 2021, 11, 626205. [Google Scholar] [CrossRef]
  19. Luo, Y.; Luo, C.; Du, D.; Fu, Z.; Yao, Y.; Xu, C.; Zhang, H. Quantitative trait analysis of flowering time in spring rapeseed (B. napus L.). Euphytica 2014, 200, 321–335. [Google Scholar] [CrossRef]
  20. Huang, L.; Min, Y.; Schiessl, S.; Xiong, X.; Jan, H.U.; He, X.; Qian, W.; Guan, C.; Snowdon, R.J.; Hua, W. Integrative analysis of GWAS and transcriptome to reveal novel loci regulation flowering time in semi-winter rapeseed. Plant Sci. 2021, 310, 110980. [Google Scholar] [CrossRef]
  21. Scholefield, P.; Sedgley, M.; Alexander, D.M. Carbohydrate cycling in relation to shoot growth, floral initiation and development and yield in the avocado. Sci. Hortic. 1985, 25, 99–110. [Google Scholar] [CrossRef]
  22. Guiyu, L.; Zaifan, H.; Cuihua, Z.; Chengshu, Z. Changes in ultraweak luminescence intensity, respiration rate and physiological metabolism of Chrysanthemum during floral differentiation. Acta Hortic. Sin. 2008, 35, 1819–1824. [Google Scholar]
  23. Raper, C.D., Jr.; Thomas, J.F.; Tolley-Henry, L.; Rideout, J.W. Assessment of an apparent relationship between availability of soluble carbohydrates and reduced nitrogen during floral initiation in tobacco. Bot. Gaz. 1988, 149, 289–294. [Google Scholar] [CrossRef]
  24. Miyazaki, Y.; Maruyama, Y.; Chiba, Y.; Kobayashi, M.J.; Joseph, B.; Shimizu, K.K.; Mochida, K.; Hiura, T.; Kon, H.; Satake, A. Nitrogen as a key regulator of flowering in Fagus crenata: Understanding the physiological mechanism of masting by gene expression analysis. Ecol. Lett. 2014, 17, 1299–1309. [Google Scholar] [CrossRef] [PubMed]
  25. Luo, T.; Zhang, J.; Khan, M.N.; Liu, J.; Xu, Z.; Hu, L. Temperature variation caused by sowing dates significantly affects floral initiation and floral bud differentiation processes in rapeseed (Brassica napus L.). Plant Sci. 2018, 271, 40–51. [Google Scholar] [CrossRef]
  26. Ebell, L. Variation in total soluble sugars of conifer tissues with method of analysis. Phytochemistry 1969, 8, 227–233. [Google Scholar] [CrossRef]
  27. Bradford, M.M. A rapid and sensitive method for the quantitation of microgram quantities of protein utilizing the principle of protein-dye binding. Anal. Biochem. 1976, 72, 248–254. [Google Scholar] [CrossRef]
  28. Trapnell, C.; Pachter, L.; Salzberg, S.L. TopHat: Discovering splice junctions with RNA-Seq. Bioinformatics 2009, 25, 1105–1111. [Google Scholar] [CrossRef]
  29. Li, B.; Dewey, C.N. RSEM: Accurate transcript quantification from RNA-Seq data with or without a reference genome. BMC Bioinform. 2011, 12, 323. [Google Scholar] [CrossRef] [Green Version]
  30. Robinson, M.D.; McCarthy, D.J.; Smyth, G.K. edgeR: A Bioconductor package for differential expression analysis of digital gene expression data. Bioinformatics 2010, 26, 139–140. [Google Scholar] [CrossRef] [Green Version]
  31. Langfelder, P.; Horvath, S. Eigengene networks for studying the relationships between co-expression modules. BMC Syst. Biol. 2007, 1, 54. [Google Scholar] [CrossRef] [PubMed] [Green Version]
  32. Putterill, J.; Laurie, R.; Macknight, R. It’s time to flower: The genetic control of flowering time. BioEssays News Rev. Mol. Cell. Dev. Biol. 2004, 26, 363–373. [Google Scholar] [CrossRef] [PubMed]
  33. Wellmer, F.; Riechmann, J.L. Gene networks controlling the initiation of flower development. Trends Genet. 2010, 26, 519–527. [Google Scholar] [CrossRef] [PubMed]
  34. Rideout, J.W.; Raper, C.D., Jr.; Miner, G.S. Changes in ratio of soluble sugars and free amino nitrogen in the apical meristem during floral transition of tobacco. Int. J. Plant Sci. 1992, 153, 78–88. [Google Scholar] [CrossRef]
  35. Sachs, R. Source-sink relationships and flowering. In Strategies of Plant Reproduction; Allanheld, Osmun: Totowa, NJ, USA, 1983; pp. 263–272. [Google Scholar]
  36. Xiaohong, Z.; Liangjie, F.; Tewu, Y.; Zhenghua, X.; Liyong, H. Effects of chilling stress on physiological characteristics of rapeseed seedlings in winter. Plant Physiol. J. 2015, 51, 737–746. [Google Scholar] [CrossRef]
  37. Smeekens, S.; Ma, J.; Hanson, J.; Rolland, F. Sugar signals and molecular networks controlling plant growth. Curr. Opin. Plant Biol. 2010, 13, 274–279. [Google Scholar] [CrossRef]
  38. Swanton, C.J.; Huang, J.Z.; Shrestha, A.; Tollenaar, M.; Deen, W.; Rahimian, H. Effects of temperature and photoperiod on the phenological development of barnyardgrass. Agron. J. 2000, 92, 1125–1134. [Google Scholar] [CrossRef]
  39. Liu, L.; Zhang, Y.; Yu, H. Florigen trafficking integrates photoperiod and temperature signals in Arabidopsis. J. Integr. Plant Biol. 2020, 62, 1385–1398. [Google Scholar] [CrossRef]
  40. Robertson, M.J.; Watkinson, A.R.; Kirkegaard, J.A.; Holland, J.F.; Potter, T.D.; Burton, W.; Walton, G.H.; Moot, D.J.; Wratten, N.; Farre, I.; et al. Environmental and genotypic control of time to flowering in canola and Indian mustard. Aust. J. Exp. Agric. 2002, 53, 793–809. [Google Scholar] [CrossRef]
  41. Sheldon, C.C.; Rouse, D.T.; Finnegan, E.J.; Peacock, W.J.; Dennis, E.S. The molecular basis of vernalization: The central role of FLOWERING LOCUS C (FLC). Proc. Natl. Acad. Sci. USA 2000, 97, 3753–3758. [Google Scholar] [CrossRef]
  42. Tadege, M.; Sheldon, C.C.; Helliwell, C.A.; Stoutjesdijk, P.; Dennis, E.S.; Peacock, W.J. Control of flowering time by FLC orthologues in Brassica napus. Plant J. 2001, 28, 545–553. [Google Scholar] [CrossRef] [PubMed]
  43. Nobutoshi, Y. The epigenetic mechanisms regulating floral hub genes and their potential for manipulation. J. Exp. Bot. 2021, 73, 1277–1287. [Google Scholar]
  44. Burn, J.E.; Bagnall, D.; Metzger, J.; Dennis, E.; Peacock, W. DNA methylation, vernalization, and the initiation of flowering. Proc. Natl. Acad. Sci. USA 1993, 90, 287–291. [Google Scholar] [CrossRef] [Green Version]
  45. Sheldon, C.C.; Finnegan, E.J.; Rouse, D.T.; Tadege, M.; Bagnall, D.J.; Helliwell, C.A.; Peacock, W.J.; Dennis, E.S. The control of flowering by vernalization. Curr. Opin. Plant Biol. 2000, 3, 418–422. [Google Scholar] [CrossRef]
  46. Cheng, X.F.; Wang, Z.Y. Overexpression of COL9, a CONSTANS-LIKE gene, delays flowering by reducing expression of CO and FT in Arabidopsis thaliana. Plant J. 2005, 43, 758–768. [Google Scholar] [CrossRef]
  47. Hedden, P.; Gibberellins. Encycl. Appl. Plant Sci. 2017, 1, 411–420. [Google Scholar] [CrossRef]
  48. Hisamatsu, T.; Koshioka, M.; Kubota, S.; Fujime, Y.; King, R.W.; Mander, L.N. The role of gibberellin biosynthesis in the control of growth and flowering in Matthiola incana. Physiol. Plant. 2000, 109, 97–105. [Google Scholar] [CrossRef]
  49. Wilson, R.N.; Heckman, J.W.; Somerville, C.R. Gibberellin is required for flowering in Arabidopsis thaliana under short days. Plant Physiol. 1992, 100, 403–408. [Google Scholar] [CrossRef] [Green Version]
  50. Moon, J.; Suh, S.S.; Lee, H.; Choi, K.R.; Hong, C.B.; Paek, N.C.; Kim, S.G.; Lee, I. The SOC1 MADS-box gene integrates vernalization and gibberellin signals for flowering in Arabidopsis. Plant J. 2003, 35, 613–623. [Google Scholar] [CrossRef]
Figure 1. The daily maximum, mean, and minimum temperature during the period of Experiment 1. The dates indicated by the dotted vertical line on the x-axis correspond to the record date of floral initiation (FI) for these two varieties. The open circles indicate the maximum and minimum temperatures, respectively.
Agronomy 12 01624 g001
Figure 2. The optical microscope observation of shoot apical meristem (SAM) of rapeseed. (A) Vegetative stage as the finger-like leaf primordia around the SAM; (B) Floral initiation stage, as the dome-like floral primordia around the SAM.
Agronomy 12 01624 g002
Figure 3. The dynamic changes of soluble sugar (A), soluble protein (B), and carbon–nitrogen ratio (C) of spring rapeseed variety “1358” and semi-winter variety “Zhongshuang No. 11” under prior- and post- floral initiation stages. The dates indicated by the dotted line on the x-axis correspond to floral initiation’s start dates, which was 15 December and 20 December for spring and semi-winter ecotypes, respectively. N0, N5, N15, and N20 represent the nitrogen application rates at 0 kg ha−1, 75 kg ha−1, 225 kg ha−1, and 375 kg ha−1, respectively.
Agronomy 12 01624 g003
Figure 4. The seed yield of “1358” and “Zhongshuang No. 11” under different nitrogen application rates. N0, N5, N15, and N20 represent the nitrogen application rates at 0 kg ha−1, 75 kg ha−1, 225 kg ha−1, and 375 kg ha−1, respectively. Different letters indicate significant differences among nitrogen application treatments at P ≤ 0.05 by LSD.
Agronomy 12 01624 g004
Figure 5. Principal component analysis (PCA) of transcript profiles for the samples. PC1 and PC2 represent principal component 1 and principal component 2, respectively.
Agronomy 12 01624 g005
Figure 6. The gene expression pattern of different modules. The number of genes distributed in each module is indicated on the right. The modules’ relationships have been shown by K-means clustering. The color of each cell at the row-column intersection indicates module eigengene E, which is defined as the first principal component and can be considered a representative of the module’s genes expression level for a specific sample. The high expression level between a particular module and samples is indicated by dark red.
Agronomy 12 01624 g006
Figure 7. KEGG functional enrichment analysis of genes for each module. (A) Amino acid metabolism; (B) Synthesis of secondary metabolites; (C) Carbohydrate metabolism; (D) Energy metabolism; (E) Environmental adaptation; (F) Folding, classification, and degradation metabolism; (G) Lipid metabolism; (H) Cofactor and vitamin metabolism; (I) Nucleotide metabolism; (J) Signal transduction; (K) Transcription and translation; (L) Transport and degradation.
Agronomy 12 01624 g007
Figure 8. The gene expression difference is related to the network of floral initiation in early and late maturing varieties at different sampling times under normal and low-temperature conditions. The flow chart of floral initiation in Arabidopsis is abstracted from a previous review by Putterill et al. and Wellmer et al. [32,33]. The main ways to induce floral initiation are gibberellin synthesis and signaling, vernalization, and autonomous pathways. Arrow and binding lines indicate the expression of promoting and inhibiting genes, respectively. Blue and yellow genes correspond to promoting and inhibiting floral initiation, respectively. The floral initiation promote genes include Agamous-like 24 (AGL24), Apetala1 (AP1), Constans (CO), Flowering time control protein FCA/FY (FCA/FY, Flowering locus T (FT), Flowering-promoting factor 1 (FPF1), Leafy (LF), Vernalization genes (VRNs), Vernalization insensitive genes (VINs), Suppressor of Overexpression of Constans (SOC1) and so on; the floral initiation inhibited genes included Embryonic flower 1 (EMF1), Flowering locus C (FLC), Frigida (FRI), MADS-box gene short vegetative phase (SVP), Tempranillo1 (TEM1), Terminal flower 1 (TFL1), Vernalization independence genes (VIPs) and so on.
Agronomy 12 01624 g008
Table 1. Floral initiation time for spring and semi-winter rapeseed varieties “1358” and “Zhongshuang No. 11” under normal (CK) and low-temperature (LT) conditions.
VarietyTreatmentWeek 1Week 2Week 3Week 4Week 6Week 8
1358CK××
LT××
Zhongshuang No. 11CK×× ×××
LT×× ×
Notes: √ and × indicate that the shoot apical meristem of sampling plants began or did not begin floral initiation at the given time-point, respectively. The weeks were counted after the beginning of temperature control at the seedling emergence stage.
Table 2. Throughput and quality of RNA-seq for 18 libraries
Sample CodeBasesTotal ReadsMapped ReadsQ30 (%)GC (%)
CK-H-1 W12,346,439,73942,813,77133,688,652 (78.69%)94.8348.23
CK-H-2 W8,380,248,91929,292,74022,657,801 (77.35%)95.1748.00
CK-H-3 W8,336,941,65228,895,49222,374,397 (77.43%)94.1448.06
CK-H-4 W9,640,592,28033,402,54625,926,724 (77.62%)94.6848.00
CK-Z-1 W7,709,963,91326,710,79320,834,744 (78.00%)94.9448.38
CK-Z-2 W8,908,534,54031,058,95924,147,919 (77.75%)94.9247.78
CK-Z-4 W5,647,528,64819,601,43915,278,467 (77.95%)95.1647.98
CK-Z-6 W6,928,211,35424,020,11018,732,732 (77.99%)95.1447.88
CK-Z-8 W5,512,829,37119,128,13814,550,138 (76.07%)95.2748.08
LT-H-1 W5,948,642,51720,705,54016,156,386 (78.03%)94.8948.38
LT-H-2 W6,052,433,68921,111,30715,589,630 (73.84%)94.6548.73
LT-H-3 W7,863,011,31227,799,41415,443,883 (55.55%)94.6749.66
LT-H-4 W5,625,770,86119,546,50715,369,155 (78.63%)94.5548.54
LT-Z-1 W6,504,657,48722,681,91917,851,101 (78.70%)95.0148.65
LT-Z-2 W5,888,026,23020,475,30416,311,490 (79.66%)94.6348.31
LT-Z-4 W6,179,107,27521,605,98516,938,907 (78.40%)94.9948.42
LT-Z-6 W6,065,775,00721,171,76016,631,248 (78.55%)95.0448.24
LT-Z-8 W6,965,309,53024,339,95619,097,804 (78.46%)94.9748.13
Note: CK and LT represent normal and low-temperature treatments in the sampling code, respectively. H indicates the spring rapeseed variety “1358”, and Z indicates the semi-winter variety “Zhongshuang No. 11”. 1—8 W are different sampling time-points, with interval units of one week.
Publisher’s Note: MDPI stays neutral with regard to jurisdictional claims in published maps and institutional affiliations.

