Article

Discrete Element Simulation Modeling Method and Parameters Calibration of Sugarcane Leaves

Key Laboratory of Key Technology on Agricultural Machine and Equipment, Ministry of Education, College of Engineering, South China Agricultural University, Guangzhou 510642, China
*
Author to whom correspondence should be addressed.
Agronomy 2022, 12(8), 1796; https://doi.org/10.3390/agronomy12081796
Submission received: 1 July 2022 / Revised: 25 July 2022 / Accepted: 27 July 2022 / Published: 29 July 2022
(This article belongs to the Section Agricultural Biosystem and Biological Engineering)

Abstract

:
Objective The construction method of the discrete element model and the setting of simulation parameters in the strip- and blade-shaped sugarcane leaf are unclear. The simulation model’s accuracy greatly influences the dynamic response characteristics between particles, and it is necessary to improve the accuracy of simulation parameters through parameter calibration. Method The discrete element parameters are optimized and calibrated based on the response surface methodology (RSM) with sugarcane leaf physical angle of repose as the response value. Firstly, the basic physical parameters and angle of repose of sugarcane leaves were measured by physical tests, and the simulation model of sugarcane leaf was established by the multi-sphere polymerization model and XML method. The effects of the sugarcane leaf model filled with different radii particles on the simulation angle of repose and simulation efficiency were analyzed to find the optimal filling particle size of the sugarcane leaf model. Then, a Plackett-Burman test was used to select the parameters that significantly influence the simulation angle of repose. Furthermore, the optimal value ranges of the three significant parameters were determined by a steepest ascent search test, and the second-order regression equation between the significant parameters and angle of repose was established based on the Box-Behnken test, the optimal combination of parameters was obtained with the physical angle of repose of 21.15° as the optimal target value. Finally, a gas-solid coupling simulation test was conducted with the trash content as the test index and compared with the field test. Result The optimal filling particle size of the sugarcane leaf simulation model was 2 mm. The optimal combination of significant parameters was as follows: the static and rolling friction coefficients between sugarcane leaves were 0.21 and 0.05, respectively, and the static friction coefficient between sugarcane leaves and steel was 0.30. There was no significant difference between the simulation value and the test value of trash content, and the maximum relative error between them was 8%, which further showed that the parameter calibration of the sugarcane leaf model was reliable. Conclusions The results showed that the modeling method and parameter calibration of the sugarcane leaf model was accurate and reliable and could be used for subsequent gas-solid coupling simulation research, as well as providing a reference for the calibration of the discrete element parameters of the strip-and blade-shape materials.

1. Introduction

Sugarcane is a vital sugar crop in the world, and sugarcane leaves as the main trash that needs to be removed in the process of sugarcane harvesting. At present, there exist significant problems of high trash content and high loss rate in sugarcane mechanized harvesting technology [1,2]. As one of the critical working components of the sugarcane chopper combine harvester, the trash removal system has a decisive influence on the operating performance of the whole machine, especially the trash removal performance [3,4]. In the research of the core technology of the trash removal system, the lack of research on a trash removal mechanism restricts the improvement of the performance of the sugarcane harvester.
The interaction between materials and materials (sugarcane), airflow, and equipment are complex in the process of airflow trash removal of sugarcane. Using a gas-solid coupling (CFD-DEM) technology to study the interaction and motion law between particles in the fan airflow field helps reveal the interaction and separation mechanism between particles, so as to optimize the impurity removal system (structure and working parameters) and improve the operation efficiency of impurity removal link, which is of great significance to improve the performance of sugarcane harvester. The establishment of the particle simulation model and parameter calibration is the premise for using CFD-DEM technology. The high-precision discrete element simulation model and parameters help improve the accuracy of CFD-DEM technology in studying particle interaction, motion, and separation mechanisms [5,6].
The DEM is an effective tool for studying material motion. In recent years, it has been widely used in agricultural material simulation modeling and virtual parameter calibration [5,7]. Zhang et al. [8] calibrated the main parameters of rice models with different numbers of filled particles by cylinder-lifting and sliding accumulation tests. The effect of different filling particle radii on the simulation accuracy was analyzed by comparing actual and simulated test data. The best filling particle radii of the best rice model were determined with the gas-solid two-phase flow coupling simulation analysis. Wang et al. [9] used two contact materials (a plexiglass plate and an aluminum plate) to simulate the angle of repose of the corn population, established two continuous equations, solved the inter-specific static friction coefficient and inter-specific rolling friction coefficient, and provided a new method for the calibration of DEM simulation parameters. Zhang et al. [10] studied whether different masses and calibration methods (the plate drawing method and the funnel method) affect the angle of repose and calibrated the impact restitution coefficient, static friction coefficient, and rolling friction coefficient of sand particles with standard balls and nonstandard balls. Wu et al. [11] used the “Hertz-Mindlin with JKR” contact model considering the bonding force between particles to test the soil angle of repose, and determined the discrete element contact parameters and contact model parameters of the sample soil. Wang et al. [12] measured the angle of repose of pig manure under different moisture contents and established a regression equation between moisture content and angle of repose. Based on the “Hertz-Mindlin with JKR” sphere bonding model, the DEM simulation was conducted, and the contact parameters of pig manure were calibrated by a physical stacking test and simulation method. Wan et al. [13] calibrated the discrete element simulation parameters of fodder rape stem in the flowering stage based on the RSM (response surface methodology) using the three-point bending method. Scholars worldwide have also conducted simulation modeling and parameter calibration for common seeds such as wheat, soybeans, and peanuts [14,15,16,17,18,19] and fruits such as grapes and apples [20,21,22,23]. In summary, global research on the DEM simulation modeling and parameter calibration of agricultural materials mainly focused on spherical and quasi-spherical microparticles such as grain and oil seeds, soil, fertilizer, and biomass particles, as well as large spherical particles such as fruits and plant stems. Unlike the above traditional spherical and quasi-spherical materials, sugarcane leaves are strip-and blade-shaped materials, and the construction method of the discrete element model and the setting of simulation parameters are unclear, which affects the application of the CFD-DEM technology in the analysis of sugarcane leaf suspension characteristics and the study of impurity removal mechanism. Thus, it is urgently needed to calibrate the sugarcane leaf parameters.
The main objectives of this study are (1) the effects of sugarcane leaf models filled with different particle radii on simulation angle of repose and simulation efficiency were analyzed to find the optimal filling particle size of the sugarcane leaf model, and to establish an accurate simulation model; (2) to prove the significance of the influence of each simulation parameter and the interaction among parameters on the angle of repose and (3) to obtain the optimal combination of sugarcane leaf discrete element simulation parameters for subsequent gas-solid coupling trash removal research.

2. Materials and Methods

2.1. Test Materials

Taking sugarcane (Guitang 49) harvested in Zhanjiang City, Guangdong Province, China, as the research object and HN4GDL-194 sugarcane chopper harvester as the harvesting equipment. The basic physical parameters of sugarcane leaf segments discharged by the extractor fan during harvesting were measured. Five points sampling method was adopted, and five areas were selected from where the extractor fan discharged the sugarcane leaf segment. Thirty sugarcane leaf segments were randomly selected, and the average value was taken after measurement. The geometric size and mass of sugarcane leaf segments were measured using a tape measure, an electronic vernier caliper (accuracy of 0.02 mm), and an electronic balance (accuracy of 0.001 g). The volume of sugarcane leaf segments was measured by the liquid displacement method, and the moisture content was measured by the electrothermal drying method. The test measured that the average length, width, and thickness of sugarcane leaf segments were 300 mm, 36.07 mm, and 1.04 mm, and the average density and moisture content were 380 kg/m3 and 9.2%, respectively.

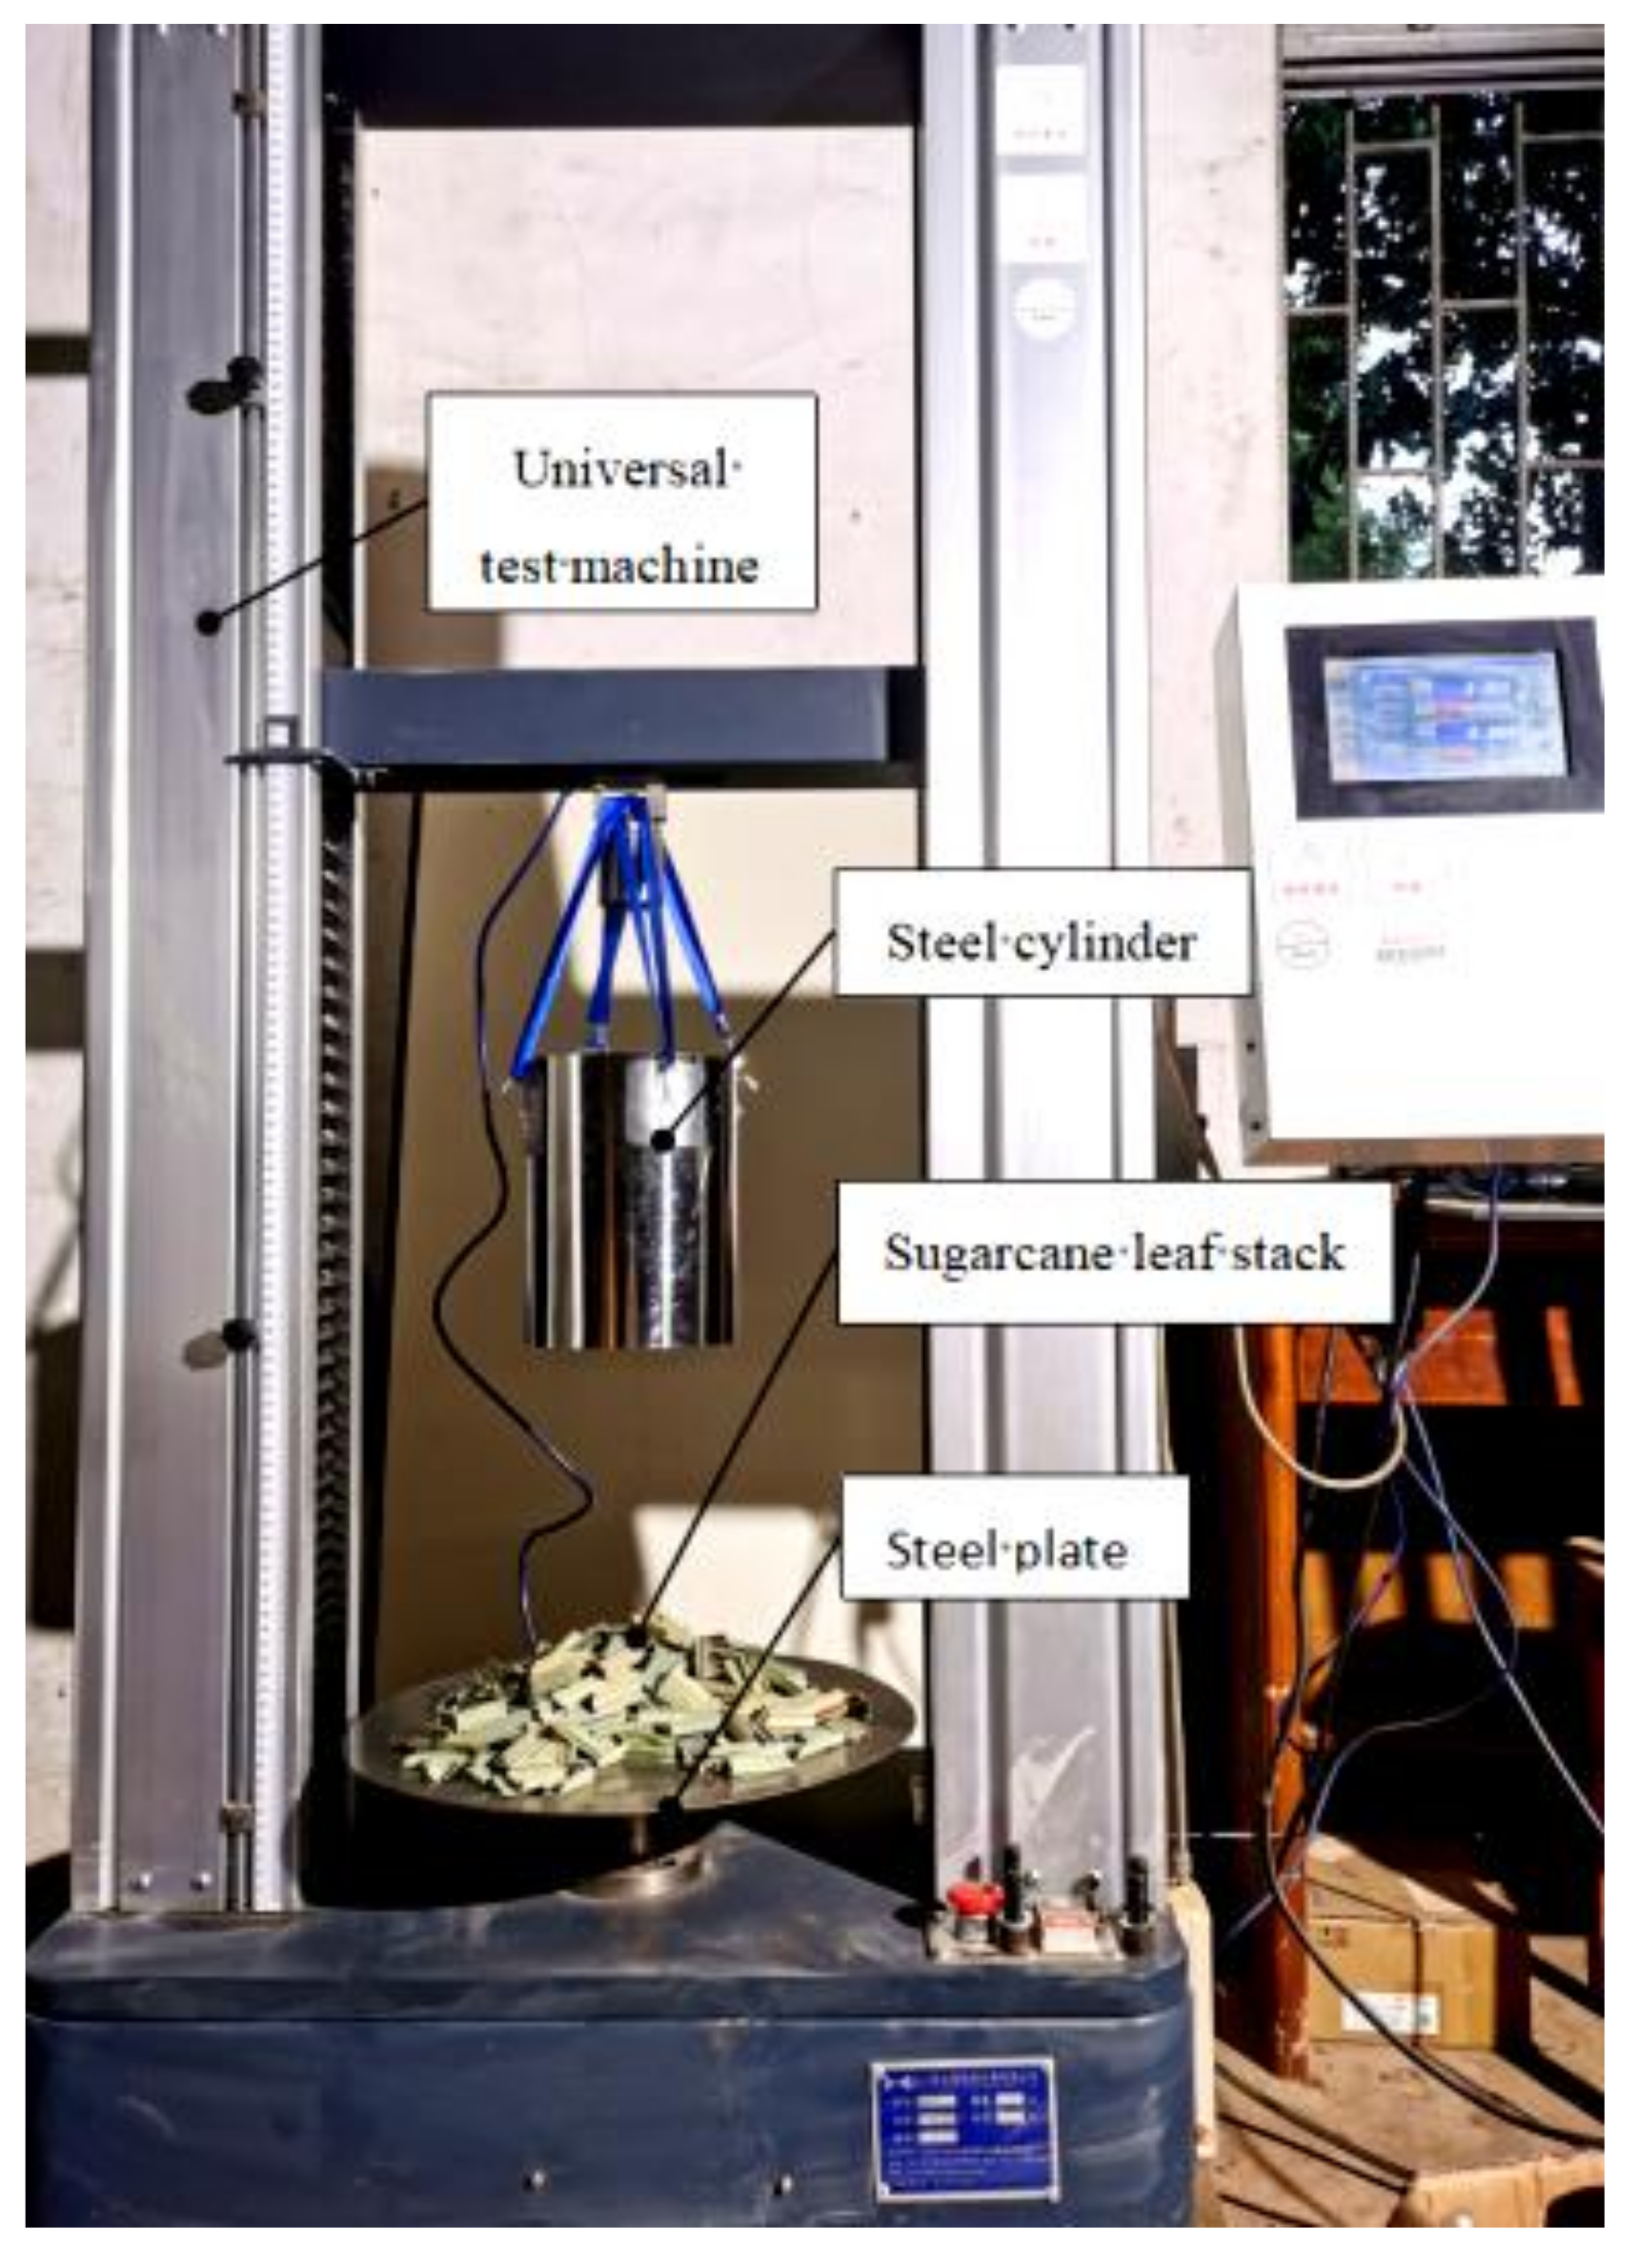
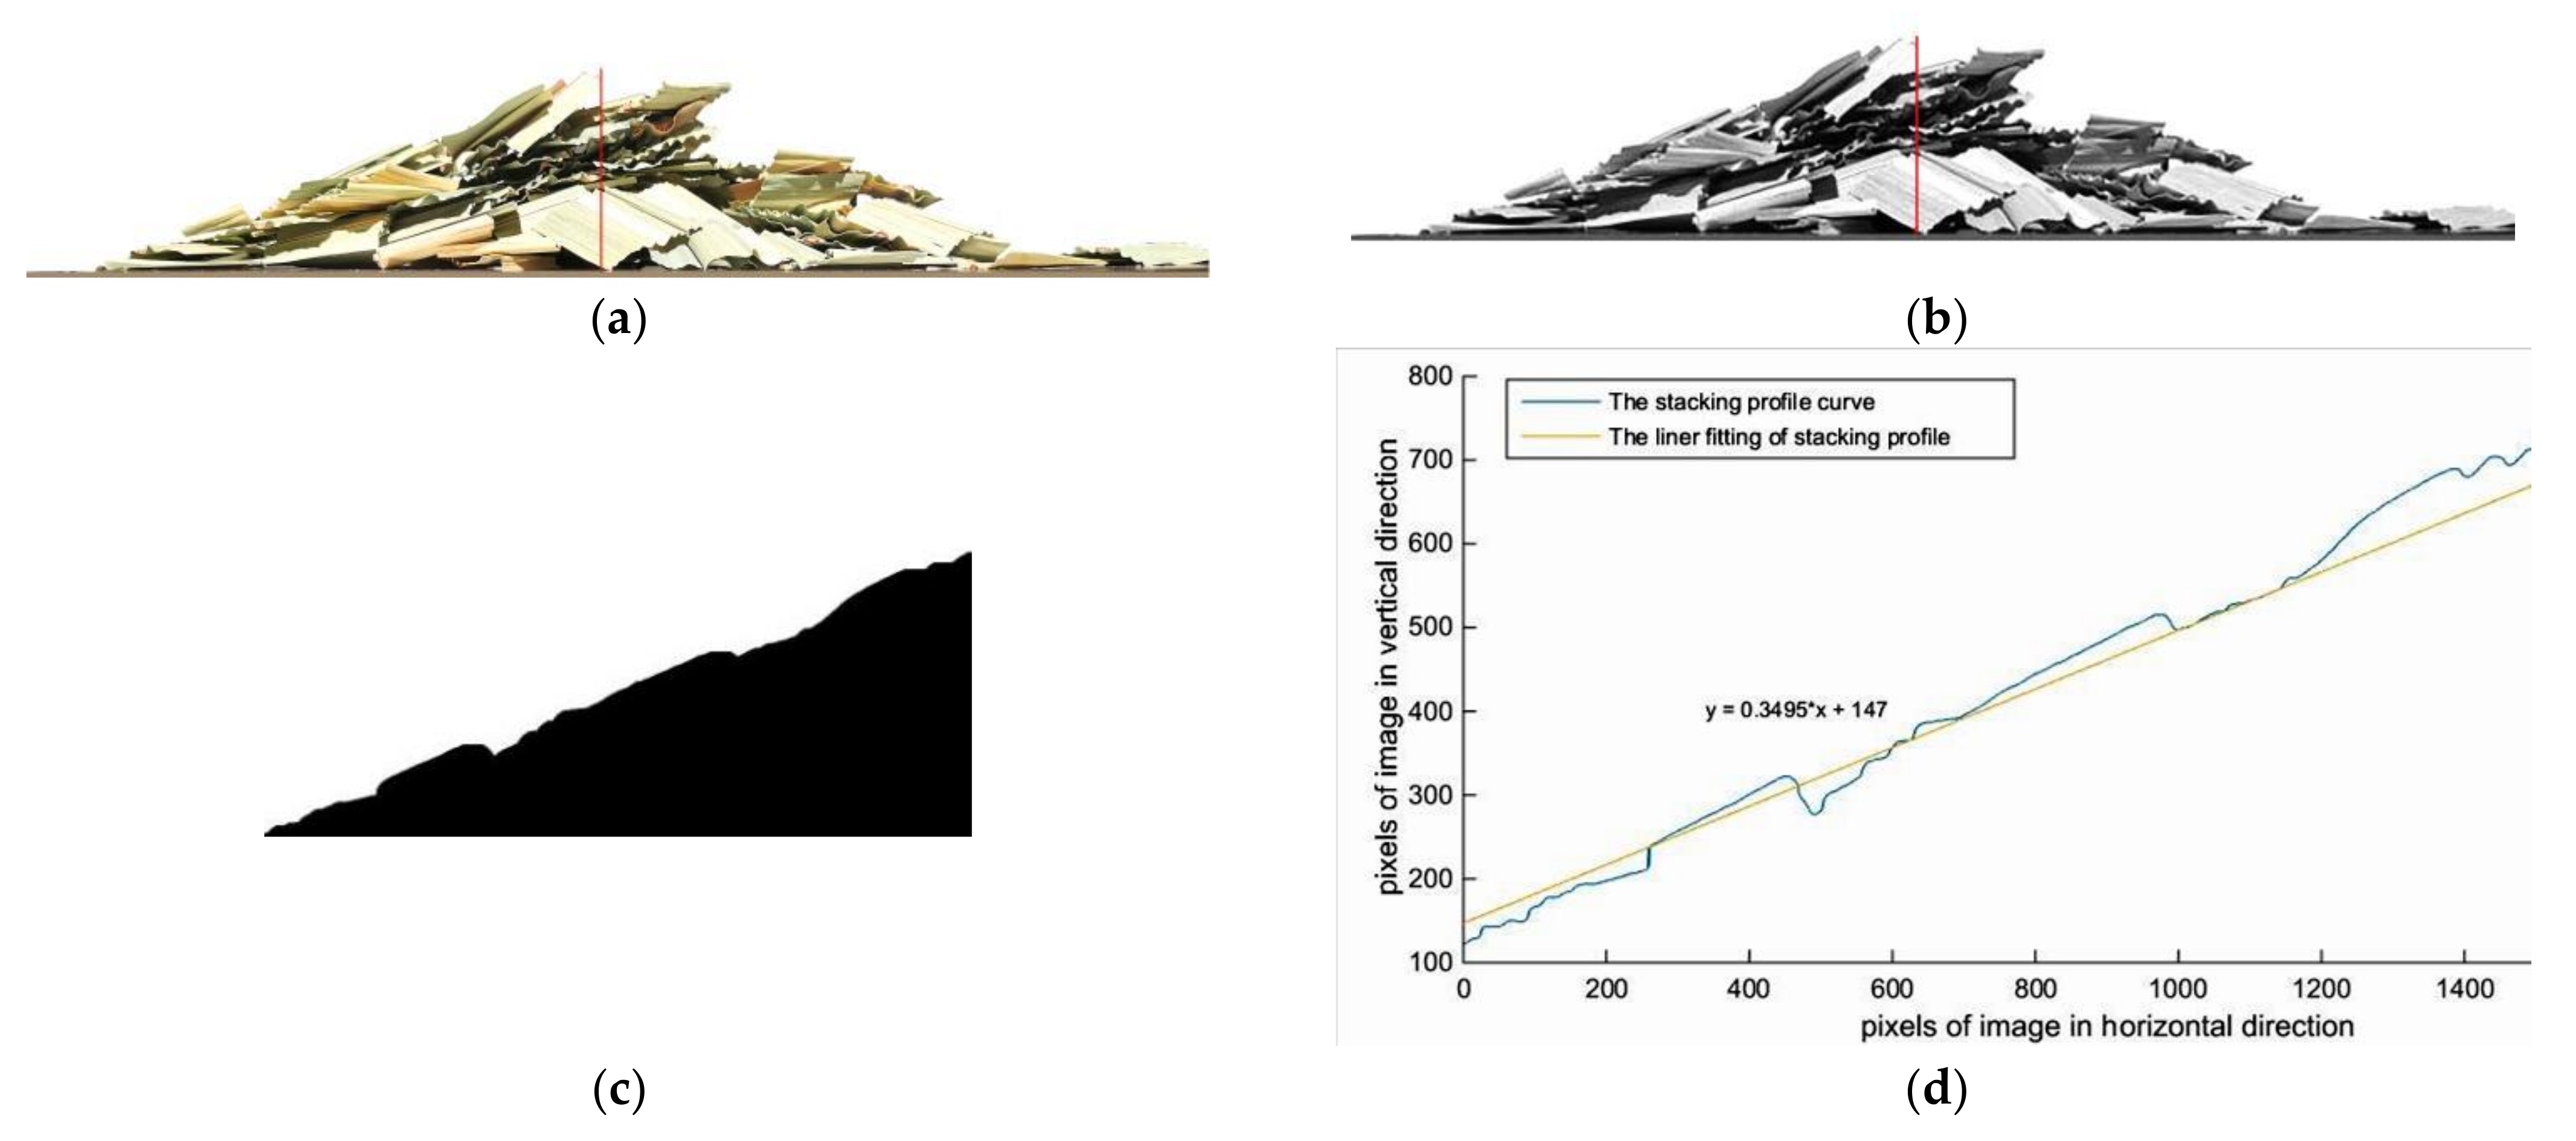
2.2. Angle of Repose Test

The angle of repose is a micro parameter characterizing the flow and friction characteristics of bulk materials, and its size is relevant to the factors such as material type, surface shape, and moisture content [24]. Therefore, the angle of repose test is typically used for the discrete element parameter calibration of bulk materials. The friction and restitution coefficient is mainly relevant to material quality and surface roughness [25]. Because the sugarcane leaf segments are long and it is challenging to form an angle of repose, referring to the material treatment method for rice, rape stalk, and sugarcane leaf DEM parameters calibration [26,27,28], the long-strip sugarcane leaf segments were trimmed into a length 36 mm sample without changing the surface shape of the material. The measurement method of the physical angle of repose of sugarcane leaves was the cylinder-lifting method (Figure 1) [29]. Put the sample into a steel cylinder (diameter of 150 mm and height of 200 mm), use a WDW-20 universal testing machine to lift the cylinder at a uniform speed of 0.05 m/s [30], and the sugarcane leaves fell on a steel plate (diameter 400 mm and thickness 2 mm) through the bottom of the cylinder. After all sugarcane leaves were utterly stationary, a stable sugarcane leaf stack was formed on the steel plate. A front view of the sugarcane leaf stack was captured with an HD camera (Canon 80D, Canon Co., Ltd., Tokyo, Japan) at 80 cm directly ahead of the sugarcane leaf stack, and the unilateral angle of repose of the sugarcane leaf was obtained by using MATLAB R2020 to conduct grayscale processing, binarization processing, image boundary pixel extracting and boundary pixel fitting on the image. The test was repeated ten times, and the angle of repose was averaged.
Using the least squares method, the fitted Equation was obtained by linear fitting, and the slope of the Equation (K) was also obtained. The angle of repose was calculated using Equation (1) [31] as follows:
θ = arctan K × 180 ° π
where θ denotes the angle of repose of the sugarcane leaves, and K denotes the slope of the curve fitting equation. The image processing steps for obtaining the sugarcane leaf physical angle of repose were shown in Figure 2.

2.3. Simplification of Sugarcane Leaf Model

The angle of repose is not only relevant to the mechanical properties of materials (such as Poisson’s ratio, shear modulus, contact parameters, etc.), but the shape of materials also has an important influence on it. When sugarcane was harvested in the field, the situation of sugarcane leaves was relatively complex. Some sugarcane leaves were deformed due to extrusion and exposure. Collecting the leaves discharged from the extractor fan and trimming them into a length 36 mm sample without changing the surface shape of the material, and then classifying them. According to the degree of deformation, these leaves can be generally divided into flat, slight deformation, moderate deformation, and severe deformations. Figure 3 shows the test samples of sugarcane leaves with different deformations.
To simplify the complex sugarcane leaf model and obtain accurate contact parameters of sugarcane leaves. In this article, the physical angle of repose test of four kinds of deformed sugarcane leaves was conducted based on the measurement method of the angle of repose. The effect of sugarcane leaves with different deformations on the angle of repose, as well as the relative difference in angle of repose between sugarcane leaves with different deformation and field mixed leaves were analyzed. The results of the physical angle of repose test of sugarcane leaves with different deformation were shown in Section 3.1 and Section 3.2.

2.4. Simulation Model

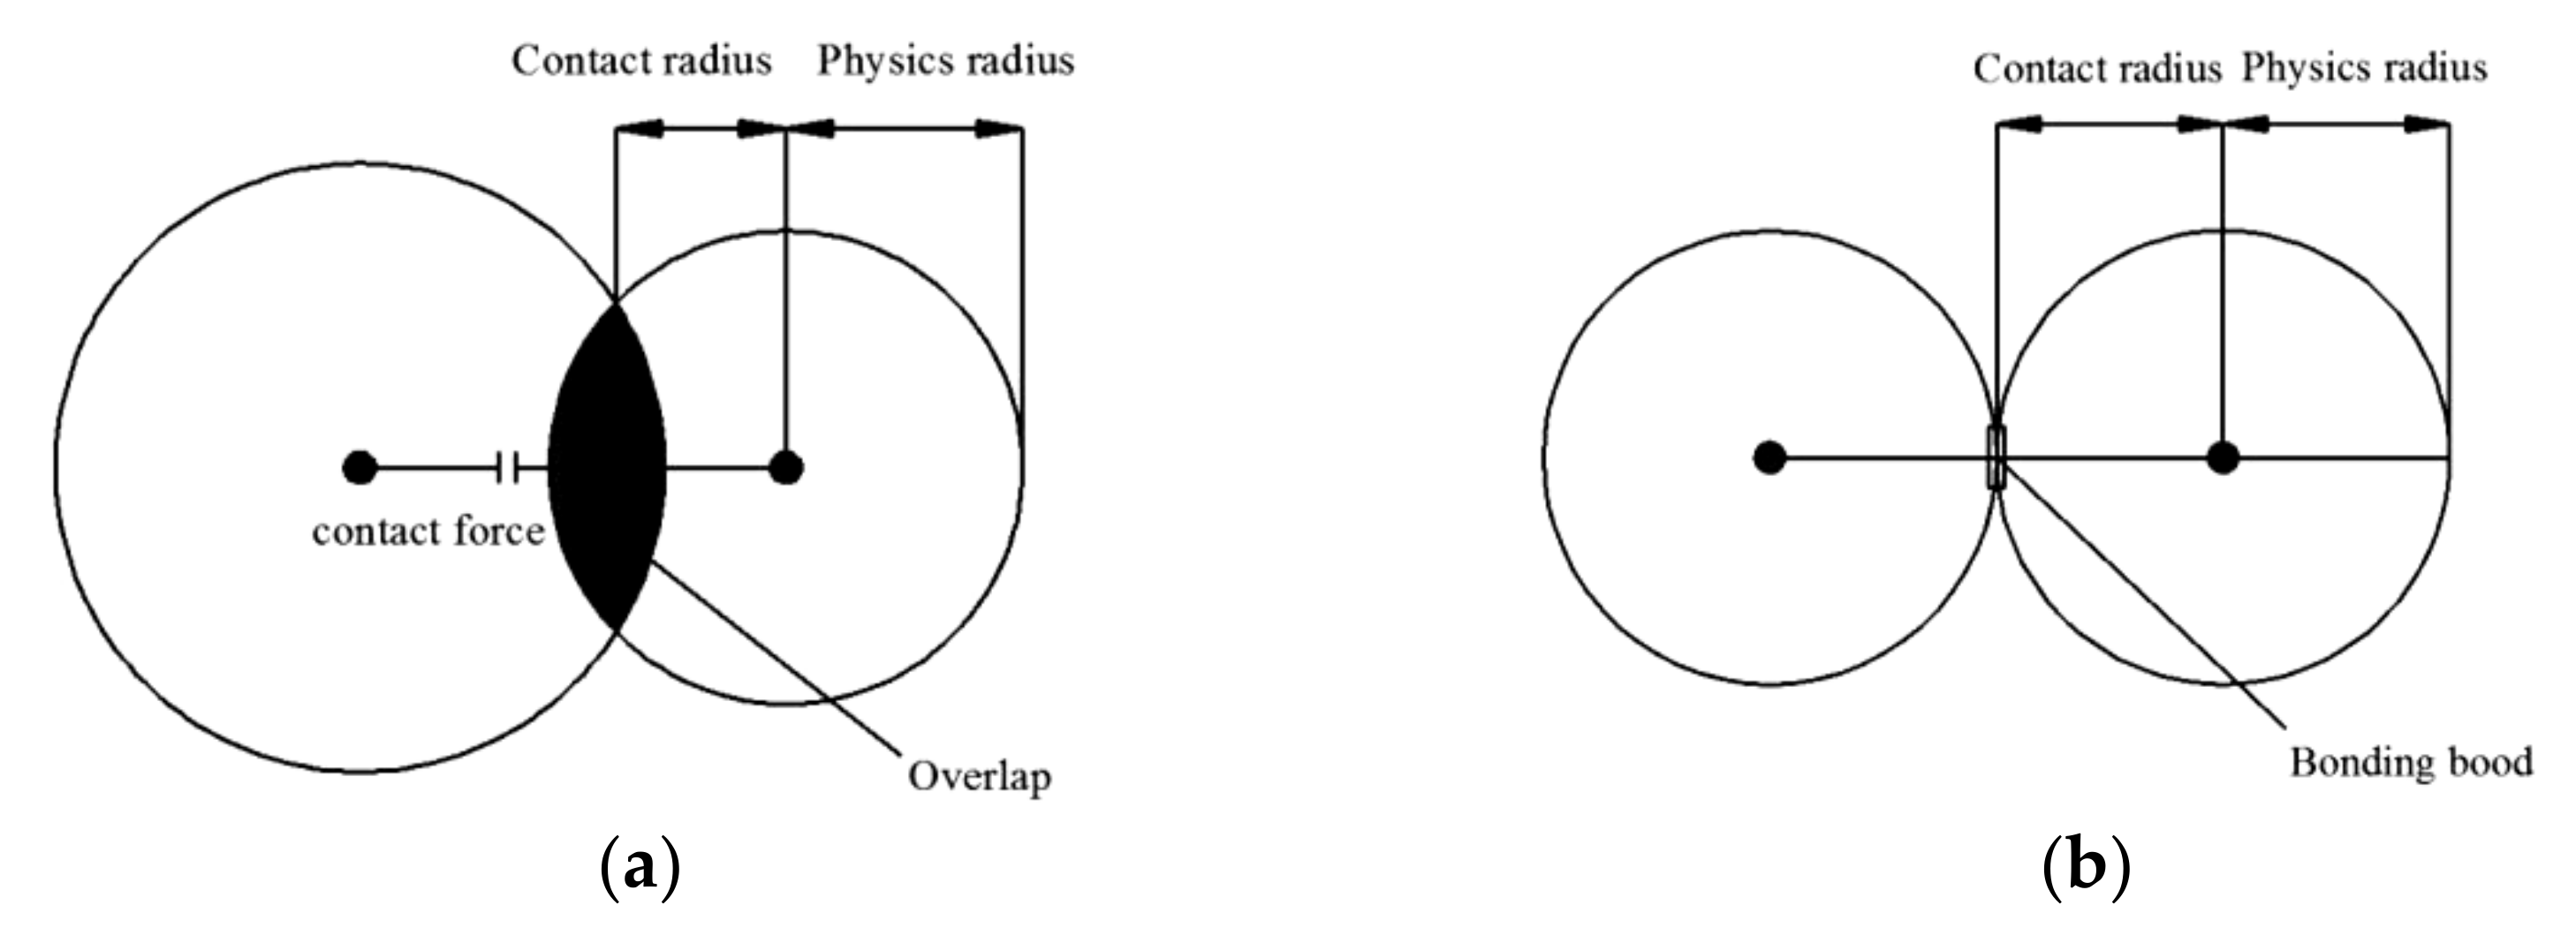
2.4.1. Construction Method of the Non-Spherical Particle Model

The shape of spherical particles is simple and regular, with only one size parameter. Therefore, in the discrete element simulation software, spherical particles are generally selected to establish the simulation model of materials. Considering the efficiency of discrete element simulation, the discrete element model of spherical/quasi-spherical materials can be simplified with a single spherical particle [19]. However, in practice, most materials are irregular and cannot be simplified by a single sphere. To make the discrete element simulation model more in line with the actual material characteristics, the construction method of the non-spherical particle model was adopted.
The multi-sphere polymerization method (MSM) [32,33,34] and bonded particle method (BPM) [35,36] are typically used in the modeling of non-spherical particles. A multi-sphere polymerization model (Figure 4a) comprises multiply stacked and polymerized particles. The discrete element model obtained by this method is relatively consistent with actual material contour, and such a model is regarded as an independent body in EDEM software. A bonded particle model (Figure 4b) is composed of multiple particles with the same diameter connected by “bonds”, the particles are independent of each other; the smaller the radii, the closer it is to the actual material contour.
The filling methods of the non-spherical particle model include manual filling, API (Application Programming Interface) particle replacement, and XML (Extensible Markup Language) methods. The manual filling is commonly used for a simple model filled with small amounts of spherical particles. API particle replacement and XML methods are often used to model filled with a large number of spherical particles, which can improve the speed and accuracy of building particle models. API particle replacement method needs to call corresponding plug-ins to complete the process of small particles replacing large particles and establishing bonding keys. Small particles are independent of each other and are often used in the research of wear and fracture [37]. The XML method refers to adjusting the particle coordinates in the data file in the .xml format file exported by the EDEM post-processing module to obtain the target particle; In this method, all particles are regarded as a whole, and it is typically used for model building without considering wear, cracking and other problems [38].

2.4.2. Construction of Sugarcane Leaf Simulation Model

Based on the result analysis of (Section 3.2), the discrete element simulation model of the sheet-flat leaf was constructed. According to the basic physical parameters of sugarcane leaves obtained from the previous physical tests, a geometric model was established in SolidWorks 2016, and the sugarcane leaf model was saved in .stp format and imported into EDEM 2018. This study used the multi-sphere polymerization model and XML method to construct the sugarcane leaf simulation model, and the Hertz-Mindlin (no-slip) contact model was adopted between particles. The sugarcane leaf model with automatic filling of particles was used. After filling, the central coordinates of all spherical particles are exported using a .cvs format file to process the data in the file. Setting the simulation time to zero and exporting the .xml format DEC file. After importing the particle project newly created in EDEM into a .xml file, the sugarcane leaf discrete element simulation model automatically generated by the software can be used as a particle template for subsequent simulation calls.
When a particle model was established, the smaller the particle radii are, the higher the reduction degree of the particle model, the more spherical particle units required for modeling, and the longer the simulation time, either increase or decrease the particle number has a significant impact on the simulation time [10]. Relevant research has shown that, with the decrease in particle size, the angle of repose decreases and gradually tends toward a constant value [39]. Properly enlarging the particle size can improve the simulation efficiency without affecting the authenticity of the simulation [40]. In this study, the average thickness of sugarcane leaves was 1.04 mm. It is necessary to appropriately enlarge the particle size, and analyze the effect of sugarcane leaf models filled with different particle sizes on the simulation angle of repose and efficiency to screen the better particle size of the sugarcane leaf filling model. Selecting the particle radii of 0.5, 1.0, 2.0, 3.0, and 4.0 mm to build the sugarcane leaf model, as shown in Figure 5.

2.4.3. Construction of Cylinder-Lifting Simulation Model

According to the physical angle of repose test, the steel cylinder and steel plate of the same size as the physical test were established in EDEM. Setting the particle factory in the diameter above the cylinder, the generation speed was 500 pieces/s. After the sugarcane leaves were generated and stabilized, the cylinder was vertically lifted at a uniform speed of 0.05 m/s, and the sugarcane leaves slid on the steel plate under the action of gravity. After all sugarcane leaves were completely stationary, and a stable sugarcane leaf stack was formed on the steel plate. The simulated cylinder-lifting test was shown in Figure 6.

2.4.4. Determination of Sugarcane Leaf Simulation Model

To find the optimal filling particle size of the sugarcane leaf model. The simulation angle of repose test of five sugarcane leaf models with different particle sizes was conducted., The same volume of sugarcane leaves was generated in the hollow cylinder in the simulation. For the contact parameters between sugarcane leaves and between sugarcane leaves and steel: the restitution coefficient, the static friction coefficient, and the rolling friction coefficient were set to 0.5, 0.5, and 0.01, respectively. After the simulation, the front view of the sugarcane leaf stack was exported in EDEM post-processing (Figure 7), and the one-sided angle of repose of the sugarcane leaf stack was obtained by MATLAB image processing. Each group of tests was repeated three times, and the average value was calculated. The test results and analysis were shown in Section 3.3.

2.5. Response Surface Optimization Design of Simulation Model

2.5.1. Determination of the Simulation Parameter Range

The basic physical parameters and surface contact parameters between sugarcane leaves and steel must be used in the simulation test. By consulting the global literature on the determination of the mechanical properties of sugarcane leaves and steel plates and the setting of simulation parameters in DEM simulation, the value range of each simulation parameter in this study was determined, as shown in Table 1.

2.5.2. Plackett-Burman Test

A Plackett-Burman test was conducted to screen out the simulation parameters that significantly influence the angle of repose of sugarcane leaves. The test was designed using Design-Expert. 11 software, and the significant parameters were selected by considering the physical angle of repose of the sugarcane leaf as the response value. The maximum and minimum values of the eight simulation parameters in Table 1 were selected as two levels, coded as +1 and −1, respectively, as shown in Table 2. Considering the middle level of 0 as the center point, 13 sets of tests were conducted. The Plackett-Burman test scheme and results were shown in Section 3.4.1.

2.5.3. Steepest Ascent Search Test

To quickly determine the regional range of the optimal value of each simulation parameter. Three significant parameters were selected from the Plackett-Burman test: the static and rolling friction coefficients between sugarcane leaves, and the static friction coefficient between sugarcane leaves and steel were conducted in the steepest ascent search test. During the simulation, the non-significant parameters take the middle level in the Plackett-Burman test, and the significant parameters increase gradually according to the selected step size. The relative error between the simulation angle of repose and the physical angle of repose was used as the evaluation index in the test. The group with the smallest relative error can be determined as the center point between the optimal value regions of each simulation parameter. The test design and results were shown in Section 3.4.2.

2.5.4. Box-Behnken Test

According to the results of the steepest ascent search test, the significance parameters Box-Behnken test was conducted with No. 3 as the central point (0), No. 2 and No. 4 as low level (−1) and high level (+1), respectively, and the value of non-significant parameters was the same as that of steepest ascent search test. The Box-Behnken design scheme and results were shown in Section 3.4.3.

2.6. Determination of Optimal Parameter Combination

Using the optimization module of the Design-Expert. 11 software, taking a physical angle of repose of 21.15° as the optimal target value, the regression equation was optimized and solved to obtain multiple groups of optimal parameters. A set of solutions closest to the average value of the physical angle of repose was selected from multiple sets of optimal parameter combinations.

3. Results and Discussion

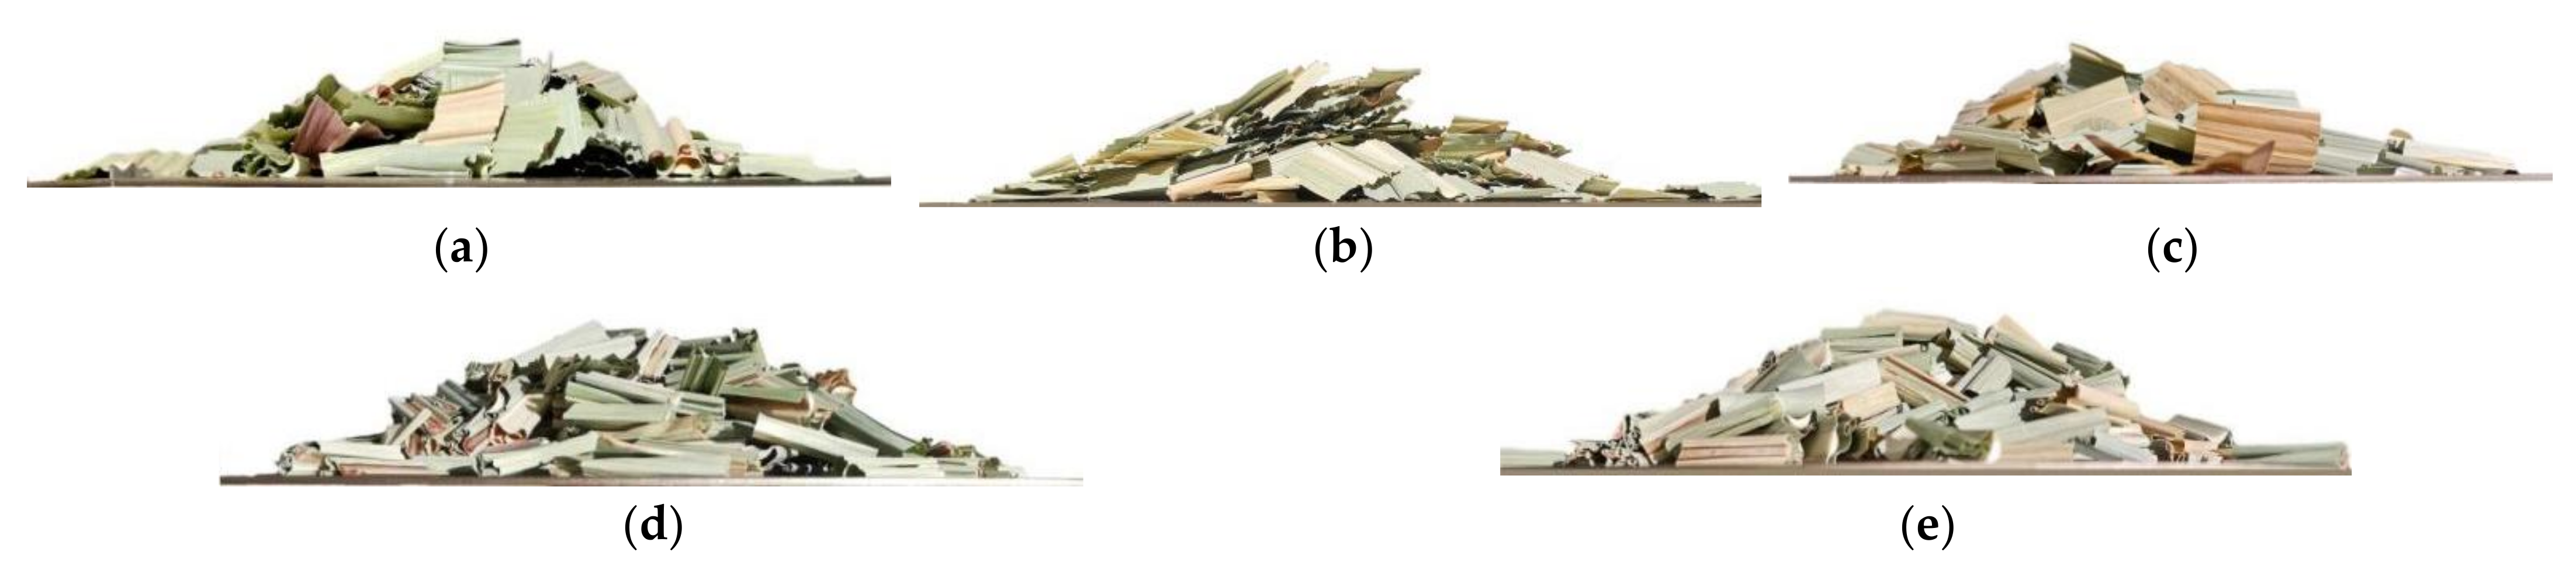
3.1. Results of Physical Angle of Repose Test

Through the cylinder-lifting test, the sugarcane leaf stack resulted from four kinds of deformed leaves, and field mixed leaves were obtained, as shown in Figure 8a–e. According to the above image processing technology, the physical angle of repose of the sugarcane leaf stack was obtained, as shown in Table 3.

3.2. Simplified Results of Sugarcane Leaf Model

The effect of four kinds of deformed sugarcane leaves on the angle of repose, and the relative error with the angle of repose of field mixed leaves was shown in Figure 9. It can be seen from Figure 9 that the greater the degree of curl deformation of sugarcane leaves, the greater the angle of repose of sugarcane leaves; among these four kinds of deformed sugarcane leaves, the relative error in the angle of repose between flat leaf and field mixed leaf was the smallest with 2.35%, indicating that flat leaf was closest to the actual situation of field sugarcane leaves. Considering the complexity of discrete element modeling of various deformed sugarcane leaves, the flat leaves were selected for subsequent discrete element simulation modeling and calibration.

3.3. Determination of Sugarcane Leaf Simulation Model

The simulation angle of repose and simulation time of the sugarcane leaf model were shown in Table 4. The relationship between particle radii and the simulation efficiency and angle of repose of the sugarcane leaf model as shown in Figure 10. As seen from Figure 10, with the decrease in the particle radii of the filled sugarcane leaf model, the simulation time gradually increased, and the simulation angle of repose gradually decreased and tended to be constant. When the particle radii were less than 2.0 mm, the difference in the simulation angle of repose was very small. Continuing to reduce the particle radii had little effect on the angle of repose, but the simulation time increased suddenly and rapidly. Considering the accuracy and efficiency of the simulation, a sugarcane leaf model composed of 2.0-mm-radii filling particles was selected for the subsequent parameter calibration.

3.4. Response Surface Optimization of Optimal Parameters Combination

3.4.1. Results of Plackett-Burman Test

The Plackett-Burman screening test scheme and results were showed in Table 5. The variance analysis of the test results was conducted using Design-Expert. 11 software, and the order of the effect of each parameter on the angle of repose was shown in Table 6. The order of significance from large to small was as follows: the static friction coefficient between sugarcane leaf (X4), the rolling friction coefficient between sugarcane leaf (X5), the sugarcane leaf and steel static friction coefficient (X7), the restitution coefficient between sugarcane leaf (X3), Poisson’s ratio of the sugarcane leaf (X1), the shear modulus of the sugarcane leaf (X2), the sugarcane leaf and steel restitution coefficient (X6), and the sugarcane leaf and steel rolling friction coefficient (X8). Among these, the static friction coefficient between sugarcane leaf (p < 0.01) significantly influenced the simulation angle of repose. The rolling friction coefficient between sugarcane leaf and the sugarcane leaf-steel static friction coefficient (p < 0.05) significantly influenced the simulation angle of repose, while the remaining simulation parameters had p > 0.05, indicating that they had little influence on the simulation angle of repose. Therefore, only the three factors with significant influence were considered in the subsequent steepest ascent search test design. The values of the parameters with non-significant influence on the simulation angle of repose were considered the middle level of the Plackett-Burman test. Namely, Poisson’s ratio of sugarcane leaf was 0.30, the shear modulus of sugarcane leaf was 300 MPa, the restitution coefficient between sugarcane leaf was 0.002, the sugarcane leaf and steel restitution coefficient was 0.003, and the sugarcane leaf and steel rolling friction coefficient was 0.03.

3.4.2. Results of Steepest Ascent Search Test

Table 7 shows the design and results of the steepest ascent search test scheme. The results showed that with the increase in the values of the three significant parameters, the relative error between the simulation angle of repose and the physical angle of repose firstly decreased and then increased. At level 3, the relative error was the smallest, and it could be determined that the optimal area was near level 3; therefore, No. 3 was taken as the center point, and No. 2 and No. 4 were taken as the low and high levels for subsequent response surface design.

3.4.3. Results of Box-Behnken Test

The design scheme and results were showed in Table 8. The Box-Behnken test results were fitted by quadratic polynomial regression with Design-Expert. 11 software, and the regression equation between the sugarcane leaf simulation angle of repose and three significant parameters was established:
θ = 21.11 + 6.99 X 4 + 2.29 X 5 + 0.8762 X 7 + 1.03 X 4 X 5 0.71 X 4 X 7 2.04 X 5 X 7 + 0.6579 X 4 2 + 1.17 X 5 2 + 2.04 X 7 2
The variance analysis results of the regression model were shown in Table 9. According to the model p value, the primary and secondary order of the effect of various factors on the angle of repose was as follows: X4 > X5 > X5×7 > X72 > X7 > X52 > X4X5 > X4X7 > X42. Among them, the static friction coefficient and rolling friction coefficient between sugarcane leaf, the interaction term of the rolling friction coefficient between sugarcane leaf and the sugarcane leaf-steel static friction coefficient, and the quadratic term of the sugarcane leaf and steel static friction coefficient had an extremely significant influence on the angle of repose results. The quadratic term of the rolling friction coefficient between sugarcane leaf, the interaction term of the static friction coefficient and rolling friction coefficient between sugarcane leaf, and the sugarcane leaf and steel static friction coefficient had a significant influence on the results of the angle of repose, and the other terms were not significant (p < 0.05). The fitting model of the angle of repose (p < 0.01) indicates that the fitting degree of the model was very significant; the mismatch term had p = 0.0818 > 0.05, indicating that the model fits well and that there were no mismatch factors. The regression model’s determination coefficient (R2) was 0.9935, and the adjustment coefficient of determination (R2Adj) was 0.9817; both were close to 1, indicating that the predicted value of the regression equation fits well with the actual value. The coefficient of variation (CV) was 3.29%, indicating that the test was reliable; the accuracy (adeq precision) was 28.5825, indicating that the model had good accuracy. Figure 11 shows a residual diagnostic diagram from the quadratic model. Figure 11a presents a normal diagram of the residuals, which were reasonably close to a straight line, again illustrating the adequacy of the model in describing the relationship between the independent variables and the angle of repose. Figure 11b shows the relationship between residuals and predicted values. The residuals were randomly scattered, with the more scattered and irregular indication of the better equation prediction. Figure 11c compares the predicted and tested values of the angle of repose. In summary, the regression model can truly and reliably reflect the actual situation and can be used further to predict the angle of repose of particle stack.

3.4.4. Interaction Effects of the Regression Model

In this test, the angle of repose was taken as the response value, and multiple regression fitting was performed on the data using Design-Expert. 11 software to generate the response surface (Figure 12) to analyze further the interaction of each significant influencing factor on the response value. Figure 12a shows that, compared with the rolling friction coefficient between sugarcane leaves, the response surface curve of the static friction coefficient between sugarcane leaves is steeper. Indicating that it has a more significant influence on the angle of repose; the angle of repose gradually becomes more prominent with the increase in the other factor value between sugarcane leaves when the one-factor value was constant. Figure 12b shows that when one of the coefficients of rolling friction between sugarcane leaf and the coefficient of static friction between sugarcane leaf and steel was fixed at a negative one, the angle of repose will gradually increase with the increase of the other one.

3.5. Optimal Parameter Combination and Test Verification

The physical angle of repose of sugarcane leaf was the optimization target value, and X4, X5, and X7 were regarded as the optimization objects, and then the optimization module of Design-Expert software was used to optimize the solution for this objective. Based on the Plackett-Burman test and the steepest ascent search test, the ranges of X4, X5, and X7 have been determined to be 0.2~0.4, 0.03~0.05, 0.3~0.5, respectively. Therefore, the corresponding objective and constraint equations were as follows:
T a r g e t   v a l u e = 21.15 ° s . t . 0.2 X 4 0.4 0.03 X 5 0.05 0.3 X 7 0.5
The following optimal combinations of the influencing factors were obtained: the static and rolling friction coefficients between sugarcane leaf were 0.21 and 0.05, respectively, the static friction coefficient between sugarcane leaf and steel was 0.30, and the other non-significant parameters were at the middle level.
To verify the accuracy of the sugarcane leaf discrete element calibration parameters. A simulation test of the sugarcane leaf angle of repose was conducted using the above optimal parameter combination, and the simulation was repeated five times. Figure 13 shows the comparison between the physical angle of repose and the simulation angle of repose, the relative error between the simulation test mean value of 21.96° and the physical test mean value of 21.15° was 3.71%. Independent-sample T-tests were conducted on the simulation results and physical test values, and p = 0.096 > 0.05, indicating no significant difference between the calibrated simulation angle of repose and the physical angle of repose. Which further verifies the reliability of the sugarcane leaf discrete element calibration parameters. The test comparison is shown in Figure 14.

3.6. Gas-Solid Coupling Simulation Test

To further verify the feasibility and accuracy of the sugarcane leaf simulation model and parameters calibration, a gas-solid coupling simulation test was conducted with the trash content as the test index and compared with the field test.
According to the actual material size and the modeling method in Section 2.4.3, the discrete element model of billet and sugarcane leaf was established in EDEM 2020. The test measurement and calibration results of sugarcane leaves’ intrinsic and contact parameters were inputted. The wall mesh model of the fluid was imported, and the fan blade speed was consistent with Fluent’s setting. In gas-solid coupling simulation, the time step of particle simulation was 1 × 10⁻⁷ s, and the time step of airflow simulation was 1 × 10⁻⁵ s. The number of Fluent steps was set to 500,000, that is, the simulation time was 0.5 s. The simulation process is shown in Figure 15.
The field test equipment was an HN4GDL-194 sugarcane chopper combine harvester developed by South China Agricultural University, and the sugarcane variety was Guitang 49 planted in Zhanjiang, Guangdong province. During operation, the trashes discharged from the extractor fan were collected using a net bag, and the billet was collected using a colored shed cloth, As shown in Figure 16. The test index was presented as follows:
J h = W z W j z × 100 %
where Wz is the total mass of trash, kg; Wjz is the total mass of samples collected in the determination area, kg; Jh is trash content, %.
During the gas-solid coupling simulation and field test, the speed extractor was 1100 r/min, the feeding rate was 5.5 kg/s, the leaf diameter ratio (excluding sugarcane slightly) was 7% and repeated three times, and the trash content was calculated. The test results are shown in Figure 17, the maximum relative error between simulation value and test value was 8%. The independent sample T-test was conducted on the results, showing that there was no significant difference between simulation value and test value. Thus, it showed that the modeling method and parameters calibration of the sugarcane leaf model were accurate and reliable and could be used for subsequent gas-solid coupling simulation research.

3.7. Discussion

(1)
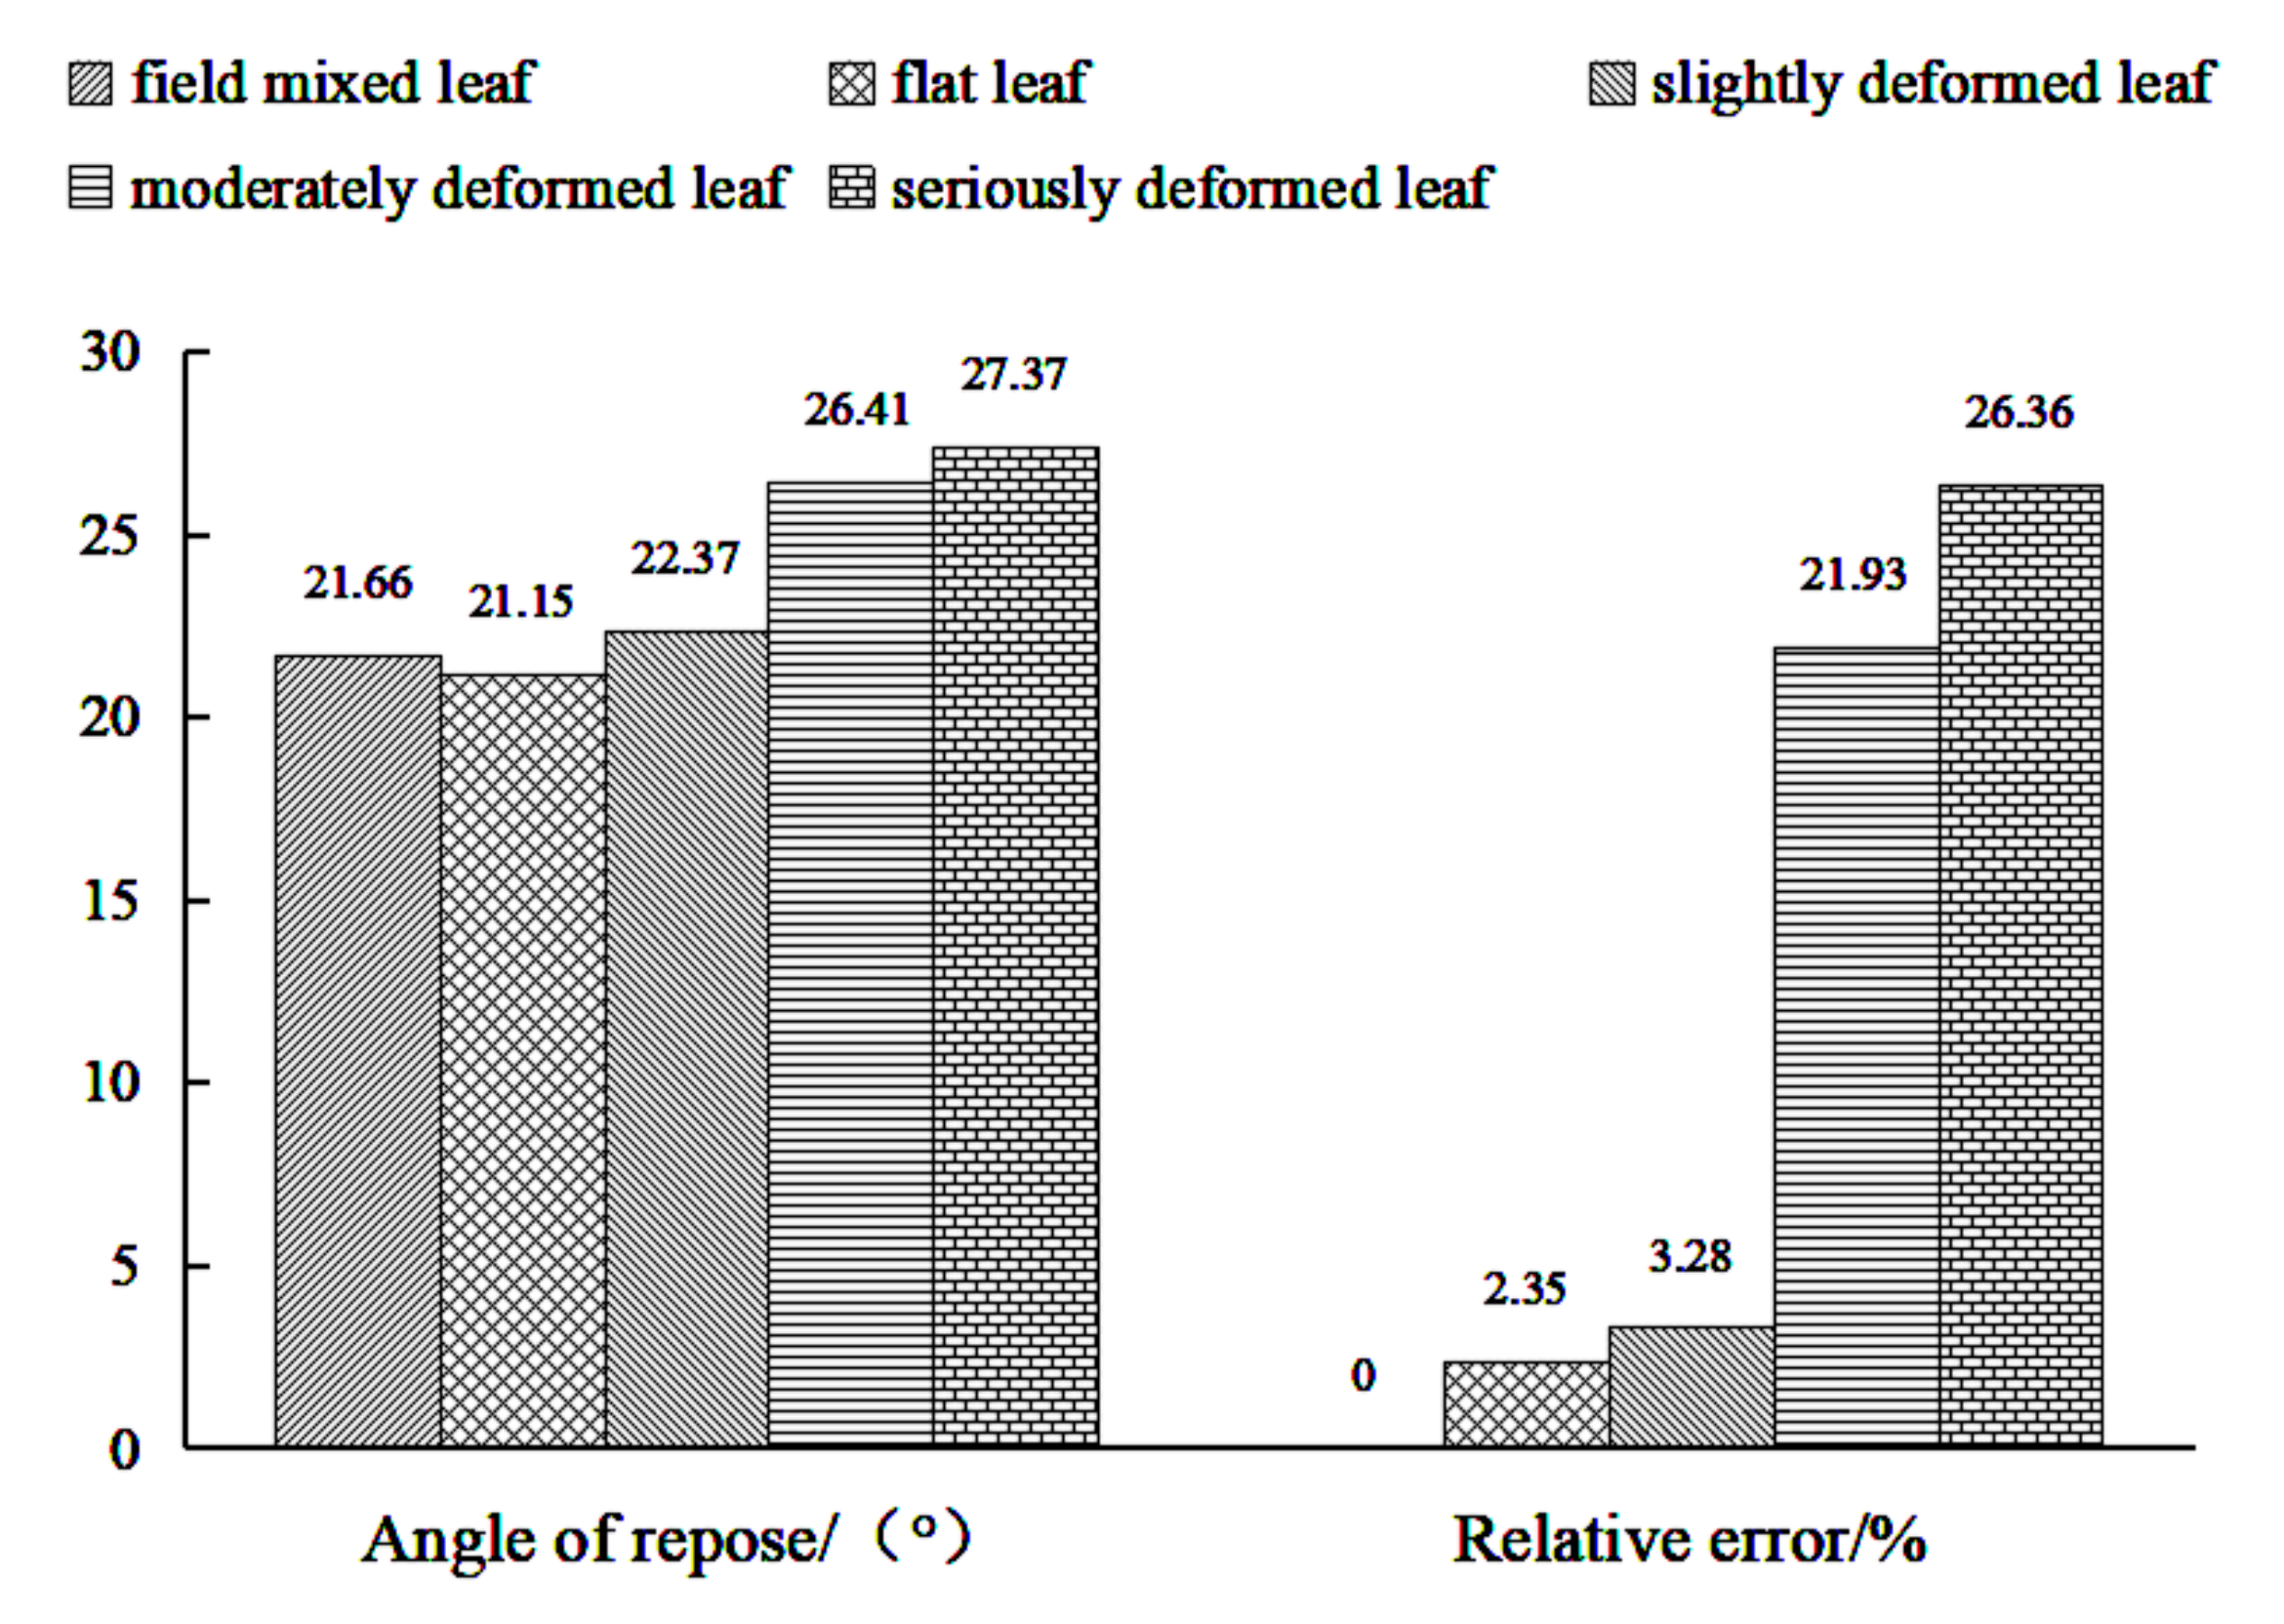
The test results from Figure 10 show that the surface shape of sugarcane leaves had some influence on the angle of repose, and the relative error of angle of repose between flat leaves and actually mixed leaves was the smallest (2.35%). The field conditions of sugarcane leaves during harvesting are complex. Under the error condition that does not deviate from the actual situation, using sugarcane leaves with one shape to replace the complex mixed leaves for subsequent simulation modeling can simplify the complexity of the modeling process and improve the work efficiency. However, with the future upgrading of DEM simulation technology, the construction of complex models becomes relatively simple. The sugarcane leaf models can be built based on actual field conditions.
(2)
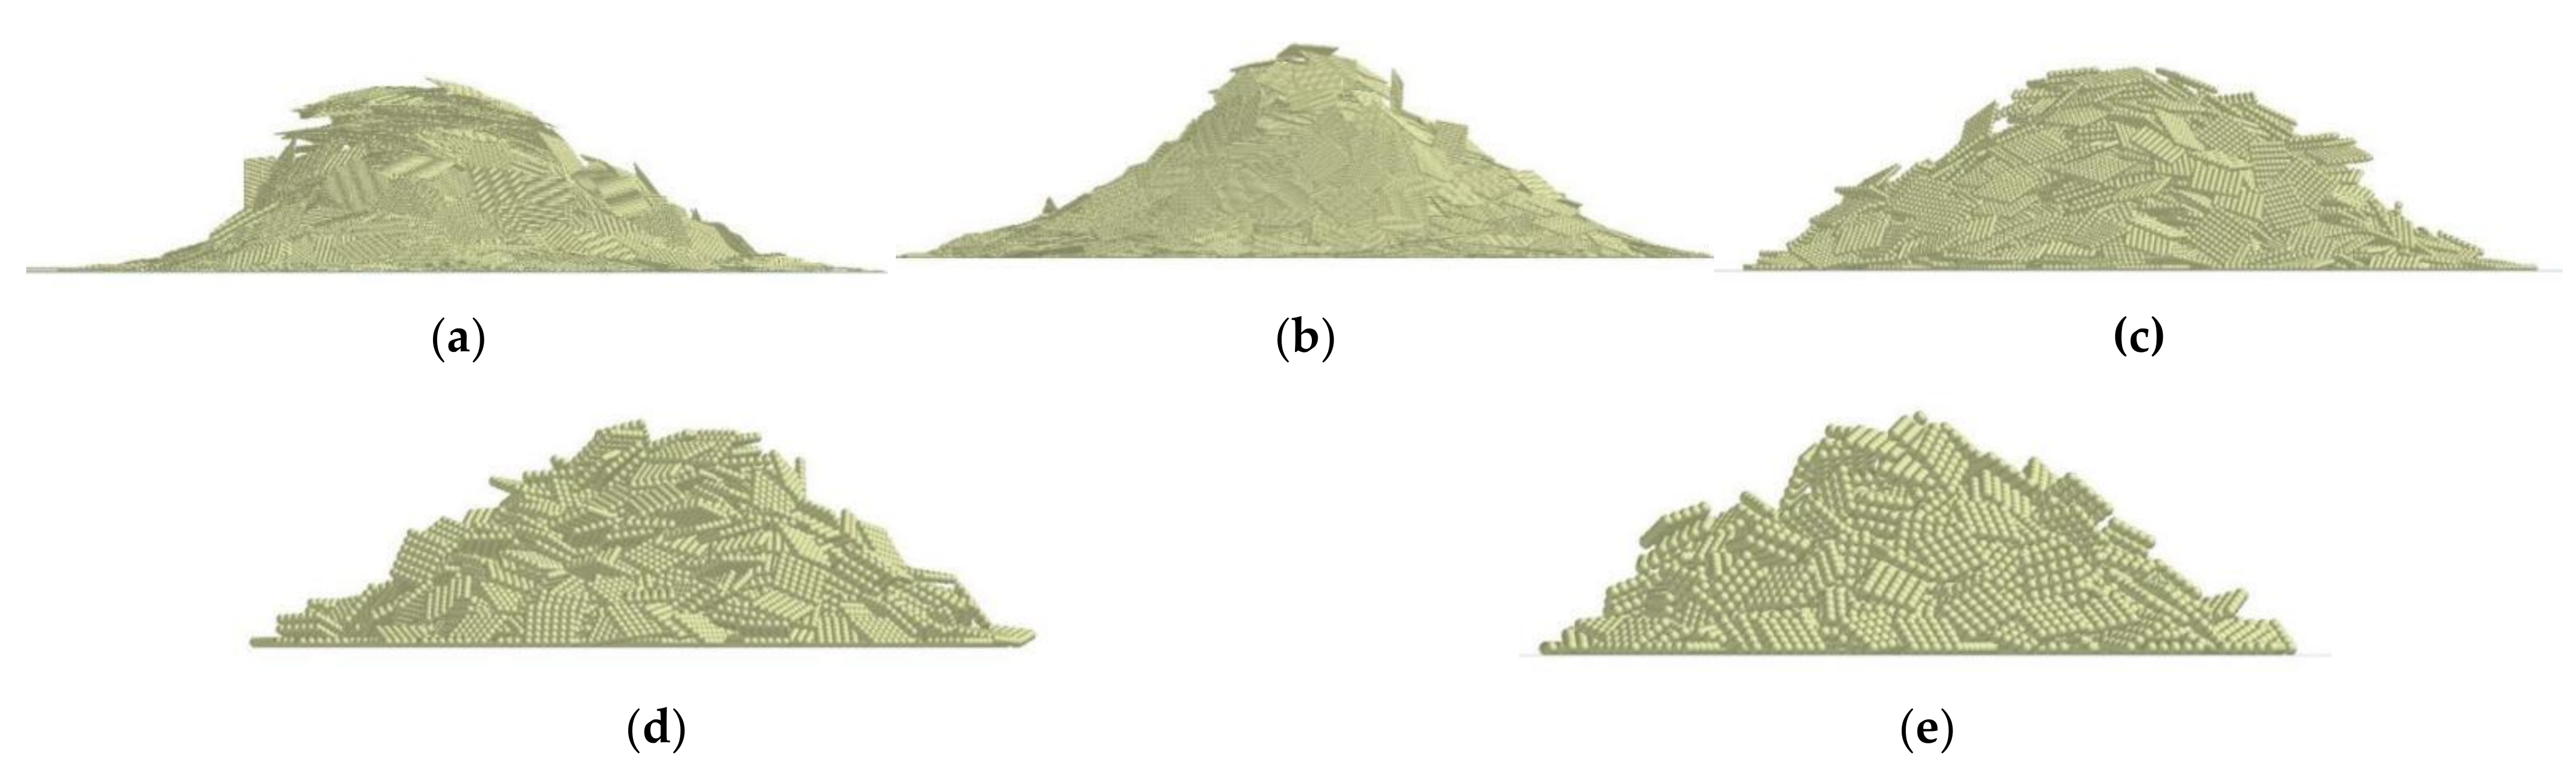
In the discrete element particle modeling, the smaller the particle radii, the more particle number, the higher the model accuracy, and the longer the simulation time. For micro-particles such as soil, fertilizer, and biomass particles materials, as well as flake particles such as leaves [12,41,42], it is generally necessary to enlarge the particles properly when constructing the DEM simulation model. The enlarged degree of the particle radii affects the material model’s accuracy and the simulation efficiency, which has always been a problem in constructing material DEM simulation models. The particle radii were generally selected based on experience without reasonable screening when modeling the above materials. This study analyzed the particle radii used in the discrete element modeling of thin sugarcane leaves. The study shows that the simulation efficiency decreases gradually, and the simulation angle of repose decreases gradually and tends to a constant value with the decrease of particle radii. Which reveals a balance between the simulation efficiency and the model accuracy; the simulation efficiency can be improved, and the model’s accuracy will not be reduced by using the spherical element with 2-mm radii to construct the sugarcane leaves simulation model. The research can provide some reference for the discrete element modeling of agricultural materials.
(3)
Relevant scholars [25,26] obtained the optimal parameters combination using the range analysis method based on the linear model but did not analyze the significance of each factor and interaction on the angle of repose. The range analysis method is simple and intuitive in data processing, but it has the disadvantages of low accuracy and poor predictability, thus there was a significant error in the optimal parameter combination obtained. Referring to the above research, the RSM based on the nonlinear model is adopted to analyze the effect of various significant and interactive factors on the angle of repose, the high-precision regression equation was obtained, and the optimal parameter combination was found by reasonable prediction.

4. Conclusions

The following conclusion can be drawn from this study:
(1)
The physical angle of repose of sugarcane leaves with different shapes was tested. The results showed that the greater the curling degree of sugarcane leaves, the greater the physical angle of repose. Via comparative analysis, the relative error of angle of repose between flat leaf and field actual mixed leaf was the smallest with 2.35%. Thus, the flat leaf was selected to replace the mixed leaf for subsequent sugarcane leaf simulation modeling and parameter calibration.
(2)
The multi-sphere polymerization method constructed five sugarcane leaf simulation models with different filling particle sizes. Via the cylinder-lifting simulation test, the effects of the five models on the simulation angle of repose and simulation efficiency were obtained, and the optimal filling particle size of the sugarcane leaf model was selected with r = 2 mm. Such a model was used for the following simulation parameter calibration.
(3)
The Plackett-Burman test was used to select the parameters that significantly influence the simulation angle of repose, and the second-order regression equation between the significant parameters and angle of repose was established based on the Box-Behnken test. Taking the physical angle of repose of 21.15° as the optimal target value, the optimal combination of parameters was as follows: the static and rolling friction coefficients between sugarcane leaves were 0.21 and 0.05 respectively, and the static friction coefficient between sugarcane leaves and steel was 0.30.
(4)
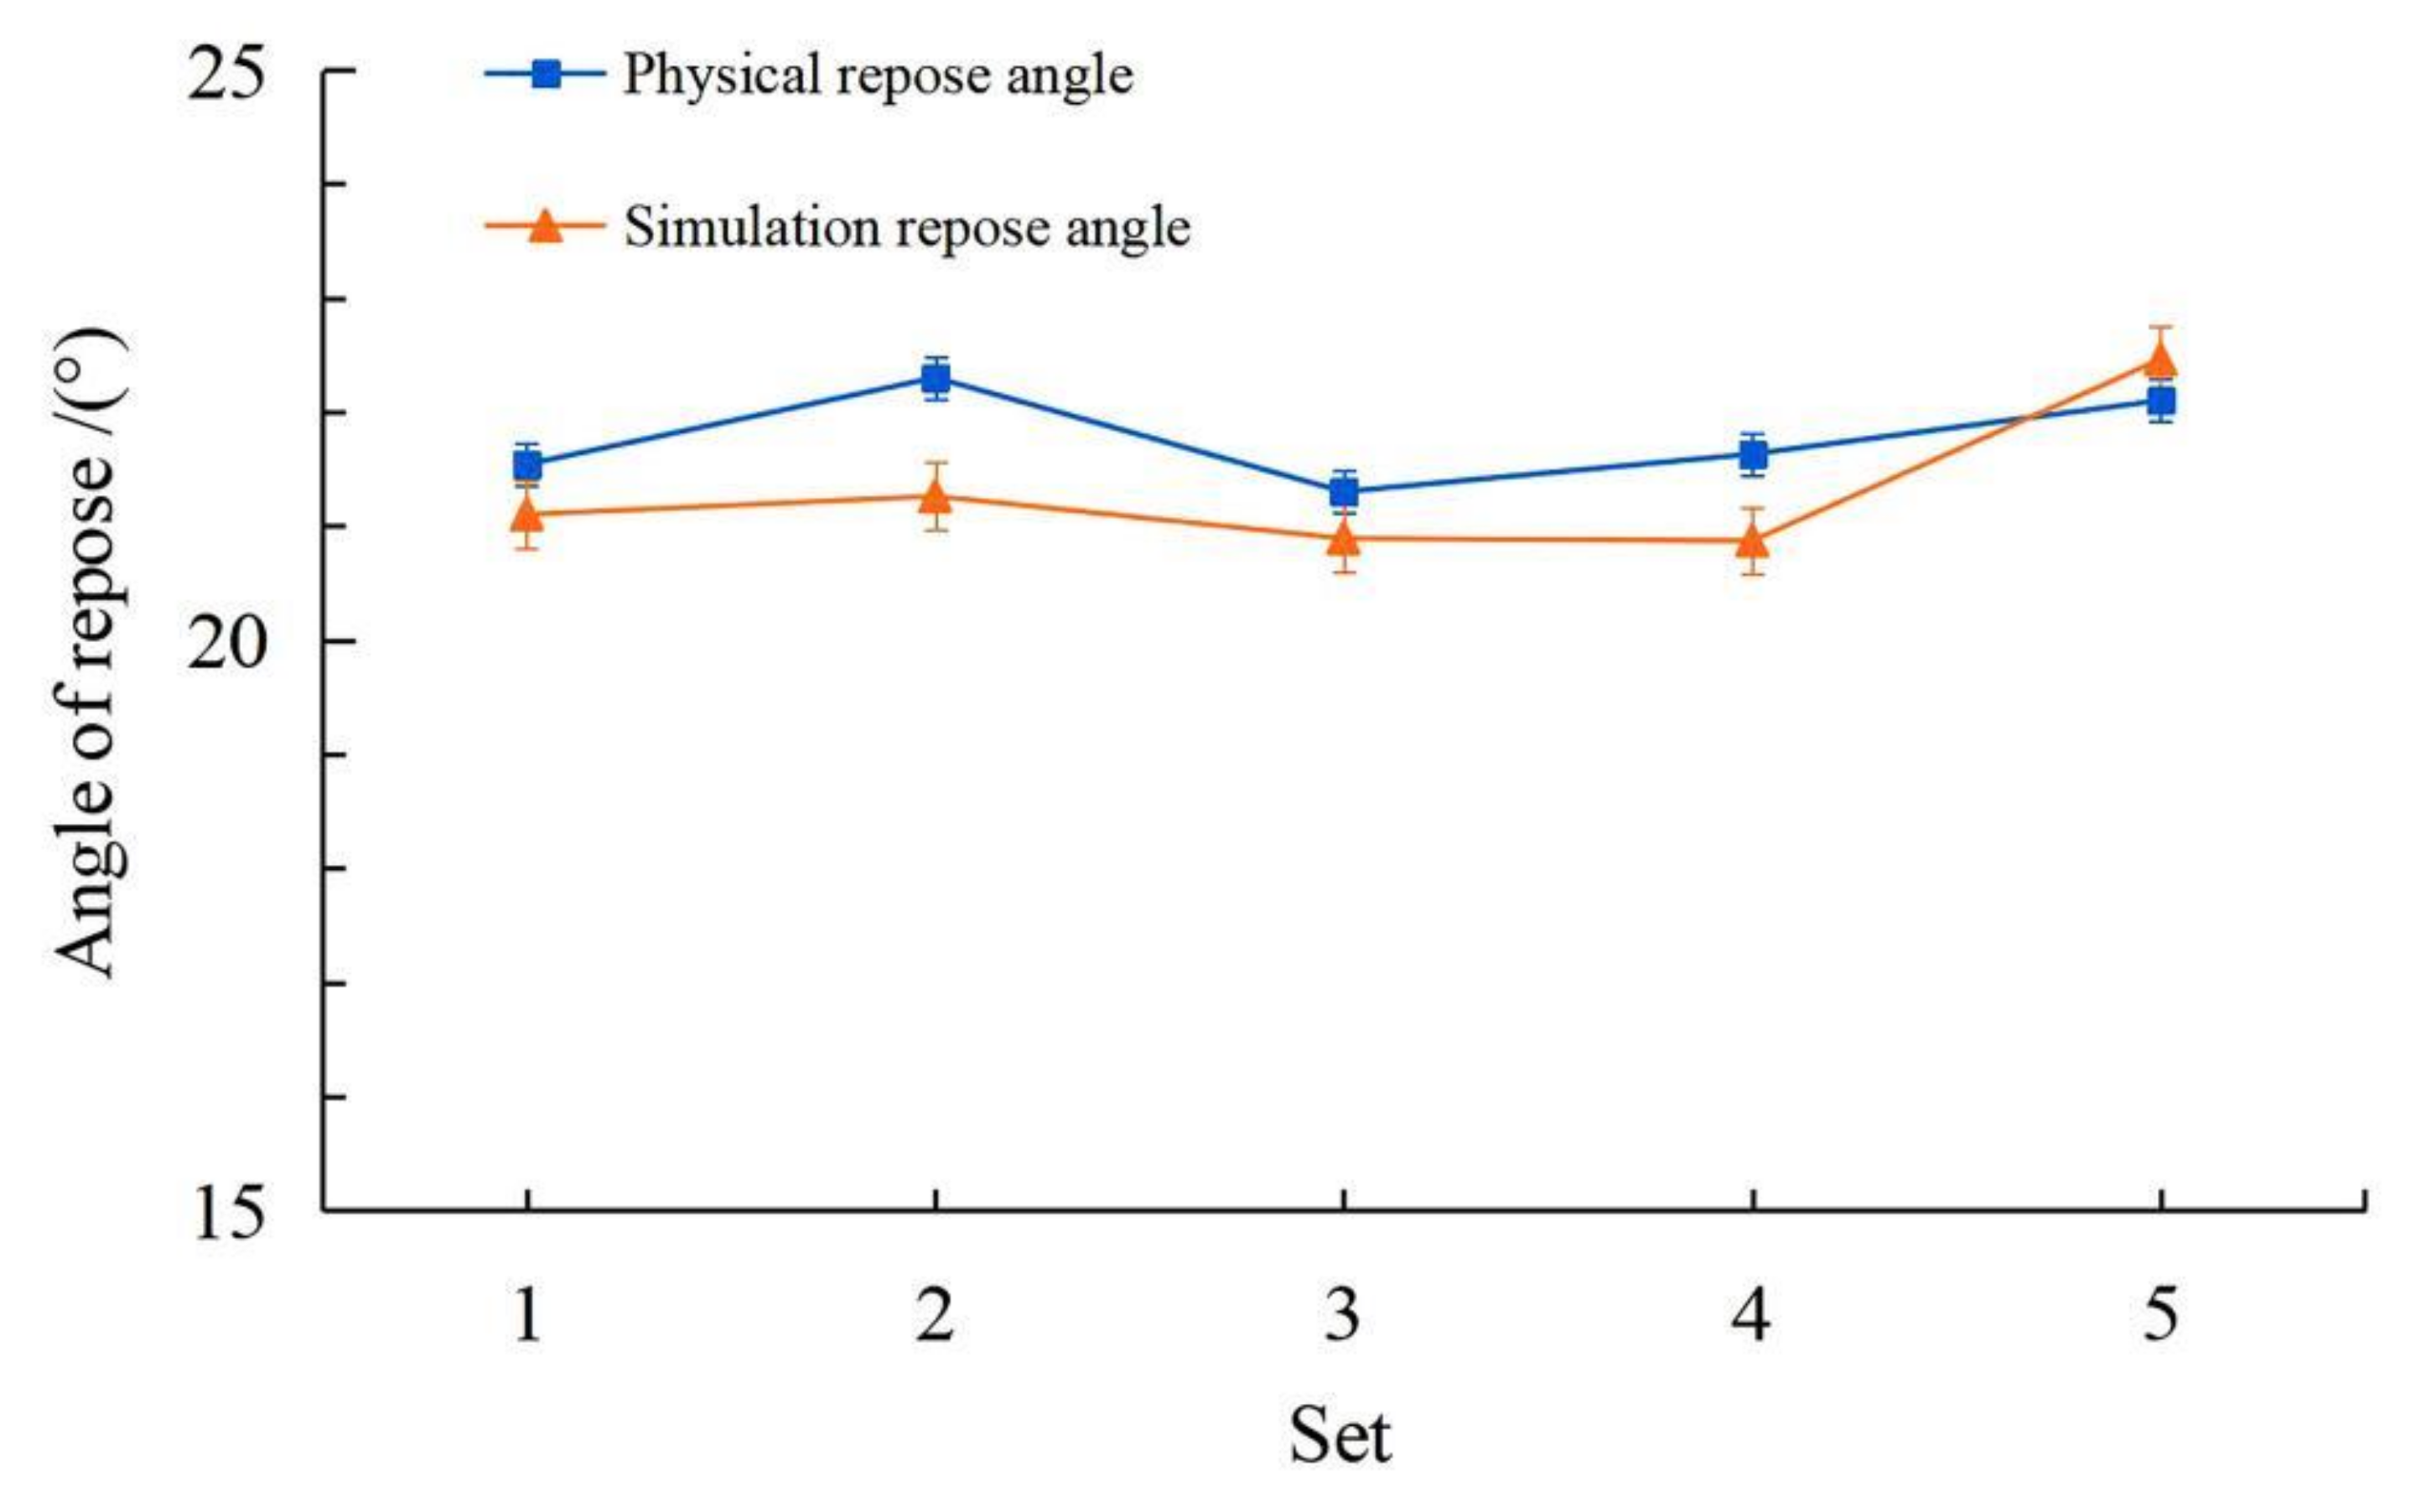
An independent sample t-test verified the optimal parameter combination. The result showed no significant difference between the simulation angle of repose and the physical angle of repose, and the relative error between them was 3.71%, which further verified the reliability of sugarcane leaf discrete element calibration parameters.
(5)
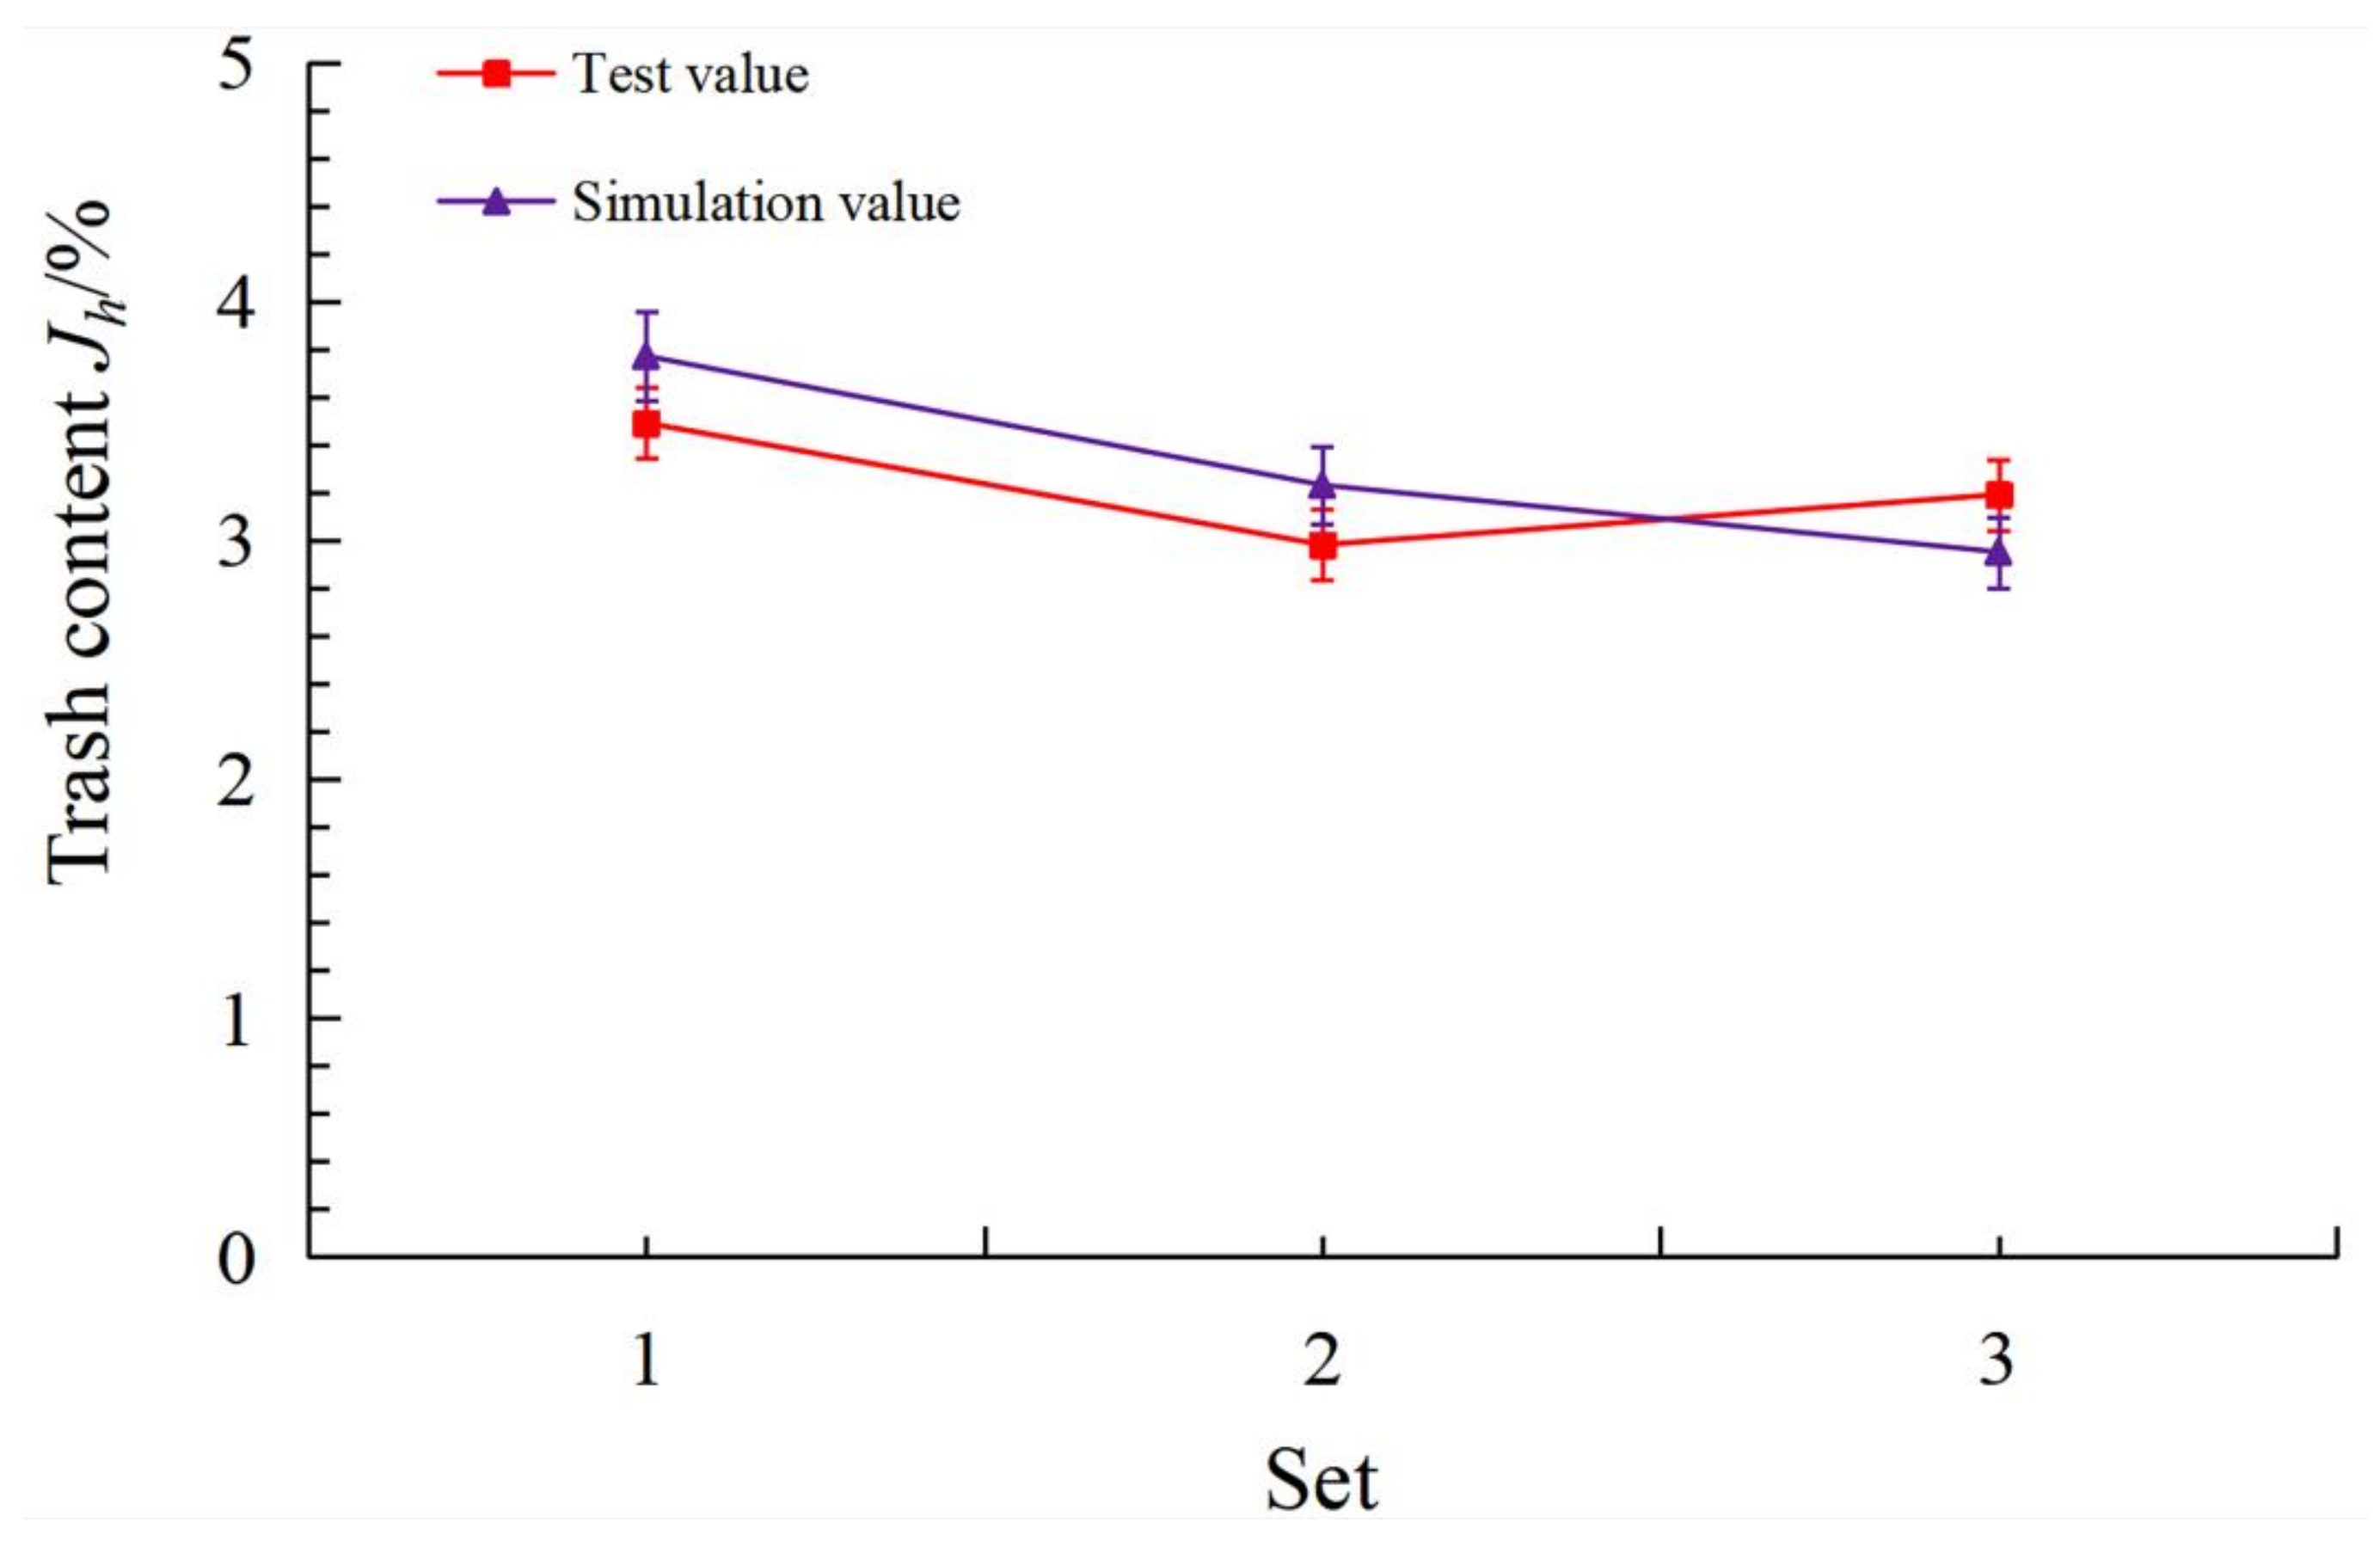
The gas-solid coupling simulation test was conducted with the trash content as the test index and compared with the field test. The test results showed that the maximum relative error between simulation value and test value was 8%. It further showed that the modeling mothed and parameter calibration of the sugarcane leaf model were accurate and reliable and could be used for subsequent gas-solid coupling simulation research.

Author Contributions

Conceptualization, T.W. and J.R.; methodology, J.R.; software, J.R.; validation, W.M., K.L. and P.H.; formal analysis, J.R. and K.L.; investigation, F.X.; writing—original draft preparation, J.R.; writing—review and editing, T.W.; supervision, Q.L.; project administration, T.W.; funding acquisition, T.W. and Q.L. All authors have read and agreed to the published version of the manuscript.

Funding

The National Natural Science Foundation of China (Grant No. 52175227), the Guangdong Basic and Applied Basic Research Foundation, China (Grant No. 2022A1515010680), the Technical System Innovation Team for Sugarcane Sisal Industry of Guangdong Province, China (Grant No. 2022KJ104-11), the National key research and development project, China (Grant No. 2020YFD1000605), and the National Sugar Industry Technology System, China (Grant No. CARS-170402).

Institutional Review Board Statement

Not applicable.

Informed Consent Statement

Not applicable.

Data Availability Statement

The data reported in this study is contained within the article.

Conflicts of Interest

The authors declare no conflict of interest.

References

  1. Xing, H.M.; Ma, S.C.; Wang, F.L.; Bai, J.; Ma, J.Z. Aerodynamic performance evaluation of sugarcane harvester extractor based on CFD. Sugar Tech. 2021, 23, 627–633. [Google Scholar] [CrossRef]
  2. Xie, F.X.; Ou, Y.G.; Liu, Q.T.; Zou, X.P.; Feng, J.M. Design and experiment of impurity discharging fan of sugarcane harvester. Trans. Chin. Soc. Agric. Eng. 2012, 28, 8–14. [Google Scholar] [CrossRef]
  3. Xie, F.X.; Ou, Y.G.; Liu, Q.T.; Wang, C.Z. Virtual experiment on material flow simulation for whole stalk sugarcane harvester. In Proceedings of the 2011 International Conference on New Technology of Agricultural Engineering, Zibo, China, 27–29 May 2011; pp. 185–188. [Google Scholar] [CrossRef]
  4. Xing, H.M.; Ma, S.C.; Wang, F.L.; Bai, J.; Hu, J.W. Structure optimization and experiment of sugarcane chopper harvester extractor. Trans. Chin. Soc. Agric. Eng. 2020, 36, 67–75. [Google Scholar] [CrossRef]
  5. Horabik, J.; Molenda, M. Parameters and contact models for DEM simulations of agricultural granular materials: A review. Biosyst. Eng. 2016, 147, 206–225. [Google Scholar] [CrossRef]
  6. Oinonen, A.; Marquis, G. A constitutive model for interface problems with frictional contact and cohesion. Eur. J. Mech. A Solids 2015, 49, 205–213. [Google Scholar] [CrossRef]
  7. Zeng, Z.W.; Ma, X.; Cao, X.L.; Li, Z.H.; Wang, X.C. Critical review of applications of discrete element method in agricultural engineering. Trans. Chin. Soc. Agric. Mach. 2021, 52, 1–20. [Google Scholar] [CrossRef]
  8. Zhang, R.F.; Jiao, W.; Zhou, J.L.; Qi, B.; Liu, H.; Xia, Q.Q. Parameter Calibration and Experiment of Seed Discrete Element Model with Different Filling Particle Radius. Trans. Chin. Soc. Agric. Mach. 2020, 51, 227–235. [Google Scholar] [CrossRef]
  9. Wang, Y.X.; Liang, Z.J.; Zhang, D.X.; Cui, T.; Shi, S.; Li, K.H.; Yang, L. Calibration method of contact characteristic parameters for corn seeds based on EDEM. Trans. Chin. Soc. Agric. Eng. 2016, 32, 36–42. [Google Scholar] [CrossRef]
  10. Zhang, R.; Han, D.L.; Ji, Q.L.; He, Y.; Li, J.Q. Calibration methods of sandy soil parameters in simulation of discrete element method. Trans. Chin. Soc. Agric. Mach. 2017, 48, 49–56. [Google Scholar] [CrossRef]
  11. Wu, T.; Huang, W.F.; Chen, X.S.; Ma, X.; Han, Z.Q.; Pan, T. Calibration of discrete element parameters for cohesive soil considering the cohesion between particle. J. South China Agric. Univ. 2017, 38, 93–98. [Google Scholar] [CrossRef]
  12. Wang, L.M.; Fan, S.Y.; Cheng, H.S.; Meng, H.B.; Shen, Y.J.; Wang, J.; Zhou, H.B. Calibration of contact parameters for pig manure based on EDEM. Trans. Chin. Soc. Agric. Eng. 2020, 36, 95–102. [Google Scholar] [CrossRef]
  13. Wan, X.Y.; Liao, Q.X.; Jiang, Y.J.; Shan, Y.Y.; Zhou, Y.; Liao, Y.T. Discrete element simulation and experiment of stem chopping for fodder rape crop harvest. J. Jilin Univ. Eng. Technol. Ed. 2021, 1–9. [Google Scholar] [CrossRef]
  14. Ghodki, B.M.; Patel, M.; Namdeo, R.; Carpenter, G. Calibration of discrete element model parameters: Soybeans. Comput. Part. Mech. 2018, 6, 3–10. [Google Scholar] [CrossRef]
  15. Liu, F.Y.; Chen, J. Effect of calibration experiments on the micro-parameters of wheat required in discrete element simulations. In Proceedings of the American Society of Agricultural and Biological Engineers (ASABE), 2017 Spokane, Washington, DC, USA, 16–19 July 2017. Paper Number: 1701337. [Google Scholar] [CrossRef]
  16. Zhang, T.; Liu, F.; Zhao, M.Q.; Liu, Y.Q.; Li, F.L.; Ma, Q.; Zhang, Y.; Zhou, P. Measurement of physical parameters of contact between soybean seed and seed metering device and discrete device element simulation calibration. J. China Agric. Univ. 2017, 22, 86–92. [Google Scholar] [CrossRef]
  17. Wu, M.C.; Cong, J.L.; Yan, Q.; Zhu, T.; Peng, X.Y.; Wang, Y.S. Calibration and experiments for discrete element simulation parameters of peanut seed particles. Trans. Chin. Soc. Agric. Eng. 2020, 36, 30–38. [Google Scholar] [CrossRef]
  18. Hou, Z.F.; Dai, N.Z.; Chen, Z.; Qiu, Y.; Zhang, X.W. Measurement and Calibration of physical property parameters for Agropyron seeds in a discrete element Simulation. Trans. Chin. Soc. Agric. Eng. 2020, 36, 46–54. [Google Scholar] [CrossRef]
  19. Yu, Q.X.; Liu, Y.; Chen, X.B.; Sun, K.; Lai, Q.H. Calibration and experiment of simulation parameters for panax notoginseng seeds based on DEM. Trans. Chin. Soc. Agric. Mach. 2020, 51, 123–132. [Google Scholar] [CrossRef]
  20. Ma, S.; Xu, L.; Yuan, Q.C.; Niu, C.; Zeng, J.; Chen, C.; Wang, S.S.; Yuan, X.T. Calibration of discrete element simulation parameters of grapevine antifreezing soil and its interaction with soil-cleaning components. J. South China Agric. Univ. 2020, 36, 40–49. [Google Scholar] [CrossRef]
  21. Scheffler, O.C.; Coetzee, C.J.; Opara, U.L. A discrete element model (DEM) for predicting apple damage during handling. Biosyst. Eng. 2018, 172, 29–48. [Google Scholar] [CrossRef]
  22. Kafashan, J.; Wiacek, J.; Ramon, H.; Mouazen, A.M. Modelling and simulation of fruit drop tests by discrete element method. Biosyst. Eng. 2021, 212, 228–240. [Google Scholar] [CrossRef]
  23. Wang, Y.; Zhang, Y.T.; Yang, Y.; Zhao, H.M.; Yang, C.H.; He, Y.; Wang, K.; Liu, D.; Xu, H.B. Discrete element modelling of citrus fruit stalks and its verification. Biosyst. Eng. 2020, 200, 400–414. [Google Scholar] [CrossRef]
  24. Zhao, L.; Zhou, H.; Xu, L.; Song, S.Y.; Zhang, C.; Yu, Q.G. Parameter calibration of coconut bran substrate simulation model based on discrete element and response surface methodology. Powder Technol. 2021, 395, 183–194. [Google Scholar] [CrossRef]
  25. Wen, X.; Yang, W.; Guo, W.J.; Zheng, B. Parameters determination and verification of discrete element of segmented sugarcane harvester for impurity removal. J. Chin. Agric. Mech. 2020, 41, 12–18. [Google Scholar] [CrossRef]
  26. Guo, W.J.; Yang, W.; Wen, X.; Yang, J.; Mo, J.L.; Ceng, B.S.; Nong, H.L. Research on simulation modeling method of sugarcane harvester’s removing impurities operation. J. Agric. Mech. Res. 2020, 42, 6–12. [Google Scholar] [CrossRef]
  27. Jia, H.L.; Deng, J.Y.; Deng, Y.L.; Chen, T.Y.; Wang, G.; Sun, Z.J.; Guo, H. Contact parameter analysis and calibration in discrete element simulation of rice straw. Int. J. Agric. Biol. Eng. 2021, 14, 72–81. [Google Scholar] [CrossRef]
  28. Liao, Y.T.; Wang, Z.T.; Liao, Q.X.; Wan, X.Y.; Zhou, Y.; Liang, F. Calibration of discrete element model parameters of forage rape stalk at early pod stage. Trans. Chin. Soc. Agric. Mach. 2020, 51, 236–243. [Google Scholar] [CrossRef]
  29. Derakhshani, S.M.; Schott, D.L.; Lodewijks, G. Micro–macro properties of quartz sand: Experimental investigation and DEM simulation. Powder Technol. 2015, 269, 127–138. [Google Scholar] [CrossRef]
  30. Jia, F.G.; Han, Y.L.; Liu, Y.; Cao, Y.P.; Shi, Y.F.; Yao, L.N.; Wang, H. Simulation prediction method of angle of repose for rice particle materials. J. Agric. Mech. Res. 2014, 30, 254–260. [Google Scholar] [CrossRef]
  31. Han, Y.L.; Jia, F.G.; Tang, Y.R.; Liu, Y.; Zhang, Q. Influence of granular coefficient of rolling friction on accumulation characteristics. Acta Phys. Sin. 2014, 63, 174501. [Google Scholar] [CrossRef]
  32. Favier, J.F.; Abbaspour-Fard, M.H.; Kremmer, M.; Raji, A.O. Shape representation of axi-symmetrical, non-spherical particles in discrete element simulation using multi-element model particles. Eng. Comput. 1999, 16, 467–480. [Google Scholar] [CrossRef]
  33. Abbaspour-Fard, M.H. Theoretical Validation of a Multi-sphere, Discrete Element Model Suitable for Biomaterials Handling Simulation. Biosyst. Eng. 2004, 88, 153–161. [Google Scholar] [CrossRef]
  34. Kruggel-Emden, H.; Rickelt, S.; Wirtz, S.; Scherer, V. A study on the validity of the multi-sphere discrete element method. Powder Technol. 2008, 188, 153–165. [Google Scholar] [CrossRef]
  35. Salot, C.; Gotteland, P.; Villard, P. Influence of relative density on granular materials behavior: DEM simulations of triaxial tests. Granul. Matter 2009, 11, 221–236. [Google Scholar] [CrossRef]
  36. Kozhar, S.; Dosta, M.; Antonyuk, S.; Heinrich, S.; Bröckel, U. DEM simulations of amorphous irregular shaped micrometer-sized titania agglomerates at compression. Adv. Powder Technol. 2015, 26, 767–777. [Google Scholar] [CrossRef]
  37. Yuan, J.B.; Li, H.; Wu, C.Y.; Qi, X.D.; Shi, X.X.; Li, C. Study on apace particle modeling of rice grain basis on the discrete element method. J. Nanjing Agric. Univ. 2018, 41, 1151–1158. [Google Scholar] [CrossRef]
  38. Wang, M.M.; Wang, W.Z.; Yang, L.G.; Hou, M.T. Research of discrete element modeling method of maizekernel based on EDEM. J. Henan Agric. Univ. 2018, 52, 80–84. [Google Scholar] [CrossRef]
  39. Liu, J.; Yu, G.; Zhao, C.J.; Hu, W.; Qiu, H.L. 2D DEM simulation on the sand pile formation for granular materials with different grain size distributions. Chin. J. Comput. Mech. 2008, 25, 568–573. [Google Scholar]
  40. Coetzee, C.J. Particle up scaling: Calibration and validation of the discrete element method. Powder Technol. 2018, 344, 487–503. [Google Scholar] [CrossRef]
  41. Aikins, K.A.; Ucgul, M.; Barr, J.B.; Jensen, T.A.; Antille, D.L.; Desbiolles, J.M. Determination of discrete element model parameters for a cohesive soil and validation through narrow point opener performance analysis. Soil Tillage Res. 2021, 213, 105123. [Google Scholar] [CrossRef]
  42. Wang, W.W.; Cai, D.Y.; Xie, J.J.; Zhang, C.; Liu, L.; Chen, L. Parameters calibration of discrete element model for corn stalk powder compression simulation. Trans. Chin. Soc. Agric. Mach. 2021, 52, 127–134. [Google Scholar] [CrossRef]
Figure 1. Test of the physical angle of repose in sugarcane leaves.
Agronomy 12 01796 g001
Figure 2. Contour curve extraction process: (a) original stacking image, (b) gray processing, (c) the left stacking image, (d) linear fitting of bulk stacking boundary.
Agronomy 12 01796 g002
Figure 3. Sugarcane leaf samples with different deformation: (a) flat leaf, (b) slightly deformed leaf, (c) moderately deformed leaf, (d) seriously deformed leaf.
Agronomy 12 01796 g003
Figure 4. Modeling method of non-spherical particles: (a) multi-sphere method, (b) bonded particle method.
Agronomy 12 01796 g004
Figure 5. Construction of sugarcane leaf simulation model; (a) r = 0.5 mm, (b) r = 1.0 mm, (c) r = 2.0 mm, (d) r = 3.0 mm, (e) r = 4.0 mm.
Agronomy 12 01796 g005
Figure 6. Angle of repose simulation test process: (a) particle filling, (b) system reaches stability, (c) stable stack.
Agronomy 12 01796 g006
Figure 7. Simulation stacks of five sugarcane leaf models with different filling particle radii; (a) r = 0.5 mm, (b) r = 1.0 mm, (c) r = 2.0 mm, (d) r = 3.0 mm, (e) r = 4.0 mm.
Agronomy 12 01796 g007
Figure 8. Physical stack of sugarcane leaves with different shapes: (a) mixed leaves based on the actual measurement proportion, (b) flat leaves, (c) slightly deformed leaves, (d) moderately deformed leaves, (e) seriously deformed leaves.
Agronomy 12 01796 g008
Figure 9. The effect of sugarcane leaf shape on the angle of repose.
Agronomy 12 01796 g009
Figure 10. Relationship between particle radii and the sugarcane leaf simulation efficiency, angle of repose.
Agronomy 12 01796 g010
Figure 11. Residual diagnostics of the quadratic model; (a) Normal plot of residuals, (b) Residuals vs. predicted, (c) Predicted vs. actual.
Agronomy 12 01796 g011
Figure 12. Effect of interaction on the angle of repose: (a) interactive effects of sugarcane leaf-sugarcane leaf static friction coefficient and sugarcane leaf-sugarcane leaf rolling friction coefficient, (b) interactive effects of sugarcane leaf-sugarcane leaf rolling friction coefficient and sugarcane leaf-steel static friction coefficient.
Agronomy 12 01796 g012
Figure 13. Comparison between the physical and the simulation value of the angle of repose under the optimal parameter combination.
Agronomy 12 01796 g013
Figure 14. Test comparison of the angle of repose for sugarcane leaves: (a) physics test, (b) simulation test.
Agronomy 12 01796 g014
Figure 15. Gas-solid coupling simulation.
Agronomy 12 01796 g015
Figure 16. Field test of the trash removal system.
Agronomy 12 01796 g016
Figure 17. The verification results of simulation value and test value.
Agronomy 12 01796 g017
Table 1. Parameters required for DEM simulation.
MaterialPropertyValueSource
Sugarcane leafPoisson’s ratio0.2~0.4Literature [25,26]
Shear Modulus, Mpa100~500
Density, g cm−30.38
SteelPoisson’s ratio0.30
Shear modulus, Mpa7.9 × 104
Density, g. cm−37.85
Sugarcane leaf-Sugarcane leafRestitution coefficient0.001~0.003
Static friction coefficient0.10~0.60
Rolling friction coefficient0.02~0.06
Sugarcane leaf-SteelRestitution coefficient0.001~0.005
Static friction coefficient0.10~0.60
Rolling friction coefficient0.01~0.05
Table 2. Parameters of the Plackett-Burman test.
SymbolParametersLow Level (−1)High level (+1)
X1Poisson’s ratio for the sugarcane leaf0.200.40
X2Shear modulus of the sugarcane leaf100500
X3Sugarcane leaf-sugarcane leaf restitution coefficient0.0010.003
X4Sugarcane leaf-sugarcane leaf static friction coefficient0.100.50
X5Sugarcane leaf-sugarcane leaf rolling friction coefficient0.020.06
X6Sugarcane leaf-steel restitution coefficient0.0010.005
X7Sugarcane leaf-steel static friction coefficient0.200.60
X8Sugarcane leaf-steel rolling friction coefficient0.010.05
Table 3. Results of physical angle of repose test of sugarcane leaves with different shapes.
SetsAngle of Repose RangeMean ValueStandard Deviation
A19.23~24.12°21.66°2.13
B18.61~23.51°21.15°1.79
C21.00~23.28°22.37°0.97
D24.85~28.95°26.41°1.81
E26.10~29.83°27.37°0.71
Table 4. The simulation angle of repose and simulation time of sugarcane leaf model.
SetsParticle Radii, mmNumber of particlesX View Angle of Repose, (°)Y View Angle of Repose, (°)Average Angle of Repose, (°)Simulation Time, h
A0.5129628.1624.4426.30**
B1.032429.2824.0226.65*
C2.06427.9126.4727.194.0
D3.03635.2629.3732.311.5
E4.02536.0432.0634.050.5
Note: * indicates a simulation time of 24~48 h, ** indicates that the simulation time greater than 48 h, and the simulation equipment is an Intel (R) Core (TM) i5-900F CPU.
Table 5. Plackett-Burman test scheme and results.
No.Test ParametersAngle of Repose,
θ/(°)
X1X2X3X4X5X6X7X8
11 (0.4)1−1111−1−133.38
2−1 (0.2)1 (500)1−1111−115.15
31−1 (100)1 (0.003)1−111132.37
4−11−1 (0.001)1 (0.5)1−11141.57
5−1−11−1 (0.1)1 (0.06)1−1114.45
6−1−1−11−1 (0.02)1 (0.005)1−136.42
71−1−1−11−1 (0.001)1 (0.6)117.47
811−1−1−11−1 (0.2)1 (0.05)10.32
9111−1−1−11−1 (0.01)11.97
10−1111−1−1−1129.52
111−1111−1−1−134.86
12−1−1−1−1−1−1−1−112.86
130000000028.01
Table 6. Significance analysis of the Plackett-Burman test parameters.
ParametersSum of SquareDegree of FreedomF Valuep ValueSignificance Ranking
X17.68012.7190.1985
X23.54311.2540.3446
X315.64115.5370.1004
X41320.9011467.6140.000 **1
X545.708116.1810.028 *2
X63.16211.1190.3687
X731.883111.2870.044 *3
X80.09410.0330.8678
Note: * and ** indicate significant differences at 0.05 and 0.01 levels respectively.
Table 7. Steepest ascent search test design scheme and results.
NO.X4X5X7Angle of Repose, θ/(°)Relative Error, %
10.100.020.2010.5450.04
20.200.030.3018.2813.36
30.300.040.4022.747.77
40.400.050.5030.7545.73
50.500.060.6041.9198.63
Table 8. Box-Behnken test design scheme and results.
No.Test FactorsAngle of Repose,
θ/(°)
X4X5X7
1−1 (0.2)0−1 (0.3)16.11
2−101 (0.5)20.24
31 (0.4)0−130.79
410132.08
5−1−1 (0.03)0 (0.4)15.43
61−1028.09
7−11 (0.05)017.73
811034.49
90 (0.3)−1−120.48
100−1125.35
1101−129.36
1201126.08
1300 (0.04)022.13
1400022.39
1500021.80
Table 9. Box-Behnken test regression model analysis of variance.
Source of VarianceSum of SquaresDegrees of FreedomMean Squarep Value
Model481.91953.550.0001 **
X4391.161391.160.0001 **
X541.91141.910.0005 **
X76.1416.140.0264 *
X4X54.2014.200.0496 *
X4X72.0212.020.1343
X5X716.61116.610.0037 **
X421.6011.600.1728
X525.0615.060.0368 *
X7215.37115.370.0044 **
Residual3.1650.6326/
Lack of Fit2.9930.99610.0818
Pure Error0.174920.0874/
Sum485.0714//
R2 = 0.9935R2adj = 0.9817CV = 3.29%Adequate precision = 28.5825
Note: * and ** indicate significant differences at 0.05 and 0.01 levels respectively.
Publisher’s Note: MDPI stays neutral with regard to jurisdictional claims in published maps and institutional affiliations.

