Article

Ultrasound-Assisted Extraction of Total Phenolic Compounds and Antioxidant Activity in Mushrooms

by
María José Aliaño-González
1,
Marta Barea-Sepúlveda
1,
Estrella Espada-Bellido
1,
Marta Ferreiro-González
1,
José Gerardo López-Castillo
2,
Miguel Palma
1,
Gerardo F. Barbero
1,* and
Ceferino Carrera
1
1
Department of Analytical Chemistry, Faculty of Sciences, Agrifood Campus of International Excellence (ceiA3), IVAGRO, University of Cadiz, 11510 Puerto Real, Spain
2
Unidad de Protección de la Salud, Distrito Sanitario Granada-Metropolitano, Consejería de Salud y Familias, Junta de Andalucía, 18150 Gójar, Spain
*
Author to whom correspondence should be addressed.
Agronomy 2022, 12(8), 1812; https://doi.org/10.3390/agronomy12081812
Submission received: 23 May 2022 / Revised: 22 July 2022 / Accepted: 27 July 2022 / Published: 30 July 2022
(This article belongs to the Special Issue Extraction and Analysis of Bioactive Compounds in Crops)

Abstract

:
The consumption of mushrooms has considerably increased in recent years because of their beneficial nutritional properties due to their essential amino acids, proteins, and dietary fiber content. Recent research has shown that they are also rich in polysaccharides and phenolic compounds. These compounds exhibit decisive free radical and ROS scavenging power with potential application to the treatment of neurodegenerative disorders. In addition, they present important properties like antioxidant, antiaging, and immune modulation. In the present research, the optimization for the extraction of total phenolic compounds and the antioxidant activity (DPPH and ABTS), based on ultrasound–assisted techniques has been carried out. Five variables (% MeOH in solvent, extraction temperature, amplitude, cycle, and sample:solvent ratio have been selected; both the total phenolic compounds content as well as the antioxidant activity (DPPH and ABTS)) have been considered as the response variables. The optimal conditions, determined by means of a multiresponse optimization method, were established at 0.2 g of sample extracted with 15.3 mL of solvent (93.6% MeOH) at 60 °C for 5 min and using 16.86% amplitude and 0.71 s−1 cycles. A precision study of the optimized method has been performed with deviations lower than 5%, which proves the repeatability and precision of the extraction method. Finally, the extraction method has been applied to wild and commercial mushrooms from Andalusia and Northern Morocco, which has confirmed its suitability for the extraction of the phenolic compounds from mushroom samples, while ensuring maximum antioxidant activity.

1. Introduction

In recent years, people have grown aware of the mental and physical damage suffered as a consequence of certain bad habits, high levels of stress, consumption of ultra–processed food, or insufficient physical activity [1]. As a consequence, many physical and mental illnesses such as depression, anxiety, obesity, and cancer are becoming increasingly common [2,3]. A large proportion of consumers have reacted to this by modifying their consumption habits and eating more nutritious and healthy foods, such as mushrooms. In this sense, mushrooms have been recognized for their superior nutritional value because of their substantial content of essential amino acids, proteins, dietary fiber, polysaccharides, steroids, terpenes, terpenoids, glutathione, and phenolic compounds [4,5]. In fact, mushrooms have been consumed for centuries all over the world and used in cosmetic or even traditional medicine in some Eastern countries [6,7,8].
Many of the energy production processes that are essential to living organisms involve oxidation reactions. In fact, Reactive Oxygen Species (ROS) are present in many of the regular cell metabolic paths [9]. However, an uncontrolled production of ROS may cause damage to certain cells, lipids, proteins or DNA and lead to a number of consequences such as ageing processes or the development of certain diseases such as cancer, atherosclerosis, diabetes, rheumatoid arthritis, etc. [10,11]. Furthermore, an excess of ROS can negatively regulate collagen-synthesizing genes and lead to matrix metallopeptidase (MMP) overexpression in dermal fibroblasts. As the integrity of the skin gets damaged, it becomes thin, fragile, and wrinkled and this could even result in the development of skin cancer [12,13].
Recent studies have proven that polysaccharides and phenolic compounds exhibit a decisive free radical and ROS scavenging power [14]. Because of the high content of these compounds in mushrooms, the extracts obtained from different strains have been analyzed. According to such analysis, mushrooms exhibiting substantial antioxidant, antiaging, immune modulation, hypolipidemic and hemagglutinating activities. Consequently, they have been successfully tested in anticancer and neuroprotection treatments by different researchers [15,16,17,18,19,20,21]. In addition, the phenolic compounds that can be extracted from mushrooms have exhibited important anti–inflammatory properties that wound render them suitable for the treatment of certain neurodegenerative disorders associated with inflammatory processes that may lead to conditions such as Alzheimer’s or Parkinson’s diseases [19,20,21,22,23,24].
For all these reasons, it is necessary to count on rapid, simple, economic and effective analytical methods that can determine the quality of mushrooms according to their phenolic compounds content as well as to their antioxidant capacity. This information would allow us to evaluate the different mushroom varieties and to control the quality of mushrooms and also the products made from them in the food industry.
Conventional extraction methods like maceration or Soxhlet extraction have been widely applied in phenolic compounds extraction because of their easy operation and the undemanding equipment required. However, their long extraction and processing times or their high volume of organic solvents and energy consumption may result in low yields, compound degradation, or high operating costs [25]. For this reason, growing demand for alternative extraction techniques has been observed during the last years. Ultrasound–Assisted Extraction (UAE) is a technique that employs ultrasound waves to generate expansion and compression cycles that produce an acoustic cavitation that forms bubbles [25,26]. When such bubbles collapse, the localized pressure generated by the cavitation forces cause the destruction of the cell walls in the matrix, thereby releasing the cells’ content [27]. This physical-chemical phenomenon makes of UAE an ideal technique for the extraction of certain compounds from plant matrices, such as phenolic compounds. Since neither high temperature nor high pressure levels are required, the phenolic compounds can be extracted by UAE without any damage and, therefore, without altering their antioxidant capacity. Over the last year, many researchers have employed UAE to replace other conventional extraction techniques, like maceration, or solid–liquid extraction, since UAE requires a significantly lower consumption of solvent and energy to achieve the same or even better outputs [28]. Thus, UAE has been successfully employed for the extraction of phenolic compounds from heather flowers, onions, lavender, açai, blueberry, walnut, etc. [27,29,30,31,32,33,34].
Therefore, given the advantages that the employment of ultrasound represents, this study intends to optimize an Ultrasound-Assisted Extraction method for the extraction of total phenolic compounds from different mushroom samples. The Folin–Ciocalteu method has been selected and employed for the detection and quantification of the phenolic compounds in the extracts [35,36,37,38].
Antioxidant capacity is another parameter that had to be evaluated in this research, since it is essential that the extraction method produces extracts that hold the maximum antioxidant capacity of the compounds of interest, so that the different mushroom varieties can be compared against each other. In this case, the ABTS and DPPH methods were employed to measure the antioxidant capacity of the extracts by means of UV–vis spectroscopy. The DPPH method is based on the behavior of a radical that exhibits an intense violet color in the solution at the 515 nm absorption band, but becomes colorless when it is neutralized by antioxidant agents [39,40,41]. This is explained by the DPPH molecule (2,2-diphenyl-1-picrylhydrazyl), which has an unpaired electron that, when in contact either with a substance that can donate a hydrogen atom or with other radical species, produces either the reduced form DPPH–H or DPPH–R respectively. This results in a measurable loss of absorbance and, consequently, of visible color. Thus, the greater the loss of color, the greater the antioxidant activity [40,41].
ABTS, on the other hand, uses a radical that is reactive against most antioxidant molecules. In this case, the ABTS+ cation radical is obtained after ABTS (2,2-azino-bis (3-ethylbenzothiazoline-6-sulfonic acid)) reacts to potassium persulfate in an aqueous solution incubated at room temperature and in the absence of light [42,43]. In this case, a deep green solution is obtained. Similarl to DPPH, the solution’s color intensity decreases when the ABTS+ radical cation reacts with the antioxidant agents and is neutralized. Consequently, the lighter the color the greater inhibition of the ABTS+ radical has taken place, and, consequently, a higher antioxidant activity is being indicated [44,45].
In conclusion, this work is based on first the development of and UAE method for the extraction of phenolic compounds from mushroom samples while ensuring the extracts’ maximum antioxidant capacity. Additionally, to apply the developed extraction method to a variety of mushroom species and derived products for quality control purposes.

2. Materials and Methods

2.1. Mushroom Samples

In order to ensure the suitability of the developed method, a number of samples from wild and commercial mushroom have been tried as part of this investigation. The wild species were picked from various areas in Southern Andalusia and Northern Morocco, while the commercial varieties were purchased from different supermarkets in the province of Cadiz (Spain). Further information on the species, origin, year of collection/acquisition, or supermarket brand can be found in Table S1. At least 15 specimens, either picked or purchased, were used to produce each sample to ensure their representativeness.
All the samples were subjected to the same pretreatment. Firstly, they were deep frozen at −80 °C and a high vacuum system was applied to remove any ice generated by sublimation as well as to dehydrate the samples. For this, a LyoAlfa 10/15 lyophilization equipment (Azbil Telstar Technologies, Terrassa, Barcelona, Spain) was used. Subsequently, the lyophilized mushrooms were ground by means of a regular household electric grinder to produce homogenized powder samples of each species. When ground samples are used a greater contact surface between the mushroom and the solvent is achieved, which in turn enhances extraction outcomes. Finally, the samples were kept in a freezing chamber at −20 °C until analysis. For the optimization of the extraction method, the species Suillus bovinus (picked from Dehesa de las Yeguas, Puerto Real, Spain; 36°33′46.0″ N, 6°07′38.5″ W) was used. Subsequently, the developed method was applied to the rest of the species in order to test its suitability.

2.2. Chemical and Solvents

The extraction solvent was one of the variables to be optimized as part of the method development. For that, methanol of HPLC grade (Fisher Chemical, Loughborough, UK) and Milli–Q water, obtained from a Milli–Q water purification system (Millipore, Bedford, MA, USA), were used, and the percentage of the MeOH in water was achieved by liquid–liquid mixture.
Gallic acid (≥95% purity, Sigma Aldrich, Steinheim, Germany) was employed as the commercial standard to generate the Folin–Ciocalteu calibration curve, whereas 6-hydroxy-2,5,7,8-tetramethylchroman-2-carboxylic acid (Trolox) (≥95% purity, Sigma–Aldrich, Steinheim, Germany) was used for the calibration curves of the DPPH and ABTS methods.
For the quantification of the total phenolic compounds through the Folin–Ciocalteu spectroscopy method, distilled water (Millipore, Bedford, MA, USA), Folin′s reagent (a mixture of sodium phosphomolybdate and sodium phosphotungstate) (Merck KGaA, Darmstadt, Germany), and anhydrous sodium carbonate (Panreac, Barcelona, Spain) were employed. To determine the antioxidant activity through the DPPH method, distilled water and 2,2-diphenyl-1-picrylhydrazyl (DPPH) dissolved in methanol (Fischer Chemical, Loughborough, UK) were used. On the other hand, distilled water, potassium persulfate, and 2,2-azino-bis (3-ethylbenzothiazoline-6-sulfonic acid) (ABTS) dissolved in methanol (Fischer Chemical, Loughborough, UK) were used for the ABTS method.

2.3. Ultrasound–Assisted Extraction

2.3.1. Ultrasound–Assisted Equipment

The UAE system employed for the present research was a Sonopuls HD 2070.2 processor (20 Hz, 70 W, BANDELIN electronic GmbH & Co KG, Heinrichstrabe, Berlin, Germany), with a water bath coupled to a temperature controller (FRIGITERM–10, J.P. Selecta, S.A., Barcelona, Spain) that allowed us to set the desired extraction temperature.

2.3.2. Optimizing the Ultrasound–Assisted Extraction Method

A Box–Behnken design with response surface methodology (BBD–RSM) was used to optimize the UAE method. This design allows to determine the effect from each variable and from their interactions on the response variable, so that the best values of the considered factors can be selected. In addition, since it does not present any axial points, a more spherical arrangement of the design is generated and this allows to avoid any extreme or even unfeasible conditions that might cause the degradation of sensitive compounds, as is the case with phenolic compounds [46]. Five variables were selected to be optimized: % MeOH in solvent, extraction temperature, amplitude, cycle, and sample to solvent ratio.
Box–Behnken designs are based on three levels per factor: (−1) a lower level, (0) an intermediate level, and (1) a higher level. These variables and their ranges were selected according to the research group’s experience. Ultrasound parameters both amplitude and cycle ranges were limited by the characteristics of the equipment used in this study. The sample:solvent ratio was established based on the experience of our research group with extractions from similar matrixes [29,47,48,49]. Nevertheless, a deeper study on the influence attributable to the percentage level of MeOH in the solvent and to the extraction temperature was required to establish the optimum range for this study. The data obtained from such study can be seen below.
The variables’ ranges were established as follows: % MeOH in the solvent (50–100%), extraction temperature (10–60 °C), amplitude (10–40%), cycle (0.2–1 s–1), and ratio (0.25 g:10 mL–0.25 g:20 mL). The extraction time was initially set at 10 min. In addition, 6 central points were set to determine the error, which implies conducting a total of 46 experiments to produce the BBD–RSM design. All the experiments were randomly performed.
Three response variables were considered: the total phenolic compounds content as determined by Folin–Ciocalteu methodology, and then the antioxidant capacity as determined by the DPPH and the ABTS methods. The influence from each factor and the optimal values according to each response variable were analyzed separately. Then, a global analysis was conducted in order to determine the optimum conditions for the three response variables as a whole, i.e., to determine the optimal conditions for a global response where the three response variables would be considered at the same time. A summary of the experimental conditions and their results according to the BBD–RSM design can be seen in Tables S2–S4. The computer application Statgraphic Centurion (version XVII) (Statgraphics Technologies, Inc., The Plains, VA, USA) was employed to determine the effect from the selected variables on the responses, the second–order mathematical model, the surface plots, the optimal levels of the significant variables and the variance of the analysis.

2.4. Evaluating Total Phenolic Compounds and Antioxidant Activity

2.4.1. Spectroscopic Evaluation

For the measurement of the antioxidant activity and for the quantification of the total phenolic compounds, a Cary 60 UV–Vis spectrophotometer (Agilent Technologies, Mulgrave, Australia) was employed. The absorbances were measured with quartz cuvettes, and all the extracts were previously filtered through a 0.22 µm syringe filter.

2.4.2. The Folin–Ciocalteu Method

For the quantification of the total phenolic compounds, the Folin–Ciocalteu method was employed. For that purpose, 250 µL of the extract was mixed with 1.25 mL of Folin’s reagent and 5 mL of 20% sodium carbonate in a 25 mL volumetric flask and then made up to the mark using distilled water. The mixture was homogenized by manually stirring it for some seconds, and then it was allowed to settle for 30 min in the absence of light. Finally, the absorbance was measured at 765 nm by means of a spectrophotometer. The blank sample was produced by replacing the 250 µL of the extract with distilled water.
The calibration curve of this method was generated using gallic acid as the standard at a concentration range from 100 to 1000 mg L–1. The calibration curve obtained was f(x) = 0.0007x − 0.075 with a R2 of 0.9998.

2.4.3. The DPPH Method

DPPH was one of the two methods that had been selected to measure the antioxidant capacity of the extracts. The measuring procedure is described below.
Firstly, 6 · 10–5 M of DPPH solution in methanol was prepared. For that purpose, 1.2 mg of DPPH was dissolved in 10 mL of methanol and transferred into a 25 mL volumetric flask that was made up to the mark with methanol. After that, 100 µL of the extract was mixed with 2 mL of the 6 · 10–5 M DPPH solution in a test tube and allowed to settle for 40 min in the absence of light. The absorbance of the sample at 515 nm was measured by means of a spectrophotometer. The blank sample was produced by subjecting pure methanol to the same procedure. The calibration curve was elaborated with Trolox as the standard in a concentration range from 0.5 up to 100 mg L–1, and then the same procedure was applied. The calibration curve obtained was: f(x) = 0.8596x + 0.309, with a R2 of 0.9994.

2.4.4. The ABTS Method

The ABTS method was used to quantify the antioxidant capacity for a second time. Firstly, a solution of 7 mM of ABTS and 2.45 mM of potassium persulfate was prepared. For that purpose, 19.2 mg of ABTS and 3.3 mg of K2S2O8 were weighed and dissolved in 3 mL of distilled water. Then, the solution was placed into a 5 mL volumetric flask and made up to the mark with distilled water. Finally, the solution was allowed to settle in the absence of light for 16 h. After that, MeOH was gradually and slowly added to the ABTS solution until 0.70 ± 0.02 absorvance was measured at 734 nm. This solution was the one to be used for the ABTS measurements.
The measuring procedure was as follows: 100 µL of the extract was mixed with 2 mL of the ABTS solution in a test tube and the absorbance of the mixture was measured at 734 nm by means of a spectrophotometer. The blank sample was produced by subjecting pure methanol to the same experimental conditions. The calibration curve was elaborated using Trolox as the standard in a concentration range from 0.5 up to 500 mg L–1 and then the same procedure was applied. The calibration curve obtained was: f(x) = 0.0799x − 0.0433, with a R2 of 0.9995.

3. Results and Discussion

3.1. Study of the Previous Extraction Conditions

As previously mentioned, the optimization of the UAE extraction conditions was based on a BBD–RSM design. Five variables were optimized (% MeOH in the extraction solvent, extraction temperature, amplitude, cycle, and sample-to-solvent ratio). The ranges of three of these variables were restricted either by the equipment limited features or based on the research group experience. However, the ranges corresponding to percentage of MeOH in solvent as well as the extraction temperature were determined.
The percentage of MeOH in the extraction solvent was the first variable to be established. For that, different percentages of methanol in water (20, 40, 60, 80, and 100%) were used for the UAEs. The rest of the conditions for these extractions were 0.25 g of Suillus bovinus mushroom extracted at 40 °C for 10 min with 15 mL of the corresponding solvent and using 40% amplitude and 0.5 s–1 of ultrasound cycles. Each extraction was carried out in duplicate.
Each extract was centrifuged for 5 min at 1702× g. The supernatant was transferred into a 25 mL volumetric flask and made up to the mark with the same solvent that had been used for the extraction. The extracts were stored at −20 °C until their analysis by Folin–Ciocalteu, DPPH, and ABTS.
The results have been graphically represented in Figure 1. In general, the solvents with a higher percentage of methanol achieved a most efficient extraction than those with lower concentrations. It can be observed in Figure 1A that the 100% MeOH extraction solvent achieved the greatest total phenolic compounds extraction with a significant difference with respect to the other solvents. On the other hand, the 80% MeOH solvent obtained the extracts with the maximum antioxidant activity according to both DPPH and ABTS measurements (Figure 1B,C), although the differences were not so significant according to the DPPH method. Based on these results, the percentage of methanol in water to be considered for this study would range from 50% to 100%.
Then, the extraction temperature range for this study was also determined. For that purpose, a series of extractions were carried out at different temperatures (10, 20, 30, 40, 50, 60, and 70 °C). In this case, 0.25 g of Suillus bovinus mushroom were extracted using 15 mL of solvent (80% MeOH:H2O) for 10 min and using 40% amplitude and 0.5 s–1 ultrasound cycles. Each extraction was performed in duplicate. Then, each extract was centrifuged for 5 min at 1702× g and the supernatant was transferred into a 25 mL volumetric flask and made up to the mark with 80% MeOH: H2O solvent. The extracts were stored at −20 °C until their analysis by Folin–Ciocalteu, DPPH, and ABTS.
As in the previous case, the results from each analysis are illustrated in Figure 2. In the case of the total phenolic compounds, a growing concentration trend with the increase of temperature was observed, reaching its maximum level at 60–70 °C (Figure 2A). With regard to antioxidant activity, the highest levels were registered by the DPPH method between 30 and 70 °C, although no significant variations could be noted within this range (Figure 2B). On the other hand, according to the ABTS analysis, the temperature interval with a higher antioxidant activity was found between 10 and 40 °C (Figure 2C). Based on these results, and given that methanol boils at 64.7 °C and, therefore, a considerable evaporation of the same takes place above that level, the range 10 to 60 °C was selected.

3.2. Box–Behnken Design

Once the range of values of the five variables had been established, the BBD–RSM design was applied according to six central points. A total of 46 experiments were conducted using 0.25 g samples of Suillus bovinus for each extraction and 10 min as the total extraction time. The 46 extracts were analyzed by Folin–Ciocalteu, DPPH, and ABTS, so that the three response variables were determined, i.e., total phenolic compounds extraction and the two antioxidant activity measurements obtained through DPPH and ABTS, respectively.

3.2.1. Total Phenolic Compounds Extraction

We analyzed a total of 46 extractions by using the Folin–Ciocalteu method, and we employed the total phenolic compounds data as the response variable for the BBD–RSM design. The measured and the predicted values have been correlated in Table S2. An average difference of 1.89% was obtained ranging from 0.03% up to 6.08%. In addition, the model obtained presented an R–Squared statistic of 0.70. A Durbin–Watson test was applied, which evaluates the possible correlation between the conditions and the prediction errors obtained. This model supposes a null hypothesis where the errors are not correlated whereas the alternative hypothesis indicate a first-order autoregressive relation. The value obtained was 1.73, very close to 2 (the value that accepts the null hypothesis). This, together with the low error percentages obtained, indicates the suitability of the developed model to predict the values of phenolic compounds extracted at all the points of the response surface model. Therefore, the accuracy of the influence of the variables as well as their optimal values to reach the maximum extraction of phenolic compounds is obtained. The t-test at 95% confidence was applied and the p-values for each of the optimized variables were obtained. Consequently, the variables with p-values below 0.05 were considered influential. This information can be found in Table 1.
The most influential variables on the total phenolic compounds extraction were the percentage of methanol (p-value 0.00), and the interaction cycle–ratio (p-value 0.00), followed by the quadratic interaction of temperature (p-value 0.01), the quadratic interaction of methanol (p-value 0.01), and the ratio (p-value 0.05). These results have been graphically represented on the Pareto Chart (Figure 3), where the positive influence of the percentage of methanol, the interaction cycle–ratio, and the quadratic interaction of temperature and % MeOH can be observed, as well as the negative influence from the sample:solvent ratio.
It was expected that methanol was an influential variable with a positive effect on the phenolic compounds extraction due to these compounds exhibit an intermediate polarity, and consequently a high affinity for solvents with a similar polarity (as mixtures of methanol and water), and low affinity for solvents with higher polarity (as only water) [29]. In addition, the effect of temperature enhances the solubility of the phenolic compounds and their extraction from the mushroom cells and consequently enriched extracts are obtained [30]. For last, the cycle was also expected as an influential variable due to the ultrasound power for the extraction [32].
The second–order polynomial equation to calculate the optimized extraction of total phenolic compounds was built on the coefficients from the BBD–RSM design:
Y = 11.38 + 0.34X1 + 0.02X2 − 0.01X3 + 0.03X4 − 0.19X5 + 0.26X1X2 − 0.29X1X3 − 0.20X1X4 + 0.002X1X5 − 0.19X2X3 + 0.11X2X4 − 0.16X2X5 + 0.15 X3X4 − 0.10X3X5 + 0.66X4X5 + 0.38X12 + 0.39X22 + 0.03X32 + 0.07X42 + 0.04X52
The optimal conditions to obtain the maximum total phenolic compounds from the mushroom samples were 0.25 g of sample extracted using 10 mL of solvent (100% MeOH) at 56.65 °C and 10.4% and 0.2 s−1 amplitude and cycle, respectively. The optimum percentage of MeOH in the solvent was the highest value within the range used in the study. Previous researches have confirmed that solvents with MeOH percentages over 98% or simply pure methanol achieve better yields of phenolic compounds and flavonoids from mushroom samples [50,51]. This is explained by the lower polarity of MeOH compared to that of water, which results in a higher affinity with the phenolic compounds. The rest of the conditions were in consonance with the optimum values reported by the bibliography on phenolic compounds extraction by UAE from similar matrices [30,33,52]. In addition, some similarities were detected with the UAE methods usually employed for the extraction of polysaccharides, flavonoids or ergosterol from mushroom samples [53,54,55,56]. However, with respect to some of those cases, the amount of solvent and the temperature required for similar efficiency levels were significantly lower in the present method. This represents an important improvement with regard to energy and solvent saving, with the subsequent lower environmental impact.

3.2.2. Measuring the Antioxidant Capacity by DPPH

The antioxidant capacity of the 46 extracts was determined by means of the DPPH method and the results were incorporated to the BBD–RSM design. The measured and the predicted values have been correlated in Table S3 with an average difference of 1.03% that ranged from 0.00% up to 3.99%. The regression model exhibited an R–Squared statistic of 0.60, and a Durbin–Watson value close to 2 (1.68). These results confirm the suitability of the method to extract the compounds of interest from the mushroom samples without affecting their antioxidant capacity. The influence from each one of the variables on this property was evaluated by means of a t-test at 95% confidence. The variables in Table 2 with p-values lower than 0.05 were considered as influential.
The influential variables according to the DPPH results were the percentage of MeOH in the solvent (p-value 0.01) and the quadratic interaction of the sample-to-solvent ratio (p-value 0.02). These results were graphically represented on the Pareto Chart (Figure 4), where the positive influence of the percentage of MeOH can be easily observed. This means that higher percentages of MeOH in the extraction solvents would result in a higher antioxidant activity by the extracts. On the other hand, the quadratic interaction of the ratio exhibited a negative influence. This means that higher percentages of MeOH in the extraction solvents would result in a higher antioxidant activity by the extracts, which has sense due to as it was previously explained, an intermediate polarity enhances the phenolic compounds extraction. A higher phenolic compound extraction supposes a higher antioxidant activity. The previous experience of the group showed that a high amount of sample could produce saturation of the solvent by the extracted phenolic compounds, reducing its solubility capacity and consequently reducing the yield of the procedure, so that in some cases a lower ratio is more optimal [32].
The coefficients obtained from the BBD–RSM design were replaced in the second–order polynomial equation (Equation (2)) to obtain the following equation to calculate the antioxidant capacity according to the DPPH method:
Y = 10.69 + 0.15X1 + 0.01X2 − 0.07X3 + 0.01X4 − 0.03X5 − 0.10X1X2 + 0.01X1X3 − 0.13X1X4 + 0.04X1X5 − 0.10X2X3 + 0.11X2X4 − 0.04X2X5 + 0.03 X3X4 − 0.03X3X5 + 0.10X4X5 + 0.0003X12 + 0.07X22 − 0.07X32 − 0.05X42 − 0.17X52
The optimal UAE conditions that ensured the maximum antioxidant activity according to the DPPH method were 0.2 g of mushroom sample extracted using 14.6 mL of solvent (100% MeOH) at 10 °C and 22.3% and 0.2 s–1 amplitude and cycle, respectively. As in the previous case, the optimum percentage of MeOH was the highest value within the range used in this study, since, as expected, a greater yield of phenolic compounds implies a greater antioxidant activity. The optimum cycle was the lowest value of the range. Lower cycle values could not be tested due our laboratory equipment limited features. Finally, the optimal temperature was also established at the lowest value within the range (10 °C), probably due to higher temperatures may cause the degradation of the antioxidant compounds [57]. Nevertheless, since temperature was not considered as a relevant influential factor, no extractions were run below 10 °C. Other authors have already employed the DPPH method to evaluate the antioxidant capacity of the phenolic compounds extracted using UAE from mushroom samples. It was then observed that the antioxidant activity determined by this measuring method was similar to the one registered in the present research; but again, it should be noted that the amount of sample, the power consumption and the time required were significantly greater in those cases [58,59,60].

3.2.3. Measuring the Antioxidant Capacity by ABTS

Finally, as above stated, the antioxidant capacity of the 46 extracts was also determined by ABTS. The antioxidant activity values obtained were analyzed using the BBD–RSM design and the actual and predicted values have been correlated in Table S4. The average difference between these sets of values was 4.83% ranging from 0.06% to 13.92%. The R–Squared statistic of the regression model was 0.60, and the Durbin–Watson value close to 2 (1.91). As in the previous case, these results confirm the suitability of the method to extract the phenolic compounds from the mushroom samples without affecting their antioxidant capacity. The influence from each one of the variables on this property was evaluated by means of a t-test at 95% confidence. The variables in Table 2 with p-values lower than 0.05 were considered as influential. A t-test was employed to determine the influence from each one of the variables on the antioxidant capacity of the mushroom extracts. The results have been included in Table 3. The confidence level was 95%, i.e., the variables with p-values lower than 0.05 were considered influential.
The influential variables according to the ABTS method were the quadratic interaction of the percentage of MeOH in the solvent (p-value 0.00), the extraction temperature (p-value 0.01), the interaction of temperature:cycle and the quadratic interaction of cycle, both with 0.03 p-values. To determine the influence from each of these variables on the response variable, the Pareto Chart was generated (Figure 5). The negative effect of the quadratic interaction of MeOH percentage, the temperature:cycle interaction, and the quadratic interaction of the cycle can be observed. It can also be noted that, according to the ABTS method, temperature had a positive effect on the antioxidant capacity of the extracts.
The results were similar to the previously obtained for total phenolic compounds and antioxidant activity by DPPH, considering the polarity of the solvent and the temperature as factors that enhance the phenolic compounds extraction and consequently, the antioxidant power of the enriched extracts.
The coefficients obtained from the BBD–RSM design were replaced in the second–order polynomial equation to obtain Equation (3) for the antioxidant capacity according to the ABTS method:
Y = 70.23 − 1.11X1 + 6.51X2 + 0.95X3 + 1.71X4 + 1.55X5 − 0.14X1X2 − 0.32X1X3 + 6.88X1X4 + 3.97X1X5 + 4.77X2X3 − 10.94X2X4 − 0.83X2X5 − 4.71 X3X4 − 0.96X3X5 − 5.61X4X5 − 10.81X12 − 4.24X22 − 3.12X32 − 7.12X42 − 5.37X52
The optimal UAE conditions that ensured the maximum antioxidant activity according to the ABTS method were 0.2 g of sample extracted with 16.72 mL of solvent (66% of MeOH) at 59.31 °C, 40% amplitude and 0.2 s–1 cycles. According to the ABTS method, the maximum antioxidant capacity was achieved when the amplitude was at its highest value within the range and the cycle at its lowest. No greater amplitudes were tested, since amplitude was not considered as a relevant factor. The ABTS method has been previously employed in other research studies to determine the antioxidant capacity of the extracts obtained by UAE from mushrooms. It has been confirmed that in those cases where antioxidant activity levels were similar to those registered in our study, the percentages of MeOH (or EtOH in some cases) in the solvent were similar to the percentages used in our research. However, larger samples, greater amounts of solvent and ultrasound power as well as higher extraction temperatures were required [54,61,62].

3.2.4. Multi-Response Optimization

Once the extraction studies had been carried out individually for the total phenolic compounds, as well as for the antioxidant activity (DPPH and ABTS), a multi-response study was performed with the previously obtained data. With this design, a compromise situation can be obtained for the simultaneous extraction of total phenolic compounds and antioxidant activity. Since much of the antioxidant activity is due to phenolic compounds, it can be observed that the optimal extraction conditions previously obtained are not very different. In any case, with this multi-response study, compromise conditions will be obtained. These conditions will serve for the extraction of the three parameters studied in this work.
Two of the most influential factors are percentage of MeOH in the solvent and extraction temperature. A 3D–response graphic was generated for this optimization (Figure 6). It can be observed that the higher the % MeOH values the higher the global response, although no significant differences could be noted from 0.7 to 1 within the range. On the other hand, the greatest response variable changes were registered when the maximum temperature in the range considered for this study was applied.
According to this analysis, the optimal conditions to obtain the maximum phenolic compounds content and the maximum antioxidant capacity were 0.2 g of sample extracted using 15.3 mL of solvent at 93.6% MeOH:H2O, at 60 °C and using 17% amplitude and 0.71 s–1 cycles. The optimum temperature was the highest value within the evaluated range. No temperatures above the established range were tested since methanol boils at 64.7 °C.
Once the optimal conditions for the three dependent variables studied had been determined by multi-response, triplicate extractions were carried out under such optimal conditions. The results obtained from each one of the response variables were compared against those results obtained from each of the individual methods that had been previously developed (for total phenolic compounds and antioxidant activities individually).
It could be observed that the total phenolic compounds content and the antioxidant capacity according to both measuring methods produced slightly lower values than those obtained from each individually optimized extraction method. However, since these differences were below 5% it was concluded that the global conditions were suitable for the extraction of the phenolic compounds from the mushroom samples while keeping their maximum antioxidant capacity.

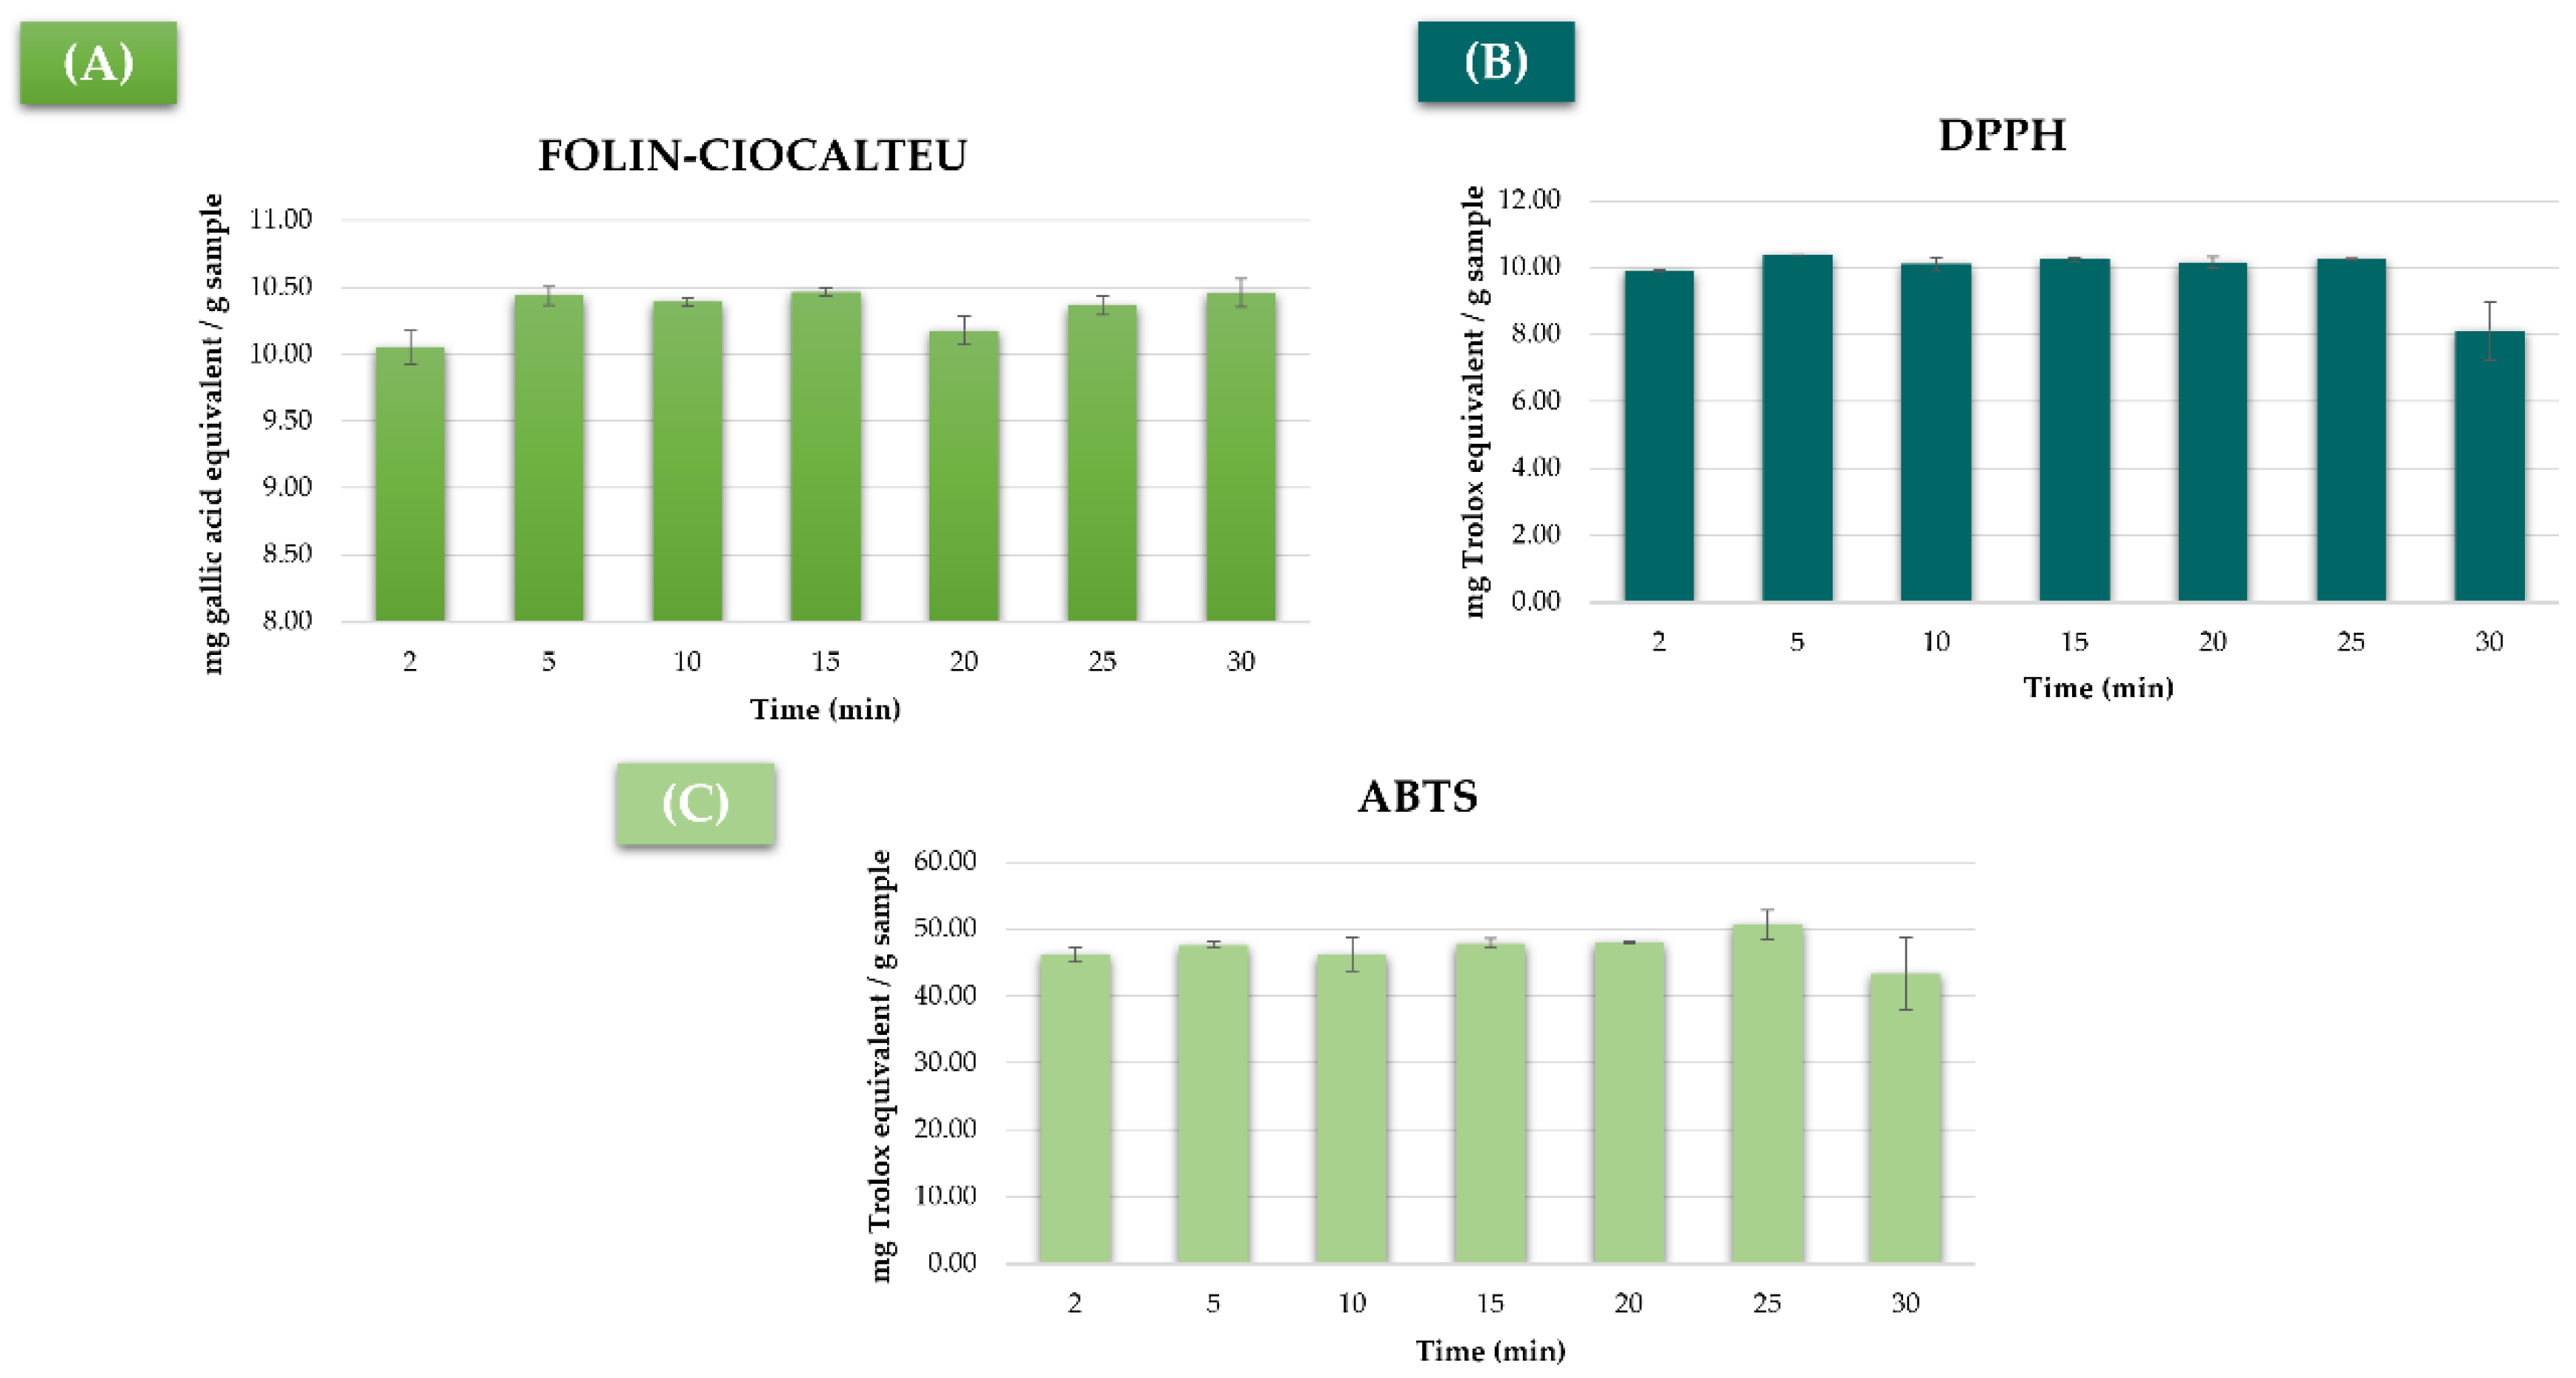
3.3. Extraction Time

Once the conditions for the extractions had been established, the following step was the determination of the optimum extraction time.
For that purpose, a number of extractions at global optimum conditions were performed while using seven different extraction times as follows: 2, 5, 10, 15, 20, 25, and 30 min. Each extraction was carried out in triplicate. All of the extracts were analyzed using the Folin–Ciocalteu, DPPH, and ABTS methods. The results have been graphically presented in Figure 7.
The maximum phenolic compound recoveries were achieved when the extraction time was between 5 and 15 min, while lesser amounts were obtained when longer times were used (Figure 7A). Therefore, 5 min (minimum time in this range) was selected as the extraction time to be used for the extraction of the total phenolic compounds. With regard to antioxidant activity, no significant differences were detected between 5 and 25 min’ extraction times by either of the measuring methods (Figure 7B,C), even if an obvious decrease in antioxidant activity was observed when 30 min were used. This fall in the antioxidant activity is closely associated to the degradation of the compounds that takes place under high temperatures or when longer extraction times are used. It was, therefore, concluded that 5 min was the optimal UAE time to ensure the maximum total phenolic compounds extraction as well as the maximum antioxidant activity of the extracts. This time was significantly shorter than those reported in the bibliography, as some authors required up to 30 min to achieve similar results [53,56].

3.4. Repeatability and Intermediate Precision

The precision of the developed method had to be evaluated. For this purpose, repeatability and intermediate precision analysis were carried out. In the case of repeatability, 10 extractions were performed under optimal conditions on the same day. For the intermediate precision evaluation, 10 extractions were completed under the same conditions on three consecutive days (a total of 30 extractions). All the extracts were analyzed using the Folin–Ciocalteu, DPPH and ABTS methods. The mean and residual Relative Standard Deviation (RSD) have been summarized in Table 4.
In all the cases, the RSD was below 5% according to both measuring methods, with average RSD values of 3.35% and 4.70% for repeatability and intermediate precision, respectively. These results allowed to confirm a high level of precision of the optimized UAE method.

3.5. Applicability of the Developed Method

Since the method optimization process had been conducted by extracts of just Suillus bovinus samples, it was essential to determine its suitability for the production of adequate extracts from other mushroom species or varieties. Therefore, a total of 51 wild and commercially available mushrooms from Andalusia and northern Morocco (Table S1) were evaluated with the UAE method under the optimal conditions. The extracts where subsequently analyzed by Folin–Ciocalteu, DPPH and ABTS methods. The results have been presented in Table 5.
With regard to the total phenolic compounds concentration as measured by the Folin–Ciocalteu method, it can be observed that, in general, all the mushrooms, without any disparities between wild and commercially available, exhibited a concentration of total phenolic compounds between 11 and 14 mg of gallic acid equivalent per gram of lyophilized sample. Nevertheless, the wild species Cantharellus lutescens, with a concentration as high as 20.23 ± 0.94 mg/g, represented a clear exception to this fact. In any case, and except for this particular species, no significant differences were observed between the values registered for the wild species with respect to those corresponding to the mushrooms species that had been cultivated for commercial purposes.
The DPPH results related to the mushroom extracts’ antioxidant activity were all between 10 and 11 mg of Trolox equivalent per gram of lyophilized mushroom. No significant differences were noted between wild and cultivated-mushroom extracts with respect to their antioxidant activity according to the DPPH method. However, once again, the wild species Cantharellus lutescens, whose specimens had been collected from Cortes de la Frontera (Malaga), represented an obvious exception, with an antioxidant activity measured at 18.28 ± 0.83 mg/g, which is clearly superior to those corresponding to the rest of the mushroom species.
Finally, with respect to the data corresponding to the antioxidant capacity of the extracts according to the ABTS measurement, greater variability could be observed between the different species analyzed, both wild and commercially cultivated. In this case, as a general rule, higher values of the antioxidant activity were obtained than those retrieved from the DPPH measurements. This is explained by the fact that each method is based on different antioxidant capacity properties. Thus, the results from the ABTS method ranged from 10 to near 50 mg of Trolox equivalent per gram of lyophilized sample depending on the mushroom species or variety, again without any significant differences in antioxidant capacity between commercially cultivated and wild mushrooms.

4. Conclusions

The suitability of the developed UAE method for the extraction of total phenolic compounds from both wild or cultivated mushrooms, without relevantly affecting their antioxidant capacity has been proven. The global extraction method that has been developed in this study has been confirmed to produce similar results to those obtained by the individually optimized methods (for maximum total phenolic compounds yields, as well as for maximum antioxidant activity), with differences below 5% in every case. This represents a great advantage for its potential application at industrial level, since it would represent significant savings in extraction time and costs. In addition, the optimized method has exhibited high repeatability and intermediate precision according to the three spectroscopic analyses that have been conducted (Folin–Ciocalteu, DPPH, and ABTS) with a coefficient of variation below 5%.
Finally, no significant differences in total phenolic compounds concentrations as well as in antioxidant capacity between wild mushrooms and commercially cultivated mushroom extracts have been detected. Thus, all the species that have been included in this study, either wild or cultivated, presented a significant concentration of total phenolic compounds and antioxidant capacity compared to other foods that are regularly found in our diets. This makes mushrooms an easily available vegan source of antioxidant compounds to incorporate into our diets.

Supplementary Materials

The following additional or supplementary information is available online at https://www.mdpi.com/article/10.3390/agronomy12081812/s1, Table S1: Wild and Commercial Mushroom Species used for this research. Table S2: Box–Behnken design matrix including the values of the six variables considered for each experiment, measured total phenolic compounds and prediction relative error. Table S3: Box–Behnken design matrix including the values of the six variables considered for each experiment, measured antioxidant capacity by DPPH and prediction relative error. Table S4: Box–Behnken design matrix including the values of the six variables considered for each experiment, measured antioxidant capacity by ABTS and prediction relative error.

Author Contributions

Conceptualization, C.C. and G.F.B.; methodology, M.J.A.-G., C.C. and G.F.B.; software, M.F.-G.; validation, J.G.L.-C., E.E.-B. and G.F.B.; formal analysis, M.J.A.-G., M.B.-S., J.G.L.-C. and C.C.; investigation, C.C. and G.F.B.; resources, M.P. and G.F.B.; data curation, M.J.A.-G., C.C. and G.F.B.; writing—original draft preparation, M.J.A.-G.; writing—review and editing, G.F.B. and C.C.; visualization, G.F.B.; supervision, E.E.-B. and G.F.B.; project administration, E.E.-B. and G.F.B.; funding acquisition, E.E.-B. and G.F.B. All authors have read and agreed to the published version of the manuscript.

Funding

This work was financially supported by the University of Cadiz, partially through the “Plan Propio UCA 2022–2023 de Apoyo y Estímulo a la Investigación y la Transferencia” and through the Aula Universitaria del Estrecho within the framework of grants for international collaboration projects (Ref. UCA/R62REC/2021): “Mapa del contenido metálico en setas silvestres comercializables del sur de Andalucía y norte de Marruecos” and “Profundización en el estudio y comparativa de compuestos bioactivos en setas”, and (Ref. UCA/R96REC/2018): “001ENE2019” and “002ENE2019”.

Data Availability Statement

The data presented in this study is contained within the article or Supplementary Material.

Acknowledgments

The authors are grateful to the Plan Propio de Apoyo y Estímulo a la Investigación y la Transferencia and Aula Universitaria del Estrecho (University of Cadiz) for funding support. The authors express their acknowledgements to the “Instituto de Investigación Vitivinícola y Agroalimentaria (IVAGRO)” for providing the necessary facilities to carry out the research. The authors would like to thank the University of Cadiz and Aula Universitaria del Estrecho for the financial support. A special thanks to the Asociación Micológica del Estrecho (Mairei) for its help during the collection and classification of mushrooms.

Conflicts of Interest

The authors declare no conflict of interest.

References

  1. Rizzo, G.; Goggi, S.; Giampieri, F.; Baroni, L. A Review of Mushrooms in Human Nutrition and Health. Trends Food Sci. Technol. 2021, 117, 60–73. [Google Scholar] [CrossRef]
  2. Wang, L.; Brennan, M.A.; Guan, W.; Liu, J.; Zhao, H.; Brennan, C.S. Edible Mushrooms Dietary Fibre and Antioxidants: Effects on Glycaemic Load Manipulation and Their Correlations Pre-and Post-Simulated in Vitro Digestion. Food Chem. 2021, 351, 129320. [Google Scholar] [CrossRef]
  3. Ba, D.M.; Gao, X.; Al-Shaar, L.; Muscat, J.E.; Chinchilli, V.M.; Beelman, R.B.; Richie, J.P. Mushroom Intake and Depression: A Population-Based Study Using Data from the US National Health and Nutrition Examination Survey (NHANES), 2005–2016. J. Affect. Disord. 2021, 294, 686–692. [Google Scholar] [CrossRef]
  4. Sharpe, E.; Farragher-Gnadt, A.P.; Igbanugo, M.; Huber, T.; Michelotti, J.C.; Milenkowic, A.; Ludlam, S.; Walker, M.; Hanes, D.; Bradley, R.; et al. Comparison of Antioxidant Activity and Extraction Techniques for Commercially and Laboratory Prepared Extracts from Six Mushroom Species. J. Agric. Food Res. 2021, 4, 100130. [Google Scholar] [CrossRef]
  5. Kalač, P. A Review of Chemical Composition and Nutritional Value of Wild-Growing and Cultivated Mushrooms. J. Sci. Food Agric. 2013, 93, 209–218. [Google Scholar] [CrossRef] [PubMed]
  6. Lu, H.; Lou, H.; Hu, J.; Liu, Z.; Chen, Q. Macrofungi: A Review of Cultivation Strategies, Bioactivity, and Application of Mushrooms. Compr. Rev. Food. Sci. Food Saf. 2020, 19, 2333–2356. [Google Scholar] [CrossRef] [PubMed]
  7. Kozarski, M.; Klaus, A.; Jakovljevic, D.; Todorovic, N.; Vunduk, J.; Petrović, P.; Niksic, M.; Vrvic, M.; van Griensven, L. Antioxidants of Edible Mushrooms. Molecules 2015, 20, 19489–19525. [Google Scholar] [CrossRef] [PubMed] [Green Version]
  8. Jacinto-Azevedo, B.; Valderrama, N.; Henríquez, K.; Aranda, M.; Aqueveque, P. Nutritional Value and Biological Properties of Chilean Wild and Commercial Edible Mushrooms. Food Chem. 2021, 356, 129651. [Google Scholar] [CrossRef]
  9. Shirley, R.; Ord, E.; Work, L. Oxidative Stress and the Use of Antioxidants in Stroke. Antioxidants 2014, 3, 472–501. [Google Scholar] [CrossRef] [Green Version]
  10. Apel, K.; Hirt, H. Reactive Oxygen Species: Metabolism, Oxidative Stress, and Signal Transduction. Annu. Rev. Plant Boil. 2004, 55, 373–399. [Google Scholar] [CrossRef] [PubMed] [Green Version]
  11. Sharma, P.; Jha, A.B.; Dubey, R.S.; Pessarakli, M. Reactive Oxygen Species, Oxidative Damage, and Antioxidative Defense Mechanism in Plants under Stressful Conditions. J. Bot. 2012, 2012, 217037. [Google Scholar] [CrossRef] [Green Version]
  12. Tu, Y.; Quan, T. Oxidative Stress and Human Skin Connective Tissue Aging. Cosmetics 2016, 3, 28. [Google Scholar] [CrossRef] [Green Version]
  13. Masaki, H. Role of Antioxidants in the Skin: Anti-Aging Effects. J. Dermatol. Sci. 2010, 58, 85–90. [Google Scholar] [CrossRef]
  14. Hu, Y.-N.; Sung, T.-J.; Chou, C.-H.; Liu, K.-L.; Hsieh, L.-P.; Hsieh, C.-W. Characterization and Antioxidant Activities of Yellow Strain Flammulina Velutipes (Jinhua Mushroom) Polysaccharides and Their Effects on ROS Content in L929 Cell. Antioxidants 2019, 8, 298. [Google Scholar] [CrossRef] [PubMed] [Green Version]
  15. Dore, C.; Alves, M.; Santos, M.; de Souza, L.; Baseia, I.; Leite, E. Antioxidant and Anti-Inflammatory Properties of an Extract Rich in Polysaccharides of the Mushroom Polyporus dermoporus. Antioxidants 2014, 3, 730–744. [Google Scholar] [CrossRef] [PubMed]
  16. Malinowska, E.; Krzyczkowski, W.; Herold, F.; Łapienis, G.; Ślusarczyk, J.; Suchocki, P.; Kuraś, M.; Turło, J. Biosynthesis of Selenium-Containing Polysaccharides with Antioxidant Activity in Liquid Culture of Hericium erinaceum. Enzyme Microb. Technol. 2009, 44, 334–343. [Google Scholar] [CrossRef]
  17. Yang, B.-K.; Park, J.-B.; Song, C.-H. Hypolipidemic Effect of an Exo-Biopolymer Produced from a Submerged Mycelial Culture of Hericium erinaceus. Biosci. Biotechnol. Biochem. 2003, 67, 1292–1298. [Google Scholar] [CrossRef] [Green Version]
  18. Gong, M.; An, J.; Lü, H.-Z.; Wu, C.-F.; Li, Y.-J.; Cheng, J.-Q.; Bao, J.-K. Effects of Denaturation and Amino Acid Modification on Fluorescence Spectrum and Hemagglutinating Activity of Hericium erinaceum Lectin. Acta Biochim. Biophys. Sin. 2004, 36, 343–350. [Google Scholar] [CrossRef] [Green Version]
  19. Lee, K.-F.; Chen, J.-H.; Teng, C.-C.; Shen, C.-H.; Hsieh, M.-C.; Lu, C.-C.; Lee, K.-C.; Lee, L.-Y.; Chen, W.-P.; Chen, C.-C.; et al. Protective Effects of Hericium erinaceus Mycelium and Its Isolated Erinacine A against Ischemia-Injury-Induced Neuronal Cell Death via the Inhibition of INOS/P38 MAPK and Nitrotyrosine. Int. J. Mol. Sci. 2014, 15, 15073–15089. [Google Scholar] [CrossRef] [PubMed] [Green Version]
  20. Tang, C.; Hoo, P.C.-X.; Tan, L.T.-H.; Pusparajah, P.; Khan, T.M.; Lee, L.-H.; Goh, B.-H.; Chan, K.-G. Golden Needle Mushroom: A Culinary Medicine with Evidenced-Based Biological Activities and Health Promoting Properties. Front. Pharmacol. 2016, 7, 474. [Google Scholar] [CrossRef] [PubMed]
  21. Wang, W.-H.; Zhang, J.-S.; Feng, T.; Deng, J.; Lin, C.-C.; Fan, H.; Yu, W.-J.; Bao, H.-Y.; Jia, W. Structural Elucidation of a Polysaccharide from Flammulina velutipes and Its Immunomodulation Activities on Mouse B Lymphocytes. Sci. Rep. 2018, 8, 3120. [Google Scholar] [CrossRef] [PubMed]
  22. Lee, K.-F.; Tung, S.-Y.; Teng, C.-C.; Shen, C.-H.; Hsieh, M.C.; Huang, C.-Y.; Lee, K.-C.; Lee, L.-Y.; Chen, W.-P.; Chen, C.-C.; et al. Post-Treatment with Erinacine A, a Derived Diterpenoid of H. erinaceus, Attenuates Neurotoxicity in MPTP Model of Parkinson’s Disease. Antioxidants 2020, 9, 137. [Google Scholar] [CrossRef] [PubMed] [Green Version]
  23. Kushairi, N.; Phan, C.W.; Sabaratnam, V.; David, P.; Naidu, M. Lion’s Mane Mushroom, Hericium erinaceus (Bull.: Fr.) Pers. Suppresses H2O2-Induced Oxidative Damage and LPS-Induced Inflammation in HT22 Hippocampal Neurons and BV2 Microglia. Antioxidants 2019, 8, 261. [Google Scholar] [CrossRef] [Green Version]
  24. Cerletti, C.; Esposito, S.; Iacoviello, L. Edible Mushrooms and Beta-Glucans: Impact on Human Health. Nutrients 2021, 13, 2195. [Google Scholar] [CrossRef] [PubMed]
  25. Chemat, F.; Rombaut, N.; Sicaire, A.G.; Meullemiestre, A.; Fabiano-Tixier, A.S.; Abert-Vian, M. Ultrasound Assisted Extraction of Food and Natural Products. Mechanisms, Techniques, Combinations, Protocols and Applications. A Review. Ultrason. Sonochem. 2017, 34, 540–560. [Google Scholar] [CrossRef] [PubMed]
  26. Gonçalves, S.; Romano, A. Green approaches for the extraction of bioactives from natural sources for pharmaceutical applications. In Green Sustainable Process for Chemical and Environmental Engineering and Science; Inamuddin, A.M., Asiri, S.K., Eds.; Elsevier: Amsterdam, The Netherlands, 2021; pp. 1–410. [Google Scholar]
  27. Mansinhos, I.; Gonçalves, S.; Rodríguez-Solana, R.; Ordóñez-Díaz, J.L.; Moreno-Rojas, J.M.; Romano, A. Ultrasonic-Assisted Extraction and Natural Deep Eutectic Solvents Combination: A Green Strategy to Improve the Recovery of Phenolic Compounds from Lavandula pedunculata Subsp. Lusitanica (Chaytor) Franco. Antioxidants 2021, 10, 582. [Google Scholar] [CrossRef]
  28. Isidore, E.; Karim, H.; Ioannou, I. Extraction of Phenolic Compounds and Terpenes from Cannabis Sativa L. By-Products: From Conventional to Intensified Processes. Antioxidants 2021, 10, 942. [Google Scholar] [CrossRef] [PubMed]
  29. Carrera, C.; Aliaño-González, M.J.; Rodríguez-López, J.; Ferreiro-González, M.; Ojeda-Copete, F.; Barbero, G.F.; Palma, M. Optimization of an Ultrasound-Assisted Extraction Method for the Analysis of Major Anthocyanin Content in Erica australis Flowers. Molecules 2021, 26, 2884. [Google Scholar] [CrossRef] [PubMed]
  30. González-de-Peredo, A.V.; Vázquez-Espinosa, M.; Espada-Bellido, E.; Carrera, C.; Ferreiro-González, M.; Barbero, G.F.; Palma, M. Flavonol Composition and Antioxidant Activity of Onions (Allium Cepa L.) Based on the Development of New Analytical Ultrasound-Assisted Extraction Methods. Antioxidants 2021, 10, 273. [Google Scholar] [CrossRef] [PubMed]
  31. Aourach, M.; González-de-Peredo, A.V.; Vázquez-Espinosa, M.; Essalmani, H.; Palma, M.; Barbero, G.F. Optimization and Comparison of Ultrasound and Microwave-Assisted Extraction of Phenolic Compounds from Cotton-Lavender (Santolina chamaecyparissus L.). Agronomy 2021, 11, 84. [Google Scholar] [CrossRef]
  32. Aliaño-González, M.J.; Espada-Bellido, E.; Ferreiro-González, M.; Carrera, C.; Palma, M.; Ayuso, J.; Álvarez, J.Á.; Barbero, G.F. Extraction of Anthocyanins and Total Phenolic Compounds from Açai (Euterpe oleracea Mart.) Using an Experimental Design Methodology. Part 2: Ultrasound-Assisted Extraction. Agronomy 2020, 10, 326. [Google Scholar] [CrossRef] [Green Version]
  33. Aliaño-González, M.J.; Jarillo, J.A.; Carrera, C.; Ferreiro-González, M.; Álvarez, J.Á.; Palma, M.; Ayuso, J.; Barbero, G.F.; Espada-Bellido, E. Optimization of a Novel Method Based on Ultrasound-Assisted Extraction for the Quantification of Anthocyanins and Total Phenolic Compounds in Blueberry Samples (Vaccinium corymbosum L.). Foods 2020, 9, 1763. [Google Scholar] [CrossRef] [PubMed]
  34. Pop, A.; Fizeșan, I.; Vlase, L.; Rusu, M.E.; Cherfan, J.; Babota, M.; Gheldiu, A.-M.; Tomuta, I.; Popa, D.-S. Enhanced Recovery of Phenolic and Tocopherolic Compounds from Walnut (Juglans regia L.) Male Flowers Based on Process Optimization of Ultrasonic Assisted-Extraction: Phytochemical Profile and Biological Activities. Antioxidants 2021, 10, 607. [Google Scholar] [CrossRef]
  35. Lester, G.E.; Lewers, K.S.; Medina, M.B.; Saftner, R.A. Comparative Analysis of Strawberry Total Phenolics via Fast Blue BB vs. Folin–Ciocalteu: Assay Interference by Ascorbic Acid. J. Food Compos. Anal. 2012, 27, 102–107. [Google Scholar] [CrossRef] [Green Version]
  36. Chen, L.Y.; Cheng, C.W.; Liang, J.Y. Effect of Esterification Condensation on the Folin–Ciocalteu Method for the Quantitative Measurement of Total Phenols. Food Chem. 2015, 170, 10–15. [Google Scholar] [CrossRef]
  37. Giacosa, S.; Parpinello, G.P.; Río Segade, S.; Ricci, A.; Paissoni, M.A.; Curioni, A.; Marangon, M.; Mattivi, F.; Arapitsas, P.; Moio, L.; et al. Diversity of Italian Red Wines: A Study by Enological Parameters, Color, and Phenolic Indices. Food Res. Int. 2021, 143, 110277. [Google Scholar] [CrossRef] [PubMed]
  38. Alam, M.Z.; Alhebsi, M.S.R.; Ghnimi, S.; Kamal-Eldin, A. Inability of Total Antioxidant Activity Assays to Accurately Assess the Phenolic Compounds of Date Palm Fruit (Phoenix dactylifera L.). NFS J. 2021, 22, 32–40. [Google Scholar] [CrossRef]
  39. Romanet, R.; Sarhane, Z.; Bahut, F.; Uhl, J.; Schmitt-Kopplin, P.; Nikolantonaki, M.; Gougeon, R.D. Exploring the Chemical Space of White Wine Antioxidant Capacity: A Combined DPPH, EPR and FT-ICR-MS Study. Food Chem. 2021, 355, 129566. [Google Scholar] [CrossRef] [PubMed]
  40. Liu, Y.; Liu, H.-Y.; Xia, Y.; Guo, H.; He, X.-Q.; Li, H.; Wu, D.-T.; Geng, F.; Lin, F.-J.; Li, H.-B.; et al. Screening and Process Optimization of Ultrasound-Assisted Extraction of Main Antioxidants from Sweet Tea (Lithocarpus litseifolius [Hance] Chun). Food Biosci. 2021, 43, 101277. [Google Scholar] [CrossRef]
  41. Yang, J.; Chen, J.; Hao, Y.; Liu, Y. Identification of the DPPH Radical Scavenging Reaction Adducts of Ferulic Acid and Sinapic Acid and Their Structure-Antioxidant Activity Relationship. LWT 2021, 146, 111411. [Google Scholar] [CrossRef]
  42. Quy Huong, D.; van Bay, M.; Cam Nam, P. Antioxidant Activity of Thiourea Derivatives: An Experimental and Theoretical Study. J. Mol. Liq. 2021, 340, 117149. [Google Scholar] [CrossRef]
  43. Castañeda-Valbuena, D.; Ayora-Talavera, T.; Luján-Hidalgo, C.; Álvarez-Gutiérrez, P.; Martínez-Galero, N.; Meza-Gordillo, R. Ultrasound Extraction Conditions Effect on Antioxidant Capacity of Mango By-Product Extracts. Food Bioprod. Process. 2021, 127, 212–224. [Google Scholar] [CrossRef]
  44. Aboagye, G.; Tuah, B.; Bansah, E.; Tettey, C.; Hunkpe, G. Comparative Evaluation of Antioxidant Properties of Lemongrass and Other Tea Brands. Sci. Afr. 2021, 11, e00718. [Google Scholar] [CrossRef]
  45. Li, C.; Mora, L.; Toldrá, F. Characterization of Antioxidant Efficacy of Peptide Extracts as Affected by Peptide Interactions during the Ripening of Spanish Dry-Cured Ham. Food Res. Int. 2021, 147, 110525. [Google Scholar] [CrossRef]
  46. Prakash Maran, J.; Manikandan, S.; Thirugnanasambandham, K.; Vigna Nivetha, C.; Dinesh, R. Box-Behnken Design Based Statistical Modeling for Ultrasound-Assisted Extraction of Corn Silk Polysaccharide. Carbohydr. Polym. 2013, 92, 604–611. [Google Scholar] [CrossRef] [PubMed]
  47. González-de-Peredo, A.V.; Vázquez-Espinosa, M.; Carrera, C.; Espada-Bellido, E.; Ferreiro-González, M.; Barbero, G.F.; Palma, M. Development of a Rapid UHPLC-PDA Method for the Simultaneous Quantification of Flavonol Contents in Onions (Allium cepa L.). Pharmaceuticals 2021, 14, 310. [Google Scholar] [CrossRef] [PubMed]
  48. Vázquez-Espinosa, M.; de Peredo, A.V.G.; Ferreiro-González, M.; Barroso, C.G.; Palma, M.; Barbero, G.F.; Espada-Bellido, E. Optimizing and Comparing Ultrasound- and Microwave-Assisted Extraction Methods Applied to the Extraction of Antioxidant Capsinoids in Peppers. Agronomy 2019, 9, 633. [Google Scholar] [CrossRef] [Green Version]
  49. González-De-Peredo, A.V.; Vázquez-Espinosa, M.; Espada-Bellido, E.; Ferreiro-González, M.; Carrera, C.; Palma, M.; Álvarez, J.; Barbero, G.F.; Ayuso, J. Optimization of Analytical Ultrasound-Assisted Methods for the Extraction of Total Phenolic Compounds and Anthocyanins from Sloes (Prunus spinosa L.). Agronomy 2020, 10, 966. [Google Scholar] [CrossRef]
  50. Kała, K.; Krakowska, A.; Szewczyk, A.; Ostachowicz, B.; Szczurek, K.; Fijałkowska, A.; Muszyńska, B. Determining the Amount of Potentially Bioavailable Phenolic Compounds and Bioelements in Edible Mushroom Mycelia of Agaricus bisporus, Cantharellus cibarius, and Lentinula edodes. Food Chem. 2021, 352, 129456. [Google Scholar] [CrossRef]
  51. Sezer, Y.Ç.; Süfer, Ö.; Sezer, G. Extraction of Phenolic Compounds from Oven and Microwave Dried Mushrooms (Agaricus bisporus and Pleurotus ostreatus) by Using Methanol, Ethanol and Aceton as Solvents. Indian J. Pharm. Educ. Res. 2017, 51, S393–S397. [Google Scholar] [CrossRef] [Green Version]
  52. Carrera, C.; Pastol, J.; Setyaningsih, W.; Ruiz-Rodríguez, A.; Ferreiro-González, M.; Barbero, G.F.; Palma, M. Optimization by Means of Chemometric Tools of an Ultrasound-Assisted Method for the Extraction of Betacyanins from Red Dragon Fruit (Hylocereus polyrhizus). Agronomy 2021, 11, 1053. [Google Scholar] [CrossRef]
  53. Cui, F.-J.; Qian, L.-S.; Sun, W.-J.; Zhang, J.-S.; Yang, Y.; Li, N.; Zhuang, H.-N.; Wu, D. Ultrasound-Assisted Extraction of Polysaccharides from Volvariella volvacea: Process Optimization and Structural Characterization. Molecules 2018, 23, 1706. [Google Scholar] [CrossRef] [PubMed] [Green Version]
  54. Xu, D.-P.; Zheng, J.; Zhou, Y.; Li, Y.; Li, S.; Li, H.-B. Extraction of Natural Antioxidants from the Thelephora ganbajun Mushroom by an Ultrasound-Assisted Extraction Technique and Evaluation of Antiproliferative Activity of the Extract against Human Cancer Cells. Int. J. Mol. Sci. 2016, 17, 1664. [Google Scholar] [CrossRef] [Green Version]
  55. Gogoi, P.; Chutia, P.; Singh, P.; Mahanta, C.L. Effect of Optimized Ultrasound-Assisted Aqueous and Ethanolic Extraction of Pleurotus citrinopileatus Mushroom on Total Phenol, Flavonoids and Antioxidant Properties. J. Food Process. Eng. 2019, 42, e13172. [Google Scholar] [CrossRef]
  56. Umaña, M.; Eim, V.; Garau, C.; Rosselló, C.; Simal, S. Ultrasound-Assisted Extraction of Ergosterol and Antioxidant Components from Mushroom by-Products and the Attainment of a β-Glucan Rich Residue. Food Chem. 2020, 332, 127390. [Google Scholar] [CrossRef] [PubMed]
  57. Domínguez-Fernández, M.; Irigoyen, Á.; de los Angeles Vargas-Alvarez, M.; Ludwig, I.A.; de Peña, M.-P.; Cid, C. Influence of Culinary Process on Free and Bound (Poly)Phenolic Compounds and Antioxidant Capacity of Artichokes. Int. J. Gastron. Food Sci. 2021, 25, 100389. [Google Scholar] [CrossRef]
  58. Amirullah, N.A.; Zainal Abidin, N.; Abdullah, N.; Manickam, S. Application of Ultrasound towards Improving the Composition of Phenolic Compounds and Enhancing in Vitro Bioactivities of Pleurotus pulmonarius (Fr.) Quél Extracts. Biocatal. Agric. Biotechnol. 2021, 31, 101881. [Google Scholar] [CrossRef]
  59. Fernandes, Â.; Barreira, J.C.M.; Antonio, A.L.; Oliveira, M.B.P.P.; Martins, A.; Ferreira, I.C.F.R. Feasibility of Electron-Beam Irradiation to Preserve Wild Dried Mushrooms: Effects on Chemical Composition and Antioxidant Activity. Innov. Food Sci. Emerg. Technol. 2014, 22, 158–166. [Google Scholar] [CrossRef]
  60. Marçal, S.; Sousa, A.S.; Taofiq, O.; Antunes, F.; Morais, A.M.M.B.; Freitas, A.C.; Barros, L.; Ferreira, I.C.F.R.; Pintado, M. Impact of Postharvest Preservation Methods on Nutritional Value and Bioactive Properties of Mushrooms. Trends Food Sci. Technol. 2021, 110, 418–431. [Google Scholar] [CrossRef]
  61. Gąsecka, M.; Siwulski, M.; Magdziak, Z.; Budzyńska, S.; Stuper-Szablewska, K.; Niedzielski, P.; Mleczek, M. The Effect of Drying Temperature on Bioactive Compounds and Antioxidant Activity of Leccinum scabrum (Bull.) Gray and Hericium Erinaceus (Bull.) Pers. J. Food Sci. Technol. 2019, 57, 2. [Google Scholar] [CrossRef] [PubMed] [Green Version]
  62. Yılmaz, F.M.; Zungur Bastıoğlu, A. Production of Phenolic Enriched Mushroom Powder as Affected by Impregnation Method and Air Drying Temperature. LWT 2020, 122, 109036. [Google Scholar] [CrossRef]
Figure 1. Results from the analysis of mushroom extracted by UAE using different % MeOH:H2O by (A) Folin–Ciocalteu method (milligrams of gallic acid equivalent/gram of sample), (B) DPPH method (milligrams of Trolox equivalent/gram of sample), and (C) ABTS method (milligrams of Trolox equivalent/gram of sample).
Agronomy 12 01812 g001
Figure 2. Results from the analysis of mushroom extracted by UAE using different extraction temperatures by (A) Folin–Ciocalteu method (milligrams of gallic acid equivalent/gram of sample), (B) DPPH method (milligrams of Trolox equivalent/gram of sample), and (C) ABTS method (milligrams of Trolox equivalent/gram of sample).
Agronomy 12 01812 g002
Figure 3. Pareto chart based on the BBD–RSM design representing the extraction of total phenolic compounds from mushroom samples.
Agronomy 12 01812 g003
Figure 4. Pareto chart obtained from the BBD–RSM design of the antioxidant capacity of the mushroom sample extracts according to the DPPH method.
Agronomy 12 01812 g004
Figure 5. Pareto chart generated based on the BBD–RSM design of the antioxidant capacity of the mushroom samples according to the ABTS method.
Agronomy 12 01812 g005
Figure 6. 3D–Response Surface graphic of the global response according to varying MeOH percentages in the extraction solvent and extraction temperature levels.
Agronomy 12 01812 g006
Figure 7. Mushroom samples extracted (n = 3) under global optimum conditions using different extraction times and analyzed by (A) Folin–Ciocalteu (milligrams of gallic acid equivalent/gram of sample), (B) DPPH method (milligrams of Trolox equivalent/gram of sample), and (C) ABTS method (milligrams of Trolox equivalent/gram of sample).
Agronomy 12 01812 g007
Table 1. Results from the BBD–RSM for Total Phenolic Compounds.
VariableSum of SquaresF-Valuep-Value
MeOH percentage1.8213.130.00
Temperature0.010.040.84
Amplitude0.000.000.95
Cycle0.010.110.75
Ratio0.604.350.05
MeOH percentage21.238.840.01
MeOH percentage:Temperature0.261.910.18
MeOH percentage:Amplitude0.342.440.13
MeOH percentage:Cycle0.161.120.30
MeOH percentage:Ratio0.000.000.99
Temperature21.279.170.01
Temperature:Amplitude0.151.060.31
Temperature:Cycle0.050.370.55
Temperature:Ratio0.100.730.40
Amplitude20.010.040.84
Amplitude:Cycle0.090.660.42
Amplitude:Ratio0.040.270.61
Cycle20.040.290.60
Cycle:Ratio1.7312.480.00
Ratio20.010.040.84
Error total3.47
Table 2. Results from the BBD–RSM for Antioxidant Activity (DPPH).
VariableSum of SquaresF-Valuep-Value
% MeOH0.349.300.01
Temperature0.000.050.83
Amplitude0.082.110.16
Cycle0.000.010.92
Ratio0.010.380.54
% MeOH:% MeOH0.000.001.00
% MeOH:Temperature0.041.180.29
% MeOH:Amplitude0.000.010.92
% MeOH:Cycle0.071.920.18
% MeOH:Ratio0.010.190.66
Temperature:Temperature0.040.990.33
Temperature:Amplitude0.040.980.33
Temperature:Cycle0.051.430.24
Temperature:Ratio0.010.170.68
Amplitude:Amplitude0.041.000.33
Amplitude:Cycle0.000.090.76
Amplitude:Ratio0.000.120.73
Cycle:Cycle0.020.590.45
Cycle:Ratio0.041.010.32
Ratio:Ratio0.246.550.02
Error total0.92
Table 3. Results from the BBD–RSM for Antioxidant Activity (ABTS).
VariableSum of SquaresF-Valuep-Value
% MeOH19.770.220.64
Temperature678.477.700.01
Amplitude14.560.170.69
Cycle46.730.530.47
Ratio38.290.430.52
% MeOH:% MeOH1019.8711.580.00
% MeOH:Temperature0.080.000.98
% MeOH:Amplitude0.400.000.95
% MeOH:Cycle189.512.150.15
% MeOH:Ratio62.900.710.41
Temperature:Temperature157.061.780.19
Temperature:Amplitude90.861.030.32
Temperature:Cycle478.415.430.03
Temperature:Ratio2.780.030.86
Amplitude:Amplitude85.150.970.33
Amplitude:Cycle88.801.010.32
Amplitude:Ratio3.710.040.84
Cycle:Cycle443.505.040.03
Cycle:Ratio125.701.430.24
Ratio:Ratio252.112.860.10
Error total2201.73
Table 4. Repeatability and intermediate precision of the global optimal conditions established in the study with regard to total phenolic compounds content and antioxidant capacity of the extracts obtained by UAE from mushroom samples.
Repeatability 1Intermediate Precision 2
Folin–CiocalteuDPPHABTSFolin–CiocalteuDPPHABTS
Average11.3710.1252.7511.6110.7750.93
SD *0.330.391.730.540.492.48
RSD **2.923.853.284.654.554.88
1 Repeatability (n = 10); 2 Intermediate precision (n = 30); * Standard deviation; ** Relative standard deviation.
Table 5. Results from applying the developed method to wild and commercial mushroom samples.
Wild Species
Scientific NameLocationFolin–Ciocalteu *DPPH **ABTS **
Lactarius deliciosus“Dehesa de las Yeguas”, Puerto Real, Cadiz (Spain)11.7910.7619.29
Lactarius rugatus“Dehesa de las Yeguas”, Puerto Real, Cadiz (Spain)11.9910.7515.92
Russula cyanoxanta“Palancar,” Los Barrios, Cadiz (Spain)11.4510.7130.93
Amanita caesarea“Palancar”, Los Barrios, Cadiz (Spain)10.8610.4713.71
Lactarius deliciosus“Paterna road”, Puerto Real, Cadiz (Spain)11.8110.4817.17
Lactarius vinosus“Paterna road”, Puerto Real, Cadiz (Spain)12.5410.7725.81
Hydnum rufescens“Valdeinfierno”, Los Barrios, Cadiz (Spain)11.4710.5614.74
Cantharellus lutescensCortes de la Frontera, Málaga (Spain)20.2318.2820.50
Amanita caesarea“Chapatal”, San Roque, Cadiz (Spain)10.8610.4713.71
Russula cianoxanta (young)“Dehesa de las Yeguas”, Puerto Real, Cadiz (Spain)11.4110.6822.85
Russula cianoxanta (adult)“Dehesa de las Yeguas”, Puerto Real, Cadiz (Spain)11.8510.5115.84
Suillus bovinus“Dehesa de las Yeguas”, Puerto Real, Cadiz (Spain)11.3311.2037.45
Lactarius vinosus“Dehesa de las Yeguas”, Puerto Real, Cadiz (Spain)11.7310.8220.76
Cantharellus cibariusSanta Marina, Asturias (Spain)11.7010.6822.38
Lepista nudaBouachem (Morocco)11.8310.6026.07
Ramaria flavaBouachem (Morocco)11.7610.5213.29
Hydnum repandumBouachem (Morocco)11.8410.709.58
Infundibulicybe geotropa“Sierra de Huetor”, Granada (Spain)11.8010.4725.28
Lepista nuda“Puerto de la Mora”, Granada (Spain)12.2510.9034.86
Hygrophorus gliocyclus“Puerto de la Mora”, Granada (Spain)12.1510.3214.72
Agaricus silvícola“Sierra Carbonales”, Granada (Spain)11.3910.6847.00
Agaricus impudicus 1“Puerto de la Mora”, Granada (Spain)11.5411.0634.64
Agaricus impudicus 2“Sierra Alfaguara”, Granada (Spain)11.6211.1135.43
Tricholoma equestre 1“Sierra carbonales”, Granada (Spain)11.9110.7225.02
Tricholoma equestre 2“Paraje 7 Estrellas”, Granada (Spain)13.5110.8717.78
Lactarius deliciosus“Sierra Carbonales”, Granada (Spain)12.0110.8219.66
Lactarius deliciosus“Sierra Alfaguara”, Granada (Spain)12.3810.7722.86
Lactarius semisanguifluus“Sierra Alfaguara”, Granada (Spain)11.8310.8725.52
Lactarius sanguifluus“Sierra Alfaguara”, Granada (Spain)12.1210.7616.36
Lactarius semisanguifluus“Puerto de la Mora”, Granada (Spain)11.8210.6320.46
Lactarius deliciosus“Pinar Santillo”, Valverde del Camino, Huelva (Spain)11.6310.5926.39
Lactarius deliciosus“Finca Juan Ferrer, Finca el Tunel”, Huelva (Spain)12.3910.7620.91
Lactarius deliciosus“Pinar San Walabonso”, Huelva (Spain)12.1410.6322.70
Lactarius deliciosus“Pinar Raboconejo”, Huelva (Spain)11.6210.6923.65
Macrolepiota procera“Sierra Guillimona”, Almería (Spain)11.5310.8231.17
Commercial Species
Scientific NameSupermarketFolin–Ciocalteu *DPPH **ABTS **
Agaricus brunnescensLIDL12.0411.0442.07
Hypsizygus tessulatusLIDL11.5610.6729.59
Hypsizygus marmoreusLIDL13.4710.8928.27
Pleurotus eryngiiLIDL12.0210.6343.14
Pleurotus ostreatusLIDL11.2810.5036.72
Agaricus bisporusLIDL12.2410.9441.59
Agaricus bisporusMercadona11.9310.8844.13
Agaricus brunnescensMercadona12.3611.0444.58
Pleurotus ostreatusMercadona12.3910.8937.48
Agaricus brunnescensCarrefour12.6210.9439.54
Hypsizygus marmoreusCarrefour12.1110.8930.81
Lentinula edodesCarrefour11.6810.9225.02
Agaricus bisporusCarrefour13.1210.6433.95
Pleurotus ostreatusCarrefour12.3610.7029.67
Agaricus bisporusDia12.5111.0841.56
Pleurotus ostreatusDia12.1810.7538.69
* Folin–Ciocalteu results expressed as mg gallic acid equivalent/g sample and ** DPPH and ABTS results expressed as mg Trolox equivalent/g sample.
Publisher’s Note: MDPI stays neutral with regard to jurisdictional claims in published maps and institutional affiliations.

