Article

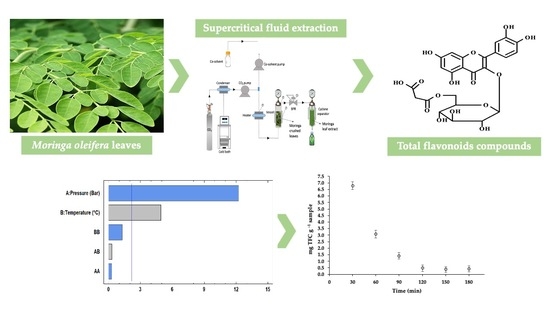
Evaluation of the Effect of Different Co-Solvent Mixtures on the Supercritical CO2 Extraction of the Phenolic Compounds Present in Moringa oleifera Lam. Leaves

by
Beatriz Juliana Yerena-Prieto
1,2,
Monserrat Gonzalez-Gonzalez
1,2,
Miguel Ángel García-Alvarado
2,
Lourdes Casas
3,
Miguel Palma
1,
Guadalupe del Carmen Rodríguez-Jimenes
2,*,
Gerardo F. Barbero
2,* and
Cristina Cejudo-Bastante
3
1
Department of Analytical Chemistry, Faculty of Sciences, Agrifood Campus of International Excellence (ceiA3), IVAGRO, University of Cadiz, 11510 Puerto Real, Spain
2
Unidad de Investigación y Desarrollo en Alimentos (UNIDA), Campus Instituto Tecnológico de Veracruz, Tecnológico Nacional de México, Avenue Miguel Ángel de Quevedo 2779, Veracruz 91860, Mexico
3
Department of Chemical Engineering and Food Technology, Faculty of Sciences, IVAGRO, University of Cadiz, 11510 Puerto Real, Spain
*
Authors to whom correspondence should be addressed.
Agronomy 2022, 12(6), 1450; https://doi.org/10.3390/agronomy12061450
Submission received: 30 May 2022 / Revised: 12 June 2022 / Accepted: 15 June 2022 / Published: 17 June 2022
(This article belongs to the Special Issue Extraction and Analysis of Bioactive Compounds in Crops)

Abstract

:
Supercritical fluid extraction (SFE), using CO2, is a novel, sustainable and very efficient technique for the recovery of highly apolar compounds. However, the recovery of phenolic compounds requires the use of different co-solvent combinations such as water and ethanol to enhance the recovery of these compounds through the optimization of a number of variables. In this sense, the effect of pressure (100, 150 and 200 bar), temperature (50, 65 and 80 °C), extraction time (30, 60, 90, 120, 150 and 180 min) and the effect of the different percentages of ethanol and water as co-solvents on the composition and phenolic content of moringa leaf extracts were evaluated. Six major flavonoids were identified by ultra-high-performance liquid chromatography coupled to a quadrupole-time-of-flight mass spectrometer (UHPLC-Q-ToF-MS). Pressure and temperature had a significant effect on the phenolic composition of the extracts, as well as on their concentrations. The highest concentration of total flavonoids compounds (TFCs) was obtained by using a mixture of CO2 and water of 50:50 (v/v) at 100 bar, at 65 °C after a 120 min extraction time that produced a concentration of 11.66 mg ± 0.02 mg TFC g−1 sample, which corresponds to 89.0% of the total flavonoids of the sample, obtained by exhaustive extraction.

Graphical Abstract

1. Introduction

Moringa oleifera Lam., commonly known as moringa, belongs to the Moringaceae family of which there are 13 different varieties, with Moringa oleifera Lam. being the most frequently cultivated because of its rapid growth and its good adaptability to any soil [1]. It is native to the Himalayan mountain ranges and is now cultivated in numerous regions such as India, Africa, South and Central America, Mexico, Hawaii and throughout Asia and Southeast Asia [2]. Moringa leaves are of special interest because of their medical and pharmaceutical applications based on their high nutritional value as a rich source of proteins, vitamins, beta-carotene, amino acids and phenolic compounds [1,3,4]. Phenolic compounds are secondary metabolites present in plants and several studies have demonstrated the beneficial relationship between their consumption and a lower risk of cardiovascular and neurodegenerative disorders thanks to their diverse molecular activities: antimicrobial [5], anti-inflammatory [6], antidiabetic [7,8], antioxidant [9,10] and anticarcinogenic [11]. It is therefore of great importance to broaden our knowledge on their phenolic compound content and to determine the best conditions for their extraction and purification so that they can be subsequently applied in different fields. These compounds have already been obtained by different conventional techniques, such as maceration, or other non-conventional techniques such as microwave-assisted extraction (MAE) [12], ultrasound-assisted extraction (UAE) [13] or pressurized liquid extraction (PLE) [14].
However, in recent years, supercritical fluid extraction (SFE) has attracted the attention of the food, pharmaceutical and cosmetic industries because of its numerous advantages. Unlike conventional techniques, SFE uses a supercritical fluid (SF), which can be any substance under thermodynamic pressure and temperature levels above its critical point, i.e., conditions under which a gas neither condenses as the temperature decreases isobarically nor as the pressure increases isothermally [15]. It has been proven that SFE decreases interfacial tension and viscosity, which enhances the diffusion in the system and fosters the mass transfer between the fluid and the solute [12,16]. SFs present physicochemical properties that are midway between a liquid and a gas, which confer them with the penetration capacity of gases and the density of liquids [17]. These properties make them a highly valuable alternative for the extraction of bioactive compounds, since unlike conventional solvents neither drastic temperature changes nor the use of additional solvents are required to enhance their extraction capacity. Thus, CO2 is generally the SF most often used to extract phenolic compounds [18,19], since its critical temperature (31.1 °C) and pressure (73.8 bar) are quite easily reached. In addition, CO2 is non-toxic, non-corrosive, inexpensive, non-flammable, environmentally friendly and can be easily removed from the extracted materials as it expands when under regular ambient conditions [20]. Previous studies have reported that pressures and temperatures from 100 to 400 bar and 55 to 100 °C, respectively, are feasible for the extraction of phenolic compounds from different matrices such as Mangifera indica [18], Olea europaea [21], Moringa oleifera [22,23] or mango leaves [24].
The solutes generally exhibit highly marked variations in their fluid solubility depending on the operating pressure and temperature conditions. In this sense, this study has focused on determining the different results obtained as pressure, temperature, extraction time and different co-solvents are modified. The combined effect of pressure, temperature and extraction time plays an important role on the stability and SFE yields of the compounds of interest. Furthermore, since the SFE yields of phenolic compounds are known to be low, they have been improved by adding co-solvents with a higher polarity. The implementation of enhanced solvent extraction (ESE) using co-solvent mixtures has proven to be effective for this purpose [20]. Among the high-pressure extraction techniques, ESE stands out as a selective process for the extraction of polyphenols that also reduces the use of organic solvents, the extraction time and the concentration steps that may cause the degradation of the antioxidant compounds [18,23,25]. On the other hand, the use of co-solvent contributes to an augmentation of the magnitude of dipole–dipole, induced dipole–dipole and induced dipole–induced dipole interactions between the solute and the solvent molecules, which results in an overall enhancement of solubility [26]. Nevertheless, the composition of moringa extracts varies with the extraction solvent’s polarity, which, in turn, results in the extraction of compounds with a different polarity, such as organic acids, phenolic acids, lignans or flavonoids, which are compounds of an average polarity [27,28]. This leads to the optimization of different variables, not only regarding the specific CO2:co-solvent ratio, but also of the alternatives to the composition of such a co-solvent, which may lead to the convenience of using ternary mixtures. In this sense, in this study different percentages of water in CO2 and mixtures of water with ethanol were used, because they are low-toxicity solvents compared to methanol or other organic solvents and they are considered generally recognized as safe (GRAS) solvents, which are acceptable in food and pharmaceutical applications. Despite the great potential demonstrated by SFE, only a few studies have been described in the literature focused on the composition of the phenolic compounds present in moringa leaves, but not on optimizing the extraction and quantification of individual compounds by SFE. Therefore, since there are no studies where the phenolic quantification of supercritical extracts from moringa leaves has been investigated, the objective of this work is to determine the optimum pressure, temperature and extraction time values for the SFE of phenolic compounds from moringa leaves.

2. Materials and Methods

2.1. Biological Material

The fresh moringa leaves for the experiments were grown at the Instituto Tecnológico Nacional de México campus Veracruz (Veracruz City, Veracruz, Mexico). The dust was washed off the leaves using distilled water, the leaves were then drained in a colander and the excess water was removed using paper tissue. The leaves were then stored in 150 g batches, wrapped in paper and placed in ziplock bags until fluidized-bed drying, which was carried out using an Apex Model SSE65 fluidized-bed dryer (Veracruz, Mexico). For this purpose, 150 g of fresh moringa leaves were placed in the drying chamber at a temperature of 55 °C and a dry air flow was applied at 0.5 m/s for 90 min. Finally, the dried moringa leaves were stored in vacuum laminated polyethylene bags at (−20 °C) until the extraction process was to be carried out.

2.2. Reagents and Solvents

The ethanol was procured from Panreac Química, S.A.U. (Castellar del Vallés, Barcelona, Spain) and the CO2 (99.995%) was supplied by Abello-Linde S.A. (Barcelona, Spain). Milli-Q water was obtained using a Millipore water purification system (Bedford, MA, USA). The standard used for the quantification of the identified flavonoids was quercetin 3-glucoside (Q3GLU) purchased from Sigma-Aldrich Chemical Co. (St. Louis, MO, USA).

2.3. Selecting the Co-Solvent

The first step to carry out the SFE process involved selecting the appropriate co-solvent and the appropriate proportions that would allow TFCs to be obtained. For this purpose, the following percentages were used: 25, 50, 75 and 100% for water and ethanol, as well as a ternary mixture of CO2 (50%), ethanol (10%) and water (40%) in order to enhance the extractions. The percentages employed are expressed with respect to a constant CO2 flow rate (20 mL/min). The pressure and temperature were set at intermediate levels: 150 bar and 65 °C, respectively. Each experiment was conducted in duplicate and the TFC concentrations were measured by chromatography, as described later in Section 2.6.

2.4. Moringa Leaf Characterization

Once the co-solvent and the appropriate concentration had been established, an exhaustive extraction was carried out for the concentration of extractable TFCs. Such extraction consisted in placing approximately 5 g of sample in 50 mL of co-solvent. The pressure and temperature conditions were set at the intermediate values already mentioned in Section 2.3. and the extraction time was set for two hours. At the end of this period, the extract obtained was collected and the TFC concentration was measured. The leaves were re-extracted two more times under the same conditions until the compounds of interest were totally depleted. Finally, the concentration of the extractable TFCs was calculated as the sum of the concentrations from each extraction step. The results were expressed in mg TFC g−1 sample and based on the TFCs obtained performance values were calculated. All the experiments were conducted in duplicate.

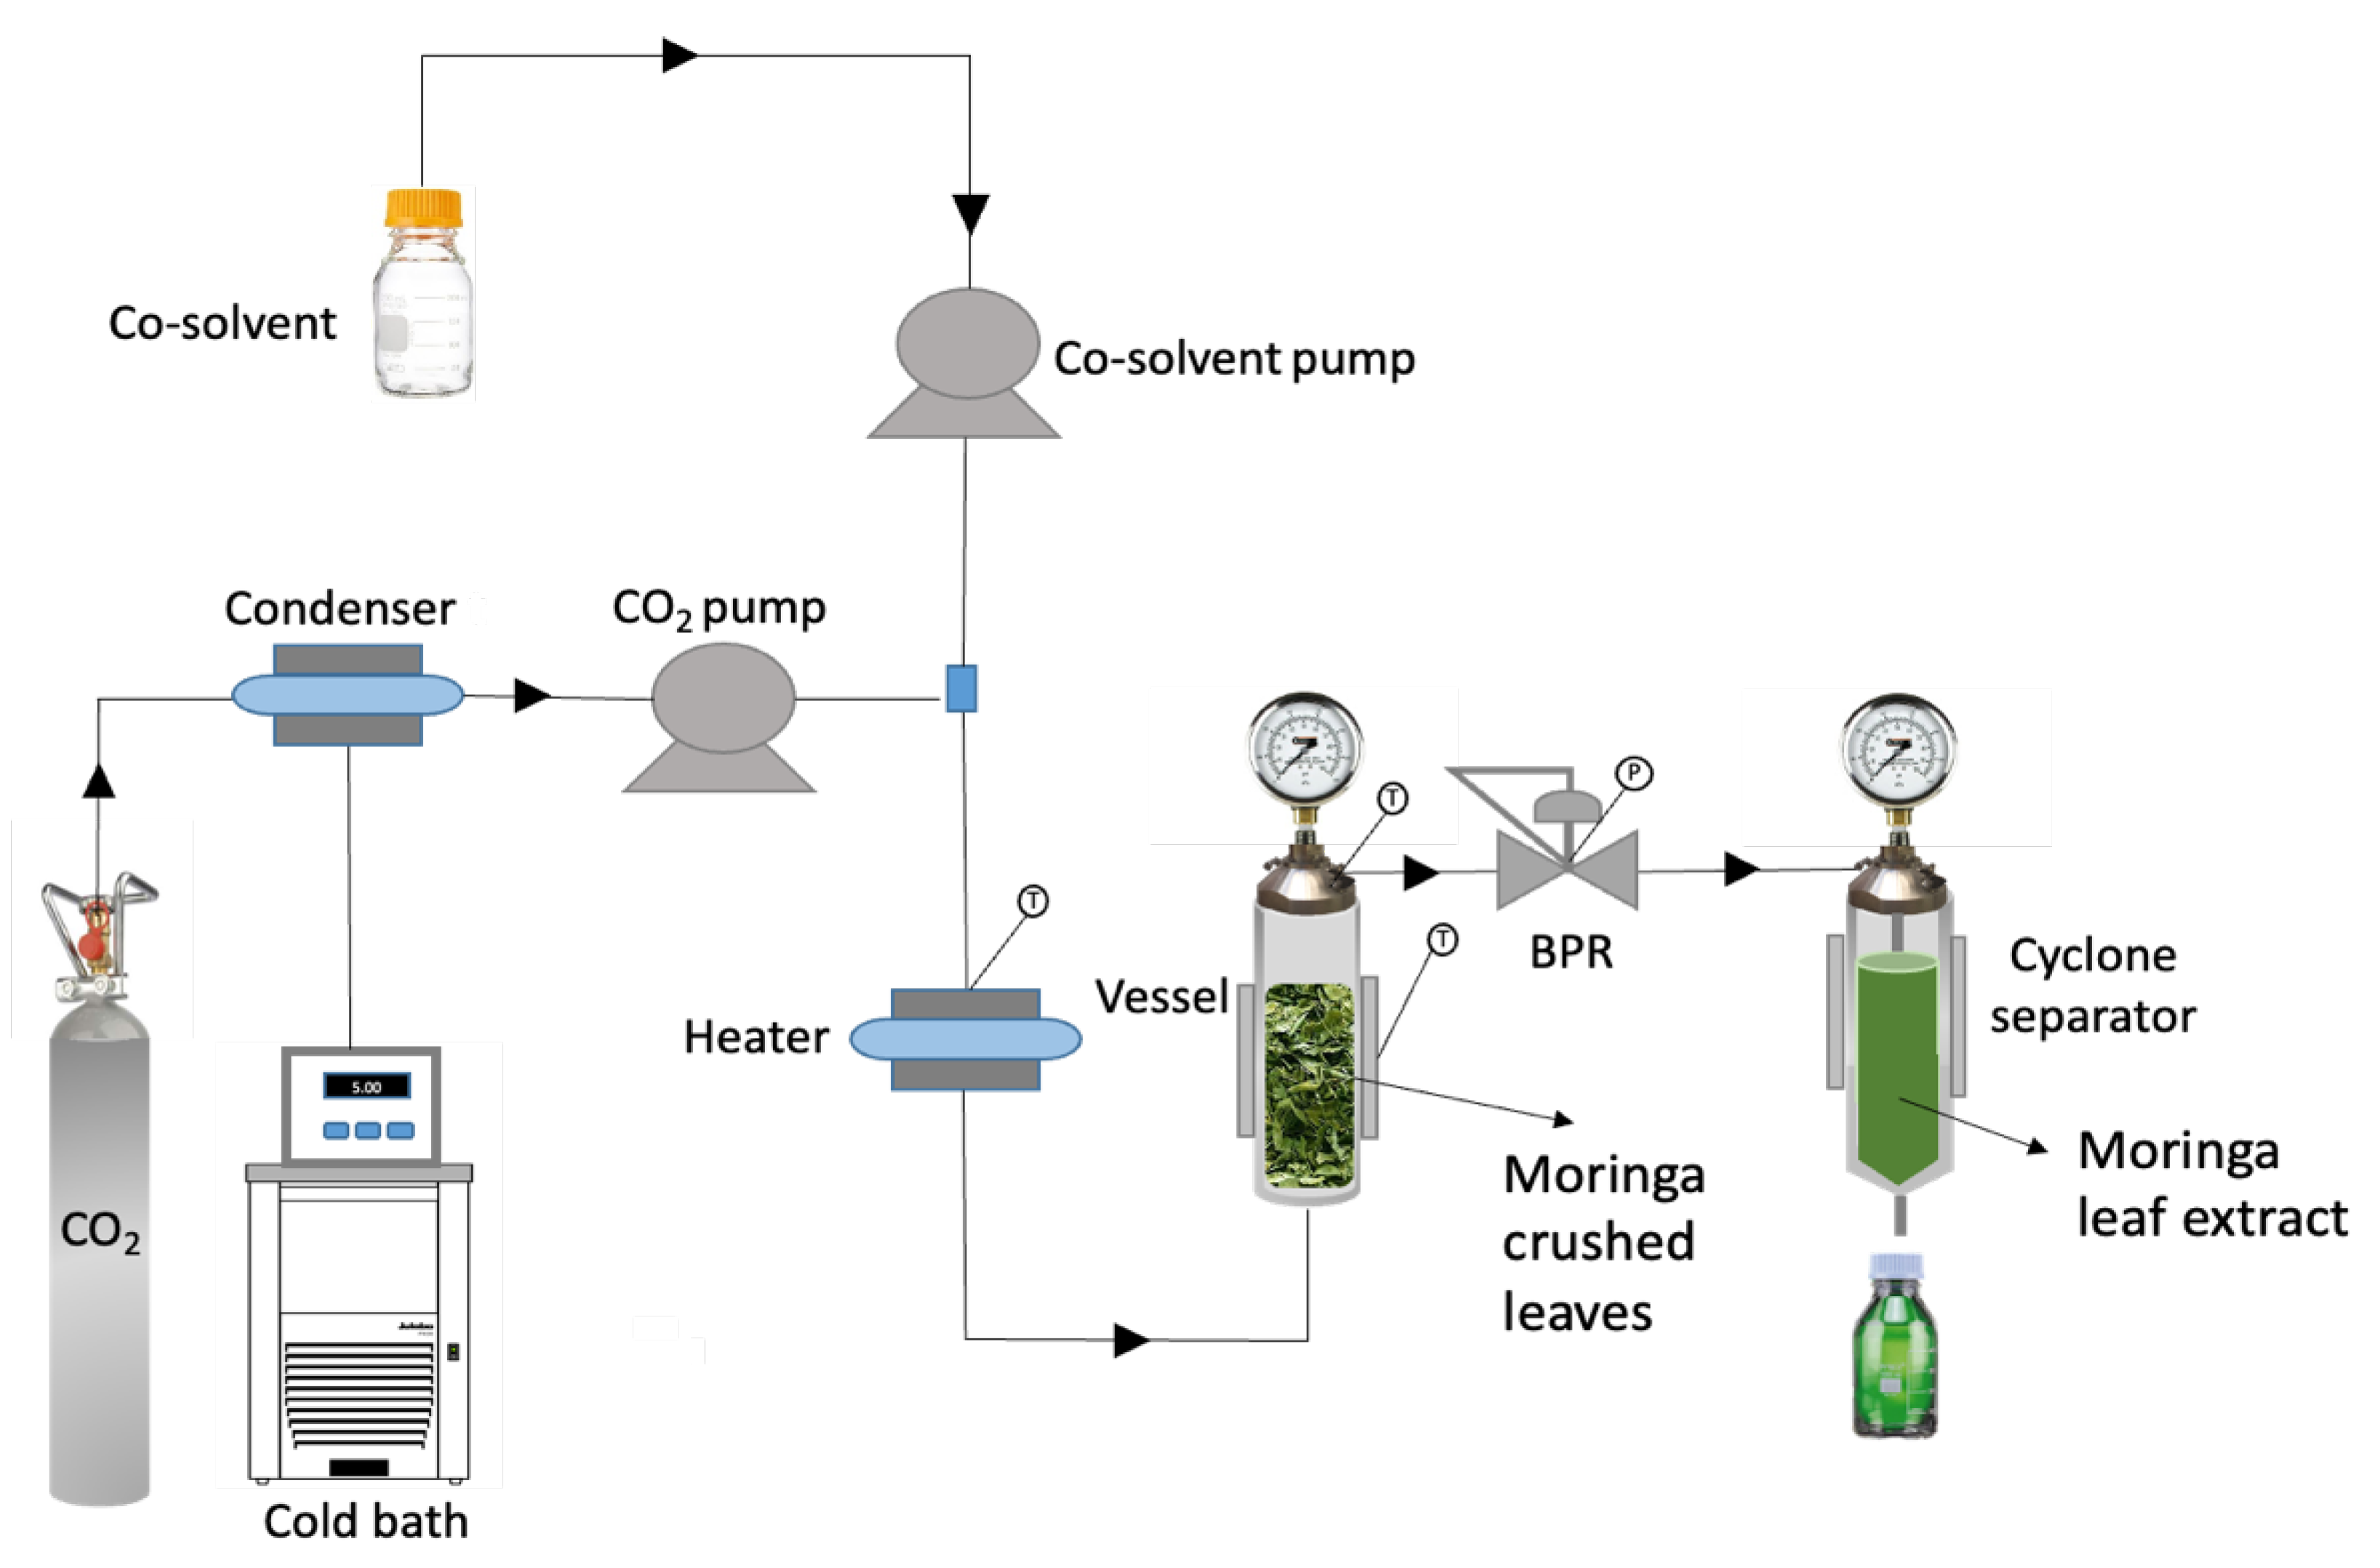
2.5. High-Pressure Extraction Procedure

The extractions were carried out using a supercritical extraction plant by Thar Technologies (Pittsburg, PA, USA) SF100 model, whose flow diagram is shown in Figure 1.
The equipment consisted of a 100 mL extraction vessel with a thermal jacket, two high-pressure pumps with a maximum flow rate of 50 g/min for carbon dioxide (CO2) and co-solvent and a cyclone separator (100 mL). The extraction process consisted in packing 5 g of dried moringa leaves in the extraction vessel, which had metal filters at the top and bottom to avoid any clogging of the system that might cause drastic pressure changes; the cell containing the sample was preheated according to the conditions described for the experimental design. Once the CO2 reached its supercritical point after being heated up to the desired temperature in a heating bath and delivered into the extractor vessel, the co-solvent was pumped into the extractor simultaneously with the CO2 at the desired ratio, so that the required proportion was reached before the static extraction period. The extractions were performed in batch mode using a CO2:co-solvent mixture. The SFEs were initially performed using a dynamic time of 10 min to equilibrate the system followed by a static extraction time of 90 min. This second period was followed by an expansion step where the pressure was reduced and the temperature was adjusted. Finally, the extracts were collected into amber colored flasks using a cyclone separator and stored in the absence of light at −20 °C to avoid the degradation of the bioactive compounds until their analysis by UHPLC.
The experimental design consisted in analyzing the influence of pressure (P) and temperature (T) since most of the studies that addressed the extraction of bioactive compounds, specifically phenolic compounds and flavonoids, had concentrated on temperatures within the range 40–80 °C to avoid the degradation of thermally labile compounds [18,21,23,24]. Aldditionally, a pressure range of 100 to 200 bar was used in agreement with previous studies that had intended to obtain phenolic compounds from different plant matrices [18,29]. The conditions selected to carry out the study were: 100, 150 and 200 bar and 50, 65 and 80 °C, respectively, resulting in 9 P and T configurations. Finally, based on the optimal P and T values obtained from the ANOVA, an extraction kinetic study was performed for 180 min while measuring the TFC concentrations every 30 min in order to determine the optimal extraction time while avoiding the degradation of the compounds of interest because of an excessive exposure time. All the extracts were collected in amber vials and stored at −20 °C to prevent any degradation of the compounds of interest until their UHPLC analysis.

2.6. Identification of Flavonoids by UHPLC-Q-ToF-MS

The identification of the phenolic compounds was performed by ultra-high-performance liquid chromatography (UHPLC) coupled to a quadrupole-time-of-flight mass spectrometer (Q-ToF-MS) (Synapt G2, Waters Corp., Milford, MA, USA). The method employed was the one described by Yerena-Prieto et al. [13], using full scan mode (m/z = 100–600). The following compounds (Figure S1) were individually identified based on their retention time and m/z [M − H] molecular weight: apigenin glucoside isomer 1 (AP1), 432.4021; apigenin glucoside isomer 2 (AP2), 432.4021; quercetin 3-O-glucoside (Q3GLU), 463.4038; quercetin malonyl glucoside (QMGLU), 549.4083; quercetin acetyl glucoside (QAGLU), 505.4038; kaempferol 3-O-glucoside (K3GLU), 447.0931 and kaempferol malonyl glucoside (KMGLU), 534.4073, with retention times of 3.702, 3.768, 3.849, 4.163, 4.366, 4.475, 4.922 min, respectively.
The equipment was controlled by means of the software application MassLynx (Waters Corp., Milford, MA, USA), where the SmartFormulaTM editor provides a list of potential elemental formulas. The final compounds were identified based on the elution order of the flavonoids and the existing literature [30,31,32,33].

2.7. Quantification of Flavonoids by UHPLC-PDA

The extracts obtained from the SFE were filtered through a 0.20 μm nylon syringe filter (Membrane Solutions, Dallas, TX, USA). The quantification of phenolic compounds was performed by ultra-high-performance liquid chromatography coupled to a photodiode array detector (UHPLC-PDA) (ACQUITY UPLC® H-Class, Waters Corp., Milford, MA, USA). The column used was a reverse phase C18 (UPLC®BEH C18, Waters Corp., Milford, MA, USA, 50 mm × 2.1 mm i.d., 1.7 mm particle size). The column temperature was 47 °C, the flow rate was 0.6 mL min−1 and the injection volume 3.0 μL. The mobile phase consisted of two solvents: phase A was made up of 2% Milli-Q water in acetic acid and phase B was formed by 2% acetonitrile in acetic acid. The gradient used was the one reported in a previous work by Yerena-Prieto et al. [13]. The quercetin 3-O-glucoside calibration curve was constructed for a range of 50, 10, 5 and 1 mg L−1. The rest of the quantified compounds, for which no standard was available, were quantified by extrapolation with respect to the Q3GLU calibration curve, by assuming similar molar absorptivities and taking into account the molecular weight of the compound to be quantified. All the data were obtained by means of the software EmpowerTM 3 (Waters Corporation, Milford, MA, USA).

2.8. Statistical Analyses

An analysis of variance and a Tukey’s test were performed in order to evaluate the statistical differences at a 95% confidence level (p ≤ 0.05) for each extraction parameter studied. All experiments have been performed in duplicate. The graphical representations of the data obtained were analyzed using the software Minitab 19 Statistical (Minitab Ltd., Coventry, UK).

3. Results and Discussion

3.1. Effect of the Co-Solvent on the Extraction Yields and Their Flavonoid Content

In order to determine the best SFE operating conditions to obtain TFC-rich extracts, the first step consisted in finding the appropriate co-solvent proportion to favor an efficient flavonoid extraction, as described in the methodology. The results from this study can be seen in Table 1. Although there are reports that claim that the use of ethanol as co-solvent in SFE increases the yield percentages thanks to the increased polarity of the solvent [34,35], in the case of the flavonoids from moringa leaves, no noticeable amounts of these compounds were detected in the extracts obtained when using any of the ethanol percentages tested in this work, which means that the mixture of CO2:ethanol does not exhibit sufficient polarity for the extraction of the flavonoids [35,36], while it presents a greater affinity with apolar compounds [36]. This behavior is explained by the apolarity of CO2, that favors the extraction of low-polarity compounds rather than polar ones, such as flavonoids [19]. On the other hand, when water was used as co-solvent it had a positive effect with regard to the extraction of flavonoids, so that they could be detected in all the extracts that had been obtained using CO2:water regardless of the proportions used. Thus, the highest concentration was obtained when water was added at 50% with respect to the flow of CO2, with flavonoid concentrations at 6.931 mg TFC g−1 sample. In addition, water in contact with CO2 becomes acidic due to the formation and dissociation of carbonic acid [37]. This acidification of liquid water contributes to breaking chemical bonds, specifically glycosidic bonds, characteristic in phenolic compounds, such as flavonoids and anthocyanins, and this, in turn, increases the diffusion coefficient and releases phenolic compounds [38,39]. It has also been reported that the presence of water may increase the density of the mixed fluid and cause the swelling of the solutes, which consequently would improve the internal diffusion and the solubility of the compounds of interest [38]. Once the appropriate CO2:co-solvent ratio had been established at 50:50, two additional experiments as described in the methodology were conducted, where the 50% water content was replaced by 40:10 and 10:40 water:ethanol hydroalcoholic mixtures. These experiments intended to improve the extraction yields, given that according to several studies the extraction of phenolic compounds increases when ethanol and water mixtures are used. On the one hand, these mixtures also give rise to specific interactions, such as hydrogen bonding between solute and co-solvent molecules, resulting in greater solubility enhancement than is obtained with non-specific interactions alone [26,40], on the other hand, it increases the permeability of leaf tissue which, in turn, promotes mass transport through molecular diffusion. Although other authors have been able to obtain phenolic compounds, they did not obtain greater concentrations by increasing the percentage of water than those achieved when using a 50:50 CO2:water mixture [39,41,42,43,44]. It is also important to mention that, unlike ethanol, water in the used operating conditions remains in liquid phase, so that there are two phases involved, i.e., supercritical and liquid, whereas when ethanol is used as the co-solvent, it is totally solubilized in the CO2 [45]. We could, therefore, conclude that a 50:50 CO2:water ratio achieved the highest TFC concentration in the extracts (6.931 mg g−1 sample).

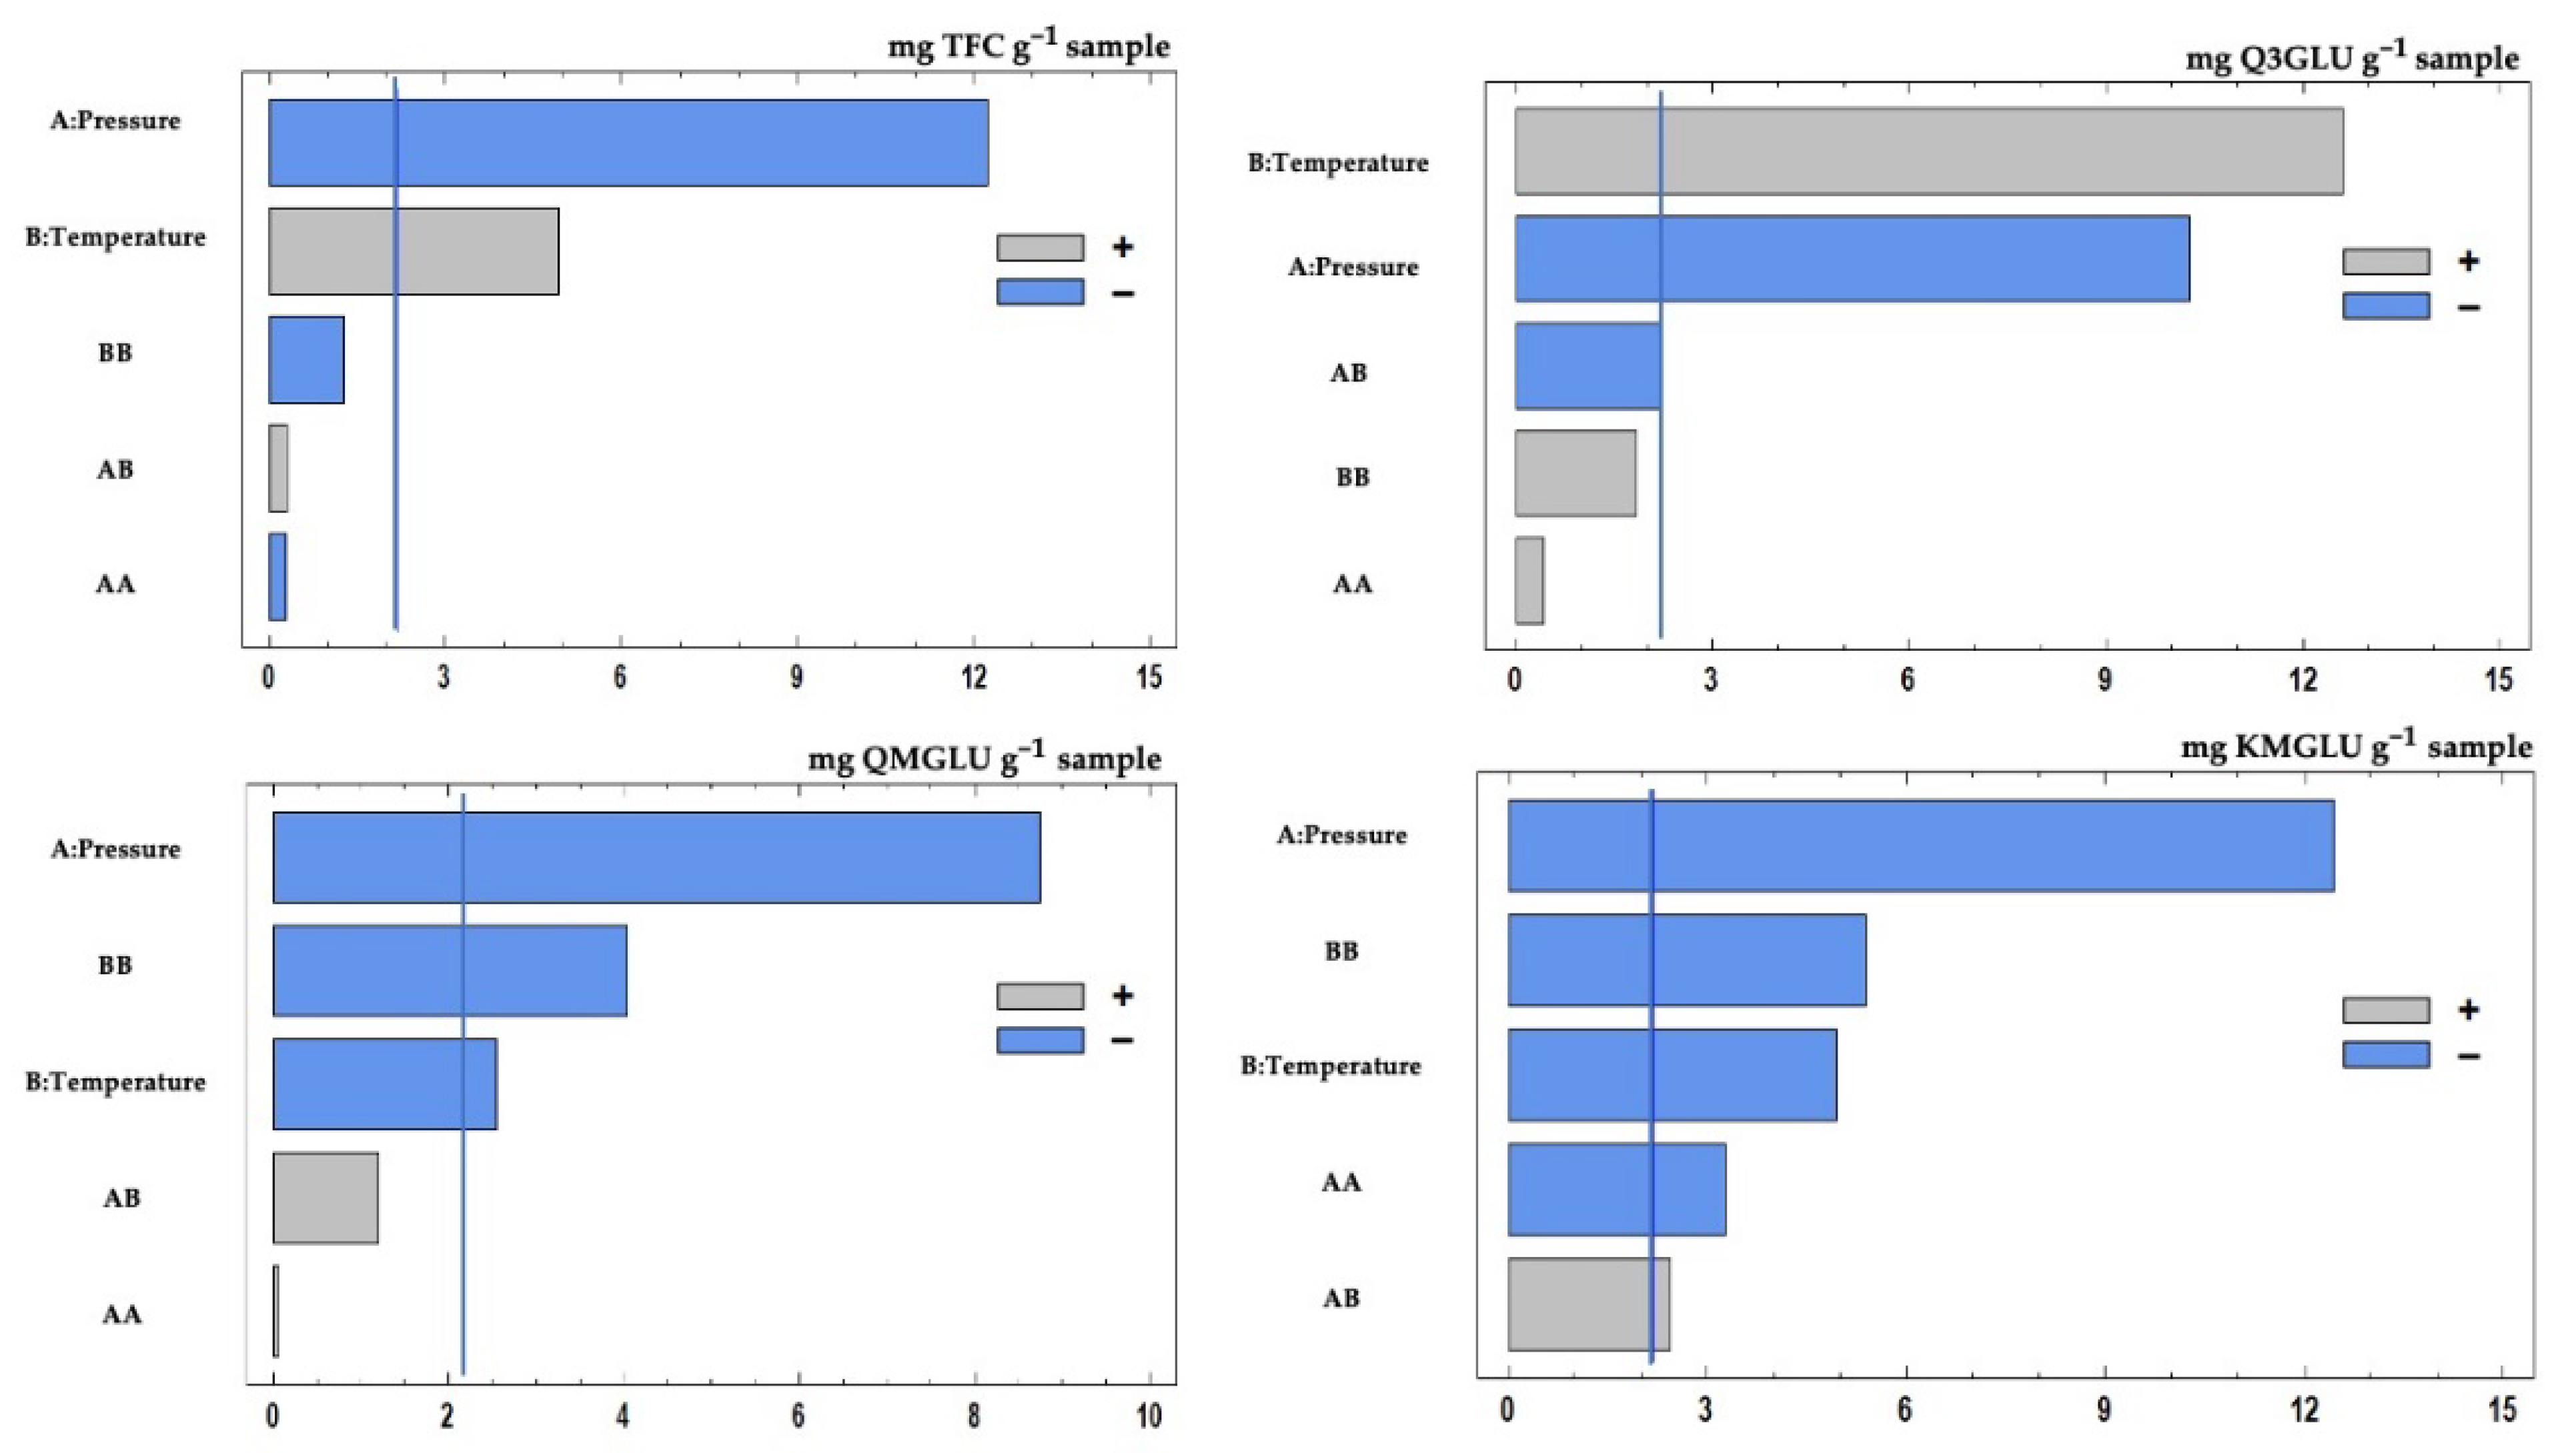
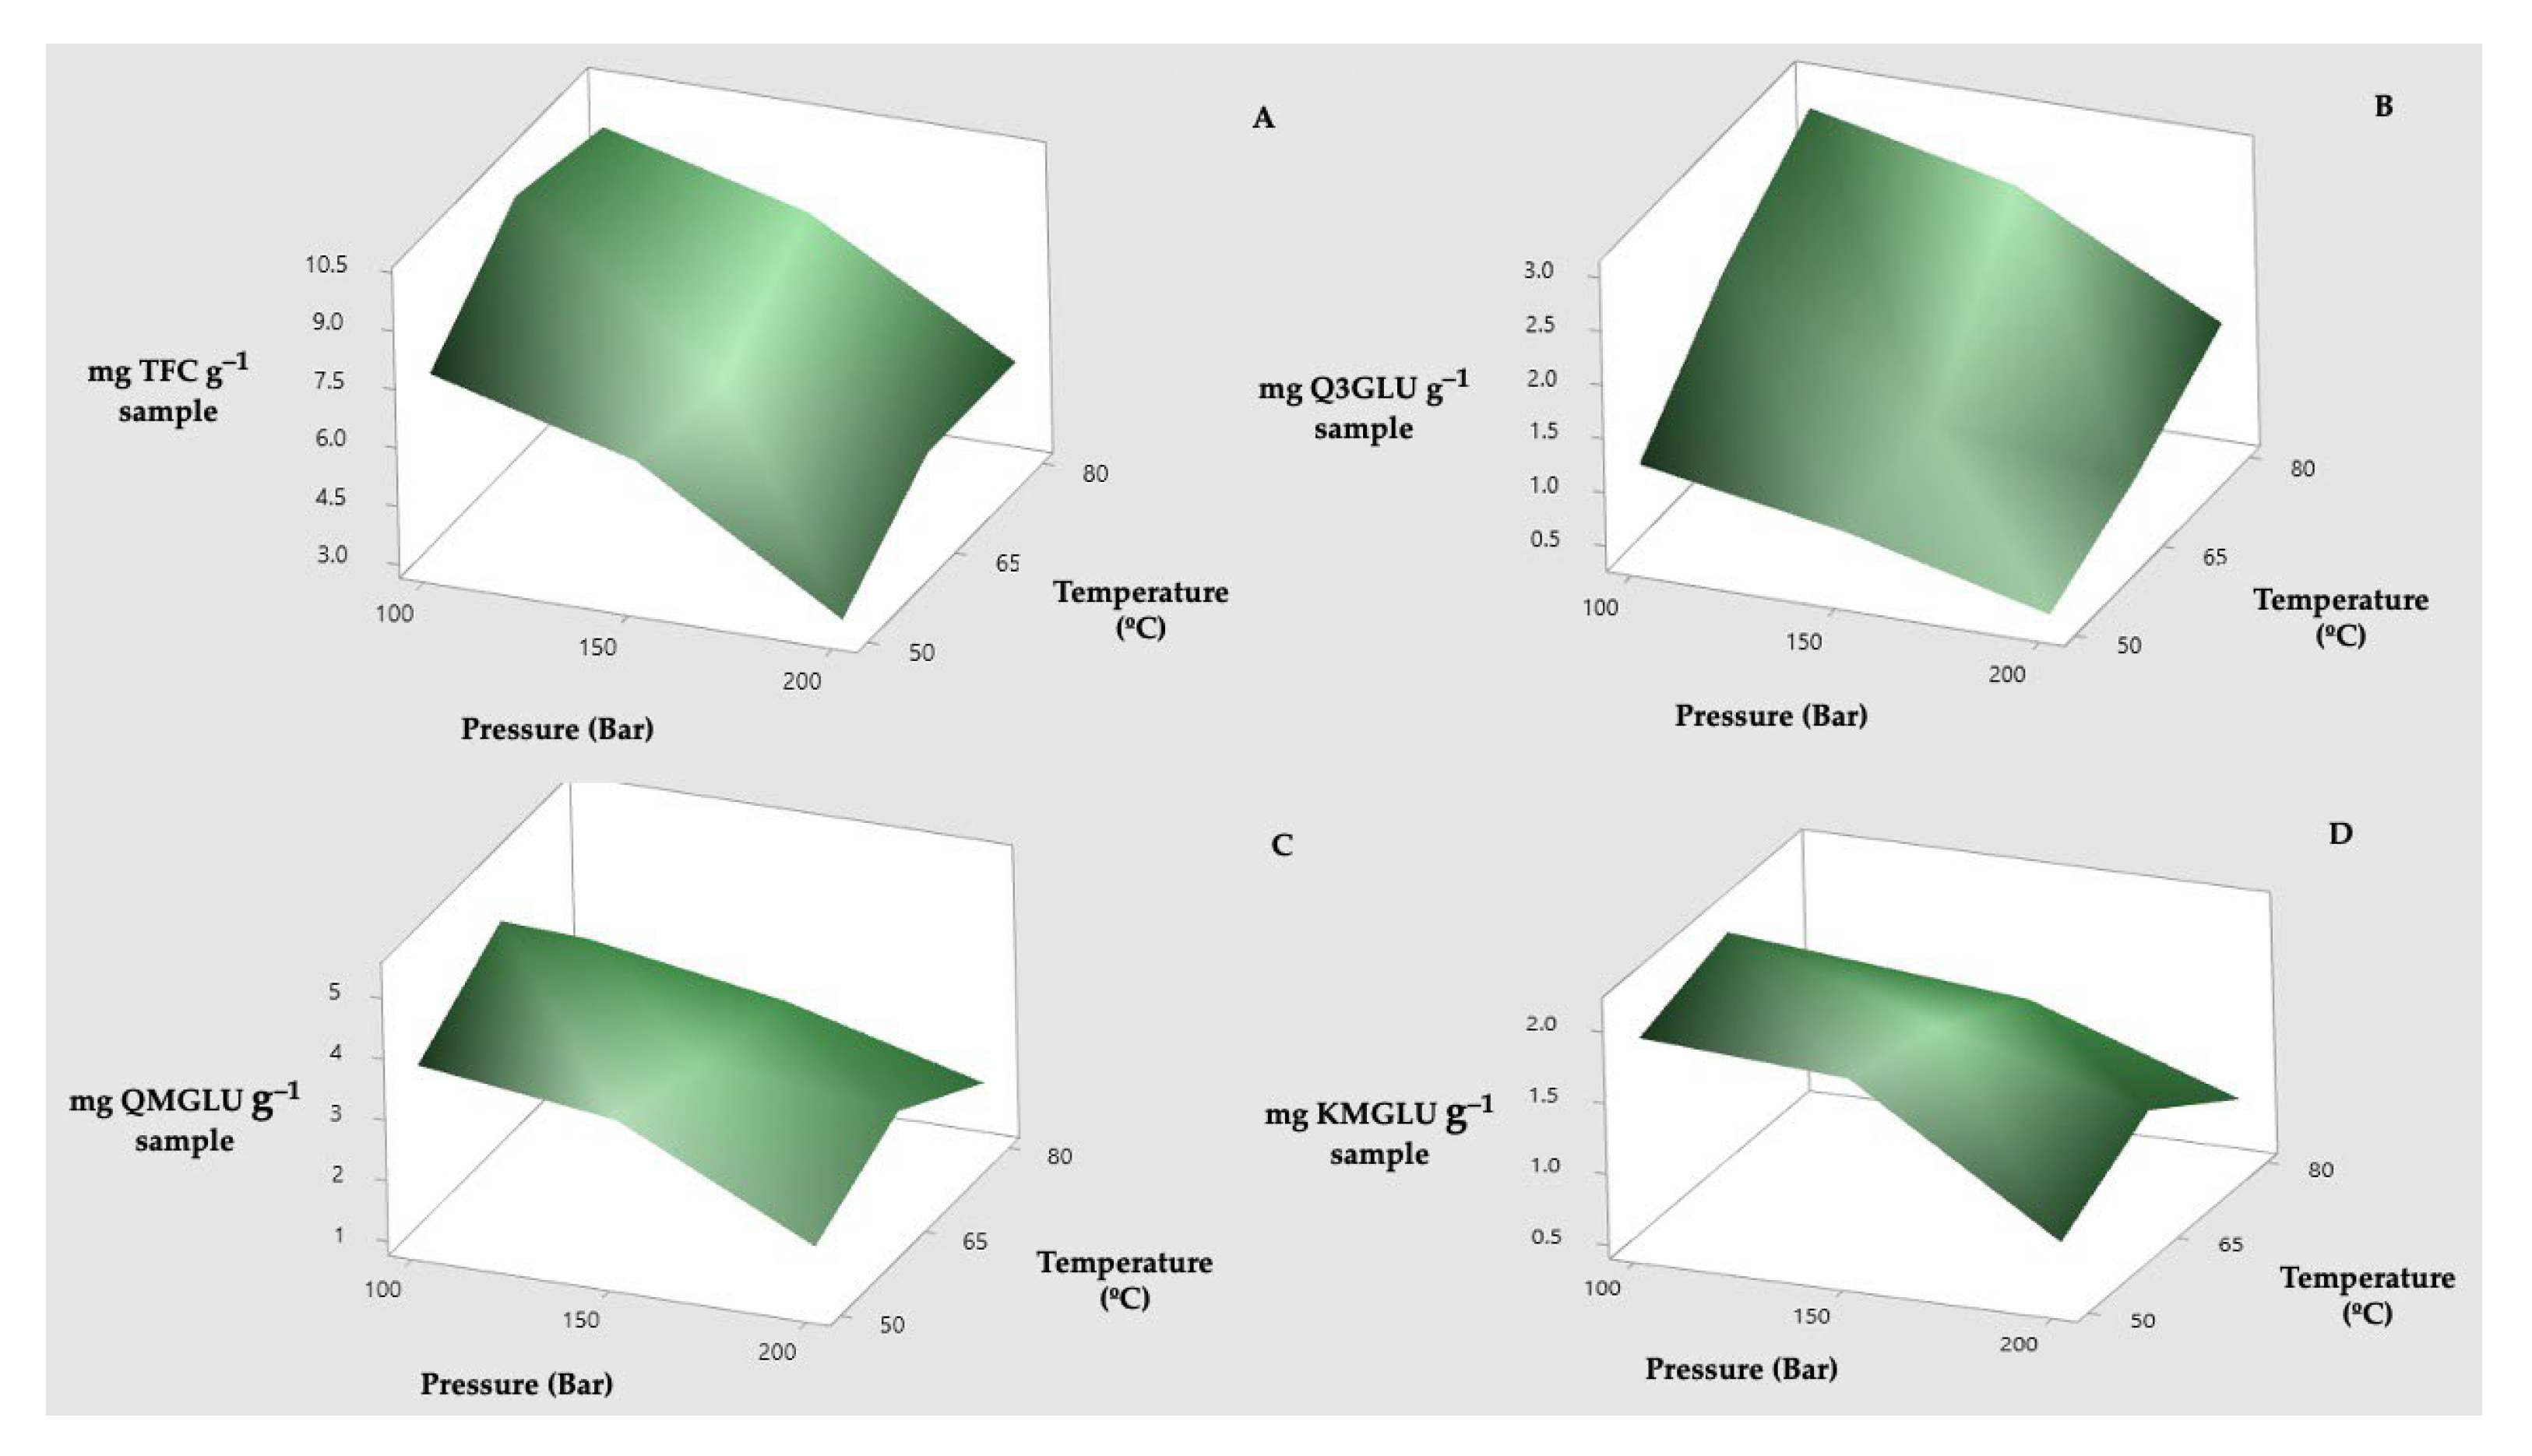
3.2. Effect of Pressure and Temperature on the Extract’s Flavonoid Composition

Once the optimum extraction co-solvent had been determined, the second step for the optimization of the SFE of flavonoids from moringa leaves consisted in determining the most efficient operating conditions in terms of pressure and temperature. It can be observed from Table 2 that pressure and temperature had a significant effect (p < 0.05) on the phenolic composition and concentration of the obtained extracts.
The results obtained from the examination of the effect of pressure and temperature on the concentration of TFC are shown in Table 2. This table contains the individual concentration of each compound, as well as the total concentration of all the compounds. An analysis of variance was performed using Tukey’s method at 95% confidence, both for TFC and for Q3GLU, QMGLU and KMGLU. It can be observed that not all the compounds were extracted under all the conditions, with compounds Q3GLU, QMGLU and KMGLU being the most representative compounds and the ones that were recovered under every pressure and temperature configuration. Consequently, they were the compounds to be analyzed in more detail. If we examine the results with respect to the experimental design (Figure 2), it can be seen that pressure and temperature are significant variables (p < 0.05) with regard to the recovery of TFCs.
TFC, Q3GLU, QMGLU and KMGLU concentration data have been graphically represented using a standardized Pareto chart (Figure 2), where both the linear and quadratic effects and their interactions have been plotted in a decreasing order of significance. The vertical line represents the statistically significant limit at a 95% confidence level and, in this regard, pressure with an inverse effect (−2.294) followed by temperature with a direct effect (+0.926) are the factors that exhibited a significant effect (p < 0.05). Thus, the extraction behavior of Q3GLU followed this pattern, with coefficients for pressure and temperature values of −0.579 and 0.711, respectively. In the case of QMGLU, the linear factors of pressure (−0.899), temperature (−0.262) and temperature–temperature interaction (−0.719), had a negative effect, which indicates that higher extractions were achieved at the lower levels of the studied range. Finally, KMGLU displayed a significant inverse effect of pressure (−0.422), temperature (−0.167) and of the temperature–temperature (−0.317) and pressure–pressure (−0.192) interactions, while a positive effect of the pressure–temperature (0.101) interaction could be observed.
Response surface plots were also generated (Figure 3), where we can observe that TFC concentration decreases with increasing pressure (Figure 3A), which could be attributed to a greater solubility of CO2 in water as the temperature was also increased. The highest concentration of 9.98 ± 0.02 mg TFC g−1 sample was obtained at low pressure (100 bar) and intermediate temperature (65 °C). Figure 3B–D show the results obtained for Q3GLU, QMGLU and KMGLU, respectively. In the case of Q3GLU, the highest concentration (2.83 ± 0.024 mg Q3GLU g−1 sample) was obtained at high temperature and low pressure, while QMGLU and KMGLU’s highest concentrations (4.77 ± 0.019 mg QMGLU g−1 sample and 2.12 ± 0.01 mg KMGLU g−1 sample) were obtained at low pressure and intermediate temperature. These results are similar to those reported by Solana et al. [38], who affirmed that the effect of temperature on the extraction yield in the studied range was less significant than the effect of pressure.

3.3. Optimal Extraction Conditions

By means of the regression Equations (1)–(4) fitted to the data for each response, the estimated values of TFC, Q3GLU, QMGLU and KMGLU, respectively, for the different operating conditions of pressure (A) and temperature (B) can be estimated. The results are shown in Table 3, as well as the R2 statistic, which indicates the extent to which the fitted model explains the degree of variability of each one of the response variables in the study. As can be seen in Table 3, the values of the adjusted coefficient of determination ranged from 84.352 up to 94.788, which means that there was a close correlation between the experimental values and the predicted values. These experimental values have been obtained under the operational conditions shown in Table 2.
TFC (mg g−1 sample) = 7.150 – 2.294A + 0.926B − 0.094A2 + 0.070AB − 0.415B2
Q3GLU (mg g−1 sample) = 1.337 − 0.579A + 0.711B + 0.042A2 − 0.151AB + 0.180B2
QMGLU (mg g−1 sample) = 3.465 − 0.899A − 0.262B + 0.011A2 + 0.152AB − 0.719B2
KMGLU (mg g−1 sample) = 1.882 − 0.422A − 0.167B − 0.192A2 + 0.101AB − 0.317B2
Following the statistical model, the maximum values of the response variables were calculated, as well as the optimum values of the independent factors for a maximum response. These values are presented in Table 4 as mg of compound g−1 sample. As can be seen, the optimum pressure conditions for the response variables studied were 100 bar and the temperature levels ranged from 55 up to 80 °C, depending on the target compound. Pressure values lower than 100 bar were not tested since CO2 critical pressure is 73 bar and, generally, at pressure levels close to that critical point, the effect of temperature on the solvent density is stronger than that of pressure [46], therefore, under such pressure levels, the solubility of the solutes decreases with the temperature. It was, therefore, decided not to test any higher temperatures in order to avoid the degradation of the QMGLU and KMGLU compounds, which presented optimum extraction temperatures at 55.80 and 53.8 °C, respectively. The highest TFC concentration was obtained at 100 bar and 80 °C with a value of 9.79 ± 0.02 mg TFC g−1 sample. In this sense, these are the optimal conditions to extract the greatest amount of flavonoids from moringa by means of SFE. Changing these conditions, the extraction will not be so favored. In any case, the more polar solvent mixtures will favor the extraction of those more polar flavonoids and vice versa. These results are in agreement with the SFE optimum phenolic compound extraction values reported by other authors. For example, Solana et al. [38] evaluated the effect of pressure and temperature on the SFE of phenolic compounds from Asparagus officinalis L. and reported that the final extraction yield decreased with increasing pressure levels and that, at 80 °C, the final extraction yield (35.2%) was greater than that at 50 °C or 65 °C at 32.3% and 34.0%, respectively. The main difference in this work is that the seven main compounds present in moringa leaves are quantified individually, while the mentioned studies of Zhao and Zhang and Rodríguez-Pérez et al. [22,24] focus first on the identification and, on the other hand, on the quantification of the total phenolic compounds by Folin–Ciocalteu and determination of antioxidant activity by ABTS and DPPH.
Given that not all the compounds have the same optimum extraction temperature, the optimum extraction conditions for TFC at 100 bar and 80 °C were established as the most convenient to investigate the extraction kinetics.

3.4. Extraction Kinetics

Figure 4 shows the concentration values of the main phenolic compounds found in the samples obtained after 30, 60, 90, 120, 150 and 180 min extraction time. Regarding TFCs (Figure 4A), it can be observed that after 120 min the highest concentration was achieved with 11.66 mg TFC g−1 sample that corresponds to a yield of 89.0% with respect to the phenolic fraction obtained by exhaustive extraction, which was 12.572 mg TFC g−1 sample. In this sense, if the extraction process was continued for a longer time, only 11% more could be obtained, which represents 1.29 mg TFC g−1 sample but would require a rather inefficient expenditure of CO2 and power. Figure 4B–D show the results of the extraction kinetics of Q3GLU, QMGLU and KMGLU, respectively. These are the major compounds in moringa, i.e., those that would provide the highest biological activity [7,9]. The extraction time to produce the highest concentration of 4.262 mg Q3GLU g−1 sample and 4.471 mg QMGLU g−1 sample was 120 min, while for KMGLU an amount of 2.701 mg g−1 sample was obtained after 90 min. However, if an extract containing all the flavonoids that have been analyzed in this study is to be obtained, the optimum time should be extended to 120 min. The study by Zhao and Zhang [22] reported similar results, since, according to their data, extraction yields increased gradually as the extraction time was extended, so that, for the tested range, the maximum extractions were achieved after 2 h.

4. Conclusions

This work addresses, for the first time, the SFE and quantification of the main flavonoids in moringa leaves. It has been demonstrated that SFE when using water as a CO2 co-solvent is an efficient option to extract the phenolic compounds present in moringa leaves, with the main extracted compounds being AP1, AP2, Q3GLU, QMGLU, QAGLU, K3GLU and KMGLU. The highest phenolic content was obtained when water was used as co-solvent at a 50:50 ratio. Accordingly, the effect of pressure, temperature and extraction time with this co-solvent was evaluated. The maximum extraction yield (89.0%), equivalent to 11.66 mg TFC g−1 sample, was obtained at 100 bar and 80 °C in 120 min. It has also been found that the extracts obtained at different pressures and temperatures presented different compositions, but in all the cases, Q3GLU, QMGLU and KMGLU were the predominant and most abundant compounds regardless of the pressure and temperature levels used. If Q3GLU and QMGLU are to be obtained separately, the optimum extraction time would be 120 min, while 90 min would be the ideal extraction time for KMGLU. In addition, SFE minimizes the use of organic solvents and reduces concentration steps, which cause the degradation of antioxidant compounds, such as the flavonoids studied in this work. In conclusion, this study has demonstrated that suitable extracts can be obtained to be used as food preservatives, cosmetics, pharmaceutical applications or other formulations, since they can provide a high antioxidant effect thanks to their flavonoid content, which can contribute to improving the health of consumers.

Supplementary Materials

The following supporting information can be downloaded at: https://www.mdpi.com/article/10.3390/agronomy12061450/s1, Figure S1: Chemical structures of the flavonoids studied. Apigenin glucoside isomer 1 (AP1); apigenin glucoside isomer 2 (AP2); quercetin 3-O-glucoside (Q3GLU); quercetin malonyl glucoside (QMGLU); quercetin acetyl glucoside (QAGLU); kaempferol 3-O-glucoside (K3GLU) and kaempferol malonyl glucoside (KMGLU).

Author Contributions

Conceptualization, M.Á.G.-A., G.F.B. and G.d.C.R.-J.; methodology, B.J.Y.-P., M.G.-G. and C.C.-B.; software, C.C.-B. and G.F.B.; validation, G.F.B. and L.C.; formal analysis, M.G.-G., B.J.Y.-P. and C.C.-B.; investigation, G.d.C.R.-J. and G.F.B.; resources, G.d.C.R.-J. and G.F.B.; data curation, B.J.Y.-P., M.P. and G.F.B.; writing—original draft preparation, B.J.Y.-P.; writing—review and editing, G.F.B. and C.C.-B.; visualization, G.F.B. and L.C.; supervision, M.P., M.Á.G.-A., G.d.C.R.-J., L.C. and G.F.B.; project administration, G.F.B. and G.d.C.R.-J.; funding acquisition, G.F.B. and G.d.C.R.-J. All authors have read and agreed to the published version of the manuscript.

Funding

This work has been supported by the project “EQC2018-005135-P” (Equipment for liquid chromatography by means of mass spectrometry and ion chromatography) of the State Subprogram of Research Infrastructures and Technical Scientific Equipment. The authors express their gratitude to the Consejo Nacional de Ciencia y Tecnología (CONACyT), to the University of Cadiz (UCA) and the Aula Universitaria Iberoamericana (R80REC) for scholarships provided to Beatriz Juliana Yerena-Prieto (No. CVU: 766097). The authors express their gratitude to the Tecnológico Nacional de México (Project TNM 10088.21-P) for financial support.

Institutional Review Board Statement

Not applicable.

Informed Consent Statement

Not applicable.

Data Availability Statement

The data presented in this study are contained within the article.

Acknowledgments

The authors are grateful to the “Instituto de Investigación Vitivinícola y Agroalimentaria” (IVAGRO) for providing the necessary facilities to carry out the research.

Conflicts of Interest

The authors declare no conflict of interest.

References

  1. Olson, M.E.; Fahey, J.W. Moringa oleifera: A multipurpose tree for the dry tropics. Rev. Mex. Biodivers. 2011, 82, 1071–1082. [Google Scholar]
  2. Stohs, S.J.; Hartman, M.J. Review of the safety and efficacy of Moringa oleifera. Phytother. Res. 2015, 29, 796–804. [Google Scholar] [CrossRef]
  3. Anwar, F.; Latif, S.; Ashraf, M.; Gilani, A.H. Moringa oleifera: A Food Plant with Multiple Medicinal Uses. Phytother. Res. 2007, 21, 17–25. [Google Scholar] [CrossRef] [PubMed]
  4. Manguro, L.O.A.; Lemmen, P. Phenolics of Moringa oleifera leaves. Nat. Prod. Res. 2007, 21, 56–68. [Google Scholar] [CrossRef]
  5. Kekuda, T.R.; Mallikarjun, N.; Swathi, D.; Nayana, K.V.; Aiyar, M.B.; Rohini, T.R. Antibacterial and Antifungal efficacy of steam distillate of Moringa oleifera Lam. J. Pharm. Sci. Res. 2010, 2, 34–37. [Google Scholar]
  6. Mahajan, S.G.; Mali, R.G.; Mehta, A.A. Protective effect of ethanolic extract of seeds of Moringa oleifera Lam. against inflammation associated with development of arthritis in rats. J. Immunotoxicol. 2007, 4, 39–47. [Google Scholar] [CrossRef] [Green Version]
  7. Jaiswal, D.; Kumar Rai, P.; Kumar, A.; Mehta, S.; Watal, G. Effect of Moringa oleifera Lam. leaves aqueous extract therapy on hyperglycemic rats. J. Ethnopharmacol. 2009, 123, 392–396. [Google Scholar] [CrossRef]
  8. Mehta, K.; Balaraman, R.; Amin, A.H.; Bafna, P.A.; Gulati, O.D. Effect of fruits of Moringa oleifera on the lipid profile of normal and hypercholesterolaemic rabbits. J. Ethnopharmacol. 2003, 86, 191–195. [Google Scholar] [CrossRef]
  9. Singh, B.N.; Singh, B.R.; Singh, R.L.; Prakash, D.; Dhakarey, R.; Upadhyay, G. Oxidative DNA damage protective activity, antioxidant and anti-quorum sensing potentials of Moringa oleifera. Food Chem. Toxicol. 2009, 47, 1109–1116. [Google Scholar] [CrossRef]
  10. Verma, A.R.; Vijayakumar, M.; Mathela, C.S.; Rao, C.V. In vitro and in vivo antioxidant properties of different fractions of Moringa oleifera leaves. Food Chem. Toxicol. 2009, 47, 2196–2201. [Google Scholar] [CrossRef]
  11. Sreelatha, S.; Jeyachitra, A.; Padma, P.R. Antiproliferation and induction of apoptosis by Moringa oleifera leaf extract on human cancer cells. Food Chem. Toxicol. 2011, 49, 1270–1275. [Google Scholar] [CrossRef]
  12. Rodriguez- Perez, C.; Gilbert-López, B.; Mendiola, J.A.; Segura-Carretero, A.; Quirantes-Pin, R.; Elena, I.B. Optimization of microwave-assisted extraction and pressurized liquid extraction of phenolic compounds from Moringa oleifera leaves by multiresponse surface. Electrophoresis 2016, 37, 1938–1946. [Google Scholar] [CrossRef] [PubMed]
  13. Yerena-Prieto, B.J.; Gonzalez-Gonzalez, M.; Vázquez-Espinosa, M.; González-de-Peredo, A.V.; García-Alvarado, M.Á.; Palma, M.; Rodriguez-Jimenes, G.D.C.; Barbero, G.F. Optimization of an Ultrasound-Assisted Extraction Method Applied to the Extraction of Flavonoids from Moringa Leaves (Moringa oleífera Lam.). Agronomy 2022, 12, 261. [Google Scholar] [CrossRef]
  14. Nuapia, Y.; Cukrowska, E.; Tutu, H.; Chimuka, L. Statistical comparison of two modeling methods on pressurized hot water extraction of vitamin C and phenolic compounds from Moringa oleifera leaves. S. Afr. J. Bot. 2020, 129, 9–16. [Google Scholar] [CrossRef]
  15. Del Valle, J.M.; Aguilera, J.M. Review: High pressure CO2 extraction. Fundamentals and applications in the food industry. Int. J. Food Sci. 1999, 5, 1–24. [Google Scholar] [CrossRef]
  16. Reyes, F.A.; Mendiola, J.A.; Ibañez, E.; Del Valle, J.M. Astaxanthin extraction from Haematococcus pluvialis using CO2-expanded ethanol. J. Supercrit. Fluids 2014, 92, 75–83. [Google Scholar] [CrossRef] [Green Version]
  17. Khoddami, A.; Wilkes, M.A.; Roberts, T.H. Techniques for analysis of plant phenolic compounds. Molecules 2013, 18, 2328–2375. [Google Scholar] [CrossRef]
  18. Fernández-Ponce, M.T.; Casas, L.; Mantell, C.; De La Ossa, E.M. Use of high pressure techniques to produce Mangifera indica L. leaf extracts enriched in potent antioxidant phenolic compounds. Innov. Food Sci. Emerg. Technol. 2015, 29, 94–106. [Google Scholar] [CrossRef]
  19. Castro-Vargas, H.I.; Rodríguez-Varela, L.I.; Ferreira, S.R.S.; Parada-Alfonso, F. Extraction of phenolic fraction from guava seeds (Psidium guajava L.) using supercritical carbon dioxide and co-solvents. J. Supercrit. Fluids 2010, 51, 319–324. [Google Scholar] [CrossRef]
  20. Brunner, G. Supercritical fluids: Technology and application to food processing. J. Food Eng. 2005, 67, 21–33. [Google Scholar] [CrossRef]
  21. Chinnarasu, C.; Montes, A.; Pereyra, C.; Casas, L.; Fernández-Ponce, M.T.; Mantell, C. Preparation of polyphenol fine particles potent antioxidants by a supercritical antisolvent process using different extracts of Olea europaea leaves. Korean J. Chem. Eng. 2016, 33, 594–602. [Google Scholar] [CrossRef]
  22. Zhao, S.; Zhang, D. Supercritical fluid extraction and characterisation of Moringa oleifera leaves oil. Sep. Purif. Technol. 2013, 118, 497–502. [Google Scholar] [CrossRef]
  23. Rodríguez-Pérez, C.; Mendiola, J.A.; Quirantes-Piné, R.; Ibáñez, E.; Segura-Carretero, A. Green downstream processing using supercritical carbon dioxide, CO2-expanded ethanol and pressurized hot water extractions for recovering bioactive compounds from Moringa oleifera leaves. J. Supercrit. Fluids 2016, 116, 90–100. [Google Scholar] [CrossRef]
  24. Fernández-Ponce, M.T.; Parjikolaei, B.R.; Lari, H.N.; Casas, L.; Mantell, C.; Martínez de la Ossa, E.J. Pilot-plant scale extraction of phenolic compounds from mango leaves using different green techniques: Kinetic and scale up study. Chem. Eng. J. 2016, 299, 420–430. [Google Scholar] [CrossRef]
  25. Guamán-Balcázar, M.C.; Montes, A.; Fernández-Ponce, M.T.; Casas, L.; Mantell, C.; Pereyra, C. Generation of potent antioxidant nanoparticles from mango leaves by supercritical antisolvent extraction. J. Supercrit. Fluids 2018, 138, 92–101. [Google Scholar] [CrossRef]
  26. Ting, S.S.T.; Tomasko, D.L.; Macnaughton, S.J.; Foster, N.R. Chemical-Physical Interpretation of Cosolvent Effects in Supercritical Fluids. Ind. Eng. Chem. Res. 1993, 32, 1482–1487. [Google Scholar] [CrossRef]
  27. Hwang, R.J.; Ortiz, J. Mitigation of asphaltics deposition during CO2 flood by enhancing CO2 solvency with chemical modifiers. Org. Geochem. 2000, 31, 1451–1462. [Google Scholar] [CrossRef]
  28. Herrero, M.; Castro-Puyana, M.; Mendiola, J.A.; Ibañez, E. Compressed fluids for the extraction of bioactive compounds. TrAC-Trends Anal. Chem. 2013, 43, 67–83. [Google Scholar] [CrossRef]
  29. Cejudo Bastante, C.; Casas Cardoso, L.; Fernández Ponce, M.T.; Mantell Serrano, C.; Martínez de la Ossa-Fernández, E.J. Characterization of olive leaf extract polyphenols loaded by supercritical solvent impregnation into PET/PP food packaging films. J. Supercrit. Fluids 2018, 140, 196–206. [Google Scholar] [CrossRef]
  30. Coppin, J.P.; Xu, Y.; Chen, H.; Pan, M.H.; Ho, C.T.; Juliani, R. Determination of flavonoids by LC/MS and anti-inflammatory activity in Moringa oleifera. J. Funct. Foods 2013, 5, 1892–1899. [Google Scholar] [CrossRef]
  31. Oldoni, T.L.C.; Merlin, N.; Karling, M.; Carpes, S.T.; De Alencar, S.M.; Morales, R.G.F. Bioguided extraction of phenolic compounds and UHPLC-ESI-Q-TOF-MS/MS characterization of extracts of Moringa oleifera leaves collected in Brazil. Food Res. Int. 2019, 125, 108647. [Google Scholar] [CrossRef] [PubMed]
  32. Amaglo, N.K.; Bennett, R.N.; Curto, R.B.L.; Rosa, E.A.; Turco, V.; Giuffrida, A. Profiling selected phytochemicals and nutrients in different tissues of the multipurpose tree Moringa oleifera Lam., grown in Ghana. Food Chem. 2010, 122, 1047–1054. [Google Scholar] [CrossRef]
  33. Rodríguez-Pérez, C.; Quirantes-Piné, R.; Fernández-Gutiérrez, A.; Segura-Carretero, A. Optimization of extraction method to obtain a phenolic compounds-rich extract from Moringa oleifera Lam leaves. Ind. Crops Prod. 2015, 66, 246–254. [Google Scholar] [CrossRef]
  34. Garcia-Salas, P.; Morales-Soto, A.; Segura-Carretero, A.; Fernández-Gutiérrez, A. Phenolic-compound-extraction systems for fruit and vegetable samples. Molecules 2010, 15, 8813–8826. [Google Scholar] [CrossRef] [PubMed]
  35. Goli, A.H.; Barzegar, M.; Sahari, M.A. Antioxidant activity and total phenolic compounds of pistachio (Pistachia vera) hull extracts. Food Chem. 2005, 92, 521–525. [Google Scholar] [CrossRef]
  36. Lee, J.H.; Kim, Y.G.; Park, J.G.; Lee, J. Supercritical fluid extracts of Moringa oleifera and their unsaturated fatty acid components inhibit biofilm formation by Staphylococcus aureus. Food Control 2017, 80, 74–82. [Google Scholar] [CrossRef]
  37. Toews, K.L.; Shroll, R.M.; Wai, C.M.; Smart, N.G. pH-Defining Equilibrium between Water and Supercritical CO2. influence on SFE of Organics and Metal Chelates. Anal. Chem. 1995, 67, 4040–4043. [Google Scholar] [CrossRef]
  38. Solana, M.; Boschiero, I.; Dall’Acqua, S.; Bertucco, A. A comparison between supercritical fluid and pressurized liquid extraction methods for obtaining phenolic compounds from Asparagus officinalis L. J. Supercrit. Fluids 2015, 100, 201–208. [Google Scholar] [CrossRef]
  39. Paes, J.; Dotta, R.; Barbero, G.F.; Martínez, J. Extraction of phenolic compounds and anthocyanins from blueberry (Vaccinium myrtillus L.) residues using supercritical CO2 and pressurized liquids. J. Supercrit. Fluids 2014, 95, 8–16. [Google Scholar] [CrossRef]
  40. Ting, S.S.T.; Tomasko, D.L.; Macnaughton, S.J.; Foster, N.R. Solubility of naproxen in supercritical carbon dioxide with and without cosolvents. Ind. Eng. Chem. Res. 1993, 32, 1471–1481. [Google Scholar] [CrossRef]
  41. Garcia-Mendoza, M.D.P.; Espinosa-Pardo, F.A.; Baseggio, A.M.; Barbero, G.F.; Maróstica Junior, M.R.; Rostagno, M.A. Extraction of phenolic compounds and anthocyanins from juçara (Euterpe edulis Mart.) residues using pressurized liquids and supercritical fluids. J. Supercrit. Fluids 2017, 119, 9–16. [Google Scholar] [CrossRef]
  42. Seabra, I.J.; Braga, M.E.M.; Batista, M.T.; de Sousa, H.C. Effect of solvent (CO2/ethanol/H2O) on the fractionated enhanced solvent extraction of anthocyanins from elderberry pomace. J. Supercrit. Fluids 2010, 54, 145–152. [Google Scholar] [CrossRef]
  43. Wissam, Z.; Ghada, B.; Wassim, A.; Warid, K. Effective extraction of polyphenols and proanthocyanidins from pomegranate’s peel. Int. J. Pharm. Pharm. Sci. 2012, 4, 675–682. [Google Scholar]
  44. Jayaprakasha, G.K.; Singh, R.P.; Sakariah, K.K. Antioxidant activity of grape seed (Vitis vinifera) extracts on peroxidation models in vitro. Food Chem. 2001, 73, 285–290. [Google Scholar] [CrossRef]
  45. Pappa, G.D.; Perakis, C.; Tsimpanogiannis, I.N.; Voutsas, E.C. Thermodynamic modeling of the vapor-liquid equilibrium of the CO2/H2O mixture. Fluid Phase Equilibria 2009, 284, 56–63. [Google Scholar] [CrossRef]
  46. Espinosa-Pardo, F.A.; Nakajima, V.M.; Macedo, G.A.; Macedo, J.A.; Martínez, J. Extraction of phenolic compounds from dry and fermented orange pomace using supercritical CO2 and cosolvents. Food Bioprod. Process. 2017, 101, 1–10. [Google Scholar] [CrossRef]
Figure 1. Diagram of the supercritical extraction equipment used.
Agronomy 12 01450 g001
Figure 2. Pareto chart of the standardized effects on TFC, Q3GLU, QMGLU and KMGLU concentrations.
Agronomy 12 01450 g002
Figure 3. Response surface plots of TFC (A), Q3GLU (B), QMGLU (C) and KMGLU (D) concentrations for the different temperature and pressure levels in the study.
Agronomy 12 01450 g003
Figure 4. Extraction kinetics of the supercritical CO2 extraction of TFC (A), Q3GLU (B), QMGLU (C) and KMGLU (D) from moringa leaves under optimum pressure and temperature conditions. The data are expressed as mean ± standard deviation.
Agronomy 12 01450 g004
Table 1. TFC concentration obtained from the different water, ethanol and ethanol:water proportions with respect to CO2 flow (20 mL min−1) while at constant temperature and pressure conditions: 65 °C and 150 bar (n = 2).
% CO2% EtOH% H2Omg TFC g–1 Sample
75.025.00.00.0 e
50.050.00.00.0 e
25.075.00.00.0 e
75.00.025.02.478 ± 0.104 d
50.00.050.06.931 ± 0.258 a
25.00.075.04.749 ± 0.148 b
50.040.010.03.828 ± 0.355 c
50.010.040.02.010 ± 0.123 d
Data are expressed as mean ± standard deviation. Different letters in the same column indicate significant differences (p < 0.05).
Table 2. Independent variables for the 3 × 3 full factorial design and experimental values obtained for the response variables at a constant ratio of CO2 and water of 50:50 and 90 min extraction time (n = 2).
Variablemg Flavonoid g–1 Sample
P (Bar)T (°C)AP1AP2Q3GLUQMGLUQAGLUK3GLUKMGLUTFC
100500.18 ± 0.03 b0.12 ± 0.05 b1.21 ± 0.015 e3.79 ± 0.05 b0.09 ± 0.00 a0.46 ± 0.04 e1.98 ± 0.09 b7.85 ± 0.16 c
100650.12 ± 0.03 c0.12 ± 0.00 b2.18 ± 0.07 c4.77 ± 0.02 a0.05 ± 0.01 b0.62 ± 0.03 d2.12 ± 0.05 a9.98 ± 0.22 a
10080ND0.29 ± 0.05 a2.83 ± 0.02 a3.10 ± 0.01 cdND1.77 ± 0.07 a1.46 ± 0.09 d9.47 ± 0.14 b
15050NDND0.86 ± 0.03 g3.40 ± 0.02 cND0.21 ± 0.03 f1.79 ± 0.05 b6.27 ± 0.12 d
150650.12 ± 0.05 cND1.01 ± 0.04 f3.09 ± 0.20 deND0.35 ± 0.04 ef1.63 ± 0.04 c6.23 ± 0.16 d
150800.30 ± 0.02 aND2.44 ± 0.06 b2.64 ± 0.07 fND1.51 ± 0.04 b1.33 ± 0.05 de8.23 ± 0.12 c
20050NDND0.42 ± 0.05 h1.80 ± 0.05 gNDND0.84 ± 0.03 f3.07 ± 0.08 f
200650.07 ± 0.03 dND0.89 ± 0.03 g2.68 ± 0.08 efND0.22 ± 0.03f1.28 ± 0.02 e5.16 ± 0.15 e
200800.16 ± 0.01 bND1.49 ± 0.04 d1.78 ± 0.02 gND0.96 ± 0.06c0.82 ± 0.08 f5.22 ± 0.07 e
ND: Not detected. Significantly different means do not share the same letter over the column (p < 0.05).
Table 3. Experimental values (mg g−1 sample) vs. design-estimated values (mg g−1 sample).
Observed ValuesEstimated Values
Q3GLUQMGLUKMGLUTFCQ3GLUQMGLUKMGLUTFC
Exp./R2 0.947880.843520.929370.90605
11.2113.7981.9867.8511.2774.0702.0018.078
22.1874.7702.1249.9981.9594.3742.0499.350
32.8393.1021.4679.4713.0023.2421.4629.790
40.8643.4031.7936.2750.8073.0081.6695.808
51.0173.0981.6326.2301.3373.4651.8187.150
62.4422.6451.3338.2382.2292.4841.3338.158
70.4251.8020.8483.0750.4221.9670.9523.140
80.8932.6821.2845.1650.8012.5761.2035.095
91.4963.7980.8205.2201.5421.7470.8205.342
Table 4. Optimal values of the independent factors that maximize TFC, Q3GLU, QMGLU and K3GLU concentrations in the extracts.
FactorsTFCQ3GLUQMGLUKMGLU
Pressure (bar)100100100100
Temperature (°C)808055.853.8
Maximum concentration (mg g−1 sample)9.7913.0034.4352.107
Publisher’s Note: MDPI stays neutral with regard to jurisdictional claims in published maps and institutional affiliations.

