1. Text Correction
There was an error in the original publication. On the fourth line of Section 3: Results, the value of 32% needs to be changed to 31%.
A correction has been made to Section 3. Results, “The effect of soil tillage on the ERGO content of maize, soybeans, and oats is presented in Figure 1. A trend was observed where ERGO concentrations generally declined as tillage intensity increased from NT to CD to MB. ERGO content was decreased from NT to MB by 32%, 33%, and 28% for maize, soybeans, and oats, respectively”.
Corrected sentence: “The effect of soil tillage on the ERGO content of maize, soybeans, and oats is presented in Figure 1. A trend was observed where ERGO concentrations generally declined as tillage intensity increased from NT to CD to MB. ERGO content was decreased from NT to MB by 31%, 33%, and 28% for maize, soybeans, and oats, respectively”.
2. Error in Figures
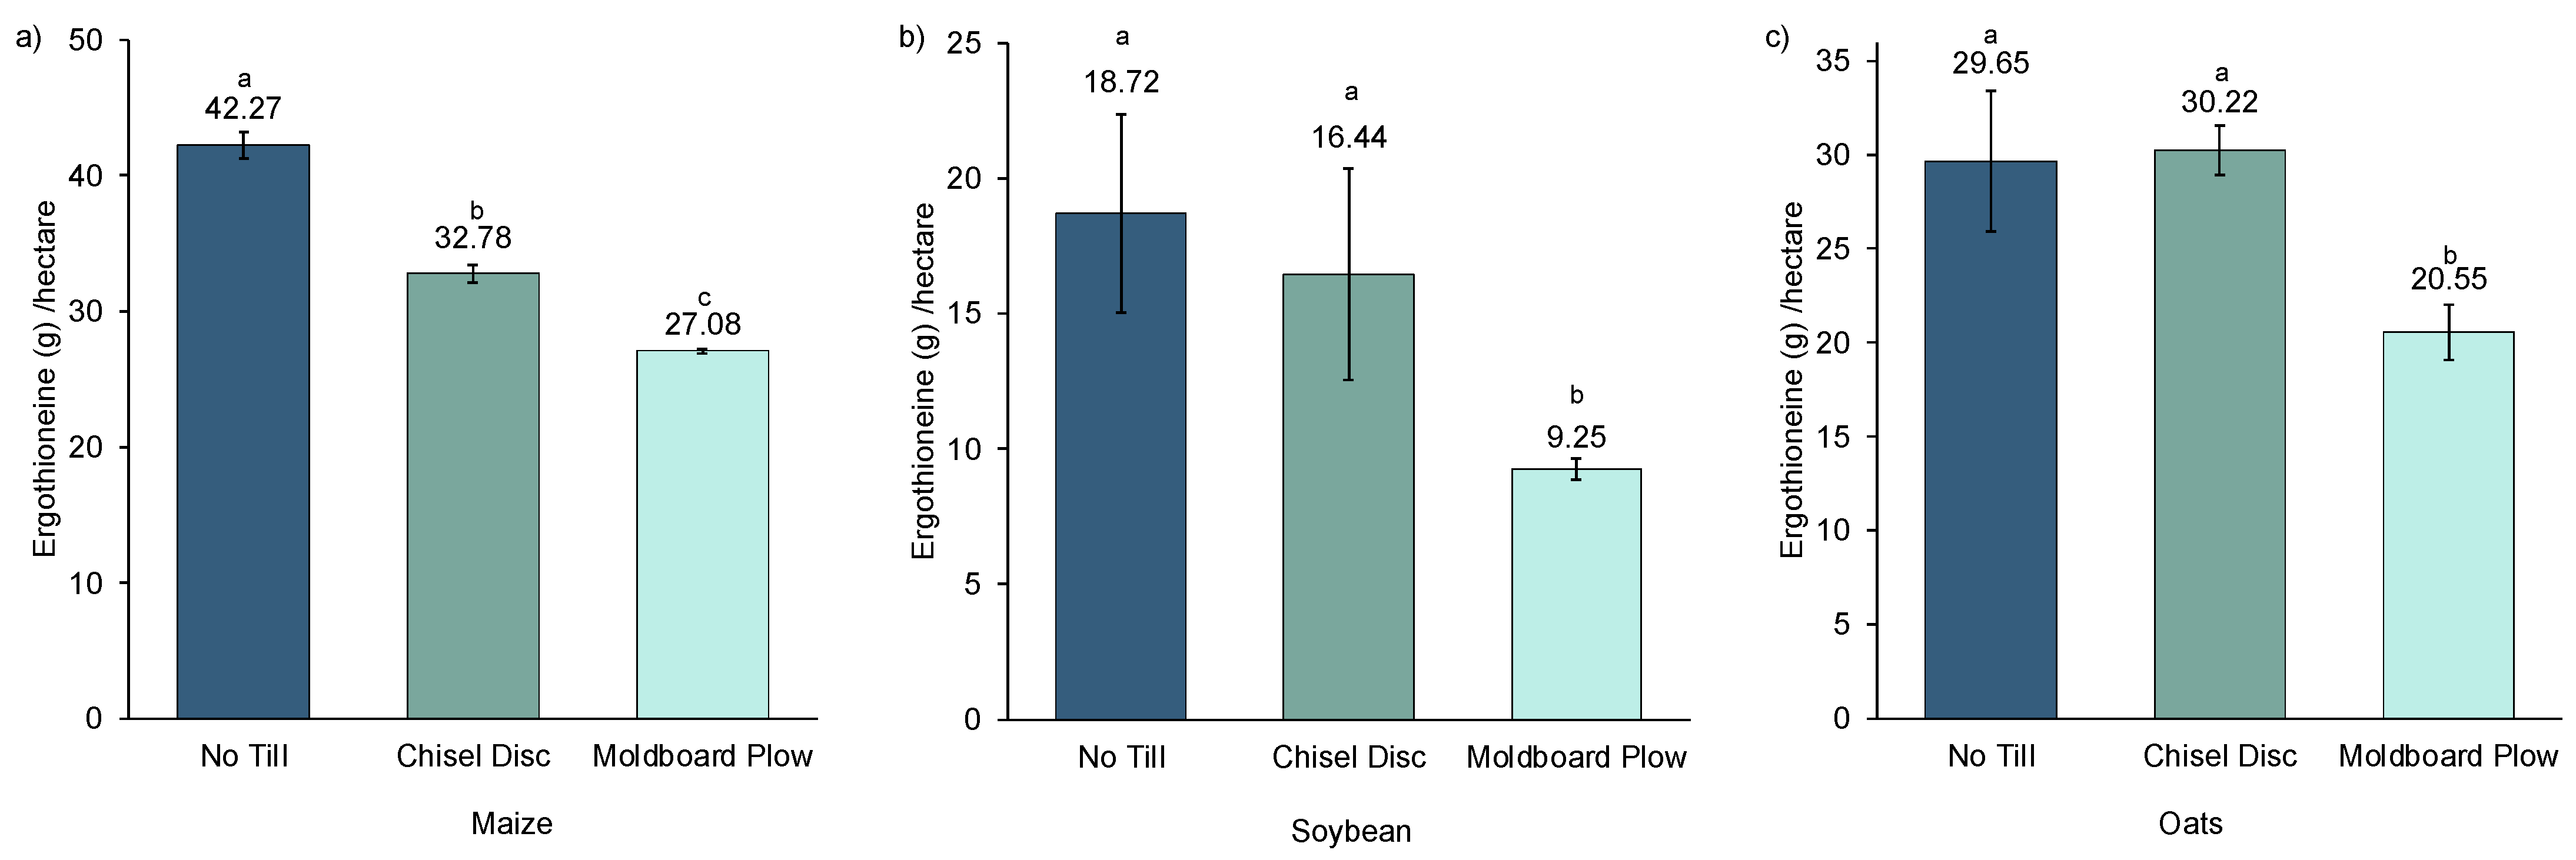
In the original publication [1], there was a mistake in Figure 1 and Figure 3, as published. In the calculations for ergothioneine content, the authors failed to account for a dilution factor of the samples, as mentioned in the methodology, prior to injecting them into the LC/MS system. Therefore, these values need to be multiplied by a factor of 2. The corrected Figure 1 and Figure 3 appear below.
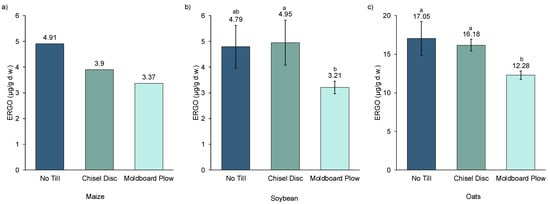
Figure 1.
ERGO content of crops (a) maize (2018), (b) soybean (2019), and (c) oats (2020) grown using different tillage methods; different letters above the bars indicate significant difference (p > 0.05) within each crop type, error bars represent the standard deviation of each tillage type.
Figure 1.
ERGO content of crops (a) maize (2018), (b) soybean (2019), and (c) oats (2020) grown using different tillage methods; different letters above the bars indicate significant difference (p > 0.05) within each crop type, error bars represent the standard deviation of each tillage type.
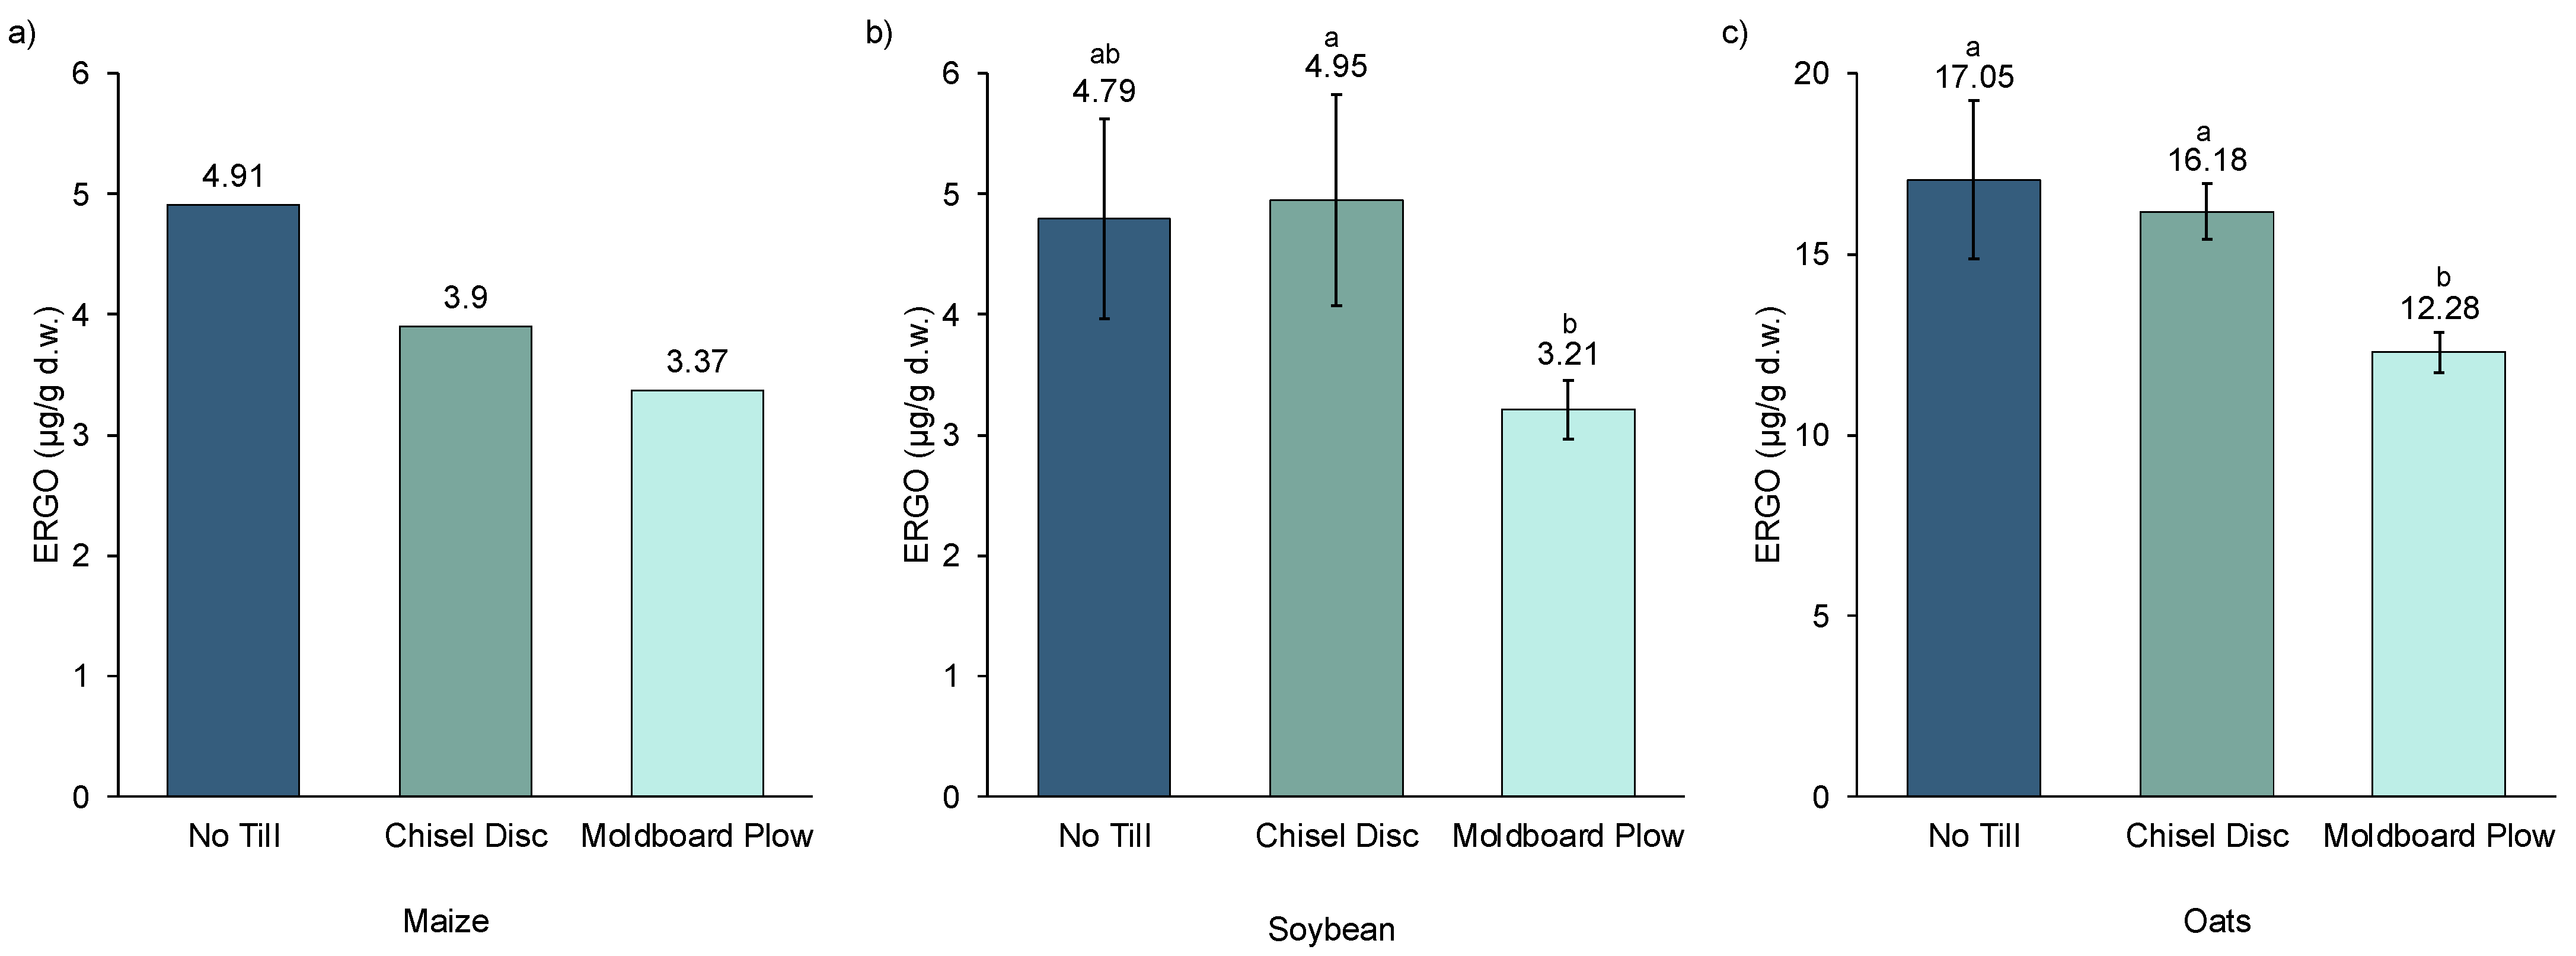

Figure 3.
Ergothioneine production per hectare of crops (a) maize (2018), (b) soybean (2019), and (c) oats (2020) grown using different tillage methods; different letters above the bars indicate significant difference (p > 0.05) within each crop type, error bars represent the standard deviation of each tillage type.
The authors apologize for any inconvenience caused and state that the scientific conclusions are unaffected. This correction was approved by the Academic Editor. The original publication has also been updated.
Reference
- Beelman, R.B.; Richie, J.P., Jr.; Phillips, A.T.; Kalaras, M.D.; Sun, D.; Duiker, S.W. Soil Disturbance Impact on Crop Ergothioneine Content Connects Soil and Human Health. Agronomy 2021, 11, 2278. [Google Scholar] [CrossRef]
Publisher’s Note: MDPI stays neutral with regard to jurisdictional claims in published maps and institutional affiliations. |
© 2022 by the authors. Licensee MDPI, Basel, Switzerland. This article is an open access article distributed under the terms and conditions of the Creative Commons Attribution (CC BY) license (https://creativecommons.org/licenses/by/4.0/).