Article

Genome-Wide Association Study for Abscission Failure of Fruit Pericarps (Stick-Tights) in Wild Macadamia Germplasm

1
Centre for Horticultural Science, Queensland Alliance for Agriculture & Food Innovation (QAAFI), Maroochy Research Facility, The University of Queensland, SCMC, P.O. Box 5083, Nambour, QLD 4560, Australia
2
Queensland Department of Agriculture and Fisheries, Maroochy Research Facility, SCMC, P.O. Box 5083, Nambour, QLD 4560, Australia
3
Centre for Horticultural Science, The University of Queensland, QAAFI, GPO Box 267, Brisbane, QLD 4001, Australia
*
Author to whom correspondence should be addressed.
Agronomy 2022, 12(8), 1913; https://doi.org/10.3390/agronomy12081913
Submission received: 19 July 2022 / Revised: 9 August 2022 / Accepted: 12 August 2022 / Published: 14 August 2022
(This article belongs to the Special Issue DNA-Informed Breeding in Fruit and Nut Crops)

Abstract

:
Macadamia pericarps that fail to abscise (‘stick-tights’) are an important trait to select against in breeding as they can harbour pests and diseases. Traditional macadamia breeding cycles are lengthy and expensive due to long juvenilities and large tree sizes. Thus, genome-wide association studies (GWAS) are an important investigative tool to identify candidate trait-linked markers to enable potential reductions in evaluation and selection cycles via marker-assisted selection (MAS) in young seedlings. This study assessed 199 wild macadamia germplasm accessions for stick-tight prevalence across two years. As the number of stick-tights per tree is limited by the number of nuts per tree, we conducted association analyses to identify SNPs linked with the number of stick-tights per tree, and examined whether such SNPs were also associated with, and thus confounded with, the number of nuts per tree. We also assessed associations with the proportion of stick-tights per total number of nuts. Thirty-two SNPs were associated with at least one of the stick-tight traits in one year (p < 0.001). Of all such SNPs, only one was associated with the number of nuts per tree (p < 0.001), indicating that most associations were not confounded with yield.

1. Introduction

Macadamia nut production is expanding globally [1]. The genus is native to the southern coast of Queensland and northern New South Wales, Australia [2,3], and consists of four species: Macadamia integrifolia Maiden & Betche, M. tetraphylla L.A.S. Johnson, M. ternifolia F. Muell, and M. jansenii C.L. Gross & P. H. Weston [2,4]. Nuts of M. ternifolia and M. jansenii are bitter and small in size [5,6]. Thus, cultivars are predominantly derived from M. integrifolia, M. tetraphylla, and their hybrids, of which, trees can grow to 15 m tall and 10 m wide [3]. The edible nut kernel is surrounded by a hard testa (shell) which is encased by a fibrous pericarp (husk). In Australia, most flowering occurs around August and September [7]. Abscission of developed fruit typically commences in March, although the rate and length of abscission patterns vary [7,8]. Some genotypes are prone to husk abscission failure, meaning that some husks and/or entire fruit remain in the tree canopy [2]. Such husks and/or fruit are known as ‘stick-tights’ [2]. Stick-tights enable overwintering of Pseudocercospora macadamiae [9], the fungus responsible for husk spot disease [10]. Husk spot is often listed as one of the five most limiting diseases to production by Australian growers [11] due to its potential to accelerate abscission of infected fruit [12,13]. Stick-tights are therefore an unfavourable trait in macadamia due to their provision of ongoing P. macadamiae inoculum when infected [9].
Despite stick-tights being a common trait in cultivars and breeding germplasm [2,14] the biological cause is unconfirmed [15]. In macadamia, fruit-detachment occurs at a zone of cells of reduced number and size on the pedicel [16]. In the case of stick-tights, it appears that this connective tissue dies [2] and/or the abscission layer fails to respond to factors that would typically induce cell separation [16]. For example, high temperatures and/or water stress may cause the husk tissue to dry, dehisce and senesce, preventing abscission from occurring, even after application of abscission-promoting chemicals [2,9,16]. Several plant growth regulators including ethylene, auxin and abscisic acid (ABA) have direct or indirect effects on plant organ abscission [17]. Although ethylene and ABA typically promote abscission, high local ratios of auxin concentration reduce responsiveness to ethylene [17].
Exogenous application of ethephon [(2-chloroethyl)phosphonic acid] can be metabolised by plants to produce ethylene, and has been demonstrated to increase fruit abscission in macadamia [18]. In cultivar ‘A16’, a combination of tree shaking and ethephon application has been successful in removing all fruit and stick-tights [19]. However, effectiveness of ethephon varies significantly depending on spray timing and genotype, likely influenced by inherent differences in phenology and thus hormonal ratios [17,18]. Additionally, while adoption of tree shaking has increased in the macadamia industry [20], a lack of detrimental effects on yield in the long term has not yet been confirmed [21]. Finally, hand-removal of stick-tights is time-intensive [9], and as such, unfeasible on a commercial scale. Thus, for stick-tight prone cultivars, husk spot is typically managed with prophylactic fungicide applications. As weather conditions conducive to P. macadamiae infection and/or poorly timed applications can hinder fungicide efficacy [12,13] and social pressure for the reduction in on-farm fungicides is increasing [22], stick-tight free cultivars offer an economic and eco-friendly option for avoidance of husk spot [9,14].
Stick-tight prevalence is selected against in Australian and Hawaiian macadamia breeding programs [2,23]. However, traditional macadamia breeding is costly due to long juvenility periods which contribute to long generation times, and large tree sizes which add to high trial maintenance costs and laborious and time-consuming phenotyping [3]. If associations between genetic markers and selection traits can be identified, marker-assisted selection (MAS) may reduce selection times in breeding programs and consequently enhance genetic gain [24]. Several studies have used single nucleotide polymorphism (SNP) markers in genome-wide association studies (GWAS) in macadamia [25,26,27,28]. Traits assessed include yield component traits in a breeding population [27,28], stick-tight prevalence scores (0–5) in a breeding population [26], and growth traits and nut characteristics in wild germplasm [25].
Although wild macadamia germplasm may provide diverse genetic resources for trait improvement in breeding [29], marker associations and genomic heritabilities for stick-tight prevalence traits have not previously been assessed or estimated using wild macadamia genotypes. Furthermore, as the number of nuts produced by a tree limits the opportunity for stick-tight formation, stick-tight prevalence may be confounded with the number of nuts produced. However, the total crop load per tree has not been accounted for in previous macadamia stick-tight assessments [26]. Therefore, this study aimed to use novel phenotyping methods to identify genetic markers associated with stick-tight prevalence in wild germplasm while accounting for the number of nuts produced.
Specifically, we aimed to identify SNPs that were significantly associated with stick-tight prevalence that were not significantly associated with, and thus, not confounded with the number of nuts produced. As an additional method of accounting for the number of nuts produced, we also assessed SNP associations with the proportion of stick-tights per estimated total number of nuts. Individual narrow-sense genomic heritabilities were estimated for the different traits to compare the degrees of additive genetic control over each.

2. Materials and Methods

2.1. Plant Materials and Trial Design

A subset of wild macadamia germplasm from the ex situ germplasm arboretum in Tiaro, Queensland was assessed in this study. The germplasm arboretum was established in 2001 by The National Macadamia Germplasm Conservation Program and consists of partially replicated rooted cuttings of wild accessions of the four species and interspecific hybrids, collected from multiple sites within the natural distribution of the genus [29,30]. The trees are planted at 3.5 m × 6 m row × column spacing as per a randomised near-complete block design, with two blocks containing eight sub-blocks each. All trees received drip-irrigation and a standard insecticide and fungicide program.
Trees utilised in the current study included 199 M. integrifolia, M. tetraphylla, and M. integrifolia × M. tetraphylla hybrid accessions as per species assignment by Mai, et al. [29]. To determine whether the same loci-trait associations could be identified across different accession panels, phenotypic and genotypic data were subset for GWAS as per (1) a combination of M. integrifolia, M. tetraphylla and M. integrifolia × M. tetraphylla hybrid accessions, (2) only M. integrifolia accessions and (3) only M. tetraphylla accessions (Table 1).

2.2. Trait Assessment

Phenotyping was conducted during the first week of September in 2020 and 2021, when most fruit abscission for the recent fruiting season was complete. The number of stick-tights per tree canopy (STC) was counted. Green nuts that were yet to abscise (still attached in the canopy) were counted and added to the number of abscised nuts on the ground under the canopy to form an estimate of harvestable yield (HY) for each tree each year. An estimate of stick-tight incidence (STI) was calculated as STC / ( STC   +   HY ) .

2.3. Genotyping and Association Analysis

In 2020, DNA from leaf samples were used for genotyping for SNP markers by using the Diversity Array Technology platform [29]. Methods of genotyping were explained in detail in Alam, et al. [31]. For each of the three panels, genotypic data were filtered to remove SNPs with <80% call rate and <2.5% minor allele frequency as per Mai [25], then imputed using the k-nearest neighbour method [32] with the raw.data function in the snpReady package, version 0.9.6 [33] in R, version 4.1.0 [34]. For the three panels, being combined, M. integrifolia and M. tetraphylla (Table 1), 2888, 2549 and 1544 SNPs were retained, respectively.
To determine whether significant marker associations were common across traits, years and panels, each trait (STC, HY, STI), for each year (2020, 2021), for each panel (combined, M. integrifolia and M. tetraphylla) were analysed separately. Thus, 18 analyses were performed. Marker–trait associations were tested using linear mixed models, with each SNP marker fitted individually as a fixed effect (modelled as 0, 1, or 2 for homozygous, heterozygous, and alternate homozygous genotypes, respectively) with the asreml function in the ASReml-R package, version 4.1.0.160 (VSN International Ltd.) [35]. A genomic relationship matrix (GRM) was constructed from the SNPs using the method of VanRaden [36] with the G.matrix function in the ASRgenomics package, version 1.0.0 [37]. The GRM was included as a random effect in every model to account for kinship and to enable estimation of additive genetic effects. Principal components analysis (PCA) was conducted on the combined panel SNP data set to obtain principal components (PCs) that explained genetic variation among accessions in base R, version 4.1.0. The first PC was fitted as a fixed effect in the combined panel models to account for population structure as per other multi-panel GWA studies [25,38,39]. Block, sub-block within block, row and column were included as random terms in all models to account for trial design. Residual plots were first checked by running the models without any of the markers fitted to determine whether transformations were necessary. Loge STC, loge HY and empirical logit transformed STI best fit the model assumptions, and thus were chosen for final analyses. As the denominator values for STI differed across trees, inverse variances were calculated and included as weights within STI models, as per Cox and Snell [40]. Models were fitted as follows:
y = W b + X g + Z g u g + Z o u o + e
where y is the vector of phenotype values, W is a design matrix allocating fixed effects to individuals, b is a vector of fixed effects (such as overall mean and PC), g is the marker fixed effect with design matrix X, u g is a vector of random genetic effects with u g ~ N ( 0 ,   σ g 2 G ) where G is the GRM, u o is a vector of other random effects (such as block, sub-block within block, row and column) and Z g and Z o are the respective design matrices for these random terms, and e is a vector of residuals with mean zero, assumed to be normally distributed. For STI, e is the known error that reflects the variance of the empirical logit [40]. This term is e ~ N ( 0 , V ) where V is a diagonal variance matrix with elements v i = ( M i + 1 ) ( M i + 2 ) M i ( X i + 1 ) ( M i X i + 1 ) where Mi is STC   +   HY and Xi is the number of stick-tights (STC). This is fitted in ASReml by specifying weights which are the inverses of v i .
Individual narrow-sense genomic heritabilities (h2) were estimated for each trait × year × panel combination from variance components ( h 2 = ( σ g 2 ) ( σ g 2 + σ e 2 ) ) from the described models, but without any markers fitted. The h2 estimates and their standard errors were estimated with the ASReml-R vpredict function for STC and HY. The same function was used to estimate h2 for STI variables (with σ e 2 = σ i 2 + v ¯ , where σ i 2 is the units variance and v ¯ is the mean of v i ), but as the STI models involved weighting, standard errors for h2 estimates were not obtained.
Quantile–quantile (Q-Q) plots were constructed to compare observed SNP p-values with those expected under a null hypothesis of no trait-associations to determine whether the models effectively accounted for population structure [41]. Manhattan plots were constructed to visualise SNP p-values. Three significance thresholds were considered: a stringent threshold calculated using the Bonferroni procedure, a suggestive false discovery rate of 5% calculated using the Benjamini and Hochberg [42] method, and finally, following initial inspection of significance results, an ad hoc putative threshold of −log10(p) > 3 (i.e., p < 0.001), as previously utilised by Mai [25].
For each significant SNP, the additive allelic effect of the minor allele was estimated from the relevant model on the transformed scale by obtaining the best linear unbiased estimate (BLUE) for that SNP. The BLUEs were then back-transformed for interpretability. On the presented scale (i.e., the back-transformed scale), positive allele effects indicate that presence of the minor allele was associated with increased trait values and negative allele effects indicate that the minor allele was associated with decreased trait values. The units of the minor allele effects are: STC = number of stick-tights, HY = number of nuts (including stick-tights), STI the quantity of increase or decrease in proportion of stick-tights/total crop load. As the estimated allele effects are additive, the presented allele effects represent the effect of one copy of the minor allele.
For significant SNPs with known locations, putative candidate genes were identified as those located within a window of ±10,000 nucleotides from a significant SNP using the National Center for Biotechnology Information (NCBI) Genome Data Viewer [43] Macadamia integrifolia SCU_Mint_v3 assembly.

3. Results

3.1. Phenotypic Variation

Based on raw, untransformed phenotypes, STC, HY, and STI were lower in M. tetraphylla than in M. integrifolia in both years (Table 2). In 2020, the minimum STC was zero for all three panels, and the maximum STI was one, indicating that for both M. tetraphylla and M. integrifolia, at least one accession was free of stick-tights, and in at least one accession, all fruit produced that year had become stick-tights (Table 2). In 2021, at least ten stick-tights were observed in all M. integrifolia accessions, whereas at least one M. tetraphylla accession contained none (Table 2). While the maximum HY and STI in M. tetraphylla and M. integrifolia accessions were similar in 2020, on average, both traits were higher in M. integrifolia (Table 2). In 2021, both the maximum and mean HY were far greater for M. integrifolia than for M. tetraphylla, but the maximum and mean STI for both panels were similar (Table 2).

3.2. Principal Components Analysis

From the combined panel PCA, the first PC (PC1) grouped the two species and their hybrids separately along the axes and explained 31% of the genetic variation (Figure S1). When fitted in the linear mixed models, the effect of PC1 was only significant for STC in 2020 (p-value = 0.03; Table 3). The remainder of the PCs explained ≤1% of the genetic variation each and were not significant for any trait × year combination of data (p-values > 0.05). Thus, only PC1 was retained in the final linear models of phenotypic data and was retained for all trait × year combinations for the combined panel to maintain consistency and allow comparisons across traits and years.

3.3. Heritabilities

Individual narrow-sense genomic heritability varied among traits, years, and panels (Table 4). Across all three panels, the highest estimates were for STC in 2021 (h2 = 0.42 − 0.51), however estimates were lower in 2020 for this trait (h2 = 0.26 − 0.36) (Table 4). Large variation in estimates for STI was observed, with estimates ranging from 0.02 (M. tetraphylla in 2020), to 0.39 (M. integrifolia in 2020). The only HY heritability above 0.20 was in 2020 for the M. tetraphylla panel, although standard errors for all HY heritability estimates were high (Table 4).

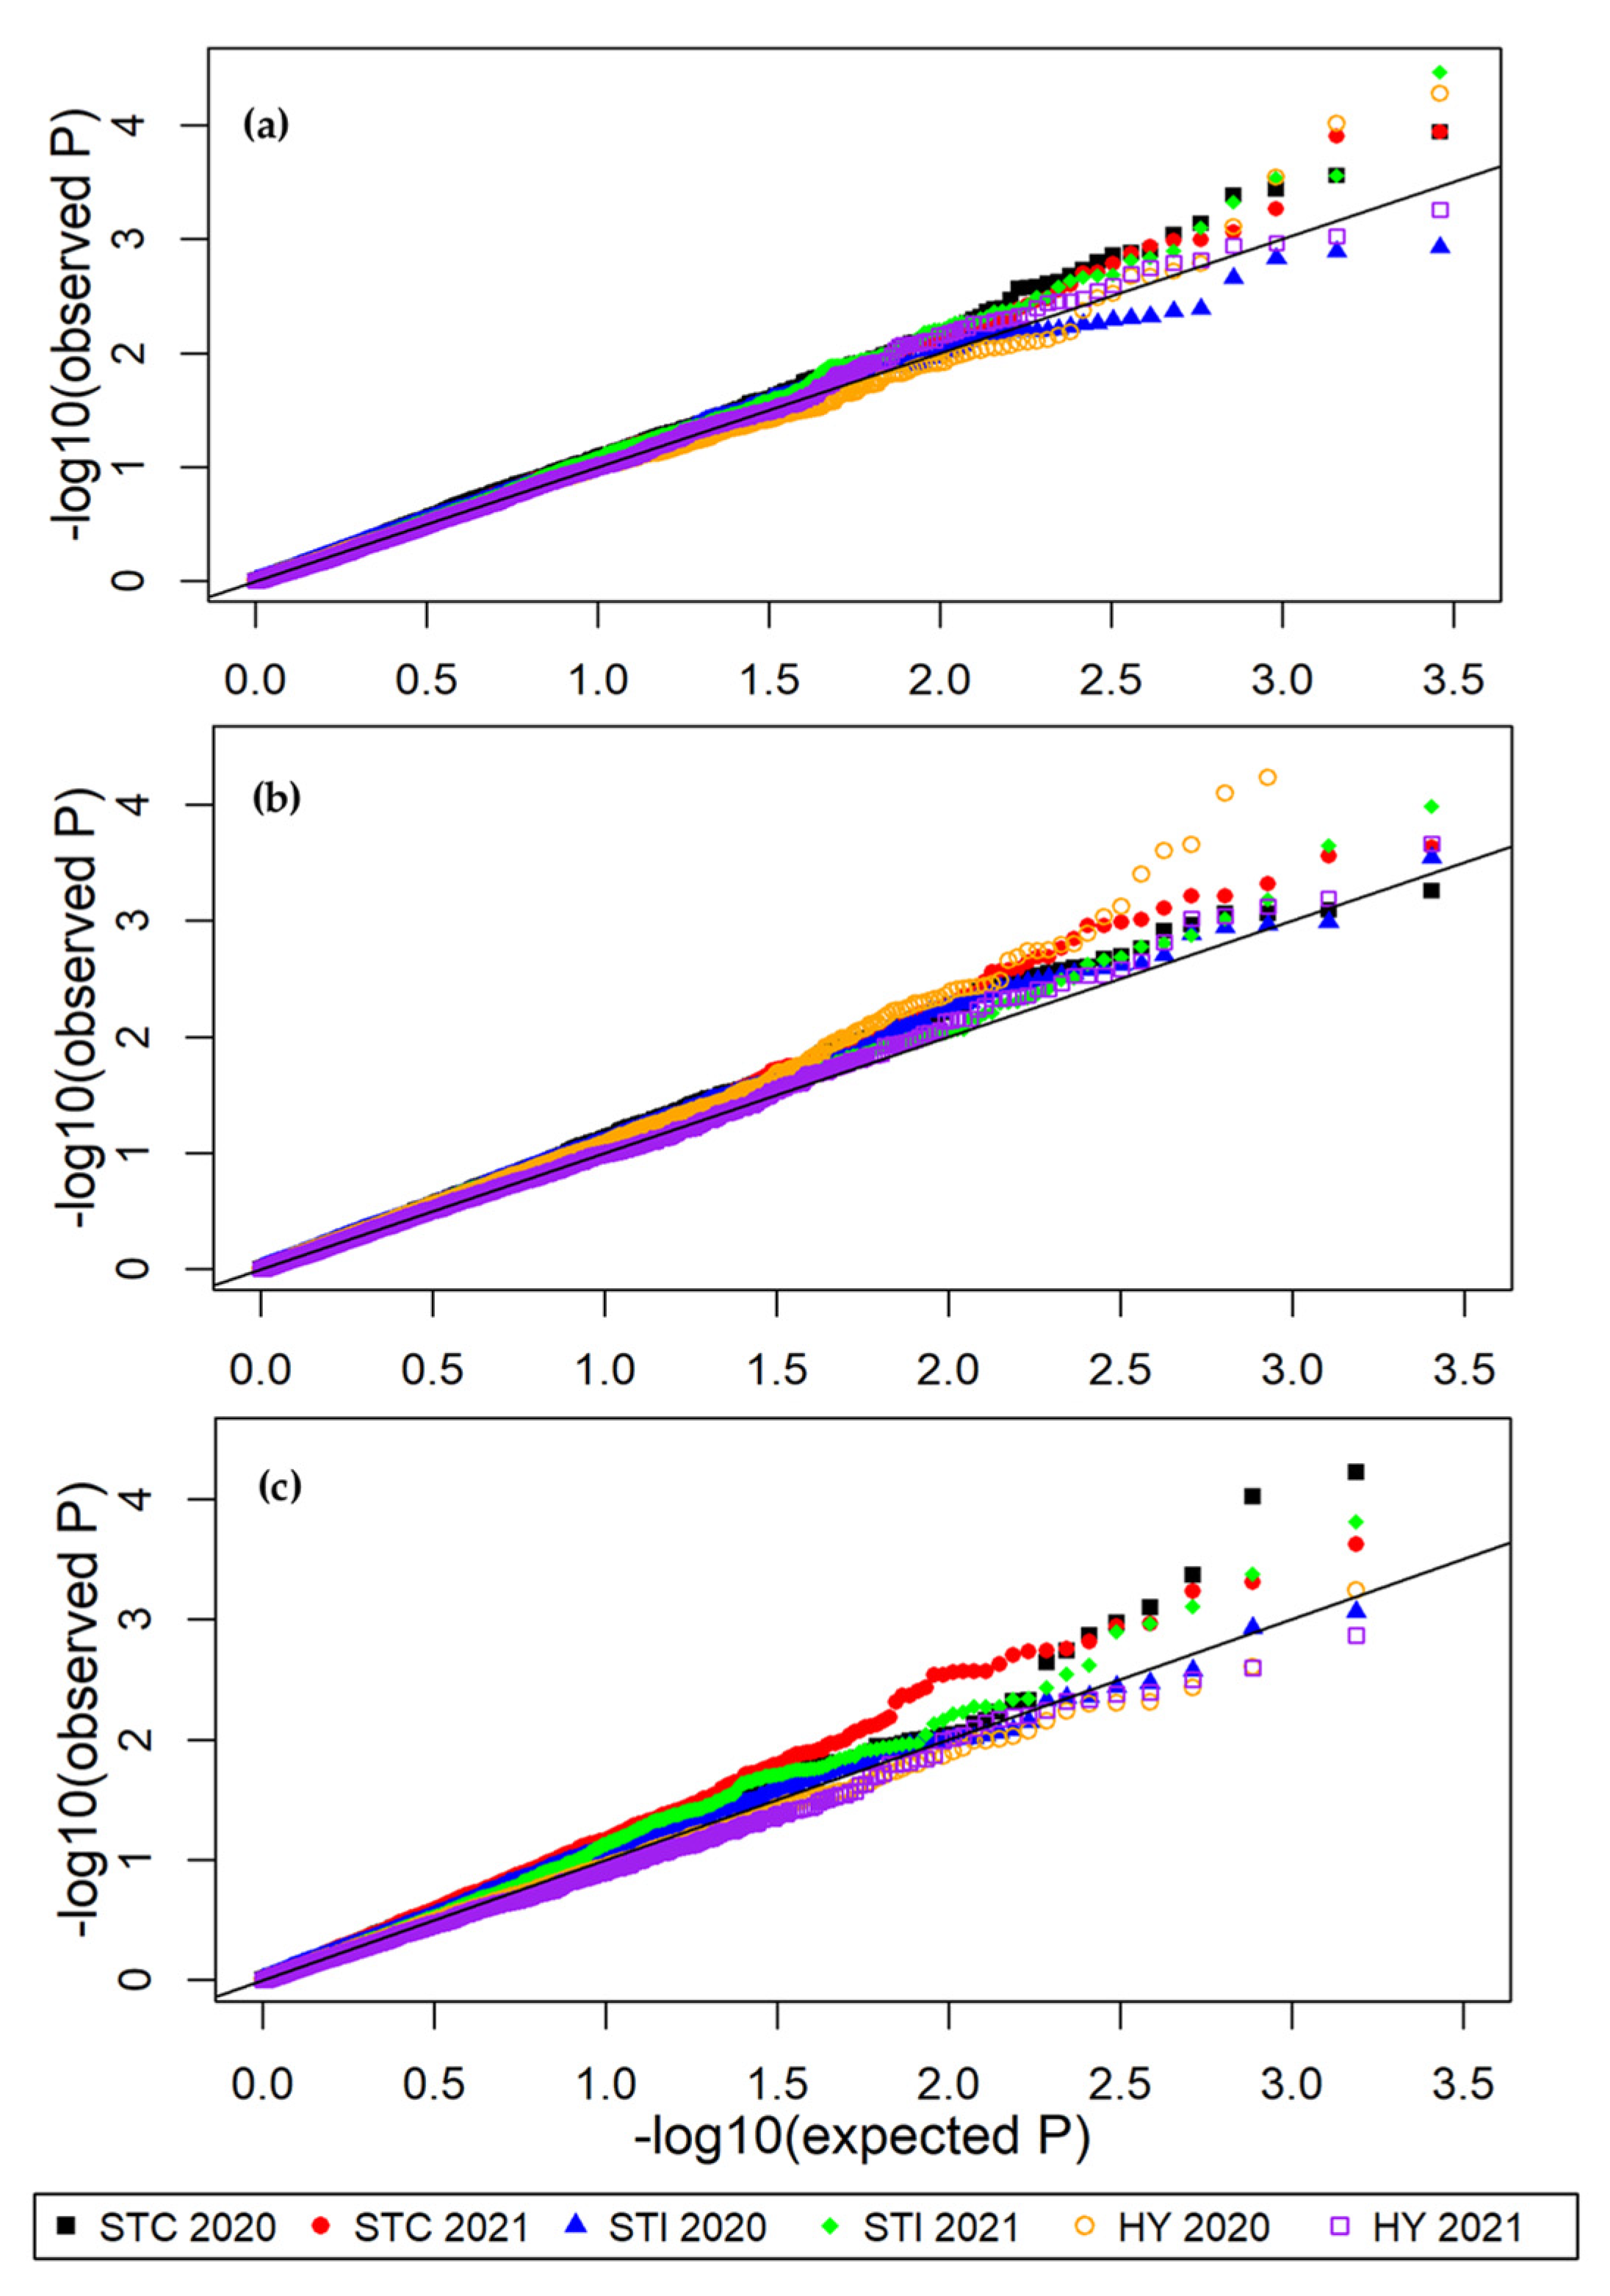
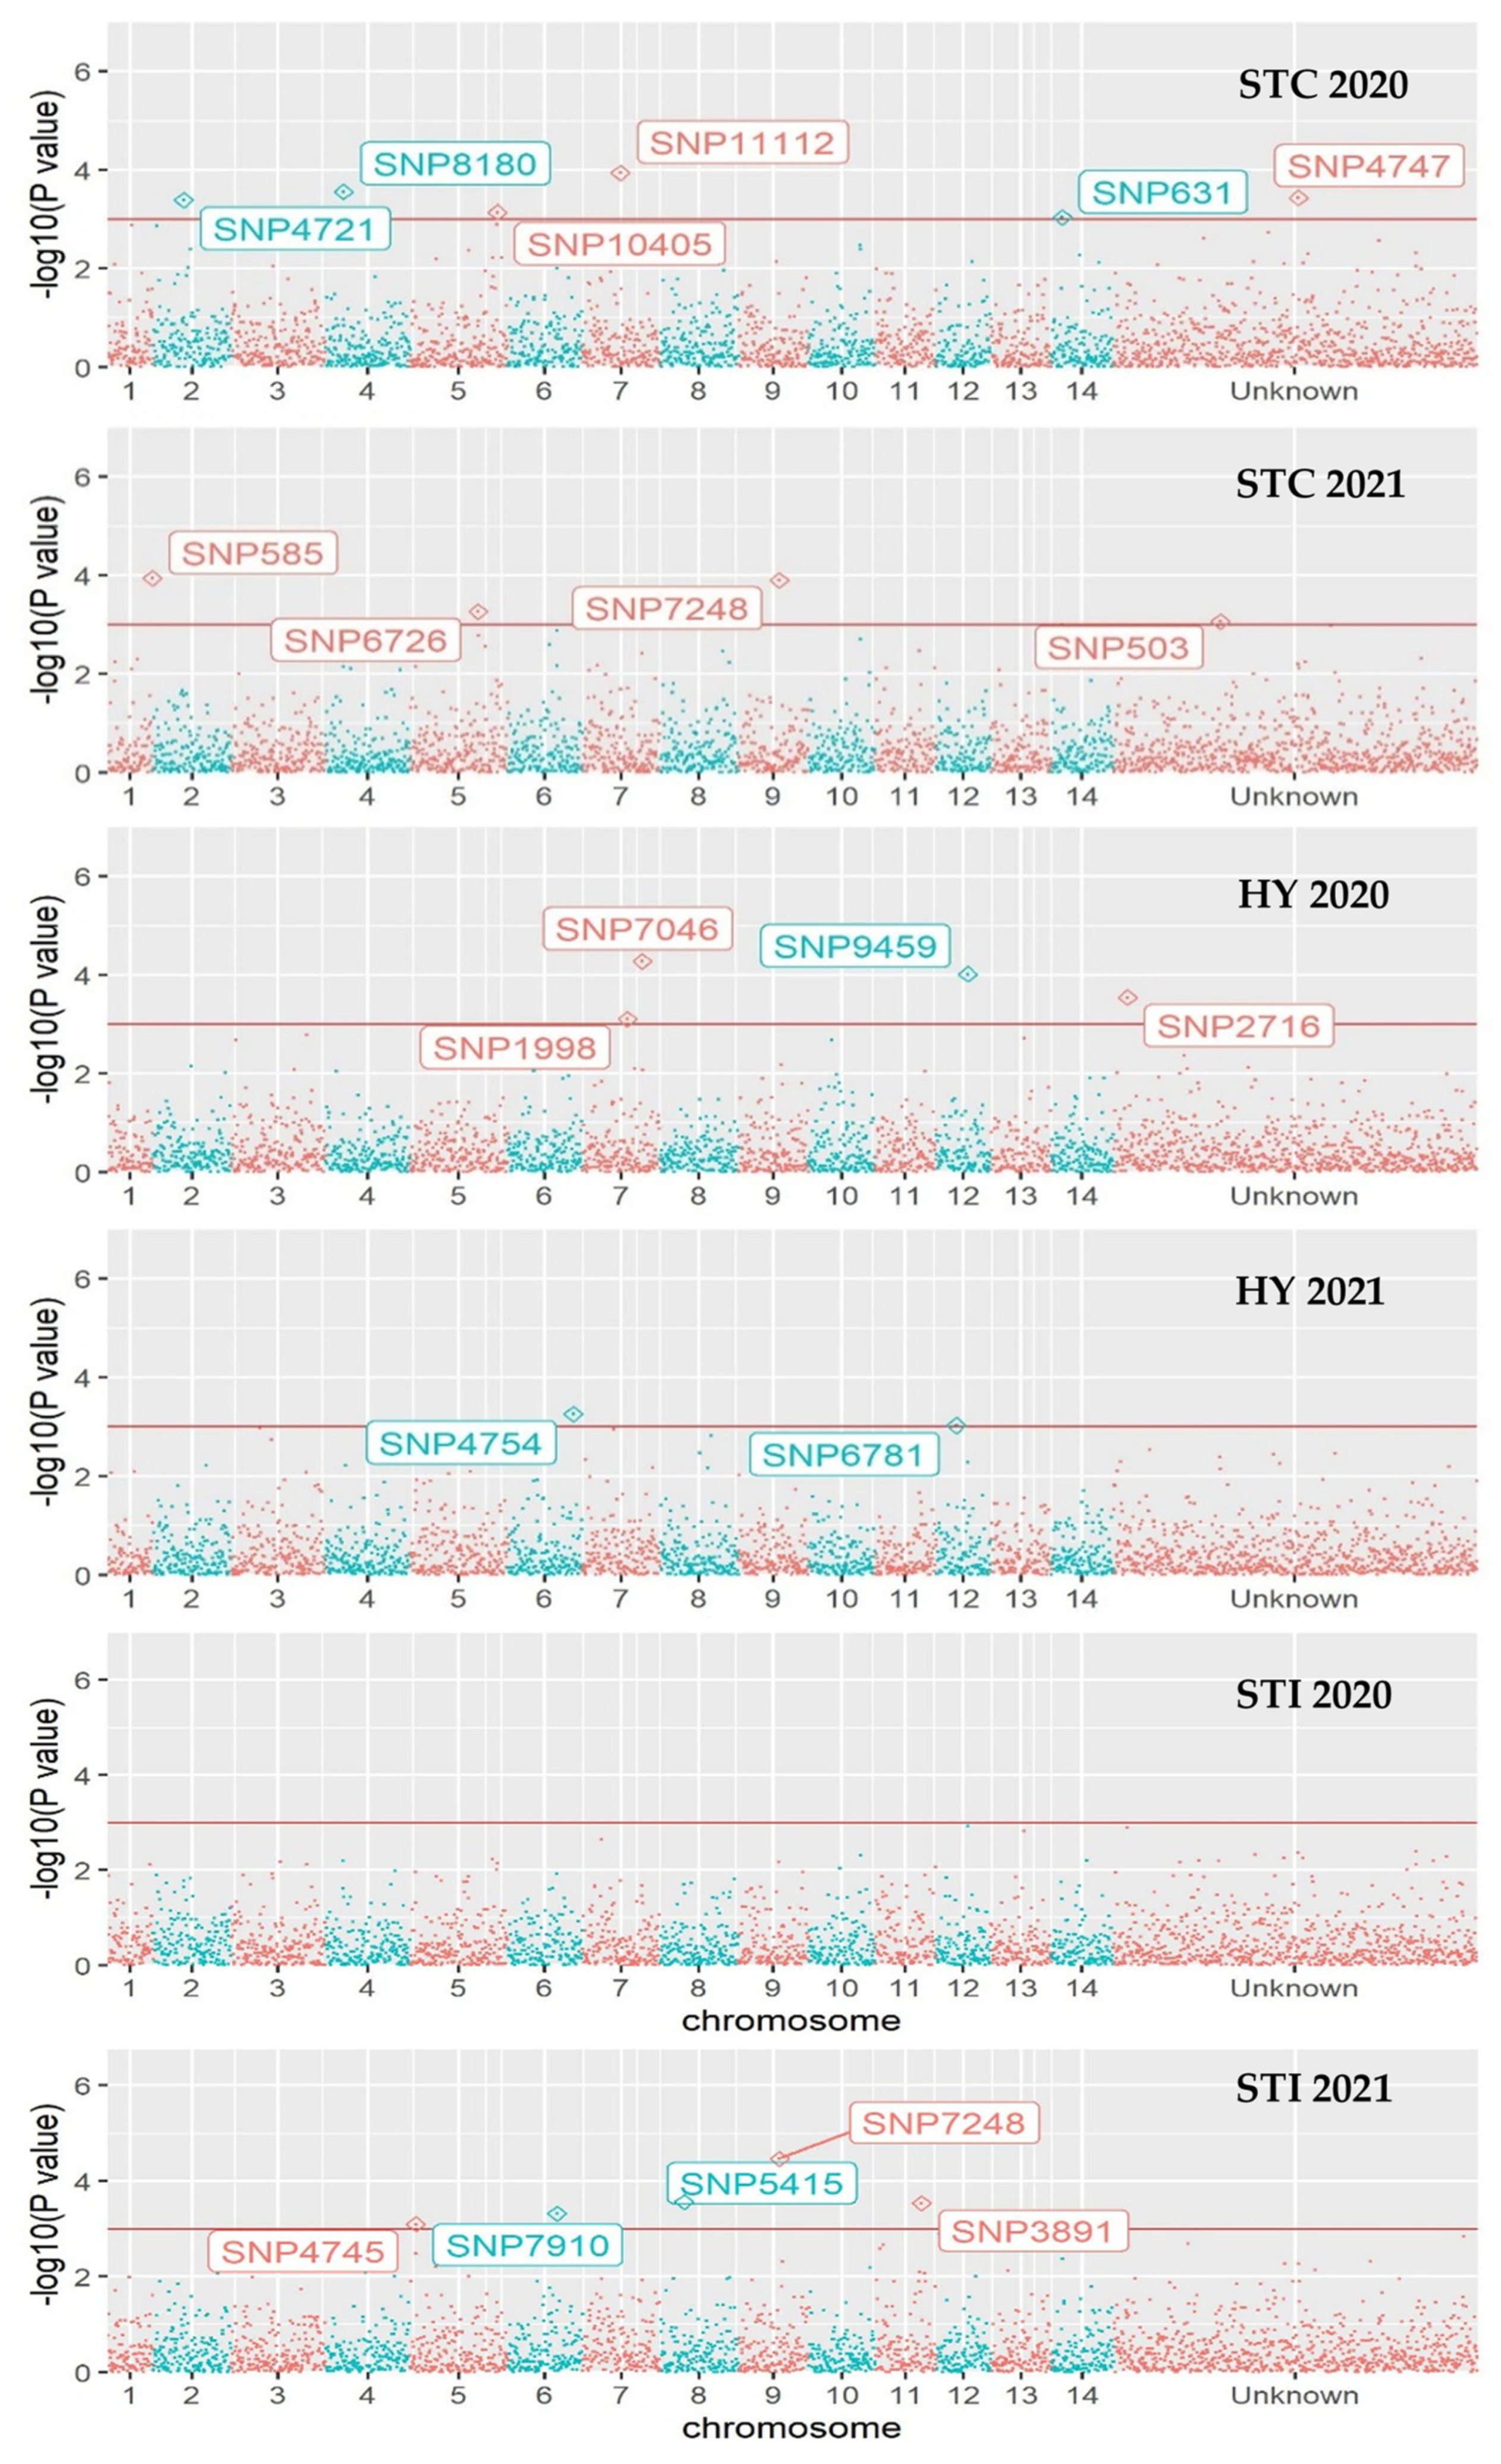
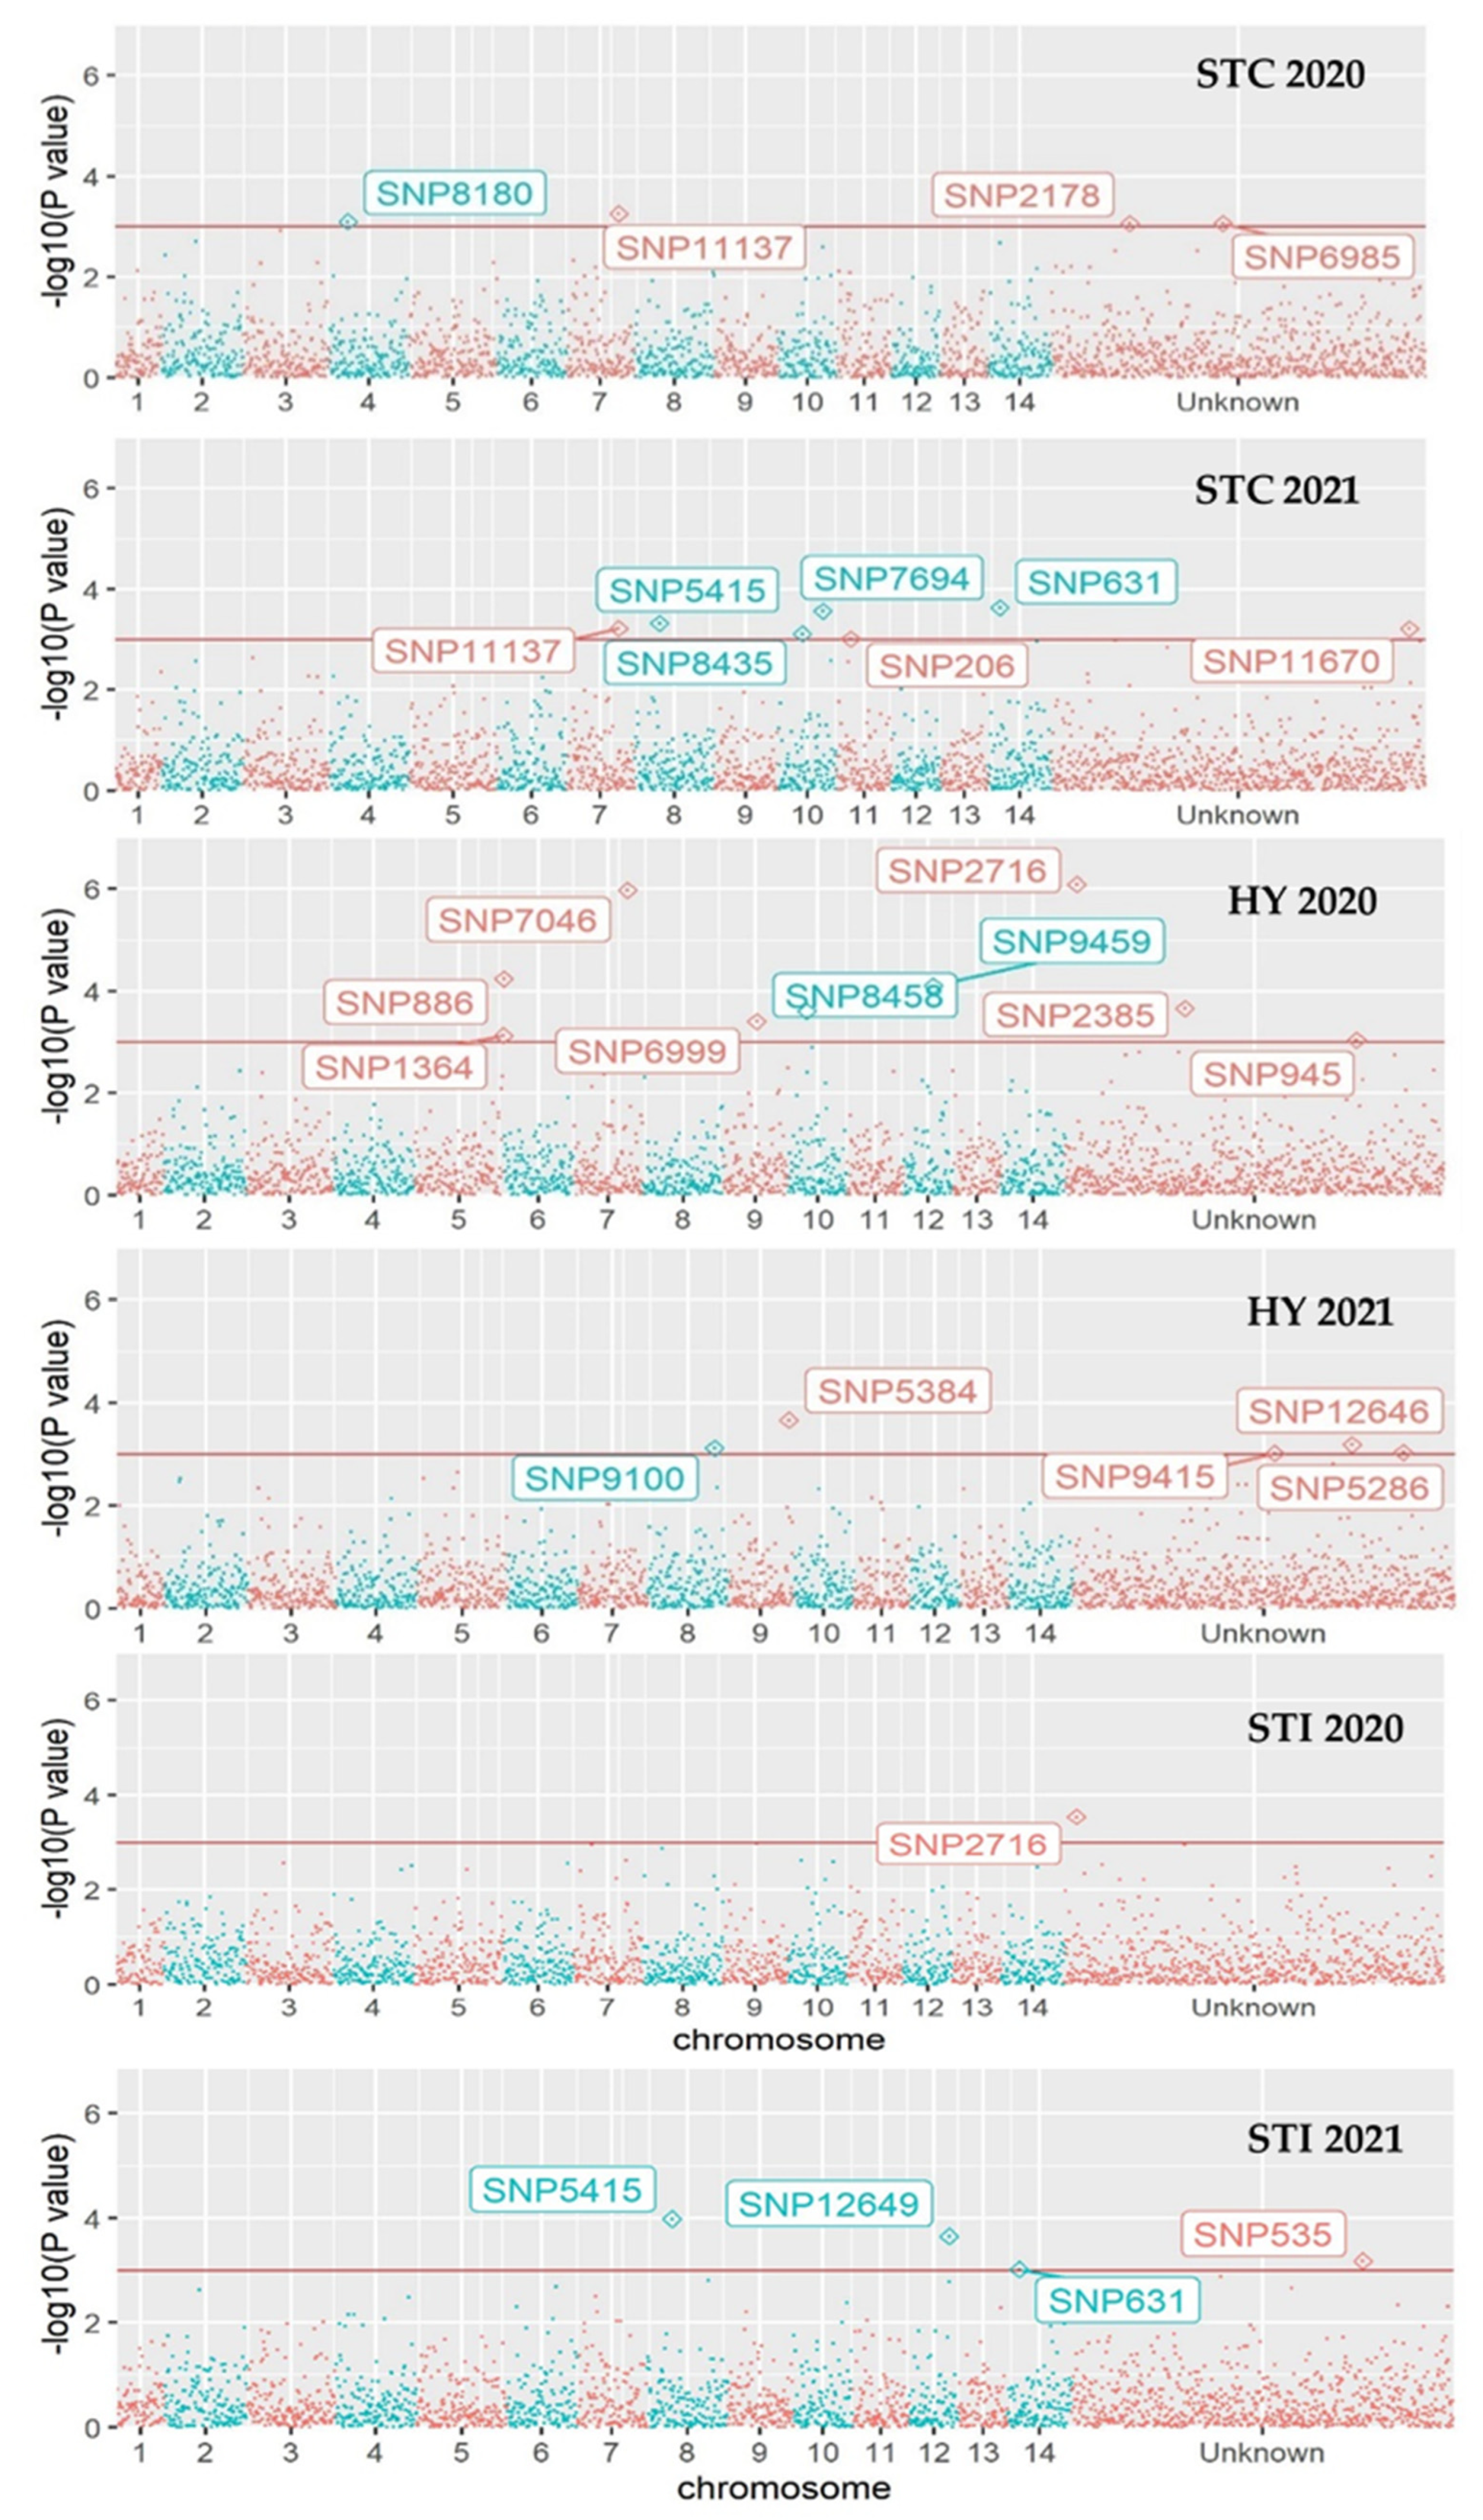
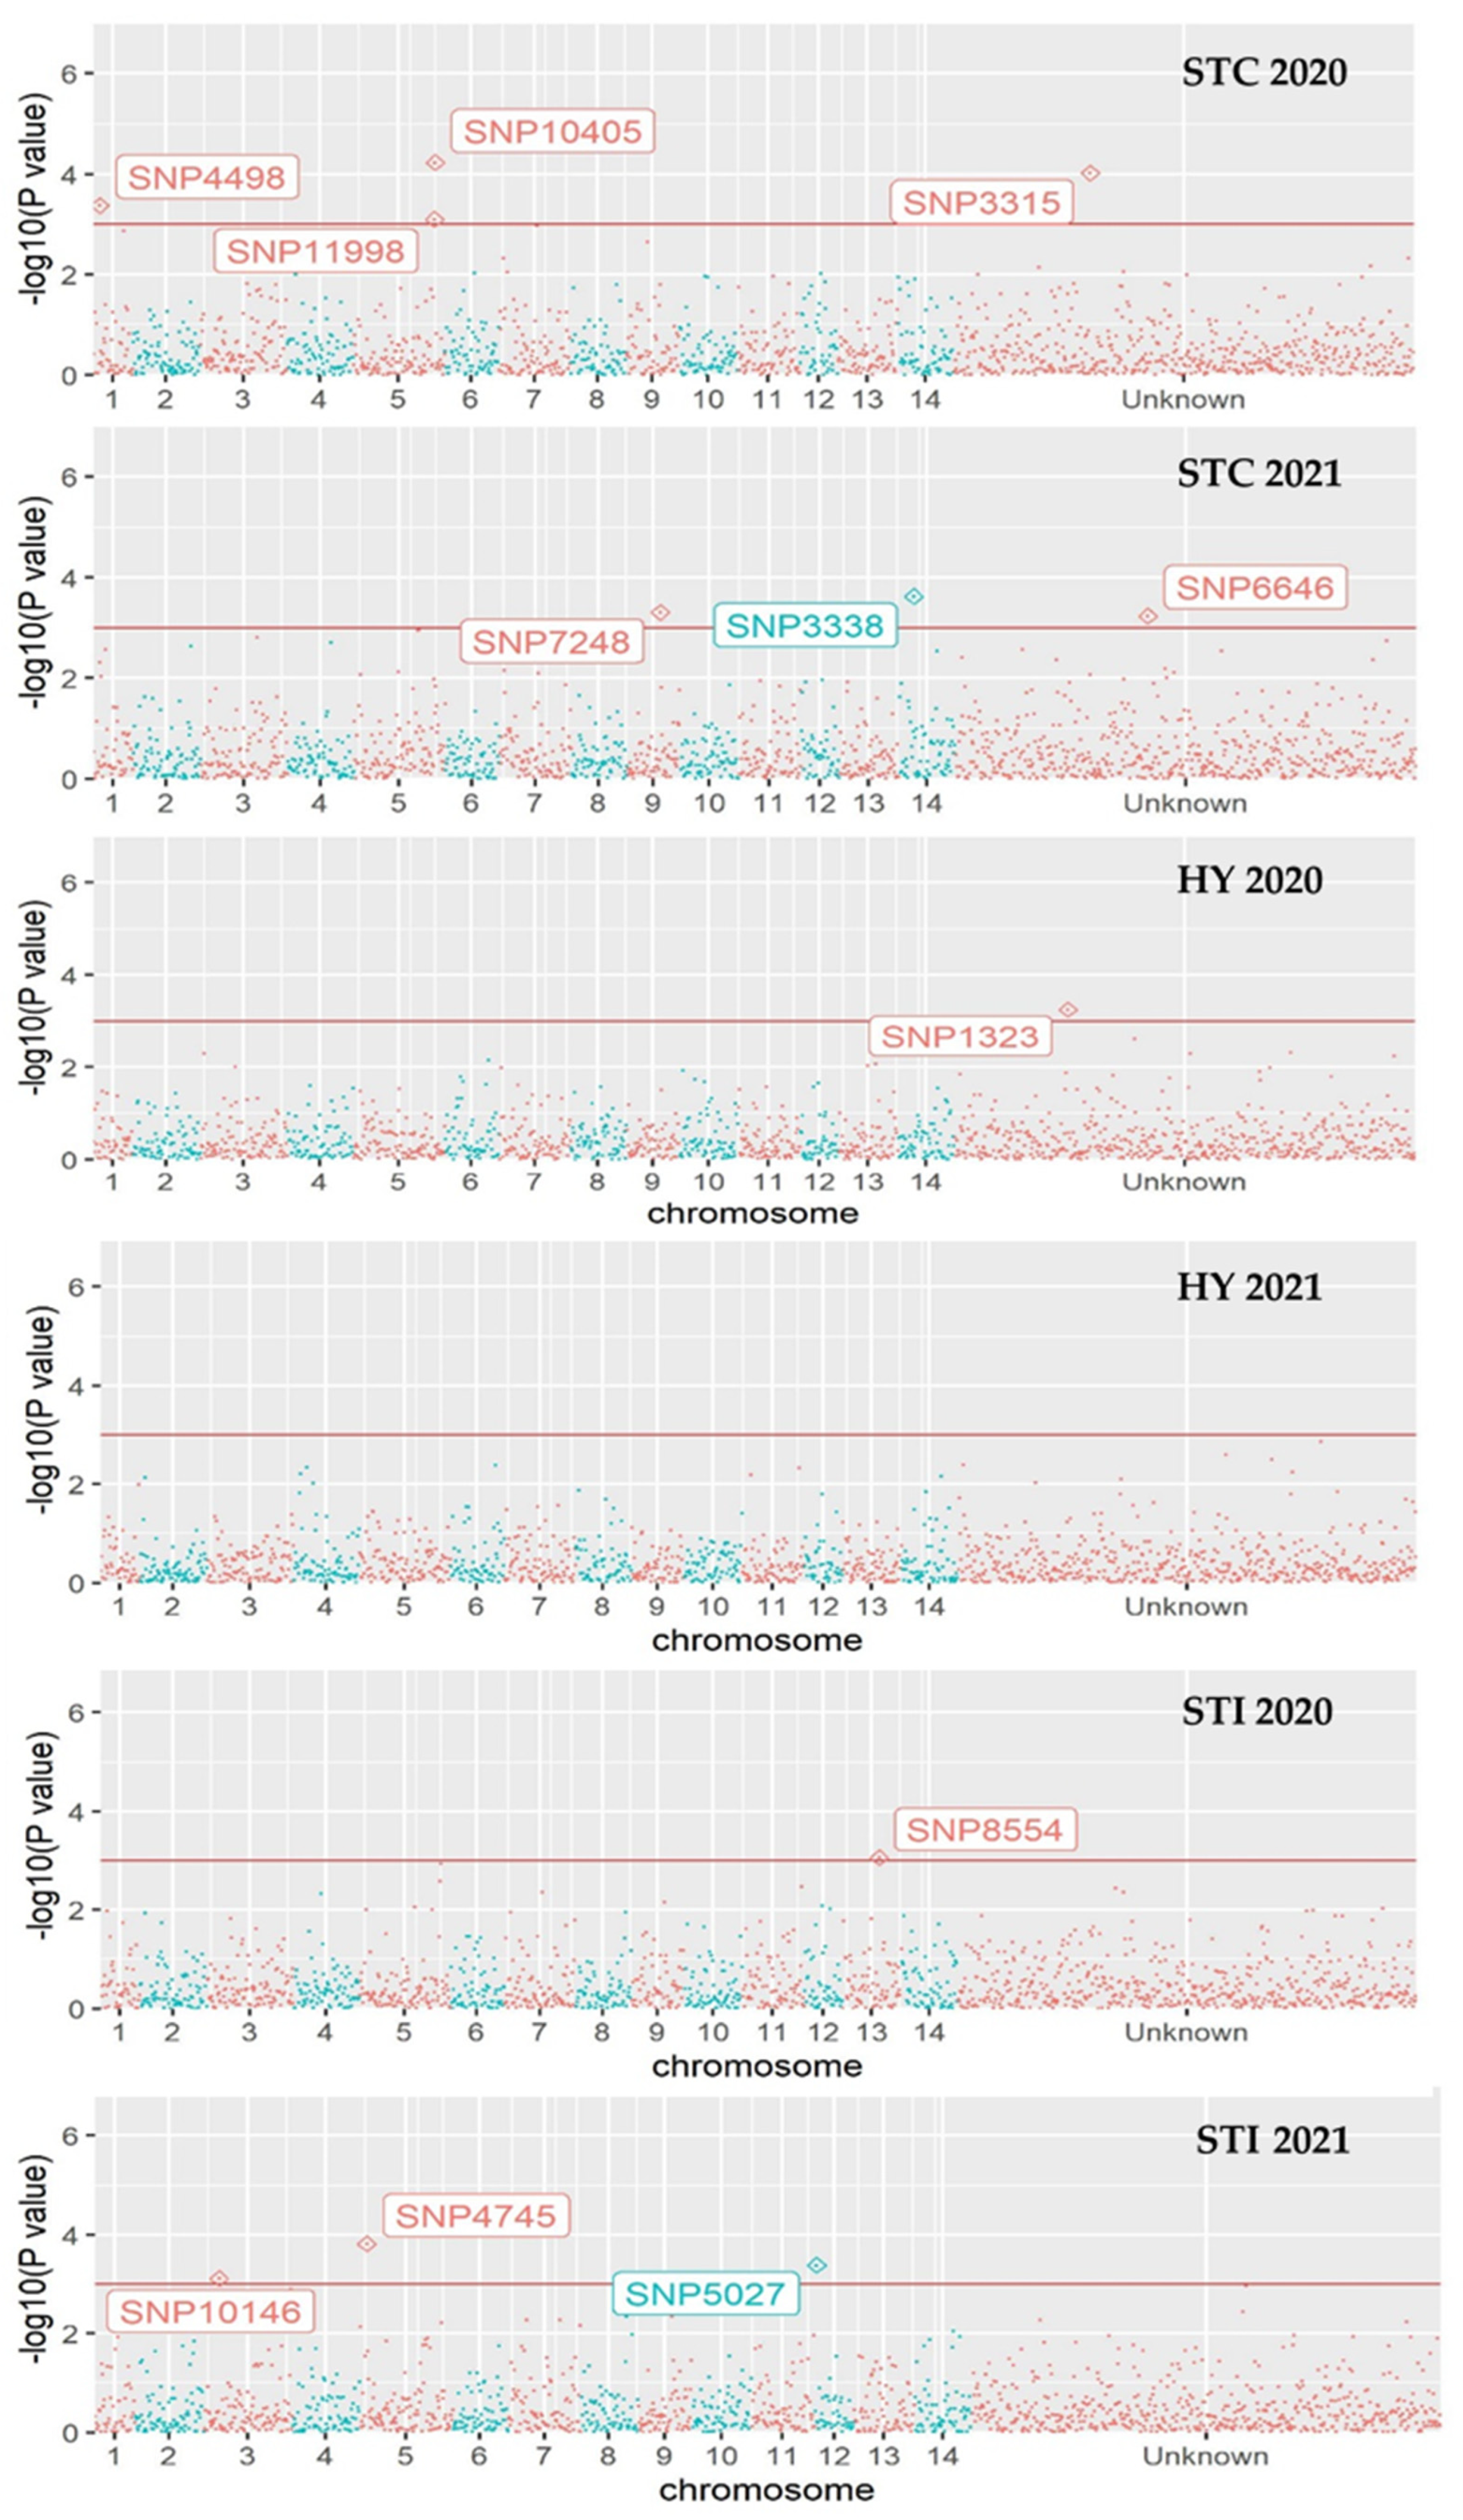
3.4. Genome-Wide Associations

All Q-Q plots for the combined panel indicated that population structure was effectively accounted for within the models, as at low p-values, the observed significance of markers did not deviate from what would be expected due to chance (Figure 1a). The Q-Q plots for the M. integrifolia and M. tetraphylla panels displayed similar trends for most traits (Figure 1b and 1c, respectively). However, for M. integrifolia 2020 STC, 2021 STC, 2020 STI, and 2020 HY, and for M. tetraphylla 2020 STC, 2021 STC, and 2021 STI, observed p-values of some markers were higher than expected under a null hypothesis of no trait-marker associations (Figure 1b,c).
At the ad hoc putative threshold of p < 0.001, 14 SNPs were significantly associated with at least one stick-tight trait (STC or STI) in one year (2020 or 2021) for the combined panel, 13 were identified for the M. integrifolia panel, and 11 for M. tetraphylla (Table 5; Figure 2, Figure 3 and Figure 4). Of all SNPs found to be associated with stick-tight traits at the ad hoc putative threshold of p < 0.001, the only SNP found to be also significant for HY (2020) was SNP2716 (p < 0.0001; Table 5; Figure 1b and Figure 3) indicating that this was the only association to be confounded with the number of nuts produced. No SNPs were significantly associated with stick-tight traits (STC or STI) at the Bonferroni or FDR thresholds; thus, the following mentioned associations are considered putative.
All markers found to be significant for STC had a positive effect on the trait, and effects of markers significant for STI varied (Table 5). For the combined panel, the most significant SNP had a negative effect for 2021 STI (SNP7248; p < 0.0001; Table 5; Figure 2). SNP7248 also had a significant positive effect for 2021 STC for the combined panel at the ad hoc p < 0.001 threshold (Table 5; Figure 2), and although the p-value for this SNP for STI 2020 was low (p = 6.83 × 10⁻³; Table 5), it was not significant for either trait in 2020 at the threshold of p < 0.001 (Figure 2). The same SNP had a significant positive effect for 2021 STC for the M. tetraphylla panel (p = 4.90 × 10⁻⁴; Table 5; Figure 4) but was not present in M. integrifolia panel post quality control filtering (Table 6).
For 2020 STC in the M. tetraphylla panel, the positive effect of SNP10405 was significant at p < 0.0001 (Table 5; Figure 4). The positive effect of the same SNP was also significant at p < 0.001 for 2020 STC for the combined panel (Table 5; Figure 2). The positive effect of SNP3315 was significant at p < 0.0001 for 2020 STC in the M. tetraphylla panel (Table 5) but was not significant for any other trait (Figure 4) and was not present in either of the other panels (Table 6). SNP4745 was significant at p < 0.0001 for 2021 STI for the combined and M. tetraphylla panels (both effects were negative) and although not significant at the −log10(p) > 3 threshold for any other trait or year, in the M. tetraphylla panel, its p-values were relatively low for 2021 STC (positive effect; p = 8.53 × 10⁻³) and 2020 STI (negative effect; p = 9.92 × 10⁻³) (Table 5; Figure 4). SNP4745 was not present in the M. integrifolia data (Table 6).
SNP11137 was the only marker significantly associated with any trait across both years (p < 0.001), with a positive effect on STC in M. integrifolia (Table 5; Figure 3)) but was not present in the combined or M. tetraphylla panels (Table 6). The only markers significantly associated with both STC and STI were SNP631 (positive and negative effects, respectively) and SNP5415 (positive effects for both STC and STI) in 2021 for M. integrifolia (Table 5; Figure 3). In the combined panel, the positive effect for SNP631 was also significant for STC in 2020 and the positive effect for SNP5415 was also significant for STI in 2021 (Table 5; Figure 2). Finally, the positive effect of SNP8180 was significant at p < 0.001 for STC in 2020 in the combined and M. integrifolia panels (Table 5; Figure 2 and Figure 3) and the same SNP had low p-values (p < 0.01) for all other stick-tight trait × year combinations in the combined panel (negative effects; Table 5) but was not present in the M. tetraphylla panel SNP set (Table 6).
Putative candidate genes were identified within ±10,000 nucleotides of 19 SNPs significant for STC or STI (Table S1). RNA titles were available for 15 of the candidate genes (Table S1).

4. Discussion

Marker-assisted selection (MAS) has the potential to reduce fruit tree breeding costs by allowing pre-screening and culling of young seedlings to reduce the number of trees to be planted for phenotyping [24,44]. This may be particularly valuable for macadamia, as their long juvenilities and large tree sizes make breeding programs expensive [3]. Although stick-tights appear to be under genetic control to some degree [2], genome-wide association studies (GWAS) for stick-tight traits were previously limited [26]. This is the first study to identify markers associated with stick-tight traits in wild macadamia germplasm. Additionally, it is the first to concurrently consider the total number of nuts produced per tree to examine whether significant stick-tight trait associations were confounded with crop load. Marker–trait associations and genomic heritabilities were examined in a combined panel of M. integrifolia, M. tetraphylla and M. integrifolia × M. tetraphylla hybrids as well as in M. integrifolia only and M. tetraphylla only accessions, with some commonalities and differences found among the three panels.
For a marker–trait association to be detected in GWAS, phenotypic variation must be present for the trait and a portion of the variation must be explained by genetic effects [45]. In this study, raw stick-tight counts (STC), stick-tight incidence (STI) and harvestable yield (HY) phenotypes varied within each panel, indicating a potential for identification of such associations. Among the panels, raw phenotypic ranges and means of STI appeared relatively similar, whereas raw STC and HY appeared greater in M. integrifolia accessions than in M. tetraphylla. A recent study based on the same trial site found that predicted mean tree height, trunk circumference and canopy width and volume were significantly higher for M. integrifolia accessions than M. tetraphylla [46]. Thus, differences in overall raw STC and HY between the two species-specific panels may be partially explained by larger tree sizes in M. integrifolia accessions and consequently, greater resources for crop load. The higher raw means of STC and HY in both species in the second year also indicated that in general, as crop load increased, the number of stick-tights did also. Although, the raw STI mean only increased in the M. tetraphylla panel, indicating that the degree of increase across years in stick-tights compared with that in total crop load was greater in M. tetraphylla.
In all panels, individual narrow-sense genomic heritability estimates demonstrated a low to moderate degree of genetic control over STC. Narrow-sense heritabilities such as those estimated for STC (h2 = 0.26 − 0.51) imply that genetic gain may be possible for the trait via mass selection [47]. Estimates for STI for the combined panel were low (h2 = 0.22 − 0.30), but still indicate some potential for genetic gain. While heritabilities for all traits fluctuated across years for all panels, the largest difference across years was the STI narrow-sense heritability estimate for M. tetraphylla. Standard errors of STC and HY estimates for the same panel were particularly large. In comparison, the higher number of accessions and replication in the M. integrifolia and combined panels may have enabled greater accuracy in estimations of genetic effects. As heritabilities are specific to the population they are derived from [48], and the estimates reported in this study were based on wild germplasm accessions, it would be valuable to determine whether similar estimates for STC and STI heritabilities are found in current breeding germplasm in future studies.
To our knowledge, the only report of stick-tight heritability estimates in a macadamia breeding population is that of h2 = 0.22 for stick-tight density per canopy area scores (0–5) based on one year of visual assessment data [26]. In the same study, significant differences were found among family and site predicted values [26]. Together, the heritability estimates obtained in the current study and results of O’Connor, et al. [26] support the Hardner, et al. [2] hypothesis of partial influences by both genetics and environment on stick-tight prevalence in macadamia. In further support of such, Drenth and Akinsanmi [15] reported a significant effect for irrigation on stick-tight prevalence in a preliminary trial based on one year of data in cultivar ‘A16′. However, when the trial was repeated for a second year, the irrigation effect obtained from the final analysis was insignificant [49]. Inconsistencies of effects across years observed by Drenth and Akinsanmi [49] and in the current study appear to support the idea that environmental effects, likely including water supply, have influence on stick-tight formation in at least some genotypes.
Differences in significance of SNP associations across years, such as those observed in the current study, are not uncommon in horticultural studies. For example, inconsistent SNPs were identified as significant for several horticultural traits across two years for spine and fruit stalk-end colour in cucumber [50] and for background skin colour change and firmness in apple [51]. In addition to environmental influences, another potential reason for such discrepancies is insufficient quality of phenotypic data [51]. In the current study, stick-tights were visually counted in almost 300 trees. Trees were not stripped of existing stick-tights prior to the trial as manual removal can take ~30 min per tree [9] and trees at the site are large [46]. As stick-tights can accumulate across years [15], pre-stripping of trees in future studies may reduce experimental error.
The small marker effect sizes may also have contributed to reduced power for detection of trait associations. Traits controlled by few loci with large effects are preferable for GWAS, as the power to detect associated markers is influenced by the effect size of the linked loci, as well as allelic frequency [45]. Detection power can also be limited by the linkage between markers and causal loci, SNP density and the number of accessions per panel [52]. Such factors may have contributed to a lack of significant SNP associations at the Bonferroni or FDR thresholds in this study. The relatively small number of SNPs per panel (<3000) and/or accessions per panel (<200) in the current study likely limited identification power. In comparison, in other crops such as apple [51], peach [53] and Eucalypt [39], the number of SNPs tested in GWA studies have been in the tens of thousands. However, as commercial domestication of macadamia is relatively young [54] and breeding programs are time-consuming and costly to run, the utilisation of available resources is important. Therefore, SNPs found significant for STC and STI at the p < 0.001 threshold should be investigated further, especially those that were found significant, or close to significant at the p < 0.001 threshold for more than one trait × year × panel combination. Alternatively, given genomic-based heritability estimates for STC were moderate, there may be evidence for many markers of small effect. As such, it may be worth investigating the use of genomic-selection for stick-tight traits, as previously demonstrated for yield in macadamia [55].
Despite the challenges involved in conducting and evaluating macadamia field trials, we identified several SNPs associated with stick-tight prevalence in species-specific and combined species wild germplasm panels. Importantly, most SNPs that were significant at the p < 0.001 threshold for STC or STI were not significant for HY, suggesting a lack of confoundedness with total nuts produced for these SNPs. Additionally, according to the Q-Q plots, we were able to effectively account for population structure within our combined species panel models. Combined panel GWA studies offer the potential to increase sample sizes, and as such, are becoming more widespread within plant science [38,39,56,57,58]. We found some significant SNPs that were common between the combined and M. integrifolia or the combined and M. tetraphylla panels. In each case, the SNP was not present in the alternative panel data set post-quality control filtering. To determine whether these SNPs and any of the others identified as noteworthy in this study can be of use in MAS in breeding programs, further work should be conducted to validate results and to identify whether the SNPs are present in target populations.
Minor allele frequencies (MAF) of significant SNPs should be checked in target populations, as rare alleles may occur in only a small number of individuals, thus limiting analytical power [59]. Where possible, validation should occur in larger populations, as sample sizes of some allelic states for some significant markers were low in the current study. Although SNPs with a MAF of less than 2.5% were removed during initial quality-control filtering, as imputation was undertaken post-filtering, final MAF was very low (<2.5%) for some of the significant SNPs. The same process was noted by O’Connor, et al. [28], who highlighted that while inferences from such marker associations should be treated with caution, if the markers were removed during filtering, they could not have been identified for further validation.
Post-marker validation, young seedlings could be screened for significant SNPs prior to field planting. All minor allele effects of SNPs that were significant for STC had positive effects on the trait, whereas minor allele effects of those significant for STI varied. Seedlings with allelic states associated with positive effects on both STC and STI could be culled, whereas seedlings with allelic states associated with positive effects on STC and with negative effects on STI could be retained for field testing. For example, the minor allele of SNP7248 had a positive effect for STC in 2021 in the combined and M. tetraphylla panels, but a negative effect for STI in the combined panel. Such effects may indicate that overall, accessions with the allele of interest at that locus had more stick-tights than accessions without it, but the number of stick-tights per total crop load for such accessions were typically less. In addition to SNP-validation and marker-assisted selection, further work should be conducted to validate the putative candidate genes identified in this study. Validation of candidate genes may contribute to a better understanding of genetic components and causal mechanisms of stick-tights.
In conclusion, while this study has highlighted some of the challenges faced in macadamia breeding, results obtained have provided further knowledge regarding selection for stick-tight prevalence and a base of information for marker and putative candidate gene validation trials. Low to moderate heritabilities for STC in M. integrifolia, M. tetraphylla and a combined panel of both species and their hybrids indicate potential for genetic gain via mass selection. Several SNPs that appear to be associated with STC and STI were detected, and most SNPs did not appear to be confounded with HY. Several putative candidate genes that may influence STC and STI were identified. Outcomes of this study can be used to guide the design of validation trials, which may ultimately contribute to a further understanding of the genetic control over stick-tight prevalence in macadamia and enable the use of MAS to reduce macadamia breeding costs.

Supplementary Materials

The following supporting information can be downloaded at: www.mdpi.com/article/10.3390/agronomy12081913/s1, Figure S1: The first and second principal components obtained from principal components analysis of wild macadamia accessions, Table S1: Candidate genes identified within a window of ±10,000 nucleotides from a SNP significantly associated with stick-tight trait count or proportion using the NCBI Genome Data Viewer Macadamia integrifolia SCU_Mint_v3 assembly.

Author Contributions

Conceptualisation, all authors; methodology, J.N., J.D.F., K.O. and B.T.; software, B.T.; validation, J.N. and J.D.F.; formal analysis, J.N., J.D.F. and K.O.; investigation, J.N.; resources, B.T.; data curation, J.N.; writing—original draft preparation, J.N.; writing—review and editing, all authors; visualization, J.N., J.D.F. and K.O.; supervision, B.T., M.A., O.A., K.O. and C.H.; project administration, B.T.; funding acquisition, B.T. All authors have read and agreed to the published version of the manuscript.

Funding

This research was funded by Hort Innovation, using the macadamia industry research and development levy and contributions from the Australian Government (Project No. MC19000). Hort Innovation is the grower owned, not-for-profit research and development corporation for Australian horticulture.

Institutional Review Board Statement

Not applicable.

Data Availability Statement

All the data generated or analysed during this study are available at https://doi.org/10.48610/a42f710, (accessed on 11 August 2022). The relevant contact is [email protected].

Acknowledgments

J.N. acknowledges the University of Queensland for the Australian Commonwealth Government Research Training Program scholarship. J.N. also acknowledges Wei Hu for bioinformatic analysis of marker data to identify chromosomal positions of the markers.

Conflicts of Interest

The authors declare no conflict of interest.

References

  1. INC Foundation. Nuts & Dried Fruits Statistical Yearbook 2020/2021; INC: New York, NY, USA, 2021; pp. 1–80. [Google Scholar]
  2. Hardner, C.; Peace, C.; Lowe, A.; Neal, J.; Pisanu, P.; Powell, M.; Schmidt, A.; Spain, C.; Williams, K. Genetic Resources and Domestication of Macadamia. In Horticultural Reviews; Janick, J., Ed.; John Wiley & Sons: Hoboken, NJ, USA, 2009; Volume 35, pp. 1–125. [Google Scholar]
  3. Topp, B.L.; Nock, C.J.; Hardner, C.M.; Alam, M.; O’Connor, K.M. Macadamia (Macadamia spp.) breeding. In Advances in Plant Breeding Strategies: Nut and Beverage Crops; Jain, J., Johnson, S.D., Eds.; Springer International Publishing: Cham, Switzerland, 2020; pp. 221–251. [Google Scholar]
  4. Peace, C. Genomics of Macadamia, a recently domesticated tree nut crop. In Genomics of Tropical Crop Plants; Moore, P.H., Ming, R., Eds.; Springer: New York, NY, USA, 2008; Volume 1, pp. 313–332. [Google Scholar]
  5. Dahler, J.; McConchie, C.; Turnbull, C. Quantification of cyanogenic glycosides in seedlings of three Macadamia (Proteaceae) species. Aust. J. Bot. 1995, 43, 619–628. [Google Scholar] [CrossRef]
  6. Gross, C.L. Macadamia. In Flora of Australia; McCarthy, P., Ed.; Australian Nature Conservation Agency: Melbourne, Australia, 1995; Volume 1, pp. 419–425. [Google Scholar]
  7. Boyton, S.; Hardner, C. Phenology of flowering and nut production in macadamia. In Proceedings of the International Symposium on Tropical and Subtropical Fruits, Cairns, Australia, 30 April 2002; pp. 381–387. [Google Scholar]
  8. Trueman, S.; Richards, S.; McConchie, C.; Turnbull, C. Relationships between kernel oil content, fruit removal force and abscission in macadamia. Aust. J. Exp. Agric. 2000, 40, 859–866. [Google Scholar] [CrossRef]
  9. Miles, A.K.; Akinsanmi, O.A.; Aitken, E.A.B.; Drenth, A. Source of Pseudocercospora macadamiae inoculum in macadamia trees and its use for characterising husk spot susceptibility in the field. Crop Prot. 2010, 29, 1347–1353. [Google Scholar] [CrossRef]
  10. Beilharz, V.; Mayers, P.; Pascoe, I. Pseudocercospora macadamiae sp. nov., the cause of husk spot of macadamia. Australas. Plant Pathol. 2003, 32, 279–282. [Google Scholar] [CrossRef]
  11. Department of Agriculture and Fisheries. Macadamia Industry Benchmark Report 2009 to 2020 Seasons; MC18002; Queensland Government: Brisbane, Australia, 2021.
  12. Akinsanmi, O.; Drenth, A. Economic returns from fungicide application to control husk spot of macadamia in Australia is influenced by spray efficiency, rates and costs of application. Crop Prot. 2012, 41, 35–41. [Google Scholar] [CrossRef]
  13. Akinsanmi, O.; Miles, A.; Drenth, A. Timing of fungicide applications for control of husk spot caused by Pseudocercospora macadamiae in macadamia. Plant Dis. 2007, 91, 1675–1681. [Google Scholar] [CrossRef]
  14. Akinsanmi, O.; Topp, B.; Drenth, A. Pericarps retained in the tree canopy and stomatal abundance are components of resistance to husk spot caused by Pseudocercospora macadamiae in macadamia. Euphytica 2012, 185, 313–323. [Google Scholar] [CrossRef]
  15. Drenth, A.; Akinsanmi, O. Integrated Management of Husk Spot Disease (Pseudocercospora macadamiae) in Macadamias; MC03007; The University of Queensland: Brisbane, Australia, 2007. [Google Scholar]
  16. McConchie, C.; Turnbull, C.; Trueman, S. Morphology of the abscission layer in macadamia fruit. In Control of Nut Abscission in Macadamia; Turnbull, C.J.N., Trueman, J.D., Wilkie, J.D., McConchie, C.A., Eds.; Horticulture Australia Ltd: Sydney, Australia, 2003; pp. 106–120. [Google Scholar]
  17. Taylor, J.E.; Whitelaw, C.A. Tansley Review No. 127. Signals in Abscission. New Phytol. 2001, 151, 323–339. [Google Scholar] [CrossRef]
  18. Salter, B.; Wilkie, J.D.; Wiltshire, N.; Forrester, R.; McConchie, C. Fruit and Leaf Abscission of Five Macadamia Cultivars Following the Application of Ethephon at Two Concentrations and Two Spray Volumes; CSIRO: Canberra, Australia, 2005; pp. 29–42. [Google Scholar]
  19. Trueman, S.J.; McConchie, C.A.; Turnbull, C.G.N. Ethephon promotion of crop abscission for unshaken and mechanically shaken macadamia. Aust. J. Exp. Agric. 2002, 42, 1001–1008. [Google Scholar] [CrossRef]
  20. Nichols, J. Macadamia Tree Shaking Replaces Fungicides in Eliminating Spread of Costly Nut Disease. Available online: https://www.abc.net.au/news/rural/2020-08-25/macadamia-disease-husk-spot-tree-shaker/12588842 (accessed on 11 August 2022).
  21. Trueman, S.J. Yield responses to ethephon for unshaken and mechanically shaken macadamia. Aust. J. Exp. Agric. 2003, 43, 1143–1150. [Google Scholar] [CrossRef]
  22. Akinsanmi, O.A.; Drenth, A. Sustainable control of husk spot of macadamia by cultural practices. Acta Hortic. 2016, 1109, 231–236. [Google Scholar] [CrossRef]
  23. Topp, B.; Hardner, C.; Neal, J.; Kelly, A.; Russell, D.; McConchie, C.; O’Hare, P. Overview of the Australian macadamia industry breeding program. Acta Hortic. 2016, 1127, 45–50. [Google Scholar] [CrossRef]
  24. O’Connor, K.; Hayes, B.; Topp, B. Prospects for increasing yield in macadamia using component traits and genomics. Tree Genet. Genomes 2018, 14, 1–14. [Google Scholar] [CrossRef]
  25. Mai, T. Genomic-Assisted Exploitation of Wild Germplasm for Improvement of Macadamia. Ph.D. Thesis, The University of Queensland, St Lucia, Australia, 2021. [Google Scholar]
  26. O’Connor, K.; Hayes, B.; Alam, M.; Topp, B. Variability, heritability, and genetic markers associated with disease harbouring stick tight husks in macadamia. In Proceedings of the TropAg International Agriculture Conference, Brisbane, Australia, 20–22 November 2017. [Google Scholar]
  27. O’Connor, K.; Hayes, B.; Hardner, C.; Alam, M.; Topp, B. Selecting for nut characteristics in macadamia using a genome-wide association study. HortScience 2019, 54, 629–632. [Google Scholar] [CrossRef]
  28. O’Connor, K.; Hayes, B.; Hardner, C.; Nock, C.; Baten, A.; Alam, M.; Henry, R.; Topp, B. Genome-wide association studies for yield component traits in a macadamia breeding population. BMC Genom. 2020, 21, 199. [Google Scholar] [CrossRef]
  29. Mai, T.; Alam, M.; Hardner, C.; Henry, R.; Topp, B. Genetic structure of wild germplasm of macadamia: Species assignment, diversity and phylogeographic relationships. Plants 2020, 9, 714. [Google Scholar] [CrossRef]
  30. Hardner, C.; Pisanu, P.; Boyton, S. National Macadamia Conservation Program; MC99029; Horticulture Australia: Brisbane, Australia, 2004. [Google Scholar]
  31. Alam, M.; Neal, J.; O’Connor, K.; Kilian, A.; Topp, B. Ultra-high-throughput DArTseq-based silicoDArT and SNP markers for genomic studies in macadamia. PLoS ONE 2018, 13, e0203465. [Google Scholar] [CrossRef]
  32. Hastie, T.; Tibshirani, R.; Narasimhan, B.; Chu, G. impute: Imputation for Microarray Data, R Package Version 1.66.0. 2021. Available online: https://cran.r-project.org/web/packages/impute/index.html (accessed on 11 August 2022).
  33. Granato, I.; Firitsche-Neto, R. snpReady: Preparing Datasets in Order to Run Genomic Analysis, R Package Version 0.9.6. 2018. Available online: https://cran.r-project.org/web/packages/snpReady/index.html (accessed on 11 August 2022).
  34. R Core Team. R: A Language and Environment for Statistical Computing; R Foundation for Statistical Computing: Vienna, Austria, 2021. [Google Scholar]
  35. Butler, D. Asreml: Fits the Linear Mixed Model; R Package Version 4.1.0.160; 2021. [Google Scholar]
  36. VanRaden, P. Efficient methods to compute genomic predictions. J. Dairy Sci. 2008, 91, 4414–4423. [Google Scholar] [CrossRef]
  37. Gezan, S.; de Oliveira, A.; Murray, D. ASRgenomics: An R Package with Complementary Genomic Functions; R Package Version 1.0.0; 2021. [Google Scholar]
  38. Al-Tamimi, N.; Brien, C.; Oakey, H.; Berger, B.; Saade, S.; Ho, Y.; Schmöckel, S.; Tester, M.; Negraõ, S. Salinity tolerance loci revealed in rice using high-throughput non-invasive phenotyping. Nat. Commun. 2016, 7, 13342. [Google Scholar] [CrossRef]
  39. Müller, B.; de Almeida Filho, J.; Lima, B.; Garcia, C.; Missiaggia, A.; Aguiar, A.; Takahashi, E.; Kirst, M.; Gezan, S.; Silva-Junior, O.; et al. Independent and joint-GWAS for growth traits in Eucalyptus by assembling genome-wide data for 3373 individuals across four breeding populations. New Phytol. 2019, 221, 818–833. [Google Scholar] [CrossRef]
  40. Cox, D.; Snell, E. Analysis of Binary Data, 2nd ed.; Chapan and Hall: London, UK; New York, NY, USA, 1989. [Google Scholar]
  41. Wang, J.; Yu, J.; Lipka, A.; Zhang, Z. Interpretation of manhattan plots and other outputs of genome-wide association studies. In Genome-Wide Association Studies; Torkamaneh, D., Belzile, F., Eds.; Methods in Molecular Biology; Springer Nature: Berlin/Heidelberg, Germany, 2022; Volume 2481, pp. 63–82. [Google Scholar]
  42. Benjamini, Y.; Hochberg, Y. Controlling the false discovery rate: A practical and powerful approach to multiple testing. J. R. Stat. Soc. 1995, 57, 289–300. [Google Scholar] [CrossRef]
  43. National Center for Biotechnology Information. Genome Data Viewer: Macadamia integrifolia. Available online: https://www.ncbi.nlm.nih.gov/genome/gdv/browser/genome/?id=GCF_013358625.1 (accessed on 9 August 2022).
  44. Ru, S.; Main, D.; Evans, K.; Peace, C. Current applications, challenges, and perspectives of marker-assisted seedling selection in Rosaceae tree fruit breeding. Tree Genet. Genomes 2015, 11, 1–12. [Google Scholar] [CrossRef]
  45. Korte, A.; Farlow, A. The advantages and limitations of trait analysis with GWAS: A review. Plant Methods 2013, 9, 29. [Google Scholar] [CrossRef]
  46. Mai, T.; Hardner, C.; Alam, M.; Henry, R.; Topp, B. Phenotypic characterisation for growth and nut characteristics revealed the extent of genetic diversity in wild macadamia germplasm. Agriculture 2021, 11, 680. [Google Scholar] [CrossRef]
  47. Simmonds, N.W.; Smartt, J. Principles of Crop Improvement, 2nd ed.; Blackwell Science: Oxford, MA, USA, 2000. [Google Scholar]
  48. Falconer, D. Introduction to Quantitative Genetics; Longman Scientific & Technical: New York, NY, USA, 1960. [Google Scholar]
  49. Drenth, A.; Akinsanmi, O. Disease Management in Macadamia; MC07003; The University of Queensland: Brisbane, Australia, 2012. [Google Scholar]
  50. Hea-Young, L.; Jeong-Gu, K.; Byoung-Cheorl, K.; Kihwan, S. Assessment of the genetic diversity of the breeding lines and a genome wide association study of three horticultural traits using worldwide Cucumber (Cucumis spp.) germplasm collection. Agronomy 2020, 10, 1736. [Google Scholar] [CrossRef]
  51. McClure, K.A.; Gardner, K.M.; Douglas, G.M.; Song, J.; Forney, C.F.; DeLong, J.; Fan, L.; Du, L.; Toivonen, P.M.A.; Somers, D.J.; et al. A genome-wide association study of apple quality and scab resistance. Plant Genome 2018, 11, 1–14. [Google Scholar] [CrossRef] [PubMed]
  52. Zhu, C.; Gore, M.; Buckler, E.; Yu, J. Status and prospects of association mapping in plants. Plant Genome 2008, 1, 5–20. [Google Scholar] [CrossRef]
  53. Cao, K.; Zhou, Z.; Wang, Q.; Guo, J.; Zhao, P.; Zhu, G.; Fang, W.; Chen, C.; Wang, X.; Wang, X.; et al. Genome-wide association study of 12 agronomic traits in peach. Nat. Commun. 2016, 7, 13246. [Google Scholar] [CrossRef]
  54. Hardner, C. Macadamia domestication in Hawai‘i. Genet. Resour. Crop Evol. 2015, 63, 1411–1430. [Google Scholar] [CrossRef]
  55. O’Connor, K.M.; Hayes, B.J.; Hardner, C.M.; Alam, M.; Henry, R.J.; Topp, B.L. Genomic selection and genetic gain for nut yield in an Australian macadamia breeding population. BMC Genom. 2021, 22, 370. [Google Scholar] [CrossRef]
  56. Hoang, G.T.; Van Dinh, L.; Nguyen, T.T.; Ta, N.K.; Gathignol, F.; Mai, C.D.; Jouannic, S.; Tran, K.D.; Khuat, T.H.; Do, V.N.; et al. Genome-wide association study of a panel of vietnamese rice landraces reveals new QTLs for tolerance to water deficit during the vegetative phase. Rice 2019, 12, 4–20. [Google Scholar] [CrossRef] [PubMed]
  57. Phung, N.T.P.; Mai, C.D.; Hoang, G.T.; Truong, H.T.M.; Lavarenne, J.; Gonin, M.; Nguyen, K.L.; Ha, T.T.; Do, V.N.; Gantet, P.; et al. Genome-wide association mapping for root traits in a panel of rice accessions from Vietnam. BMC Plant Biol. 2016, 16, 64. [Google Scholar] [CrossRef] [PubMed]
  58. Zhao, K.; Tung, C.-W.; Eizenga, G.C.; Wright, M.H.; Ali, M.L.; Price, A.H.; Norton, G.J.; Islam, M.R.; Reynolds, A.; Mezey, J.; et al. Genome-wide association mapping reveals a rich genetic architecture of complex traits in Oryza sativa. Nat. Commun. 2011, 2, 467. [Google Scholar] [CrossRef] [PubMed]
  59. Gondro, C.; Lee, S.; Lee, H.; Porto-Neto, L. Quality control for genome-wide association studies. In Genome-Wide Association Studies and Genomic Prediction; Gondro, C., van der Werf, J., Hayes, B., Eds.; Springer Science: London, UK, 2013. [Google Scholar]
Figure 1. Quantile–quantile plots showing expected vs. observed log10(p) values for three macadamia traits in 2020 and 2021, for three panels: (a) M. integrifolia, M. tetraphylla, M. integrifolia × M. tetraphylla, (b) M. integrifolia, (c) M. tetraphylla. Trait × year combinations are represented by different symbols and colours. STC = loge(count of stick-tights), HY = harvestable yield; loge (count of nuts), STI = logit(stick-tight incidence (STC/(STC + HY)).
Agronomy 12 01913 g001
Figure 2. Manhattan plots showing distribution of SNPs across the macadamia genome and significance (−log10 p-value) of marker–trait associations for three traits in 2020 and 2021 in the combined panel (M. integrifolia, M. tetraphylla, M. integrifolia × M. tetraphylla accessions). STC = loge (count of stick-tights), HY = loge (harvestable yield (count of nuts)), STI = logit(stick-tight incidence (STC/(STC + HY)).
Agronomy 12 01913 g002
Figure 3. Manhattan plots showing distribution of SNPs across the macadamia genome and significance of marker–trait associations for three traits in 2020 and 2021 in the M. integrifolia panel. STC = loge (count of stick-tights), HY = loge (harvestable yield (count of nuts)), STI = logit(stick-tight incidence (STC/(STC + HY)).
Agronomy 12 01913 g003
Figure 4. Manhattan plots showing distribution of SNPs across the macadamia genome and significance of marker–trait associations for three traits in 2020 and 2021 in the M. tetraphylla panel. STC = loge (count of stick-tights), HY = loge (harvestable yield (count of nuts)), STI = logit(stick-tight incidence (STC/(STC + HY)).
Agronomy 12 01913 g004
Table 1. Number of individuals in three germplasm panels used for GWAS.
PanelNumber of GenotypesNumber of TreesNumber of Genotypes
with Clonal Replication a
Combined b199 in total
(102 M. integrifolia +
84 M. tetraphylla +
13 hybrids)
279 in total
(147 M. integrifolia +
115 M. tetraphylla +
17 hybrids)
66 in total (2–4)
(39 M. integrifolia (2–3) +
23 M. tetraphylla (2–4) +
4 hybrids (2))
M. integrifolia10214739 (2–3)
M. tetraphylla8411523 (2–4)
a Range of clonal replication presented in brackets; b Hybrids = M. integrifolia × M. tetraphylla.
Table 2. Summary statistics of raw, untransformed phenotypes for traits analysed in GWAS in three panels.
Traits aCombined b
(n = 199 Accessions,
279 Trees)
M. integrifolia
(n = 102 Accessions,
147 Trees)
M. tetraphylla
(n = 84 Accessions,
115 Trees)
MinMaxMeanMinMaxMeanMinMaxMean
STC 2020030542.2030570.301058.7
STC 2021080079.80700120.0030028.9
HY 2020031080.1031098.3029057.3
HY 20210600148.810600205.1044070.3
STI 2020010.29010.38010.18
STI 2021010.3300.950.35010.32
a STC = count of stick-tights, HY = harvestable yield (count of nuts), STI = stick-tight incidence (STC/(STC + HY)); b Combined panel consists of M. integrifolia, M. tetraphylla, and M. integrifolia × M. tetraphylla accessions.
Table 3. p-Values for first principal component fixed effect in combined panel models.
p-Value a
STC 2020STC 2021HY 2020HY 2021STI 2020STI 2021
2.99 × 10−21.79 × 10−12.52 × 10−16.18 × 10−22.45 × 10−18.53 × 10−1
a STC = loge(count of stick-tights), HY = loge(harvestable yield (count of nuts)), STI = logit(stick-tight incidence (STC/(STC + HY)).
Table 4. Individual genomic narrow-sense (h2) heritabilities of traits, assessed in GWAS for three panels. Standard errors of count variable estimates are in brackets.
Traits aCombined b
(n = 199)
M. integrifolia
(n = 102)
M. tetraphylla
(n = 84)
h2h2h2
STC 20200.26 (0.13)0.36 (0.18)0.26 (0.21)
STC 20210.46 (0.13)0.42 (0.18)0.51 (0.22)
HY 20200.15 (0.13)0.08 (0.14)0.26 (0.24)
HY 20210.12 (0.11)0.00 (0.00)0.12 (0.19)
STI 20200.300.390.02
STI 20210.220.170.31
a STC = loge(count of stick-tights), HY = loge(harvestable yield (count of nuts)), STI = logit(stick-tight incidence (STC/(STC + HY)); b Combined panel consists of M. integrifolia, M. tetraphylla, and M. integrifolia × M. tetraphylla accessions.
Table 5. p-Values, minor allele effects and numbers of accessions with each of the allelic states for SNPs found to be significantly associated with at least one stick-tight trait (STC or STI in 2020 or 2021) at p < 0.001 for either the combined, M. integrifolia, or M. tetraphylla panel. Allele effects are presented on back-transformed scales.
Number of Accessions with Allelic State a
Trait, YearSNP IDAllelesp-ValueAllele Effect b012
Combined panel
STC 2020631G > A9.16 × 10−40.36186130
4721G > T4.11 × 10−40.30188110
4747T > G3.67 × 10−40.4418874
8180C > T2.76 × 10−40.52151444
10405C > A7.30 × 10−41.711642510
11112C > A1.14 × 10−41.84159337
STC 2021503T > C8.66 × 10−41.55578557
585G > A1.15 × 10−40.581562221
631G > A1.01 × 10−30.33186130
4747T > G6.16 × 10−30.4918874
6726T > C5.43 × 10−40.371062370
7248T > C1.25 × 10−40.3319153
8180C > T7.13 × 10−30.59151444
STI 20208180C > T6.36 × 10−3−0.15151444
7248T > C6.83 × 10−3−0.2319153
STI 20218180C > T5.32 × 10−3−0.14151444
7248T > C3.41 × 10−5−0.3019153
5415T > G2.75 × 10−40.21163351
3891A > C2.91 × 10−40.2518793
7910C > A4.75 × 10−4−0.331031086
4745A > C7.98 × 10−4−0.141582714
M. integrifolia panel
STC 2020631G > A2.12 × 10−30.3889130
2178G > C8.62 × 10−41.7881480
6985G > A8.64 × 10−40.63493221
8180C > T8.03 × 10−40.5358404
11137C > A5.54 × 10−41.66593013
STC 2021206A > G9.81 × 10−40.548949
631G > A2.33 × 10−40.3289130
5415T > G4.77 × 10−42.2366351
6985G > A2.59 × 10−30.65493221
7694G > C2.75 × 10−41.61532722
8435C > G7.77 × 10−40.359471
11137C > A6.07 × 10−41.65593013
11670T > C6.15 × 10−42.2341385
STI 20202716T > C2.88 × 10−4−0.217986
STI 20215415T > G1.04 × 10−40.2166351
12649C > T2.24 × 10−40.11481440
535G > A6.60 × 10−4−0.2090102
631G > A9.54 × 10−4−0.2489130
M. tetraphylla panel
STC 20203315G > C9.50 × 10−50.4557252
4498C > T4.23 × 10−41.8392550
10405C > A5.89 × 10−51.93532110
11998T > A7.97 × 10−41.75492510
STC 20213338G > A2.38 × 10−40.342874
4745A > C8.53 × 10−30.62512211
6646G > A5.84 × 10−41.73293025
7248T > C4.90 × 10−40.297842
STI 20208554T > G8.70 × 10−40.2063147
4745A > C9.92 × 10−3−0.14512211
STI 20214745A > C1.53 × 10−4−0.19512211
5027G > A4.17 × 10−4−0.2564182
10146G > C7.74 × 10−4−0.378031
a 0 = homozygous for reference allele, 1 = heterozygous, 2 = homozygous for alternate allele (data listed in columns below these headings represent counts of accessions with these allelic states); b Allele effects represent the effect of one copy of the minor allele. Effect units are as follows: STC = number of stick-tights; HY = number of nuts (including stick-tights); STI = increase or decrease in proportion of stick-tights/total crop load.
Table 6. Summary of information relating to SNPs significantly associated with at least one stick-tight trait (STC or STI in 2020 or 2021) at p < 0.001 for either the combined, M. integrifolia, or M. tetraphylla panel.
Presence of SNP in Other Panels d
SNP IDChr aBp bMAF cCombined eintegftetrag
Combined panel
11112724,733,1088.5-yy
818046,321,7547.7-yn
4747--26.5-yn
4721215,858,48936.2-yn
10405543,602,8898.8-ny
631143,288,69430.6-yn
585135,796,9966.2-yn
7248917,297,31436.2-ny
6726534,504,3322.4-ny
503--2.0-yy
541546,115,0678.7-ny
3891730,363,26033.2-yn
7910431,117,5696.3-ny
474552,290,4267.2-ny
M. integrifolia panel
11137731,108,1533.6y-n
818046,321,7544.3y-n
2178--1.2y-n
6985--2.8y-y
631143,288,69415.7y-n
76941027,246,7242.9y-n
541586,115,0675.5Y-n
11670--1.1n-n
84351019,629,39822.7n-n
2061110,745,2239.3n-n
2716--1.1y-n
126491224,083,5602.2y-y
535--14.6y-y
M. tetraphylla panel
10405543,602,8894.1yn-
3315--5.8yn-
449812,946,1271.3yy-
11998543,602,8233.7yn-
3338144,231,7741.1yy-
7248917,297,31421.0yn-
6646--2.1yy-
474552,290,4263.8yn-
1014636,830,11133.6nn-
5027122,625,7527.6yn-
85541313,051,8466.0yn-
a Macadamia chromosome number; b base pair number of SNP within chromosome; “-“ indicates chromosome number and position is unknown; c minor allele frequency; d y = present, n = not present in that panel; e Macadamia integrifolia, M. tetraphylla, and M. integrifolia × M. tetraphylla; f M. integrifolia; g M. tetraphylla.
Publisher’s Note: MDPI stays neutral with regard to jurisdictional claims in published maps and institutional affiliations.

