Article

Performance Evaluation of a Water-Circulating Tomato Root-Zone Substrate-Cooling System Using a Chiller and Its Effect on Tomato Vegetative Growth in Chinese Solar Greenhouse

1
College of Horticulture, Northwest A & F University, Yangling 712100, China
2
College of Architecture and Urban Planning, Tongji University, Shanghai 200092, China
3
Key Laboratory of Protected Horticulture Engineering in Northwest, Ministry of Agriculture and Rural Affairs, Northwest A & F University, Yangling 712100, China
*
Author to whom correspondence should be addressed.
Agronomy 2022, 12(8), 1922; https://doi.org/10.3390/agronomy12081922
Submission received: 26 July 2022 / Revised: 10 August 2022 / Accepted: 12 August 2022 / Published: 15 August 2022
(This article belongs to the Special Issue Frontier Studies in Agricultural Greenhouse Equipment and Systems)

Abstract

:
A high-temperature environment is one of the most important factors limiting the growth of crops in Chinese solar greenhouses during summer. To reduce the substrate temperature of summer plant cultivation in a Chinese solar greenhouse, we proposed a water-circulating tomato-root zone-substrate-cooling system (WCTRZSCS). The system used water as the circulating medium, a chiller as the cooling source, and polyethylene raised temperature resistance (PE-RT) pipes laid in the substrate as the cooling component. The greenhouse was divided into test area TS1 (one PE-RT pipe), TS2 (two PE-RT pipes), and a control area CK (no PE-RT pipe) for the root-zone substrate-cooling test. The results demonstrated that (1) in the summer, WCTRZSCS can effectively reduce the substrate temperature, and (2) WCTRZSCS improves the temperature conditions for tomato vegetative growth. There were significant differences in plant height, stem diameter, dry weight, fresh weight, leaf area, net photosynthetic rate, total root length, and total root projection area between tomatoes in the test and control areas (p < 0.05). The TS1 and TS2 growth rates were 60.2% and 81.2% higher than CK, respectively, and the light-utilization efficiency was 56.3% and 81.3% higher than CK. (3) The system’s cooling energy consumption per unit ground area was 35.2~67.5 W·m−2, and the coefficient of performance (COP) was 5.3~8.7. Hence, WCTRZSCS can effectively reduce the substrate temperature in the root zone, but the profit by tomato cannot offset the cost of using WCTRZSCS. Through the optimization of and improvement in the system, its economy may be further improved, and it is expected to be applied in practical production.

1. Introduction

The Chinese solar greenhouse is a kind of greenhouse developed in China. It plays an irreplaceable role in the overwinter planting of warm vegetables. However, due to the high ambient temperature of the greenhouse during the summer, plants are prone to high-temperature stress [1,2], and many Chinese solar greenhouses are idle. “Central Document No.1 of 2022” [3] stated the importance of exploring the use of exploitable idle and abandoned land to develop facility agriculture. It is therefore essential to realize the annual supply of Chinese solar greenhouses by solving the summer high-temperature environment problem of Chinese solar greenhouses through cooling technology.
At present, cooling technologies of greenhouses is mainly divided into two categories, one is to cool the air, the other is to regulate the temperature of the soil or substrate. Common air-cooling technologies include ventilation cooling [4,5], shading cooling [6,7,8], evaporation cooling [9,10,11], spray cooling [12], and the combination of these four ways of cooling [13,14,15,16,17], as well as heat exchange systems in the ground [18,19]. However, the above cooling methods have some limitations. For example, the cooling effect of ventilation is affected by the temperature difference between indoors and outdoors [20]. Shading affects the indoor light intensity, affecting plant photosynthesis [21]. Evaporative cooling raises the indoor humidity during the cooling process, and the cooling efficiency is affected by outdoor humidity. Spray cooling causes the aging of covering materials and the waste of water resources [6]. The cooling performance of heat exchange systems in the ground is poor [22].
In the case of soilless culture, substrate cooling can also be employed to regulate the substrate temperature. In contrast with indoor air-temperature control, the substrate volume is smaller than the air volume. At the same time, substrate temperature mainly affects the crop root zone temperature. Studies have shown that root-zone temperature directly affects plant growth and indirectly affects plant growth by affecting photosynthesis [23,24], metabolism [25,26], mineral nutrition [27], and plant hormones [28]. Facility crops are more sensitive to variations in root-zone temperature than variations in air temperature [29]. Therefore, the temperature regulation of substrates may exhibit better energy savings.
Many studies have been conducted on the local temperature reduction in strawberry roots employing a heat pump with circulating cooling water in the context of substrate-temperature regulation [30,31,32]. This method has a remarkable cooling effect but requires a substantial initial investment and high energy consumption. Li et al. [33,34] designed a set of water-cooled seedling beds with groundwater as a medium for the local cooling of the intensive seedling rhizosphere, which alleviates the impact of high summer temperatures on tomato seedling growth. However, this method is unsuitable for greenhouse cooling in arid and groundwater-deficient regions [35].
As mobile cooling equipment, chillers possess a good cooling effect. They are widely used in industries that require chilled water or cooling, such as buildings cooling [36,37], combined cooling heating and power [38], tunnel construction [39], passenger ship cooling [40], temperature and humidity control in a glass-fiber-production environment, [41], steel production cooling [42]. Based on their use in various industries, chillers are also known as refrigerators and coolers. Numerous researchers have investigated the energy-saving control scheme of chillers [43,44,45]. However, the effect of chiller application on greenhouse cooling has not been reported. When a chiller and water storage tank are used to cool the substrate in the greenhouse, only a minimal amount of water is required to meet the cooling requirements. The water in the storage tank can be recirculated during the cooling process. Therefore, there will be no waste of water resources.
Therefore, to reduce the substrate temperature of summer plant cultivation in a Chinese solar greenhouse and explore a substrate cooling method that is not limited by the use area and that saves water resources and consumes low amount of energy, this experiment proposes a water-circulating tomato root-zone-substrate cooling system (WCTRZSCS) with water as the circulating medium. The tomato was used as an experimental material to explore the substrate cooling performance of WCTRZSCS in a Chinese solar greenhouse and its effect on tomato vegetative growth to evaluate the cooling effect of chillers in greenhouses. It is hoped to obtain a better cooling method of substrate and provide data reference for the application of chillers in greenhouse substrate cooling.

2. Materials and Methods

2.1. Introduction of WCTRZSCS

2.1.1. WCTRZSCS Composition

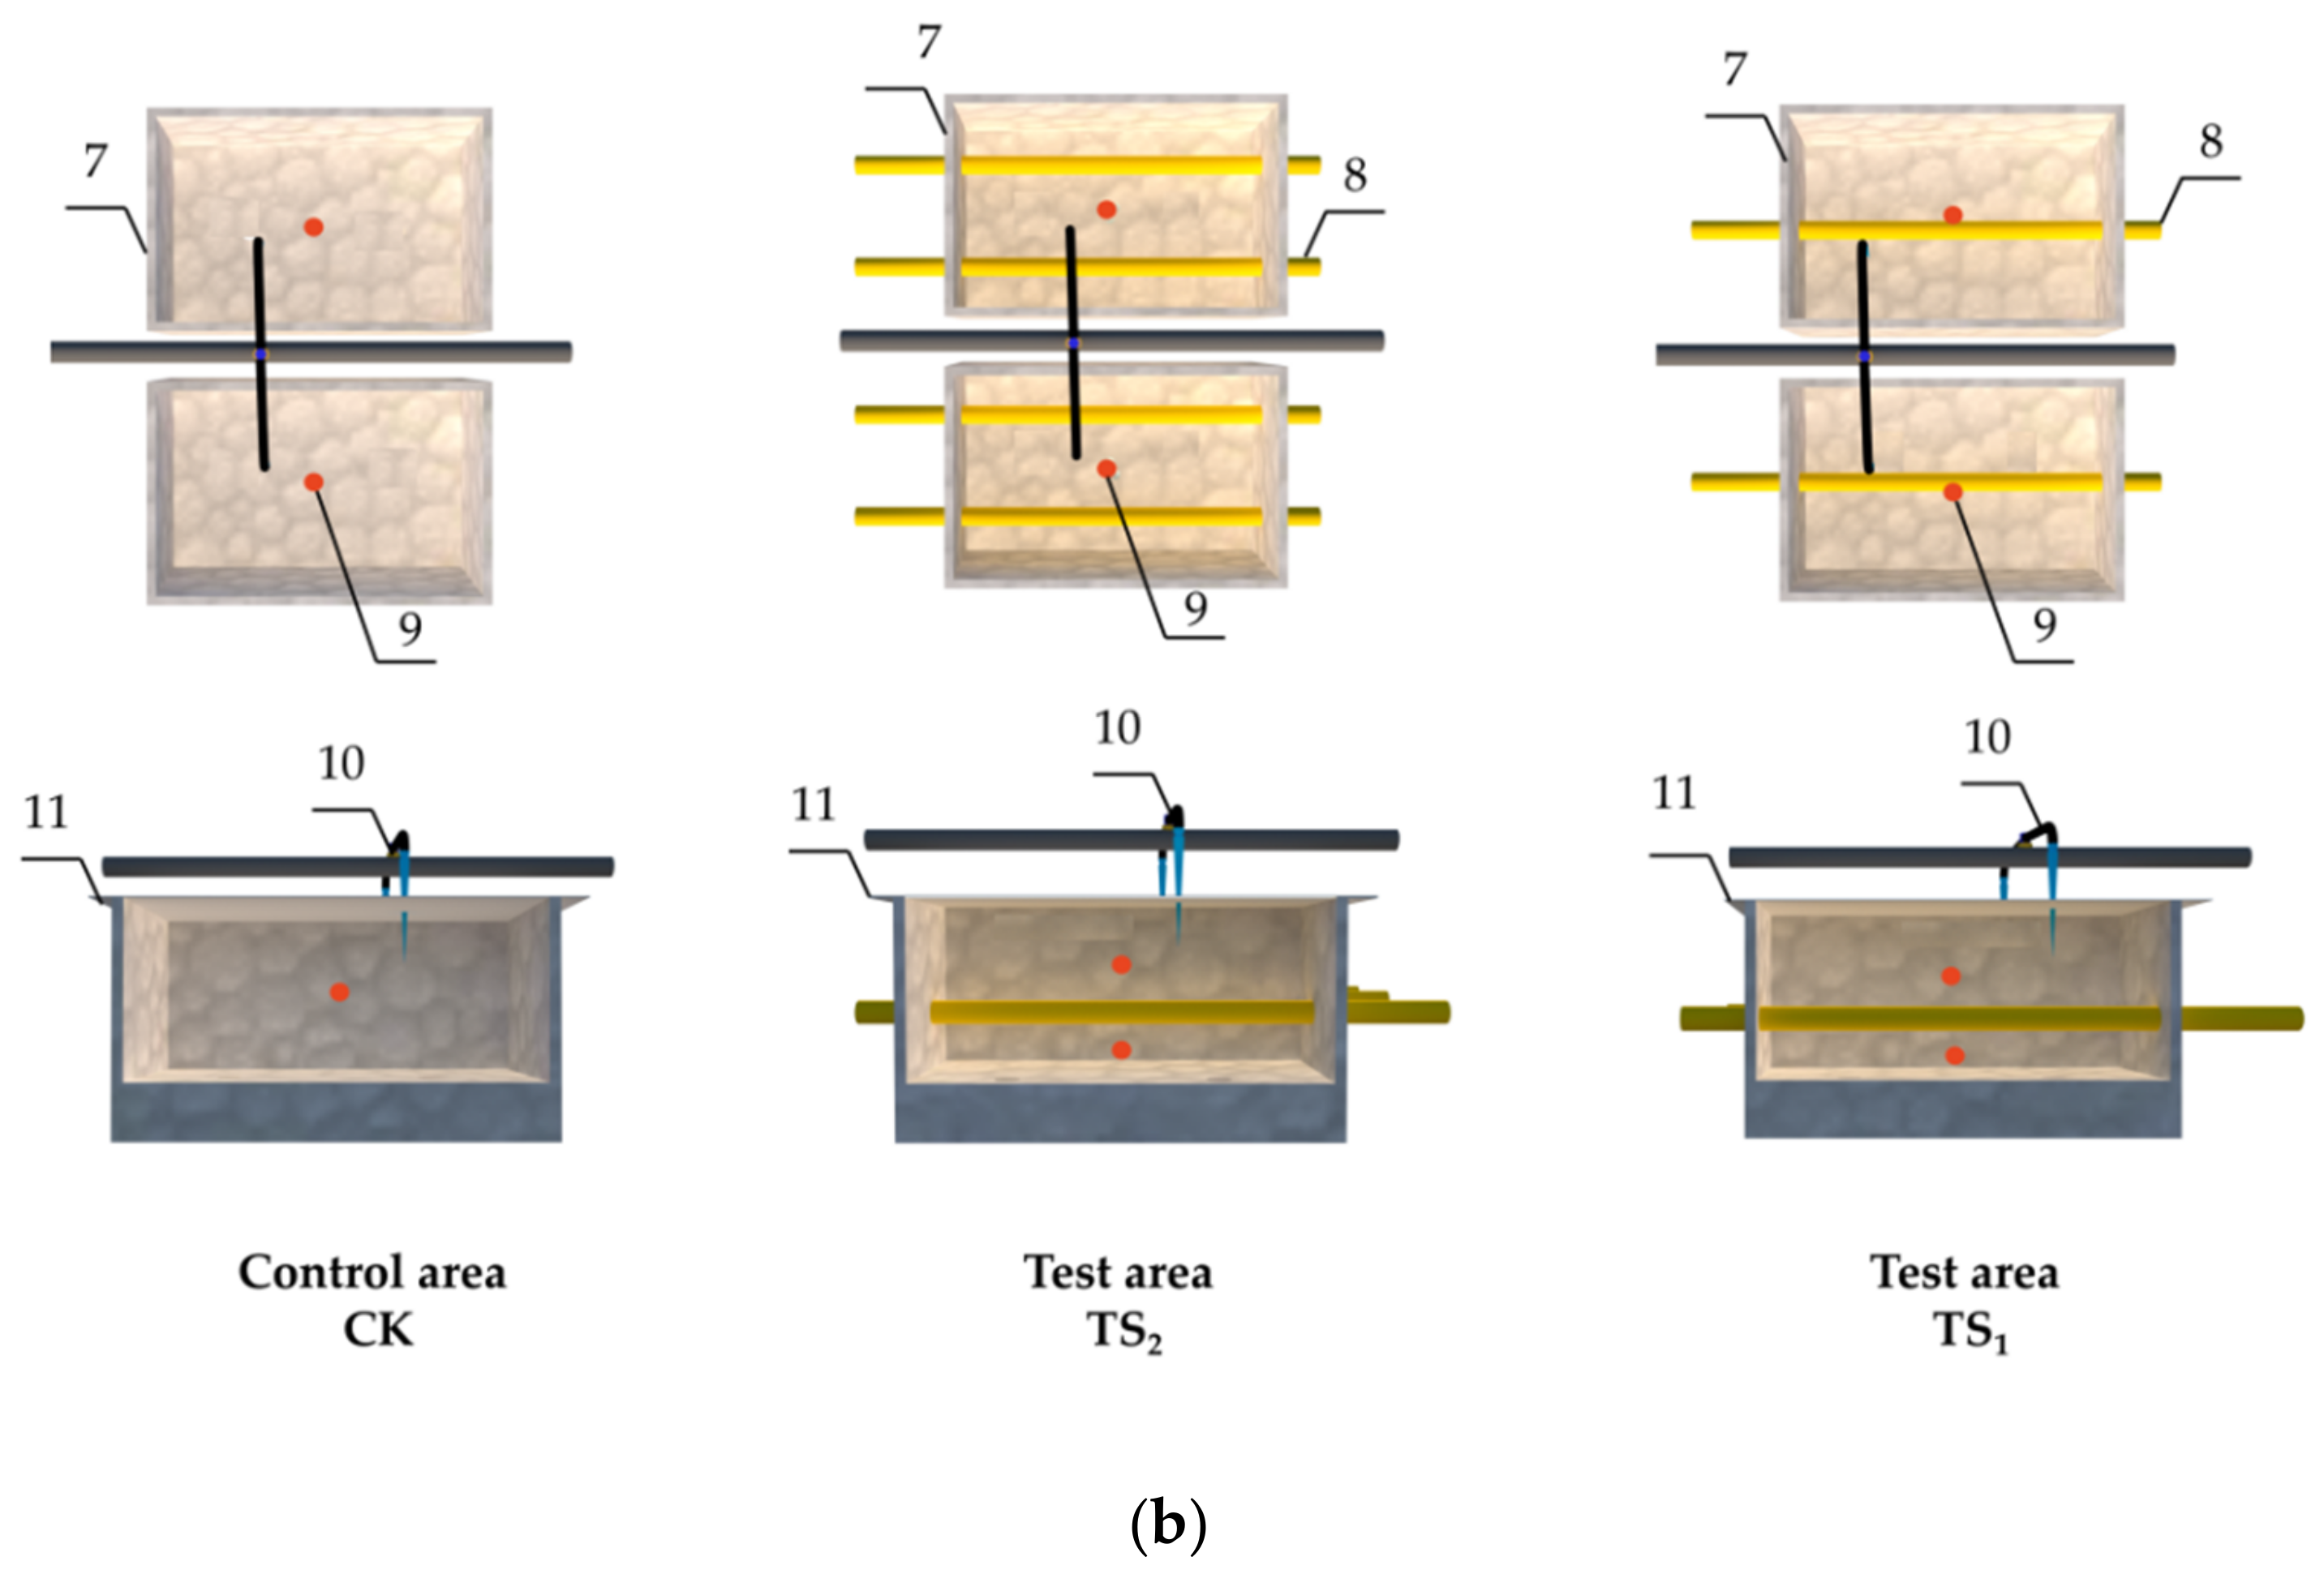
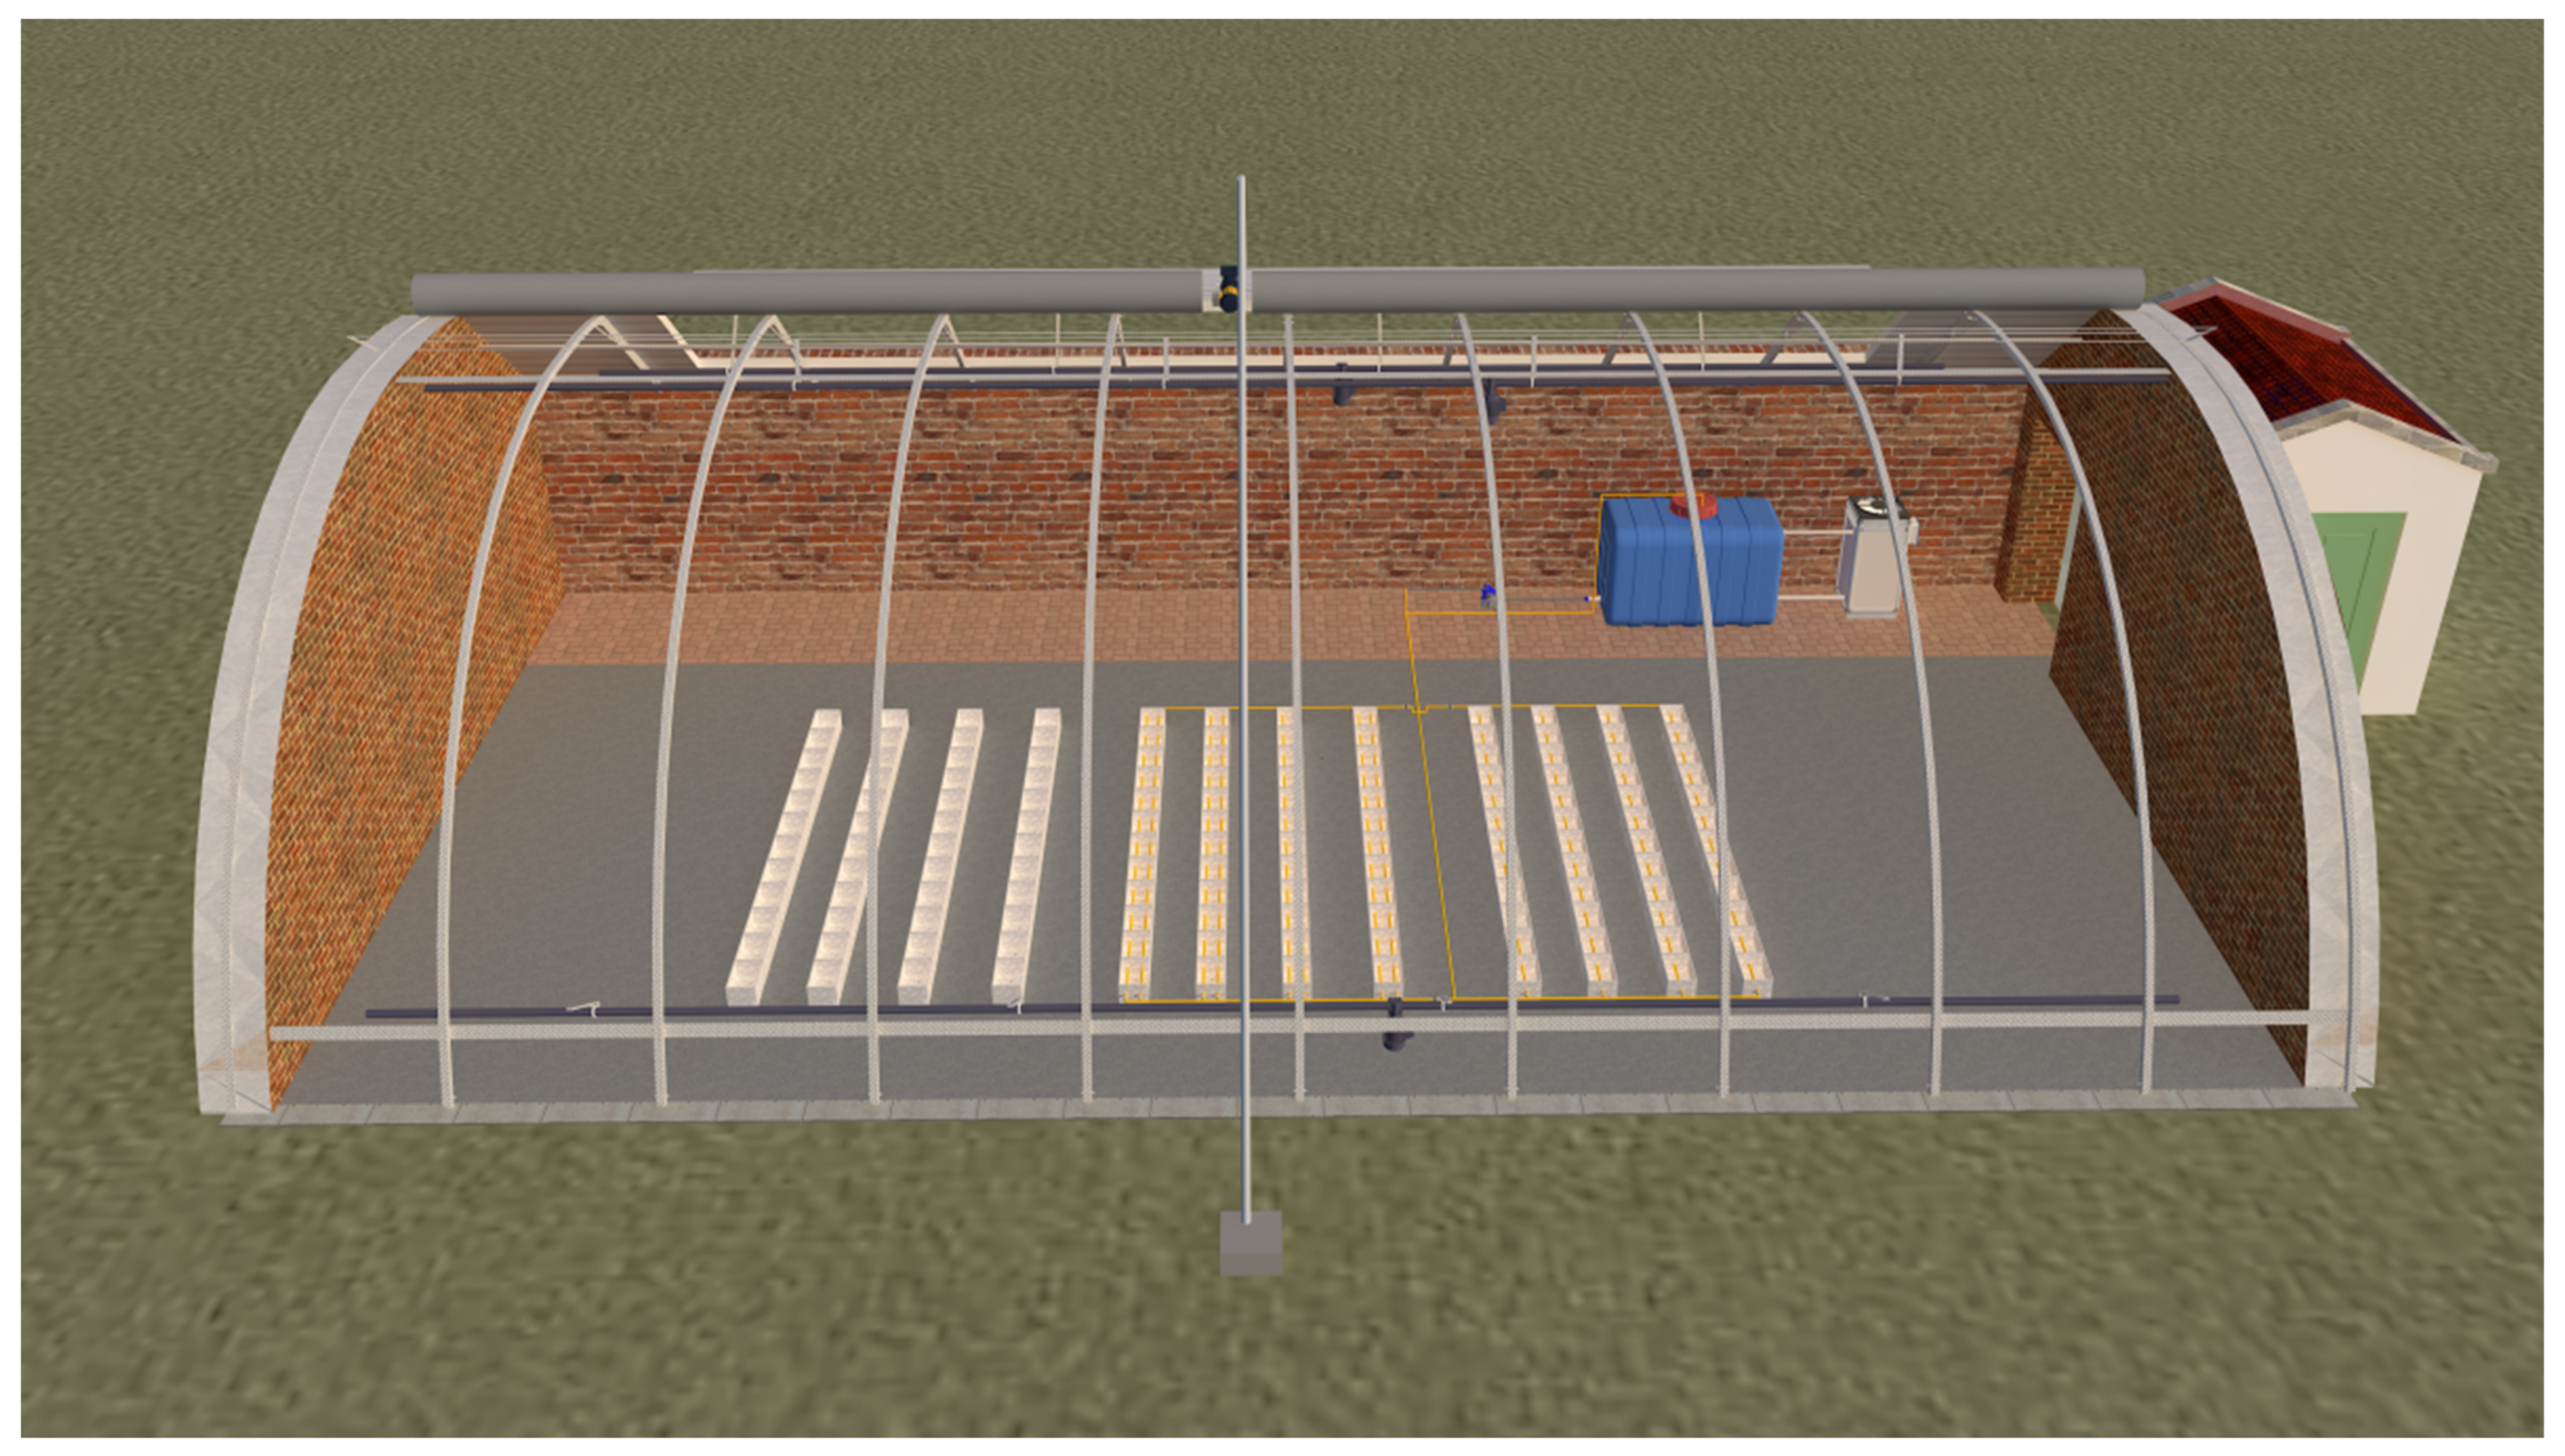
The WCTRZSCS included a chiller, water supply pipes, return pipes, heat dissipation components, a water pump, a water storage tank, solenoid valves, foam boxes, and an automatic control system, as displayed in Figure 1. The rated power of the chiller was 1.1 kW. Polyvinyl chloride (PVC) pipes with a diameter of 32 mm were used in water supply and return pipelines. The heat dissipation component comprised polyethylene raised-temperature-resistance (PE-RT) pipes that were 4.2 m long and 20 mm in diameter. The thermal insulation foam boxes were used as the planting groove, with an external size of 340 mm × 220 mm × 185 mm and an internal size of 305 mm × 185 mm × 140 mm. PE-RT pipes passed through the middle of the foam box’s lateral side, using the internal diameter as standard. The water pump power was 0.75 kW, the flow rate was 10 m3/h, and the water storage tank volume was 0.45 m3.

2.1.2. WCTRZSCS Working Principle

The system used water as the circulating medium, a chiller as the cooling source, and polyethylene raised-temperature-resistance (PE-RT) pipes laid in the substrate as the cooling component to remove heat from the substrate by circulating water. The working principle of WCTRZSCS was that the cooling system opened when the automatic control system showed that the average substrate temperature of the TS1 (TS2) was higher than the set value of 28 °C and the temperature difference between the average substrate temperature of the TS1 (TS2) and the water temperature of the water storage tank was higher than 3 °C. Therefore, cold water from the water storage tank flowed into PE-RT pipes lying on the substrate of the TS1 (TS2) and removed heat from the substrate of the TS1 (TS2) to keep the temperature down. At the same time, the chiller cooled the water in the tank and kept it at a lower temperature. When the average substrate temperature of the TS1 (TS2) was lower than the set value of 23 °C or the temperature difference between the substrate of the TS1 (TS2) and water was less than 3 °C, the TS1 (TS2) part of the WCTRZSCS was closed. The working principle of the system was executed at 9:00–18:00, and the system was closed at other times.

2.2. Introduction of Experimental Greenhouse

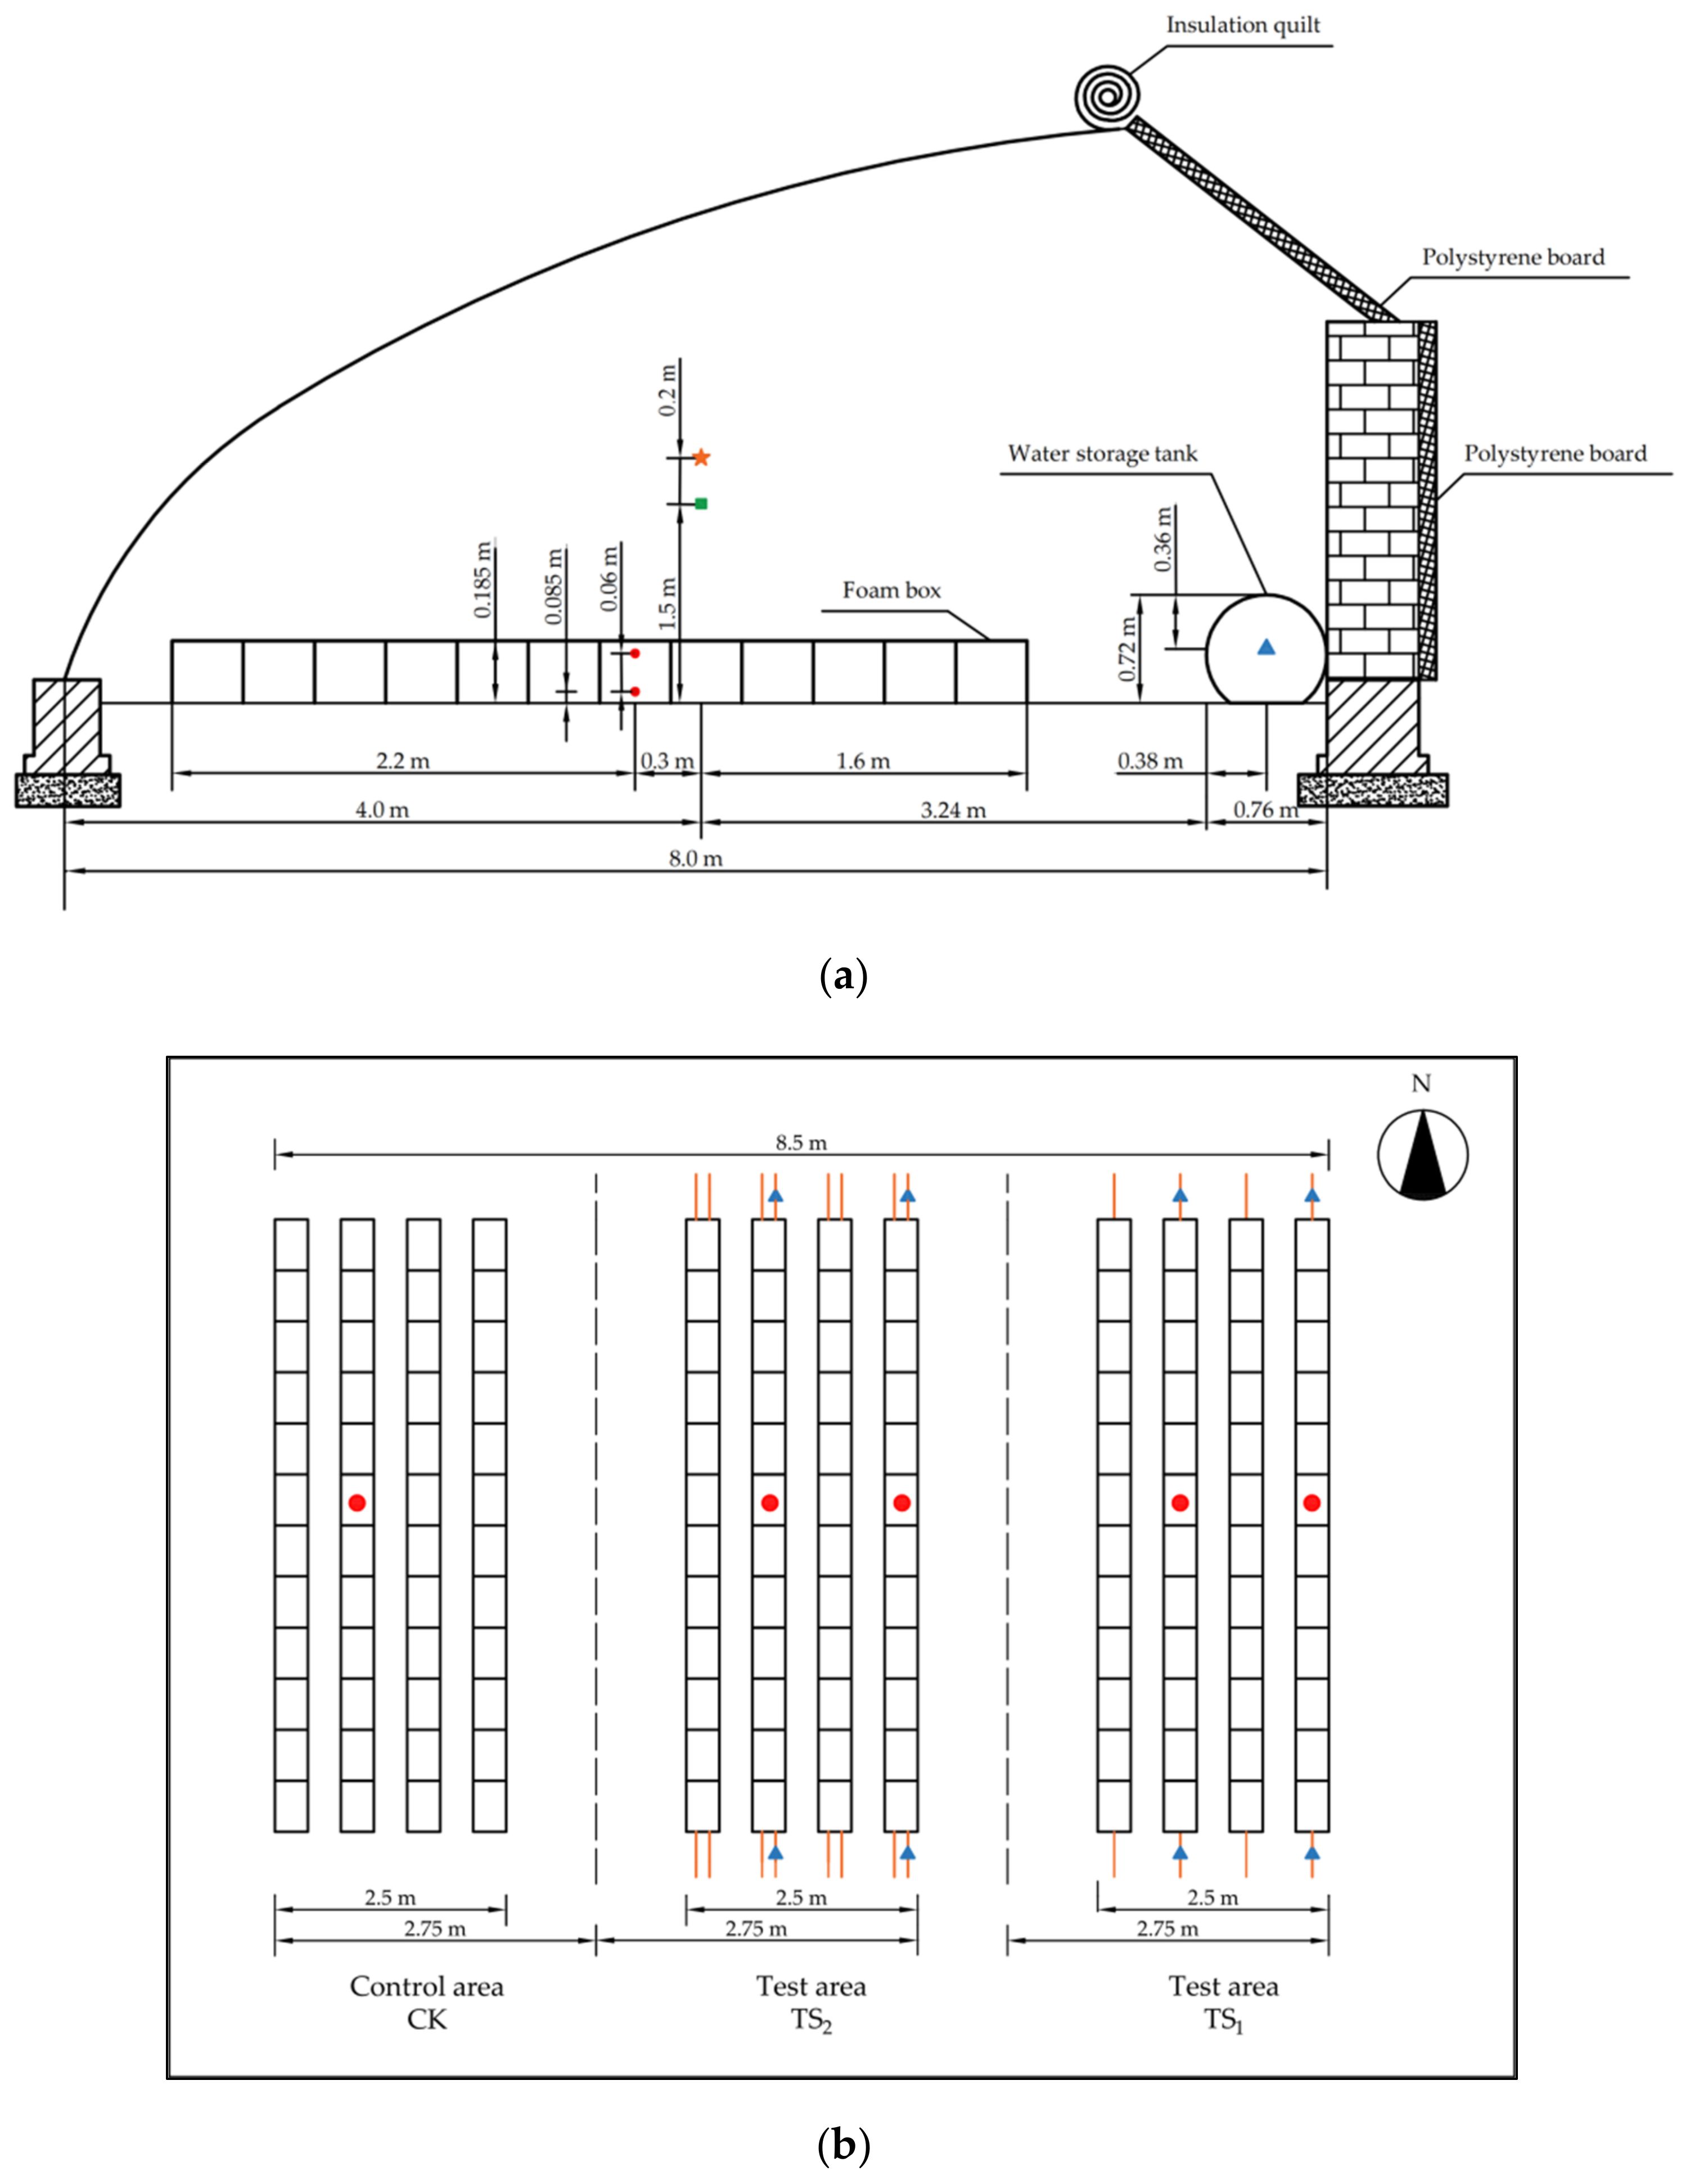
Figure 2 is a diagrammatic drawing of the experimental greenhouse. The experimental greenhouse was located in the horticulture field of Northwest A&F University, Yangling, China (34°17′ N, 108°05′ E). The greenhouse was 8.0 m and 15.0 m long in the North–South and East–West directions, respectively. The ridge height of the solar greenhouse was 3.5 m. The transparent covering material was PE film with a thickness of 0.12 mm. The north wall was made of clay brick with a height of 2.2 m, a thickness of 1.0 m, and a 10 cm thick polystyrene board.

2.3. Experimental Method

This experiment tested the cooling effect of WCTRZSCS in the solar greenhouse and its effect on tomatoes’ vegetative growth. Most Chinese solar greenhouses are idle in July and August. The traditional planting time of tomato in a Chinese solar greenhouse is September and October. Therefore, the experiment was carried out in the summer (31 July 2021 to 27 August 2021) with a high substrate temperature in a solar greenhouse. During the experiment, the greenhouse was divided into three regions (Figure 2). The region where one PE-RT pipe was laid in the foam box was the test area TS1, the region with two PE-RT pipes was the test area TS2, and the region with no PE-RT pipe was the control area CK. The combination of WCTRZSCS and foam box substrate culture had the advantages of strong temperature stability in the root zone of the substrate culture [46]. Moreover, the foam box’s insulation characteristics made it more conducive to maintaining the substrate temperature at a low temperature level and reducing the energy consumption of cooling. Cultivated crops were tomato seedlings (Chenhong, 1934) planted on 31 July 2021 on 4 ridges per region and 12 plants per ridge. The total number of plants in ridges was 144.
During the experiment, all tomato plants adopted the same management mode except substrate cooling in the experimental area. The drip irrigation system was adopted for irrigation, and the greenhouse was usually ventilated without additional shading. To ensure the substrate moisture content required for normal tomato growth, transparent plastic film was laid above the matrix to reduce the evaporation of water, so it was assumed that the matrix moisture content in the experimental and control areas was the same.

2.4. Relevant Sensor Placement

2.4.1. Solar Radiation and Air Temperature, and Humidity Sensor Placement

Solar radiation and temperature and humidity sensors were arranged in the geometric center of the greenhouse ground. The solar radiation sensor is 1.7 m away from the ground and arranged parallel to the ground. Temperature and humidity sensors are 1.5 m from the ground (Figure 3a).

2.4.2. Substrate Temperature Sensor Placement

The arrangement of the substrate temperature sensors is demonstrated in Figure 3. The substrate temperature sensors of TS1 and TS2 were arranged 2 cm from the bottom geometric center of the foam box to the lower surface of the PE-RT pipe and 2 cm from the upper surface of the PE-RT pipe. The substrate temperature sensor in the control area (CK) was arranged at the geometric center of the thermal insulation foam box.

2.4.3. Water Temperature Sensor Placement

The temperature sensor of the water storage tank was installed at its center (Figure 3a). The water temperature sensors for the supply and return of PE-RT pipes were set on the first and third pipes from east to west in the TS1 test area and on the first and fifth pipes from east to west in the TS2 test area (Figure 3b).

2.5. Information on Sensors and Instruments

Specific information on the sensors and instruments used in the test is demonstrated in Table 1 and Table 2.

2.6. Calculation of Daily Substrate’s Effective Accumulated Temperature in the Root Zone of Tomato

The daily substrate’s effective accumulated temperature is defined as the time integral of the difference between the maximum tolerance temperature of the tomato root zone and the substrate temperature, representing the heat beneficial to the growth and development of the tomato from the substrate thermal environment in a day. A larger the value indicates that the substrate’s thermal environment is more suitable for tomato growth and development. The temperature of 33 °C was used as the maximum tolerance temperature for tomatoes [47], and the data were recorded every 10 min. The specific calculation formula was as follows:
D S E A T = 8 : 00 the   next   day   8 : 00 Δ t + ( τ ) d τ
In this formula, DSEAT is the daily substrate effective accumulated temperature, °C; Δt+(τ) is the difference between the maximum tolerant temperature of the tomato root zone and the substrate temperature at time τ, °C.
Δ t + ( τ ) = B t s ( τ ) , t s ( τ ) B 0   ,   t s ( τ ) > B
where ts(τ) is substrate temperature at τ time, °C; B is the maximum tolerance temperature of the tomato root zone, and its value is 33 °C.

2.7. Growth Rate of Tomato

In this formula, GR is the growth rate of tomato, g·d−1; ΔF is the average plant fresh weight increase in the tomato in different regions during the growth period, g; and T is the growth period, value is 26 d.
G R = Δ F T

2.8. Light-Utilization Efficiency of Tomato

η is light-utilization efficiency; q is the heat generated by a unit of dry matter combustion, with a value of 20 × 103 J·g1 [48]; M is the average dry weight increment per plant, g; and D is the tomato planting density, plant·m−2. According to the study of the tomatoes, the suitable planting density is 2400 plants·667 m−2 [49], calculated by 3.6 plants·m−2, and S is the total solar radiation per unit area in the greenhouse during the growth period J·m−2.
η = q × M × D S × 100 %  

2.9. Energy Consumption Calculation of WCTRZSCS

COP is the coefficient of performance; Qn is the refrigeration capacity of the whole cooling system, J; and E is electric energy consumed by system cooling, kW·h.
C O P = Q n E × 3.6 × 1 0 6
The heat gain and loss pathways of TS1 and TS2 in the test area during the summer daytime mainly include (1) absorbing solar radiation heat, (2) convective heat transfer with indoor air, and (3) convective heat transfer with PE-RT pipes of the cooling system, and the heat gain and loss in the substrate in the control area mainly include (1) absorbing solar radiation heat and (2) convective heat transfer with indoor air. Assuming that the refrigerating capacity of the whole cooling system acts on the substrate of the test area under an ideal condition, the temperature difference between the control area and the test area is the effect of the cooling system on the substrate of the test area. Qn can be calculated by
Q n = τ 0 τ n Δ T c m d τ   i = 0 n c m t c , i t a , i + t b , i
In this formula, c is the specific heat capacity of the substrate, obtained through measurement; the average specific heat capacity of the substrate is 1.02 kJ·kg1·°C1; m is the average weight of a single foam box, with a value of 5.3 kg; ΔT is the temperature difference between in the control area CK and the test areas TS1 and TS2, °C; τ0 is system start time; τn is the system end time; ta,i is the average substrate temperature of TS1 at the time i; tb,i is the average substrate temperature of TS2 at the time i; and tc,i is average substrate temperature of CK at the time i.
According to the calculation of 3.6 plants·m−2, there were 96 tomato plants in the test area. Thus, the planting area of TS1 and TS2 can be converted to 26.67 m2, and the energy consumed by cooling in the planting area per unit area is:
Q c = E × 3.6 × 1 0 6 Δ t A
In this formula, Qc is the energy consumption of per unit ground area for cooling, W·m−2; Δt is the working time of the cooling system, s; and A is the planting area in the test areas TS1 and TS2, with a value of 26.67 m2.

3. Results and Analysis

3.1. Effects of WCTRZSCS on Substrate Temperature

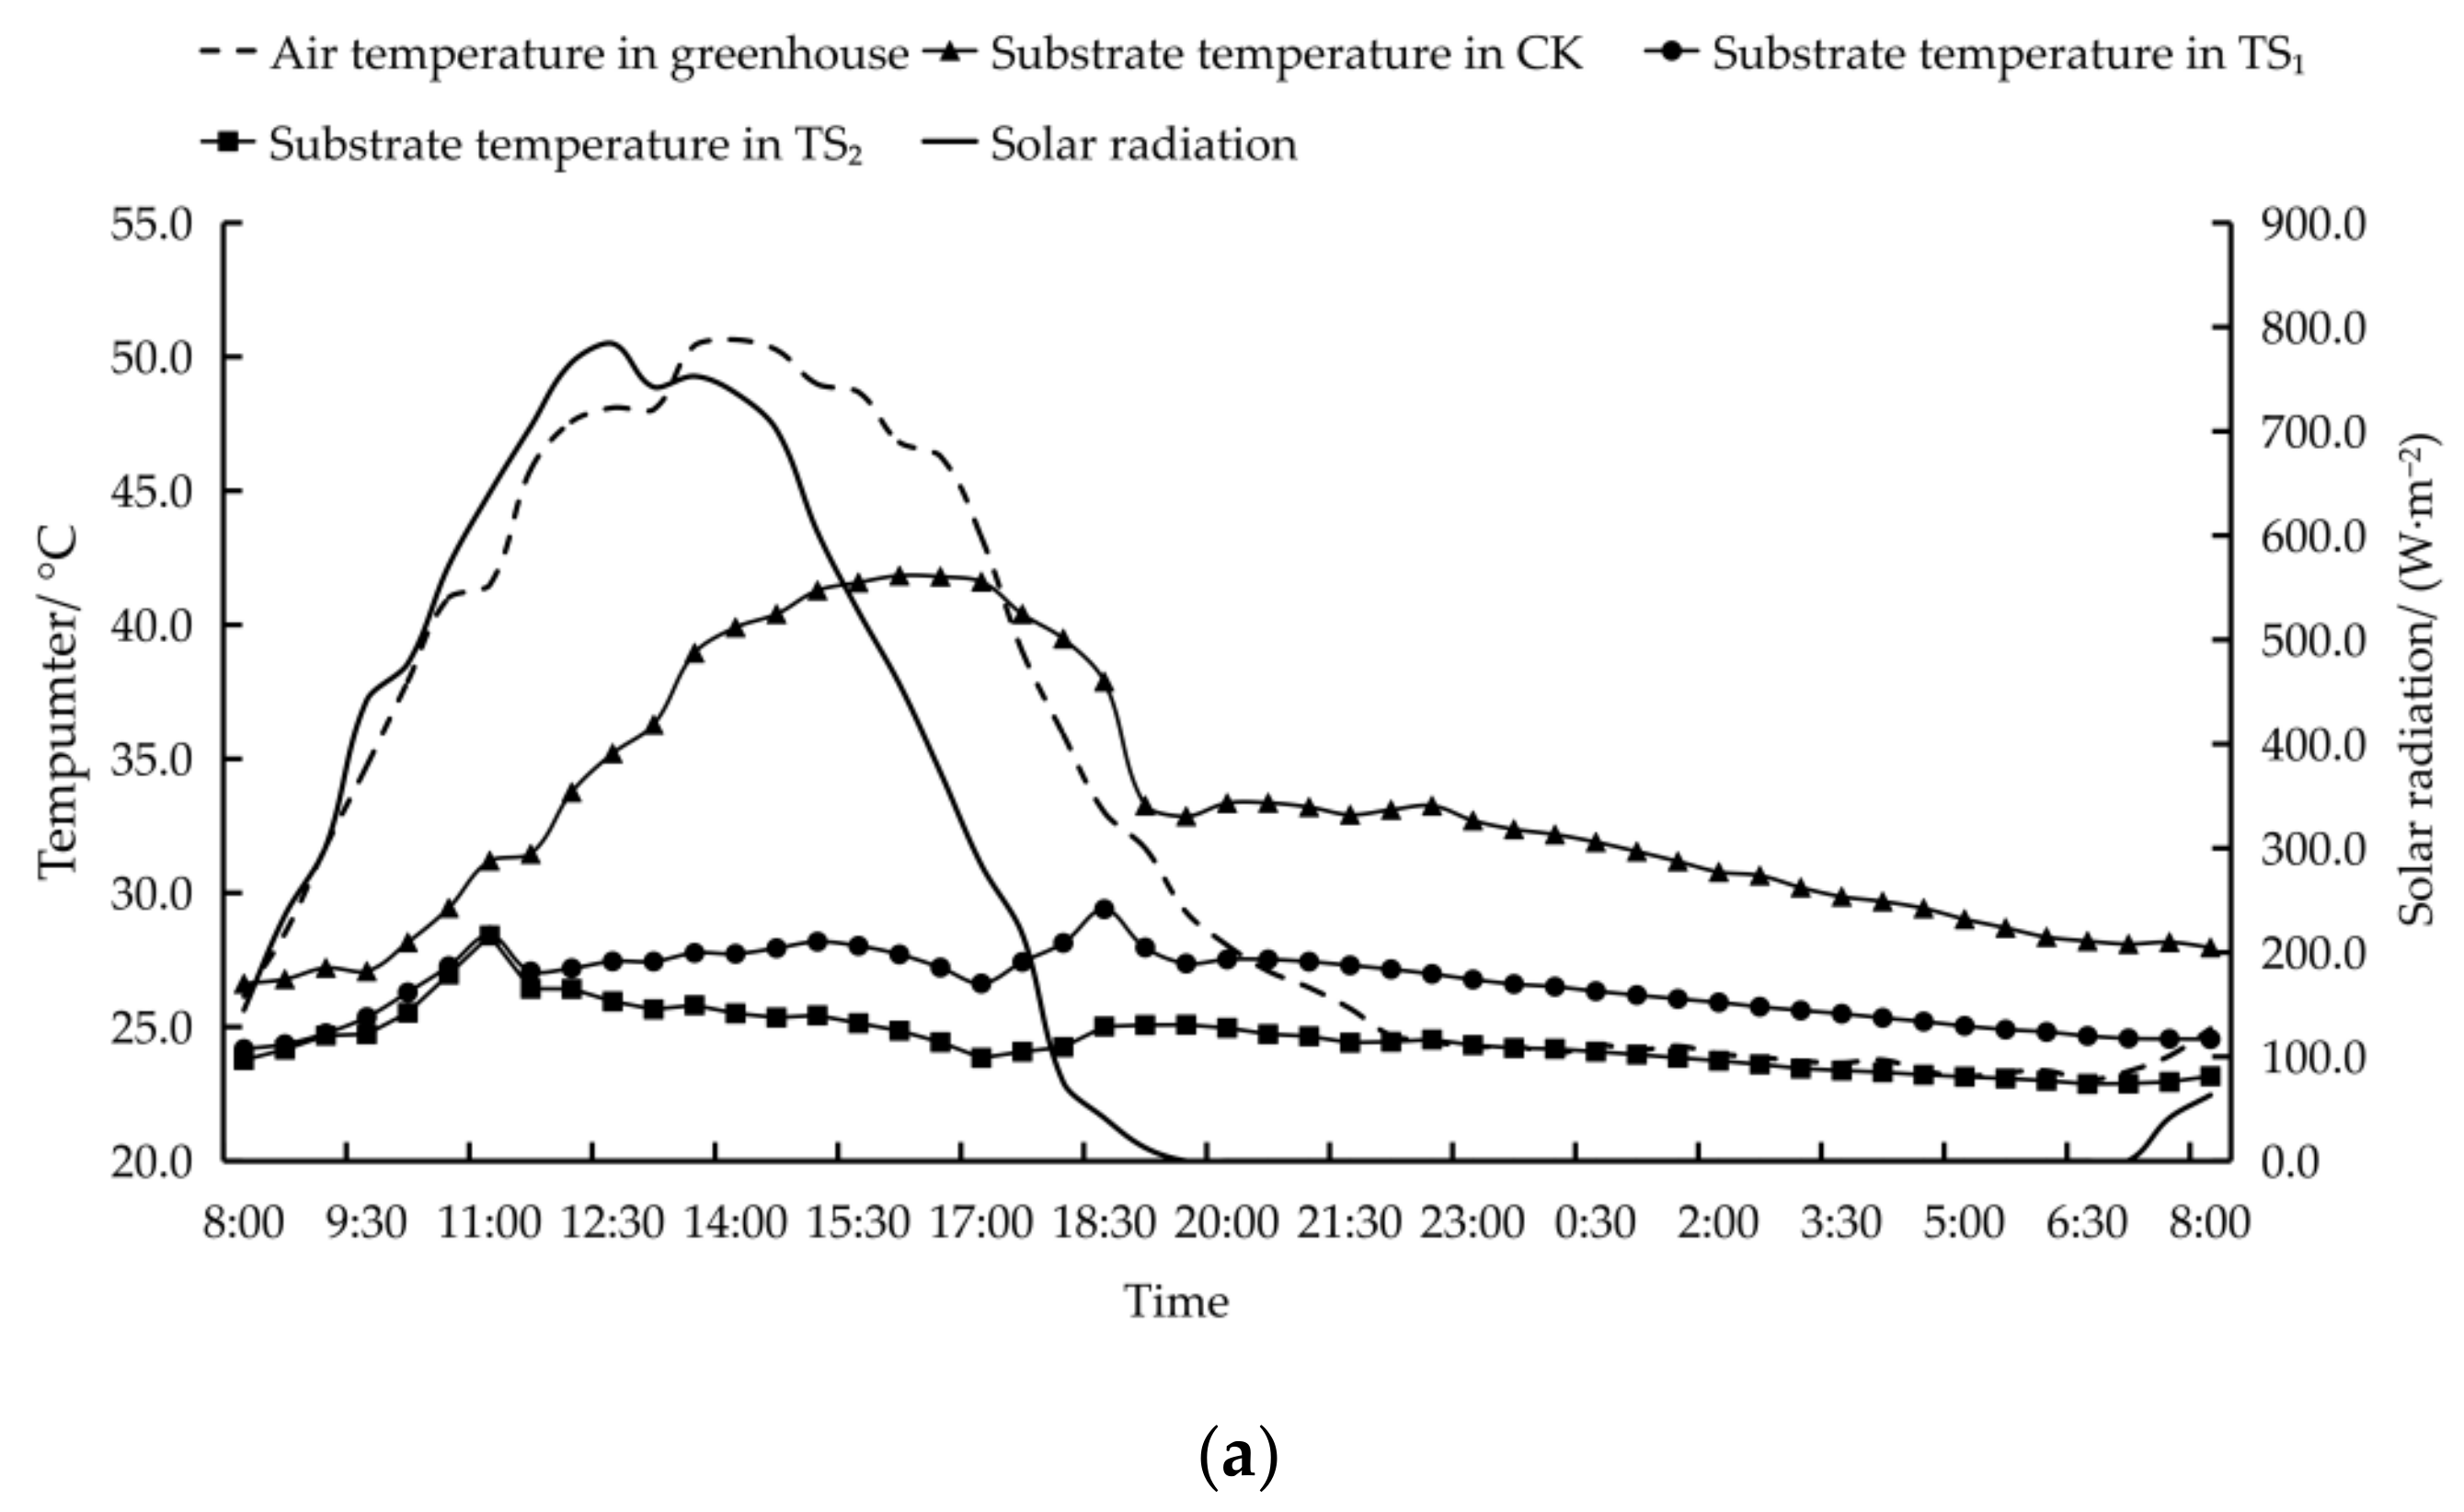
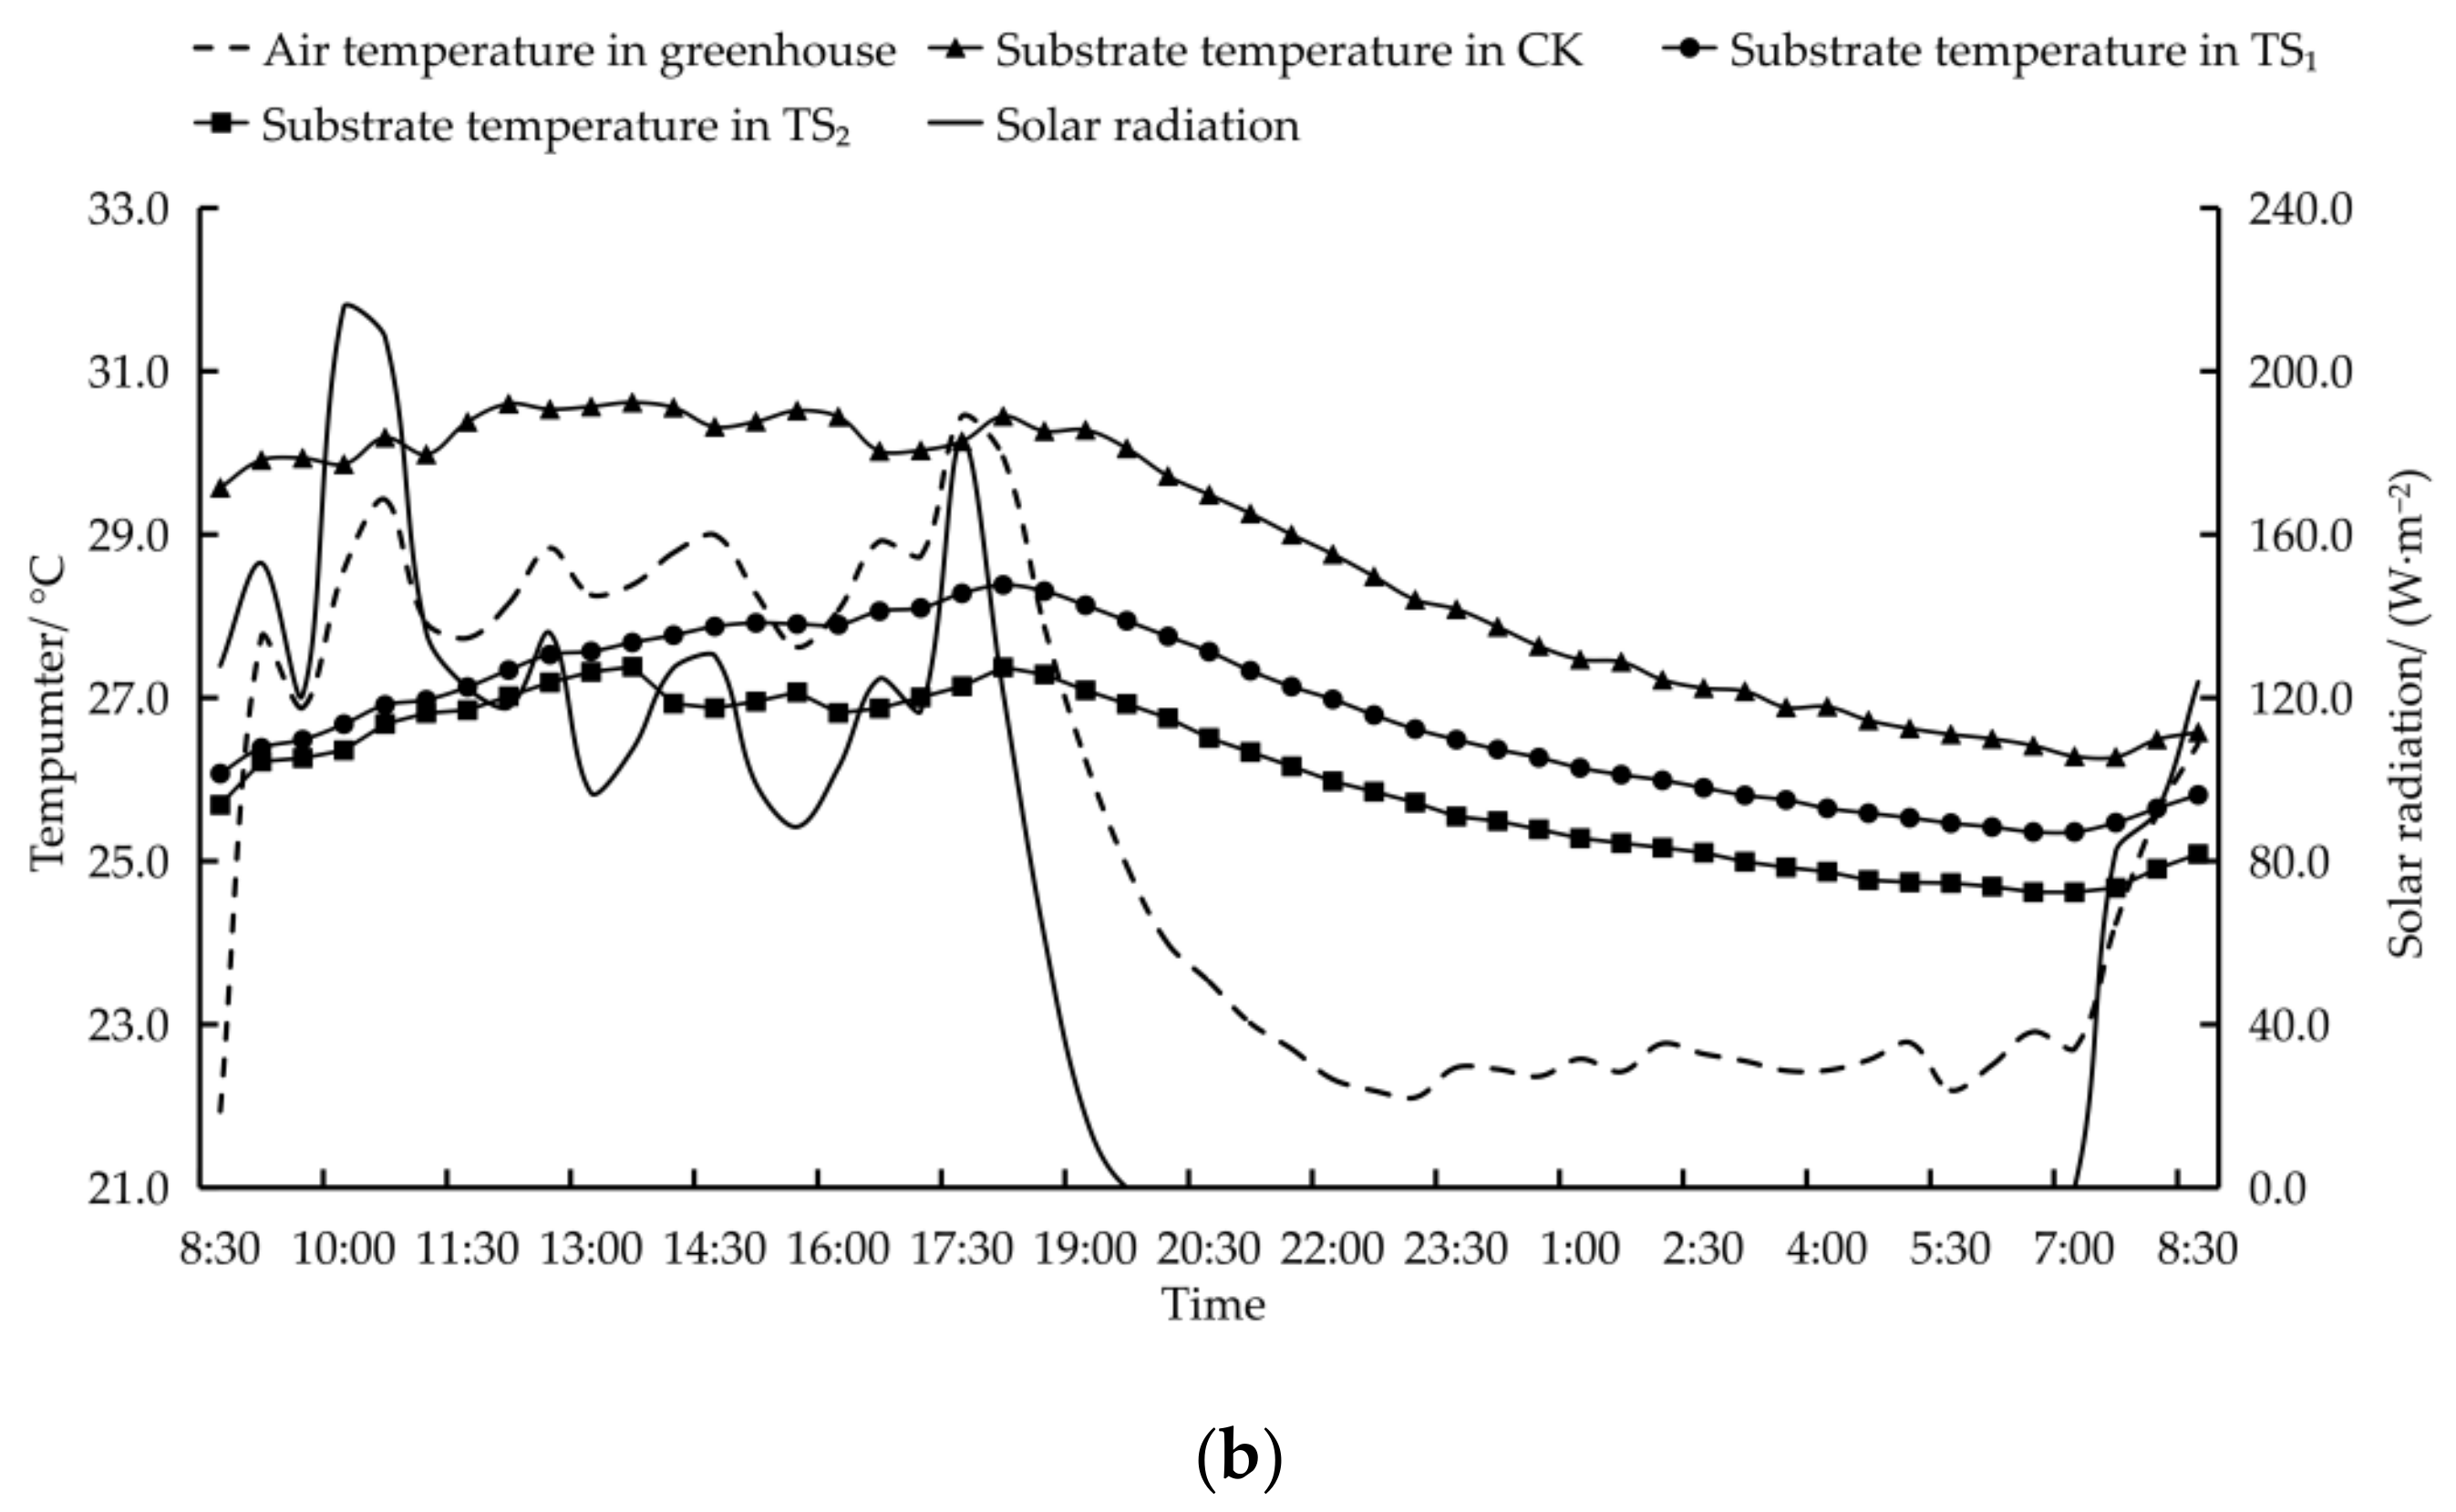
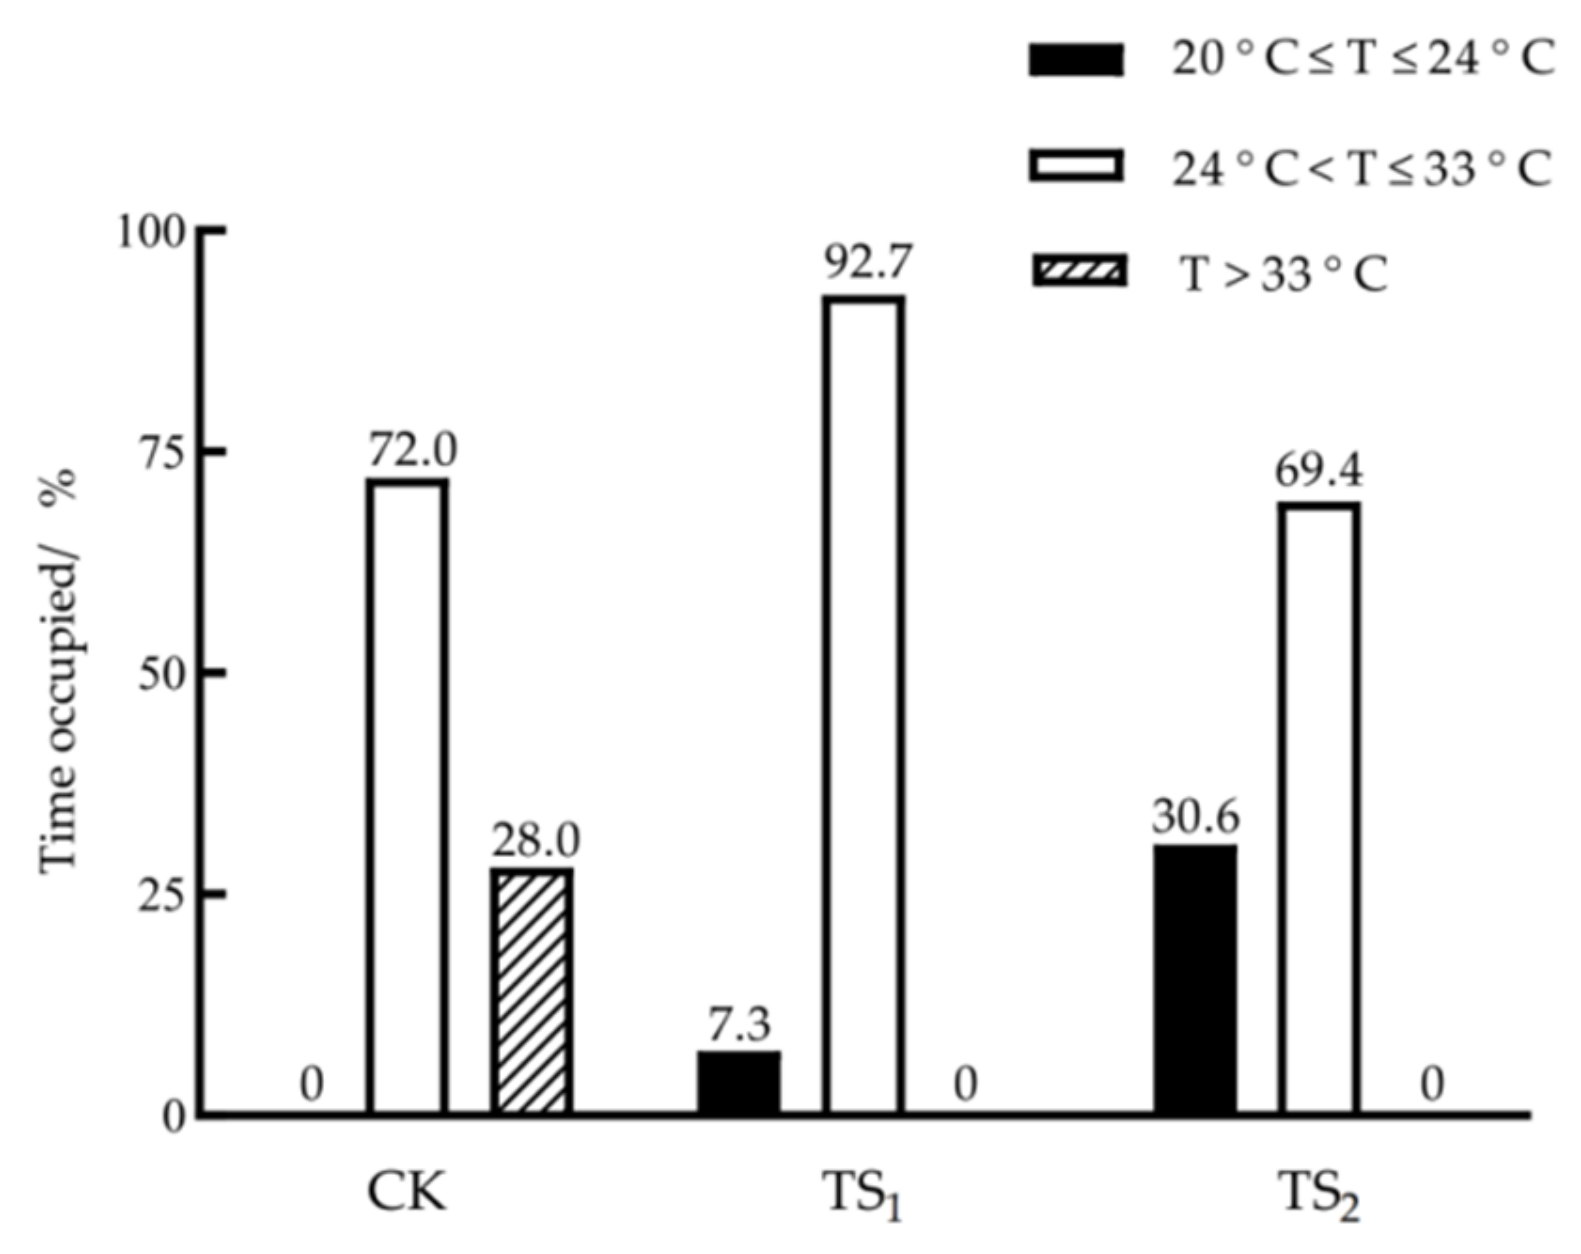
Typical weather conditions were selected to analyze the cooling effect of the WCTRZSCS, as displayed in Figure 4. At the same time, the time that the substrate temperature was within each temperature range for seven consecutive days was counted, as illustrated in Figure 5, where the substrate temperature is the average temperature of all temperature-measuring points in the region.

3.1.1. The Variation of Substrate Temperature under Typical Sunny Day

The date of the 24 August 2021 was a typical sunny day. Figure 4a reveals that the maximum indoor solar radiation under typical sunny conditions was 784.1 W·m−2. With the gradual increase in solar irradiance, the air and substrate temperature in the test and control area gradually increased. At 14:00, the air temperature reached the maximum value of 50.6 °C. At 11:00, the TS1 and TS2 substrate temperature reached 28 °C, and the set temperature of the cooling system began to cool the substrate. With the opening of the cooling system, the substrate temperatures in the test area TS1 and TS2 exhibited a slow downward trend. In contrast, the substrate temperature in the control area (CK) continued to rise, reaching its maximum at 16:00. The substrate temperature then decreased in response to the weakening of solar radiation and the decrease in air temperature in the greenhouse. At 17:00, the cooling systems of TS1 and TS2 in the test area were shut down. Affected by the air temperature in the greenhouse, the substrate temperatures of TS1 and TS2 exhibited a slight increasing trend. However, the substrate temperatures stopped rising at 18:30. The substrate temperature difference between TS1 and TS2 in the test area and CK in the control area was still 8.5 °C and 12.9 °C, respectively. On this day, the maximum and minimum substrate temperatures of the control area were 41.8 and 26.6 °C, respectively. The maximum and minimum substrate temperatures of the test areas TS1 and TS2 were 29.6 and 24.2 °C, and 28.4 and 22.8 °C, respectively. The maximum temperature difference between the control and test areas TS1 and TS2 was 15.0 and 17.8 °C, respectively. The average substrate temperature of the control area was 33.0 °C. In contrast, the average substrate temperatures of test areas TS1 and TS2 were 26.5 and 24.5 °C, which were 6.5 and 8.5 °C lower than those in the control area, respectively.

3.1.2. The Variation of Substrate Temperature under Typical Cloudy Day

The date of 16 August 2021 was a typical cloudy day. The cooling system did not operate during the entire day, whereas the day before, when the weather was sunny, the system operated normally. The maximum solar radiation was 215.7 W·m−2, as depicted in Figure 4b. The greenhouse air temperature, the test, and the control areas substrate temperature varied with the solar radiation change.
The maximum air temperature in the greenhouse was 30.4 °C, and the maximum substrate temperature in the control area was 30.6 °C. The maximum substrate temperatures in TS1 and TS2 were 28.4 and 27.4 °C, respectively, which were 2.2 and 3.2 °C lower than those in the control area. The average temperature of the substrate in the control area CK was 28.8 °C, and the average temperatures of the substrate of TS1 and TS2 test areas were 26.8 and 26.0 °C, respectively, which were 2.0 and 2.8 °C lower than those in the control area. Previous results demonstrate that although the cooling system did not operate on a cloudy day, its cooling effect on the previous day kept the substrate temperature relatively low.

3.1.3. Substrate Temperature for Seven Consecutive Days

While investigating the photovoltaic-driven substrate-cooling system, Zhang et al. [47] determined that the optimal root zone for tomato development was about 22 °C, with a maximum tolerance temperature of 33 °C. To understand the temperature distribution of the substrate in the test and the control areas, 20, 24, and 33 were used as temperature nodes during this experiment. The temperature of the root zone was divided into three temperature ranges of 20 °C ≤ T ≤ 24 °C, 24 °C ≤ T ≤ 33 °C, and T > 33 °C. The percentage of substrate temperature within different temperature ranges (20 August 2021–26 August 2021) was counted for seven days, and the results are demonstrated in Figure 5. Under an outdoor temperature range of 17 to 34 °C, the substrate temperatures of the experimental areas TS1 and TS2 did not exceed the maximum tolerance temperature of 33 °C in the tomato root zone. In contrast, the matrix temperature of the control area CK exceeded the maximum tolerance temperature of 33 °C in the tomato root zone 28% of the time. The times of substrate temperature for test areas TS1 and TS2 within the range of 20 °C ≤ T ≤ 24 °C were 7.3% and 30.6%, respectively, and the temperature in the control area CK was consistently above 24 °C.

3.1.4. Substrate’s Effective Accumulated Temperature in the Tomato Root Zone

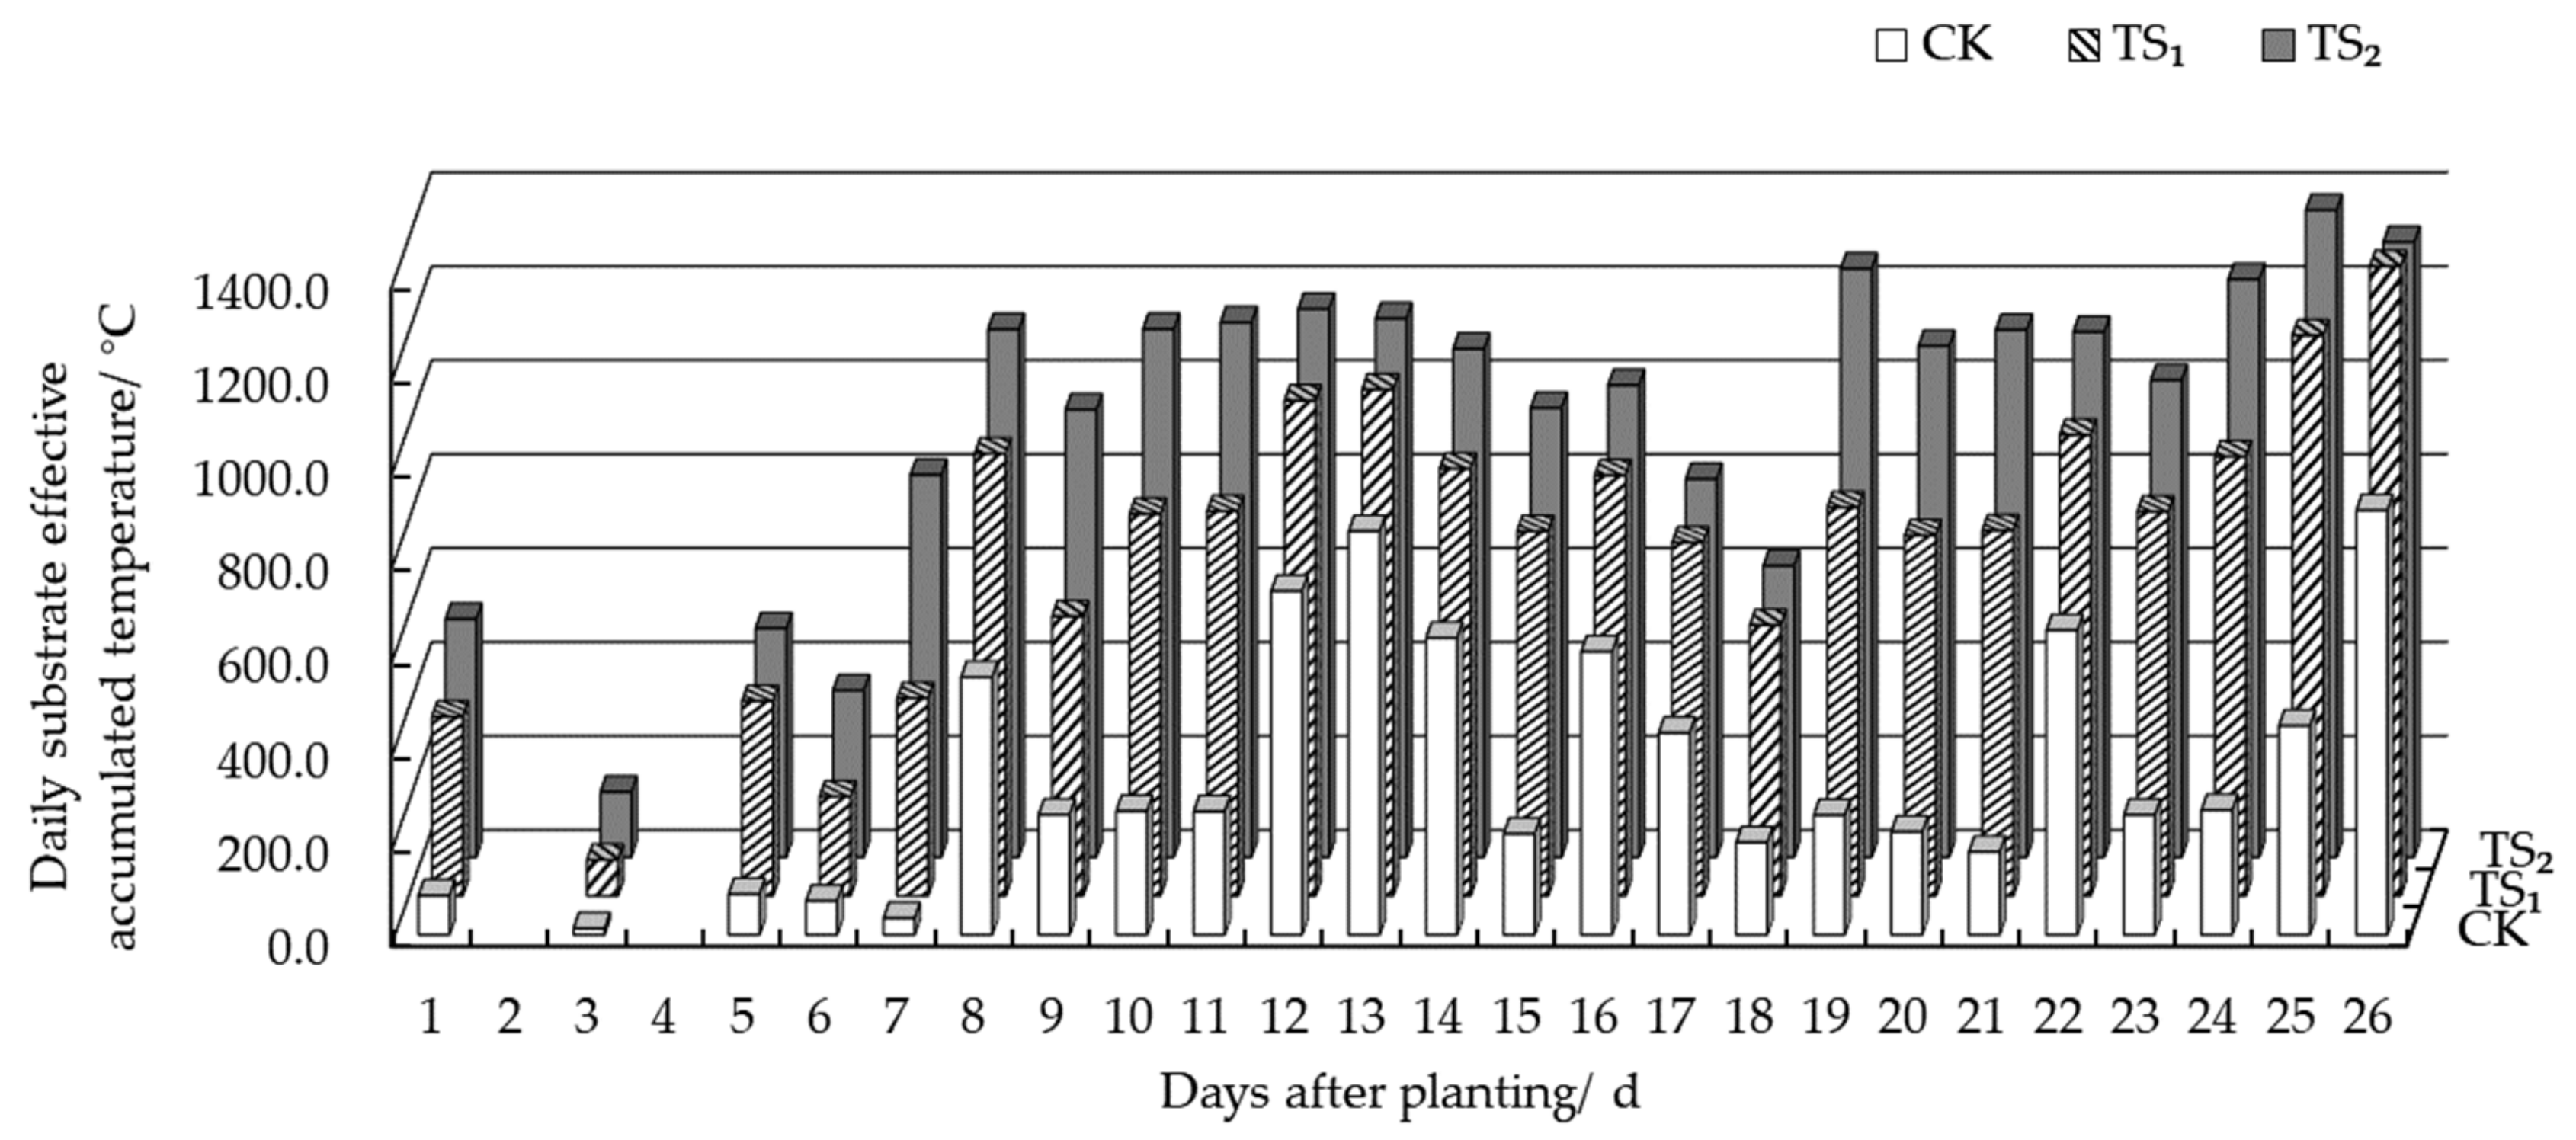
Figure 6 depicts the daily substrate’s effective accumulated temperature within 26 days after planting tomatoes under different treatments. Due to the incomplete data of the first day and the third day after tomato planting and the fact that data from the second day and the fourth day were not collected, the data were analyzed starting on the fifth day. Under the cooling treatment of WCTRZSCS, the daily substrate’s effective accumulated temperature in the test areas TS1 and TS2 for a total of 22 days were significantly higher than that in the control area CK. At the same time, the daily substrate effective accumulated temperature of the test area TS2 for 21 days was higher than that of TS1. The maximum and minimum daily substrate effective accumulated temperature in TS1, TS2, and CK were 904.0, 1340.7, and 1377.5 °C, and 211.4, 354.6, and 35.3 °C, respectively. Additionally, the average daily effective accumulated temperature of the substrate in the control area CK was 380.0 °C, and the average daily accumulated temperatures of the effective substrate in the test areas TS1 and TS2 were 813.7 and 1013.3 °C, respectively, which were 114.1% and 116.7% higher than the control area CK (except the date of the first four days during the calculation of the average values). Compared to CK, the cooling treatment may produce more optimal substrate temperature conditions for tomato growth and development. The better cooling effect of TS2 than TS1 was more conducive to tomato growth and development.

3.2. Effects of WCTRZSCS on Vegetative Growth of Tomato

On the fifth day after planting, due to the high temperature in the greenhouse, no necessary shading was applied at noon during the maximum solar radiation period, resulting in plant death. Among them, 14 and 15 plants died in TS1 and TS2, respectively, and the mortality rates were 29.2% and 31.3%, respectively. Twenty-three plants died in the control area, and the mortality rate in CK was 47.9%. After ten days of planting, there were no new plant deaths. Despite the death of plants in the test areas, the surviving plants grew well. The mortality rate in the control area was 18.7% and 16.3% higher than that in the test areas TS1 and TS2, respectively. The leaves of the surviving plants were yellow and rolled, and their growth was poor.

3.2.1. Effects of WCTRZSCS on Tomato Plant Height and Stem Diameter

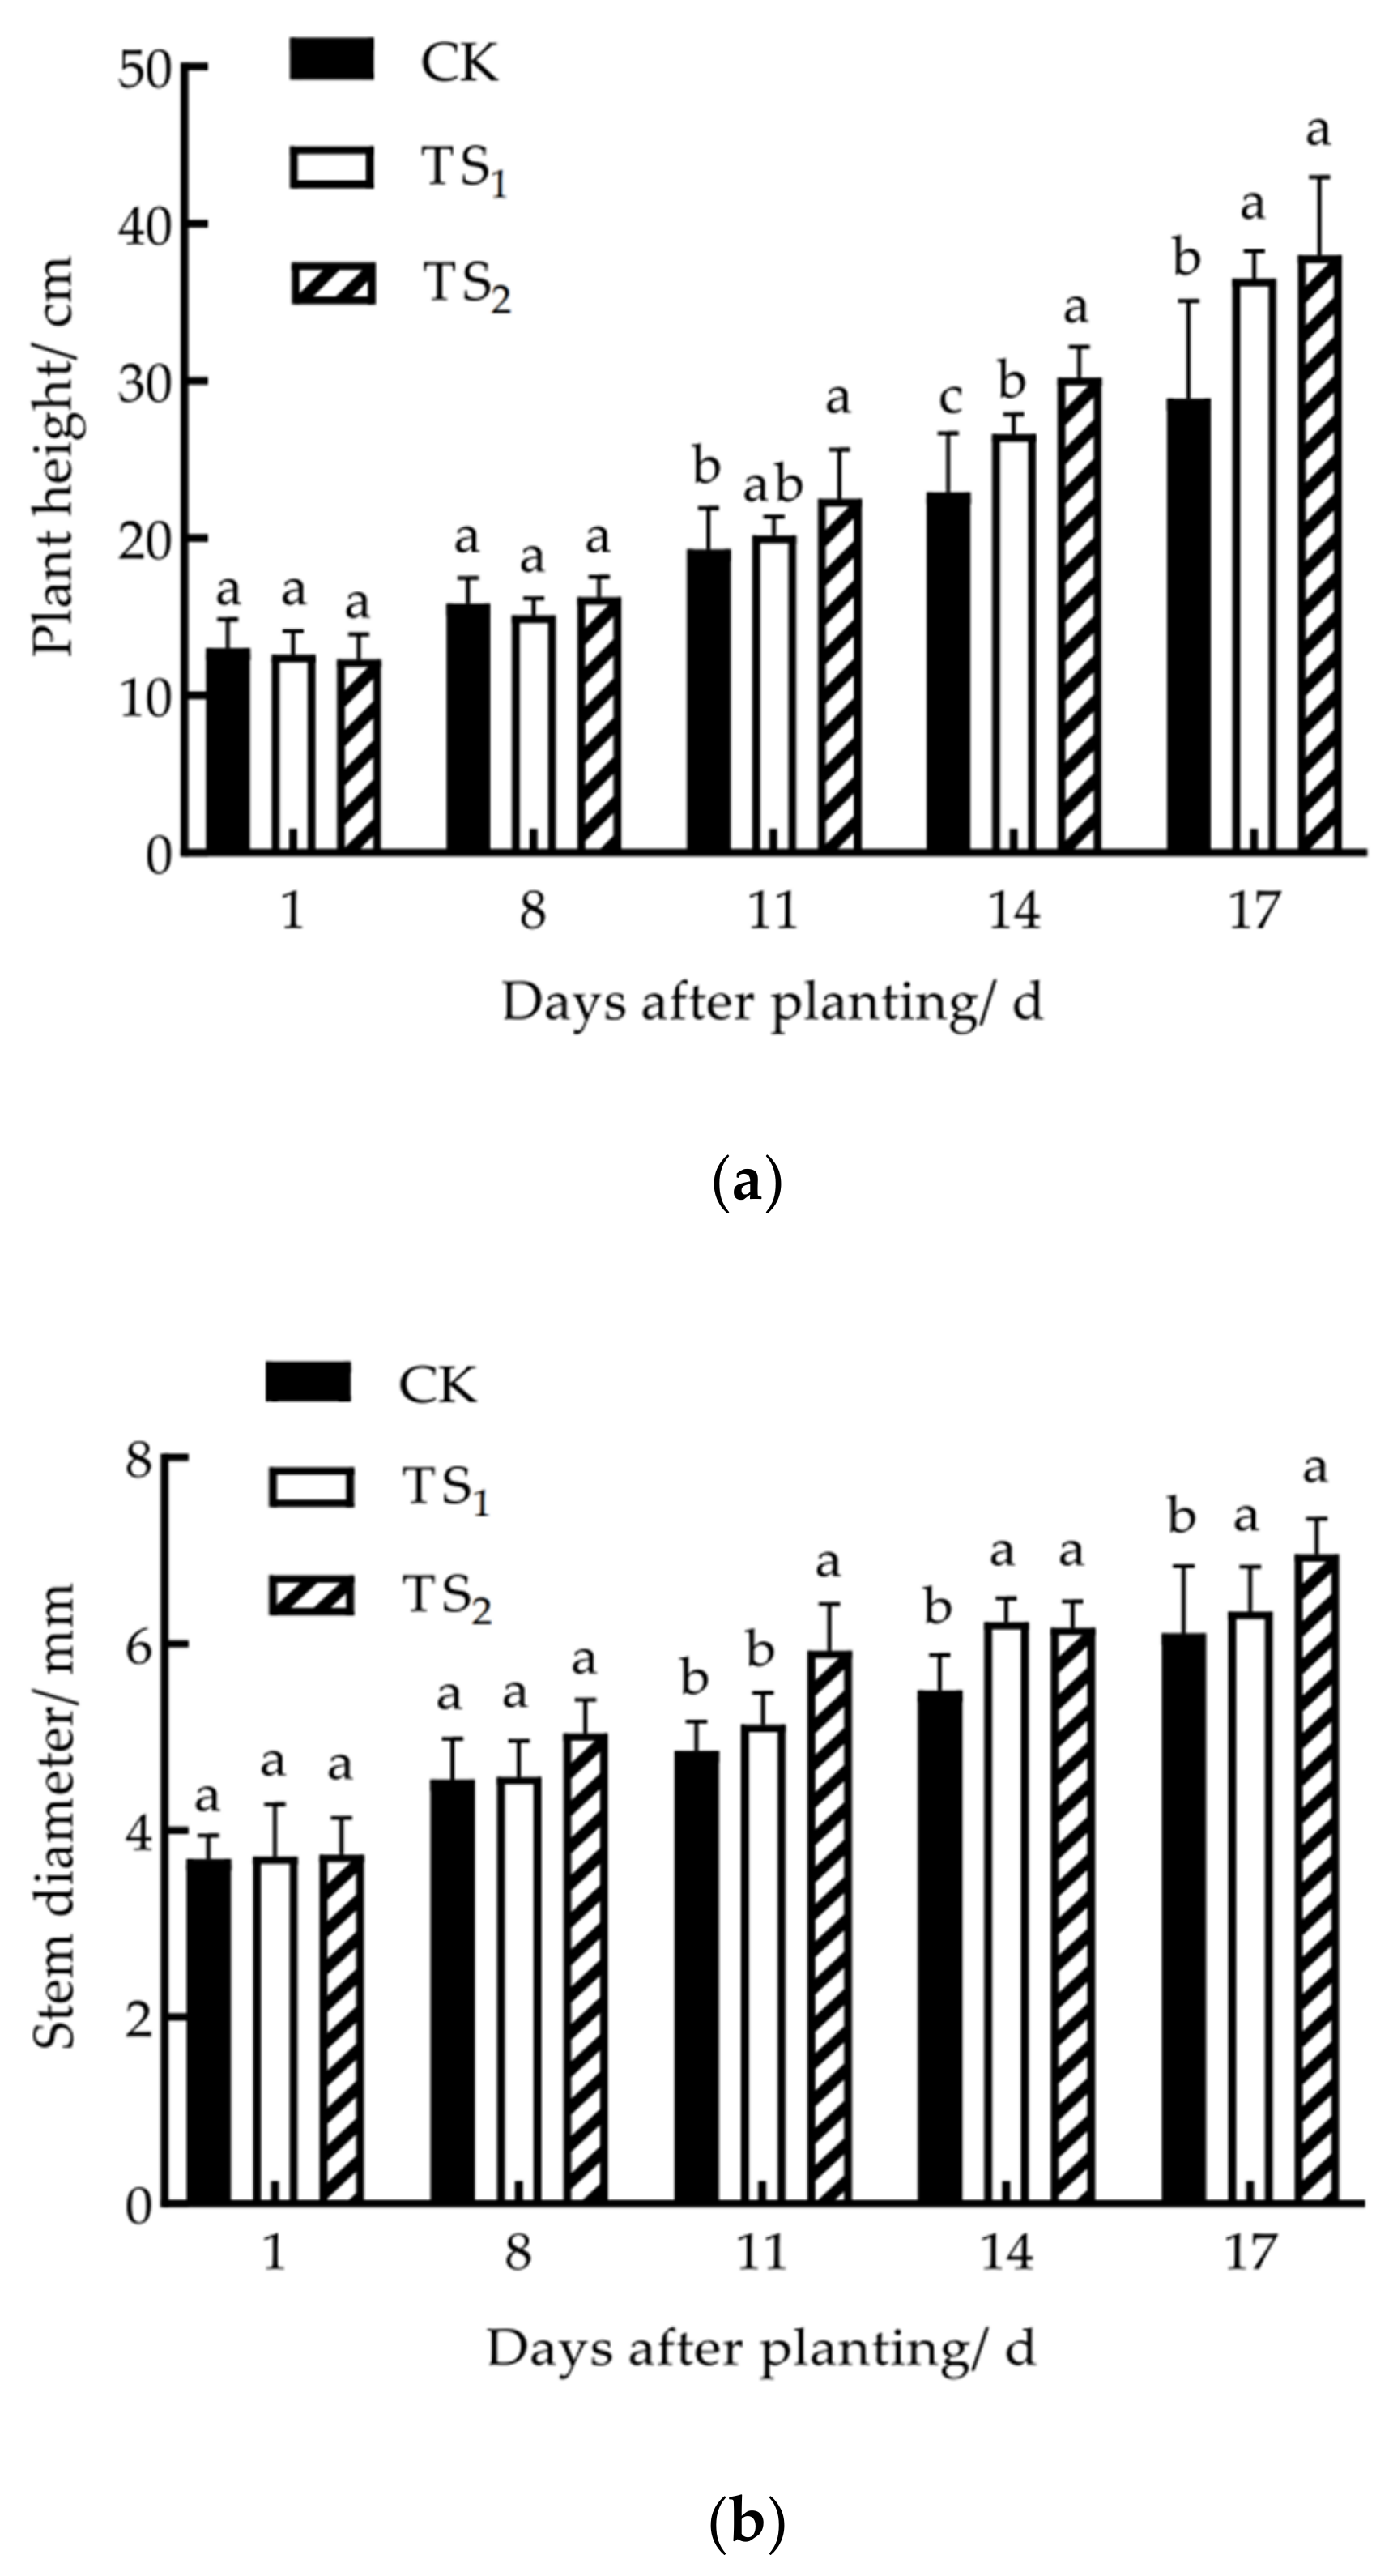
Figure 7 shows the effect of WCTRZSCS on the tomato plant height and stem diameter. It reveals that the plant height and stem diameter of tomatoes in TS1, TS2, and CK regions did not differ significantly within eight days of planting. As tomato plants grew, the significant difference between treatments and CK gradually became apparent. After the 11th (11 August 2021), 14th (14 August 2021), and 17th days (17 August 2021) after tomatoes were planted, the plant heights of TS1 were 20.2, 26.6, and 36.6 cm, respectively, and those of TS2 were 22.5, 30.2, and 38.0 cm, respectively. During these three days, the plant heights of TS1 were 0.9, 3.7, and 7.6 cm greater than those of CK, while the plant height of TS2 was 3.2, 7.3, and 9.1 cm greater. There were significant differences (p < 0.05) in plant height between TS2 and CK. After 14 and 17 days of planting, there were significant differences (p < 0.05) in plant height between the TS1 and CK regions. The significance of test areas TS2 and TS1 did not remain stable with plant growth. Similarly, the stem diameter of tomato plants in different treatments and control areas began to demonstrate significance 11 days after planting. The stem diameter and plant height had the same significance between TS2 and CK, TS1 and CK, and TS1 and TS2.

3.2.2. Effects of WCTRZSCS on Tomato Root Growth

After 26 days of experimentation (26 August 2021), eight tomato plants were randomly selected for root analysis in TS1, TS2, and CK. The results demonstrated in Table 3 show that the total root length, total root projection area, and total root surface area of TS1 tomato in the experimental area were 17.6%, 8.6%, and 9.1% higher, respectively, than the control area (CK), with differences being statistically significant (p < 0.05). The total root length and total root surface area of tomato in the test area TS2 were 19.6% and 11.1% higher than the control area CK, and these differences were significant (p < 0.05). However, there was no discernible difference between TS1 and TS2 tomato roots.

3.2.3. Effects of WCTRZSCS on Tomato Leaf Area, Fresh and Dry Weight, and Net Photosynthetic Rate

After 26 days (26 August 2021), the dry weight, fresh weight, and leaf area of eight selected tomato plants were measured, as displayed in Table 4. Compared to CK, the leaf area of TS1 and TS2 increased by 48.4% and 59%, respectively. The net photosynthetic rate increased by 23.1% and 27.8% relative to CK, while the dry weight increased by 51.5% and 71.8% compared to CK. The fresh weight increased by 56.1% and 76.5% compared with the control area. There were significant differences in leaf area, net photosynthetic rate, dry weight, and fresh weight between TS1 and TS2 and CK (p < 0.05). Although there was an insignificant difference between TS1 and TS2, the leaf area and net photosynthetic rate of TS2 increased by 7.2% and 3.8%, respectively, and its dry and fresh weight increased by 13.5% and 13.1%, respectively, compared to TS1.

3.2.4. Effects of WCTRZSCS on Tomato Growth Rate and Light-Utilization Efficiency

The effects of the root zone cooling system on tomato growth rate and light-utilization efficiency are demonstrated in Table 5. The growth status of all plants was consistent during colonization. The tomato growth rate and light-utilization efficiency varied according to the treatments. The tomato growth rates of CK, TS1, and TS2 were 2.66, 4.26, and 4.82 g/d, respectively. The tomato growth rates in test areas TS1 and TS2 increased by 60.2% and 81.2%, respectively, compared to the control area CK, while tomato growth rates in the test area TS2 increased by 13.1% compared to TS1. Regarding light-energy utilization, TS1 and TS2 were also higher than the control area CK, with a respective increase of 56.3% and 81.3%, respectively.

3.3. Effects of WCTRZSCS on Tomato Yield

The effect of WCTRZSCS on tomato yield is shown in Table 6: since in the control area CK did not use any cooling measures, all tomato plants in the CK died on 16 September 2021. The tomato yields of TS1 and TS2 in the test area were similar, about 0.80 kg·m−2 (with no significant difference). Although WCTRZSCS was opened in the test area, the greenhouse air temperature was still too high and the maximum air temperature in the greenhouse reached 50 °C. Under this condition, the tomato plants showed the phenomena of flowers without fruit, flower withering, and flower and fruit shedding. Additionally, the tomato plants were infected with yellow leaf curl virus. The number of fruits was decreased, and the fruits were small. The yield was much lower than that of tomatoes from the winter and spring period in solar greenhouse [50].

3.4. Energy Consumption Analysis

The overall energy consumption of the cooling system was computed for five consecutive days (21 August 2021–25 August 2021), and experimental data also include the variation in typical weather conditions. The results indicate that the energy consumption per unit ground area of the cooling system was 35.2~67.5 W·m−2, and the COP value of the system was 5.3~8.7, as demonstrated in Table 7.

3.5. Economic Assessment of WCTRZSCS

The economic assessment of WCTRZSCS includes the initial investment, installation and maintenance costs of the system, the energy consumption cost of the system during the summer (three months) operation, and the benefit to the tomato, taking into account the cooling performance of the system. The WCTRZSCS proposed in this paper is mainly composed of a chiller, heat-dissipation components (PE-RT pipes), a water pump, and a water storage tank. The service lives of the chiller and the PE-RT pipes are about 20 years and 50 years (below 80 °C) [51], respectively, so the service life of the whole system is about 20 years. The agricultural electricity price in Shaanxi Province is about 0.5 RMB·kW−1·h−1, and the cost per unit planting area is calculated by a planting density of 3.6 plants·m−2.
The results demonstrated in Table 8 show that the total cost of the WCTRZSCS was 23.6 RMB·m−2·year−1. Compared with CK, the tomato yield in the test area increased, but the tomato in the test area was infected with yellow mosaic virus, so the benefit of the system was –22 RMB·m−2. The cost of using the WCTRZSCS in the test area was not offset by the profit of tomatoes.

4. Discussion

Through the preliminary testing of the cooling performance of WCTRZSCS, the COP value of the system is 5.3~8.7, and its energy consumption per unit area is 35.2~67.5 W·m−2. This result is compared to the cooling power of 510.42 W·m−2 obtained by Zhang et al. [47] using a photovoltaic-driven substrate temperature control system to cool the tomato root zone. The energy consumption per unit area is reduced by 442.9~475.2 W·m−2, and the energy consumption decreases. Sun et al. [22] utilized the surface water in Facility Park as the cold source to cool the solar greenhouse in summer and at night using a heat pump. It was concluded that the COP value for the typical weather of the system was between 4.1 and 4.4, and the average daily cooling power consumption was between 19.3 and 19.9 W·m−2. The COP value (5.3~6.0) of the WCTRZSCS on a typical sunny day was increased by 29.3~36.4%. The energy consumption in our study was higher compared to that in Sun et al. However, the cooling of the preceding test occurred at night. In contrast, the cooling system in this experiment was designed to cool the substrate during the daytime high-temperature period. WCTRZSCS consumed more energy per unit area of refrigeration. Studies have shown that higher nighttime temperatures in the summer increase the respiration rate of plants, affect the accumulation of carbohydrates, cause seedlings to grow longer, reduce flower and fruit production, and reduce the biological and economic yield of vegetables [52]. Liu et al. [53] and Chen et al. [54] found that the temperature difference between day and night also affected tomato fruit setting rate, fruit transverse and longitudinal diameters, and single fruit weight. Under a daily average temperature of 25 °C, the internal quality of tomato fruit was optimal when the difference between day and night temperatures was 6 °C [55]. Therefore, based on the original operation strategy, the system operation at night can be increased to reduce the system energy consumption, and the substrate can be further cooled. The temperature difference between day and night can be increased to alleviate the cooling pressure of the cooling system in the daytime.
In addition, during the experiment, even in the test areas where WCTRZSCS was used, tomato seedlings died in the early planting stage in the TS1 and TS2 areas. However, no new dead plants were found after ten days of planting. Because the slow-growing seedling stage of roots is weak, resulting in less water and nutrient absorption, plants are prone to dying under high-temperature stress. Although WCTRZSCS reduced the substrate temperature of the test area, the greenhouse air temperature remained above 40 °C during the high-temperature period, up to 50 °C. In summer, the greenhouse high-temperature environment has many adverse effects on tomato growth, such as burning tomato leaves [56], decreasing tomato photosynthesis [57], and increasing tomato infection risk [58]. In this experiment, tomatoes in the test area were infected with yellow leaf curl virus from flowering to early fruiting, resulting in a serious decline in yield. Therefore, in the follow-up study, in order to ensure the good growth of tomato plants and achieve a high yield, we should also explore the cooling method of WCTRZSCS combined with shading, humidification, and other measures. Starting from the root zone temperature and air temperature, this provides a more suitable growth environment for plants compared with other systems, reduces the influence of high-temperature stress on plant growth and development, and increases yield and income for farmers.
This paper analyzes the average values of the water temperature measuring points at the inlet and outlet in TS1 and TS2 test areas on typical sunny days (24 August 2021) in order to fully comprehend the system’s change in water temperature in the flow direction, further comprehend the application potential of the system, and determine the direction of further research. The change in water temperature is depicted in Figure 8. After the cooling system was activated, the inlet and outlet water temperatures in TS1 and TS2 and the water temperature of the water storage tank began to decrease. The matrix was cooled by water circulation, and the water temperature increased. During the cooling system’s operation period, the average water temperature at the TS1 outlet was higher than that of the TS1 inlet, with a maximum temperature difference of 0.6 °C. The average water temperature of the TS2 outlet was higher than that of the TS2 inlet by a maximum temperature difference of 1.2 °C. The average water temperature of the TS2 outlet was higher than that of the TS1 outlet. The results presented above indicate that the temperature difference between the inlet and outlet water of TS1 and TS2 was small, indicating that WCTRZSCS has good potential and that the system’s cooling capacity can be further improved.
There are two possible explanations for the slight temperature difference between the inlet and return waters: first, the short planting length in the flow direction, which is only 4.2 m, and second, the velocity of the water. The next step can be confirmed based on two factors: (1) increasing the distance between the inlet and outlet, that is, increasing the planting length in the flow direction, and (2) altering the flow velocity.
This study investigates the feasibility of WCTRZSCS for cooling solar greenhouse substrate and its influence on tomatoes’ vegetative growth during summer. The effects of WCTRZSCS on flowering, fruit setting, yield, and quality of tomatoes are unknown and require additional study.

5. Conclusions

This study designed and evaluated a water-circulating tomato root-zone-substrate cooling system (WCTRZSCS). The effects of this system on the vegetative growth of tomatoes were analyzed. The results demonstrated that WCTRZSCS improved the substrate’s temperature conditions of the tomato root zone and exhibited good cooling performance. On a typical sunny day, the substrate temperature of the tomato root zone was reduced by 6.5 to 8.5 °C. Throughout the seven consecutive days, the substrate temperature of the tomato root zone was consistently below 33 °C (the maximum tolerance temperature of the tomato root zone). The system effectively alleviated the stress of a high-temperature environment in a greenhouse on tomato vegetative growth. It enhanced the growth rate and light-utilization efficiency of tomatoes in a high-temperature environment in a greenhouse. Significant differences (p < 0.05) were oud in tomato plant height, stem diameter, dry weight, fresh weight, leaf area, net photosynthetic rate, total root length, and total root projection area between the test and control areas. In terms of tomato yield, the profit from tomatoes cannot offset the cost of using WCTRZSCS, but the COP of the system can reach between 5.3 and 8.7, so the energy-saving effect is obvious. The good cooling performance and energy-saving performance of the system indicate its feasibility in the cooling of greenhouse substrate. Through further optimization of and improvement in the system, the combination of the system and the cooling technology of regulating air temperature may further improve the economy of the system, which is expected to be applied in future practical production.

Supplementary Materials

The following are available online at https://www.mdpi.com/article/10.3390/agronomy12081922/s1. Additional details regarding this research are available in Supplementary Materials at https://doi.org/10.6084/m9.figshare.20171399.

Author Contributions

Conceptualization, Y.C.; Data collection, S.Y. and L.G.; Data curation, X.L.; Figures, X.C.; Formal analysis, X.L.; Literature search, S.L. and R.Z.; Methodology, X.L.; Resources, Y.C.; Software, S.Y.; Supervision, Y.C.; Writing—original draft, X.L.; Writing—review and editing, X.L., S.Y., X.C., S.L., R.Z., and L.G.; Writing instruction, Y.S. All authors have read and agreed to the published version of the manuscript.

Funding

This research was funded by Shaanxi Province Key R&D Program Project grant number No. 2019TSLNY01-03, Shaanxi Province Technological Innovation Guidance Special Project grant number No. 2021QFY08-02, and Modern Agro-industry Technology Research System grant number No. CARS-23-C05.

Institutional Review Board Statement

Not applicable.

Informed Consent Statement

Not applicable.

Data Availability Statement

The data presented in this study are available in Supplementary Materials and the following are available online at https://doi.org/10.6084/m9.figshare.20480058.v1.

Conflicts of Interest

The authors declare no conflict of interest.

References

  1. Yuan, H.M.; Wang, G.F.; Fan, J.R.; Zhang, B.B.; Zhang, L.; Liu, S. Effect of high temperature stress on growth and floral bud differentiation of tomato seedlings. Acta Bot. Boreali-Occident. Sin. 2019, 39, 1768–1775. [Google Scholar]
  2. Sun, C.J.; Jin, Y.Z.; Wu, X.; Fan, B.W.; Song, Y.N.; Yang, F.J. Research status on the influence of high temperature stress on photosynthetic system of tomato and mitigating mechanism. J. Heilongjiang Aug. First Land Reclam. Univ. 2021, 33, 13–20. [Google Scholar]
  3. Central Document No.1 of 2022. Available online: http://www.gov.cn/zhengce/2022-02/22/content_5675035.htm (accessed on 10 July 2022).
  4. Wang, X.Z.; Zhang, W.J.; Zhang, L.; Guan, Z.F. Analysis of flow field for full open-roof glass greenhouse with nature ventilation in summer based on CFD. Trans. Chin. Soc. Agric. Mach. 2016, 47, 332–337. [Google Scholar]
  5. Huang, Z.Y.; Gao, H.T.; Zhu, S.L.; Zhao, C.Y.; Cai, C.H. Optimization design of mechanical ventilation for multi-span plastic greenhouses in southern china during summer. Trans. Chin. Soc. Agric. Mach. 2017, 48, 252–259. [Google Scholar]
  6. Sun, X.C.; Zhang, Z.W.; Huang, L.; Jiang, W.; Chen, W.P.; Yang, L.Y.; Kang, J.; Peng, Y.Q.; Wang, Z. Research progress in and expectation of greenhouse cooling technology. South China Agric. 2021, 15, 42–47. [Google Scholar]
  7. Ali, I.M.; Albayati, H.D.R. Influence of covering materials and shading on the greenhouse cooling in Iraq. Al-NJES 2017, 20, 262–271. [Google Scholar]
  8. Shi, Y.; Yao, Q.; Zhang, Y.; Miao, Y.X.; Hou, L.P. Effects of shade-cooling agent on the environment of solar greenhouse. J. Shanxi Agric. Sci. 2019, 47, 598–1602. [Google Scholar]
  9. Park, S.H.; Moon, J.P.; Kim, J.K.; Kim, S.H. Development of fog cooling control system and cooling effect in greenhouse. Prot. Hortic. Plant Fact. 2020, 29, 265–276. [Google Scholar] [CrossRef]
  10. Sun, W.T.; Zhou, B.; Xu, F.; Shang, C.; Lu, C.G.; Guo, W.Z. Performance of positive pressure fan-pad cooling system and cooling load model for Chinese solar greenhouse. Trans. Chin. Soc. Agric. Eng. 2019, 35, 214–224. [Google Scholar]
  11. Liu, Y.J.; Xu, J.T.; Pang, S.R.; Sun, Z.P.; Li, T.L. Design of positive- pressure wet curtain fan system for solar greenhouse and its cooling effects. J. China Agric. Univ. 2019, 24, 130–139. [Google Scholar]
  12. Li, Y.X.; Li, B.M.; Wang, C.Y.; Shi, Y.P. Effects of Shading and roof sprinkling in venlo-type greenhouse in summer. Trans. Chin. Soc. Agric. Eng. 2002, 2002, 127–130. [Google Scholar]
  13. Ghoulem, M.; El Moueddeb, K.; Nehdi, E.; Zhong, F.L.; Calautit, J. Design of a passive downdraught evaporative cooling windcatcher (PDEC-WC) system for greenhouses in hot Climates. Energies 2020, 13, 2934. [Google Scholar] [CrossRef]
  14. McCartney, L.; Lefsrud, M.G. Field trials of the natural ventilation augmented cooling (NVAC) greenhouse. Biosyst. Eng. 2018, 174, 159–172. [Google Scholar] [CrossRef]
  15. Moreno-Teruel, M.Á.; Molina-Aiz, F.D.; López-Martínez, A.; Marín-Membrive, P.; Peña-Fernández, A.; Valera-Martínez, D.L. The influence of different cooling systems on the microclimate, photosynthetic activity and yield of a tomato crops (Lycopersicum esculentum Mill.) in mediterranean greenhouses. Agronomy 2022, 12, 524. [Google Scholar] [CrossRef]
  16. Wang, T.; Gao, J.M.; Zhou, Y.; Wang, S.X. The study of cooling technology in totally enclosed solar greenhouse. J. Agric. Mech. Res. 2018, 40, 264–268. [Google Scholar]
  17. Yuan, D.; Qin, Z.J.; Wu, Z.H.; Liang, H.; Li, Y.Y.; Wang, B.J.; Wang, L.P. Effect of Estival screen-shading and spray cooling on growth and quality of over summer Chinese cabbage in solar greenhouse. China Veg. 2019, 2019, 62–66. [Google Scholar]
  18. Liu, D.Z. Experiment on the Effect of Heat Exchange System in the Ground on the Summer Cooling Effect of Greenhouse. Master’s Thesis, Northwest A&F University, Xianyang, China, 2019. [Google Scholar]
  19. Qi, D.; Zhao, C.Y.; Li, S.X.; Chen, R.; Li, A. Numerical assessment of earth to air heat exchanger with variable humidity conditions in greenhouses. Energies 2021, 14, 1368. [Google Scholar] [CrossRef]
  20. Soussi, M.; Chaibi, M.; Buchholz, B.; Saghrouni, Z. Comprehensive review on climate control and cooling systems in greenhouses under hot and arid conditions. Agronomy 2022, 12, 626. [Google Scholar] [CrossRef]
  21. Angmo, P.; Phuntsog, N.; Namgail, D.; Chaurasia, O.P.; Stobdan, T. Effect of shading and high temperature amplitude in greenhouse on growth, photosynthesis, yield and phenolic contents of tomato (Lycopersicum esculentum Mill). Physiol. Mol. Biol. Plants 2021, 27, 1539–1546. [Google Scholar] [CrossRef]
  22. Sun, W.T.; Zhang, Y.; Yang, Q.C.; Xue, X.Z.; Guo, W.Z. Nighttime cooling of solar greenhouse in summer based on water source heat pump system. Res. Agric. Mod. 2017, 38, 885–892. [Google Scholar]
  23. Karnoutsos, P.; Karagiovanidis, M.; Bantis, F.; Chatzistathis, T.; Koukounaras, A.; Ntinas, G.K. Controlled root-zone temperature effect on baby leaf vegetables yield and quality in a floating system under mild and extreme weather conditions. J. Sci. Food Agric. 2021, 101, 3933–3941. [Google Scholar] [CrossRef]
  24. Inkham, C.; Hongpakdee, P.; Kajornrungsilp, I.; Thanamatee, C.; Ruamrungsri, S. Root-zone cooling by cold energy from LNG regasification process for quality improvement of flower and bulb of Hippeastrum. Hortic. Environ. Biotechnol. 2020, 61, 643–650. [Google Scholar] [CrossRef]
  25. Aidoo, M.K.; Sherman, T.; Lazarovitch, N.; Fait, A.; Rachmilevitch, S. Physiology and metabolism of grafted bell pepper in response to low root-zone temperature. Funct. Plant Biol. 2019, 46, 339. [Google Scholar] [CrossRef] [PubMed]
  26. Nguyen, D.T.P.; Lu, N.; Kagawa, N.; Takagaki, M. Optimization of Photosynthetic Photon Flux Density and Root-Zone Temperature for Enhancing Secondary Metabolite Accumulation and Production of Coriander in Plant Factory. Agronomy 2019, 9, 224. [Google Scholar] [CrossRef]
  27. Yan, Q.Y.; Duan, Z.Q.; Li, X.; Dong, J.L.; Wang, Y.H.; Xing, P.; Dong, F. Effect of root zone temperature on growth of cucumber and nutrient utilization in soils. Acta Pedol. Sin. 2013, 50, 752–760. [Google Scholar]
  28. Xia, Z.Q.; Zhang, G.X.; Zhang, S.B.; Wang, Q.; Fu, Y.F.; Lu, H.D. Efficacy of root zone temperature increase in root and shoot development and hormone changes in different maize genotypes. Agriculture 2021, 11, 477. [Google Scholar] [CrossRef]
  29. Fu, G.H.; Yang, Q.C.; Liu, W.K.; Yan, W.K. Research progress about effects of root zone temperature on physiology and ecology of protected horticulture crops. China Veg. 2016, 10, 20–27. [Google Scholar]
  30. Shigeoki, M.; Hirotada, N.; Atsushi, I. Partial cooling of strawberry plants by water tube utilizing geo-thermal heat pump. J. Appl. Hortic. 2017, 19, 186–190. [Google Scholar] [CrossRef]
  31. Oh, W.; Park, J.H.; Kim, H.K.; Rhie, Y.H.; Chun, C.; Kim, K.S. Root-Zone Cooling Improves Growth of Cyclamen persicum under Heat Stress. Hortic. Environ. Biotechnol. 2007, 48, 68–72. [Google Scholar]
  32. Moon, J.P.; Kang, G.C.; Kwon, J.K.; Lee, S.J.; Lee, J.N. Spot Cooling System Development for Ever-bearing Strawberry by Using Low Density Polyethylene Pipe. J. Korean Soc. Agric. Eng. 2014, 56, 149–158. [Google Scholar]
  33. Li, S.L.; Zhang, T.; Sun, Z.Q. Root-zone cooling effect of water-cooled seedling bed under different periods and its influences on growth of tomato seedling. Trans. Chin. Soc. Agric. Eng. 2015, 31, 192–196. [Google Scholar]
  34. Li, S.L.; Shi, X.D.; Xia, Y.Z.; Sun, Z.Q. Root-zone cooling effect of water-cooled seedling bed on growth of tomato seedling. Trans. Chin. Soc. Agric. Eng. 2014, 30, 212–218. [Google Scholar]
  35. Wang, Y.L.; Zhang, W.J. Empirical analysis of coupling relationship between water environment and economic development in northwest China. J. Water Resour. Water Eng. 2021, 32, 56–60. [Google Scholar]
  36. MCarmen, G.D.; Jose, S.R.; Daniel, C.M.; Teresa Rocio, T.R.; Alberto, C.-N.; Servando, A.D. Fresnel solar cooling plant for buildings: Optimal operation of an absorption chiller through inverse modelling. Energy Rep. 2022, 8, 3189–3212. [Google Scholar]
  37. Chen, Y.Z.; Xu, J.Z.; Wang, J.; Lund, P.D. Optimization of a weather-based energy system for high cooling and low heating conditions using different types of water-cooled chiller. Energy 2022, 252, 124094. [Google Scholar] [CrossRef]
  38. Xu, Y.H.; Luo, X.B.; Tu, Z.K. 4E analysis of a SOFC-CCHP system with a LiBr absorption chiller. Energy Rep. 2022, 8, 5284–5295. [Google Scholar] [CrossRef]
  39. Yan, Q.T.; Liu, W.; Li, J.B.; Yan, H.Y.; Wang, X.W. Local Cooling Technology of Long Tunnels Based on Air-Cooled Chillers. Tunnel Constr. 2021, 41, 2093–2097. [Google Scholar]
  40. Xu, Q.; Ji, C.Z.; Jiang, Y.X.; Yu, J.; Xia, Y.J.; Chen, Z. Application of LiBr Absorption Chiller on Passenger Ship. Ship Eng. 2021, 43, 278–281. [Google Scholar]
  41. He, S.X.; Wu, Y.M.; Li, S.H.; Song, Z.Y.; Shen, L.Y.; Tong, J.D.; Cao, J.Q. Research on energy efficiency improvement of refrigerators in glass fiber industry. Fiber Glass 2021, 6, 27–30. [Google Scholar]
  42. Chen, Z.B.; Cheng, Y.; Tan, H.; Xie, Q. Spray cooling performance of a spray drum cooler. Iron Steel 2020, 55, 116–123. [Google Scholar]
  43. Chan, T.S.; Chang, Y.C.; Huang, J.H. Application of artificial neural network and genetic algorithm to the optimization of load distribution for a multiple-type-chiller plant. Build. Simul. 2017, 10, 711–722. [Google Scholar] [CrossRef]
  44. Karami, M.; Wang, L.P. Particle Swarm optimization for control operation of an all-variable speed water-cooled chiller plant. Appl. Therm. Eng. 2018, 130, 962–978. [Google Scholar] [CrossRef]
  45. Huang, T.T.; Liang, C.H.; Bai, X.; Feng, Z.H.; Wang, F. Study on the feature-recognition-based modeling approach of chillers. Int. J. Refrig. 2019, 100, 326–334. [Google Scholar] [CrossRef]
  46. Li, Z.G.; Yang, Q.C.; Cha, L.Y.; Zhang, Y.B.; Liu, W.K. Temperature Characteristics in Root Zone and Inter Plants of Tomato Cultivated with Soil Ridged Substrate- Cultivation in Summer in Chinese Solar Greenhouse. Shandong Agric. Sci. 2018, 50, 41–44. [Google Scholar]
  47. Zhang, Y.; Ni, X.Y.; Zhang, K.X.; Xu, Y.J. Cooling performance for tomato root zone with intelligent ecological planting matrix temperature control system driven by photovoltaic in greenhouse. Trans. Chin. Soc. Agric. 2020, 36, 212–219. [Google Scholar]
  48. Ji, F.; Gan, P.D.; Liu, N.; He, D.X.; Yang, P. Effects of LED spectrum and daily light integral on growth and energy use efficiency of tomato seedlings. Trans. Chin. Soc. Agric. Eng. 2020, 36, 231–238. [Google Scholar]
  49. Li, Y.D. Effects of Cultivation Mode and Plant Growth Regulator on Growth and Development of Tomato. Master’s Thesis, Northeast Agricultural University, Harbin, China, 2018. [Google Scholar]
  50. Wang, C.X.; Gu, F.; Chen, J.L.; Yang, H.; Jiang, J.J.; Du, T.S.; Zhang, J.H. Assessing the response of yield and comprehensive fruit quality of tomato grown in greenhouse to deficit irrigation and nitrogen application strategies. Agric. Water Manag. 2013, 161, 9–19. [Google Scholar] [CrossRef]
  51. Tang, M.Z. Technology and application of heat resistant polyethylene (PE-RT Ⅱ) pipe for thermal insulation. China Rubber/Plast. Technol. Equip. 2021, 12, 008. [Google Scholar]
  52. Li, T.L. Current Situation and Prospects of Green House Industry Development in China. J. Shenyang Agric. Univ. 2005, 2, 131–138. [Google Scholar]
  53. Liu, J.; Cui, T.; Wang, C.D.; Li, X.; Ma, C.W.; Zhang, T.Z. Cooling Technology of Multi-span Greenhouse in Summer. J. Agric. Mech. Res. 2018, 40, 262–268. [Google Scholar]
  54. Chen, Y.Q.; Zhao, X.; Liu, Z.X.; Yang, Z.Q. Effect of Difference Between Day and Night Temperature on Fruit Development and Yield of Tomato. North. Hortic. 2014, 24, 38–42. [Google Scholar] [CrossRef]
  55. Yang, Z.Q.; Wang, X.L.; Peng, X.D.; Zhao, X.; Yuan, X.K.; Han, X.J. Effect of difference between day and night temperature on nutrients and dry mass partitioning of tomato in climate chamber. Trans. Chin. Soc. Agric. 2014, 30, 138–147. [Google Scholar]
  56. Huang, Y.H.; Li, Y.L.; Wen, X.Z. The effect of different air humidity on vegetative growth of greenhouse tomato under high temperature. North Hortic. 2010, 15, 138–143. [Google Scholar]
  57. Fan, Y.J.; Jiang, H.M.; Wen, X.Z.; Bai, L.Q.; Li, Y.L. Effects of long-term elevated CO2 coupled high temperature on the photosynthesis and content of starch of tomato leaves. J. Shanxi Agric. Sci. 2022, 50, 41–45. [Google Scholar]
  58. Anfoka, G.; Moshe, A.; Fridman, L.; Amrani, L.; Rotem, O.; Kolot, M.; Zeidan, M.; Czosnek, H.; Gorovits, R. Tomato yellow leaf curl virus infection mitigates the heat stress response of plants grown at high temperatures. Sci. Rep. 2016, 6, 19715. [Google Scholar] [CrossRef] [PubMed]
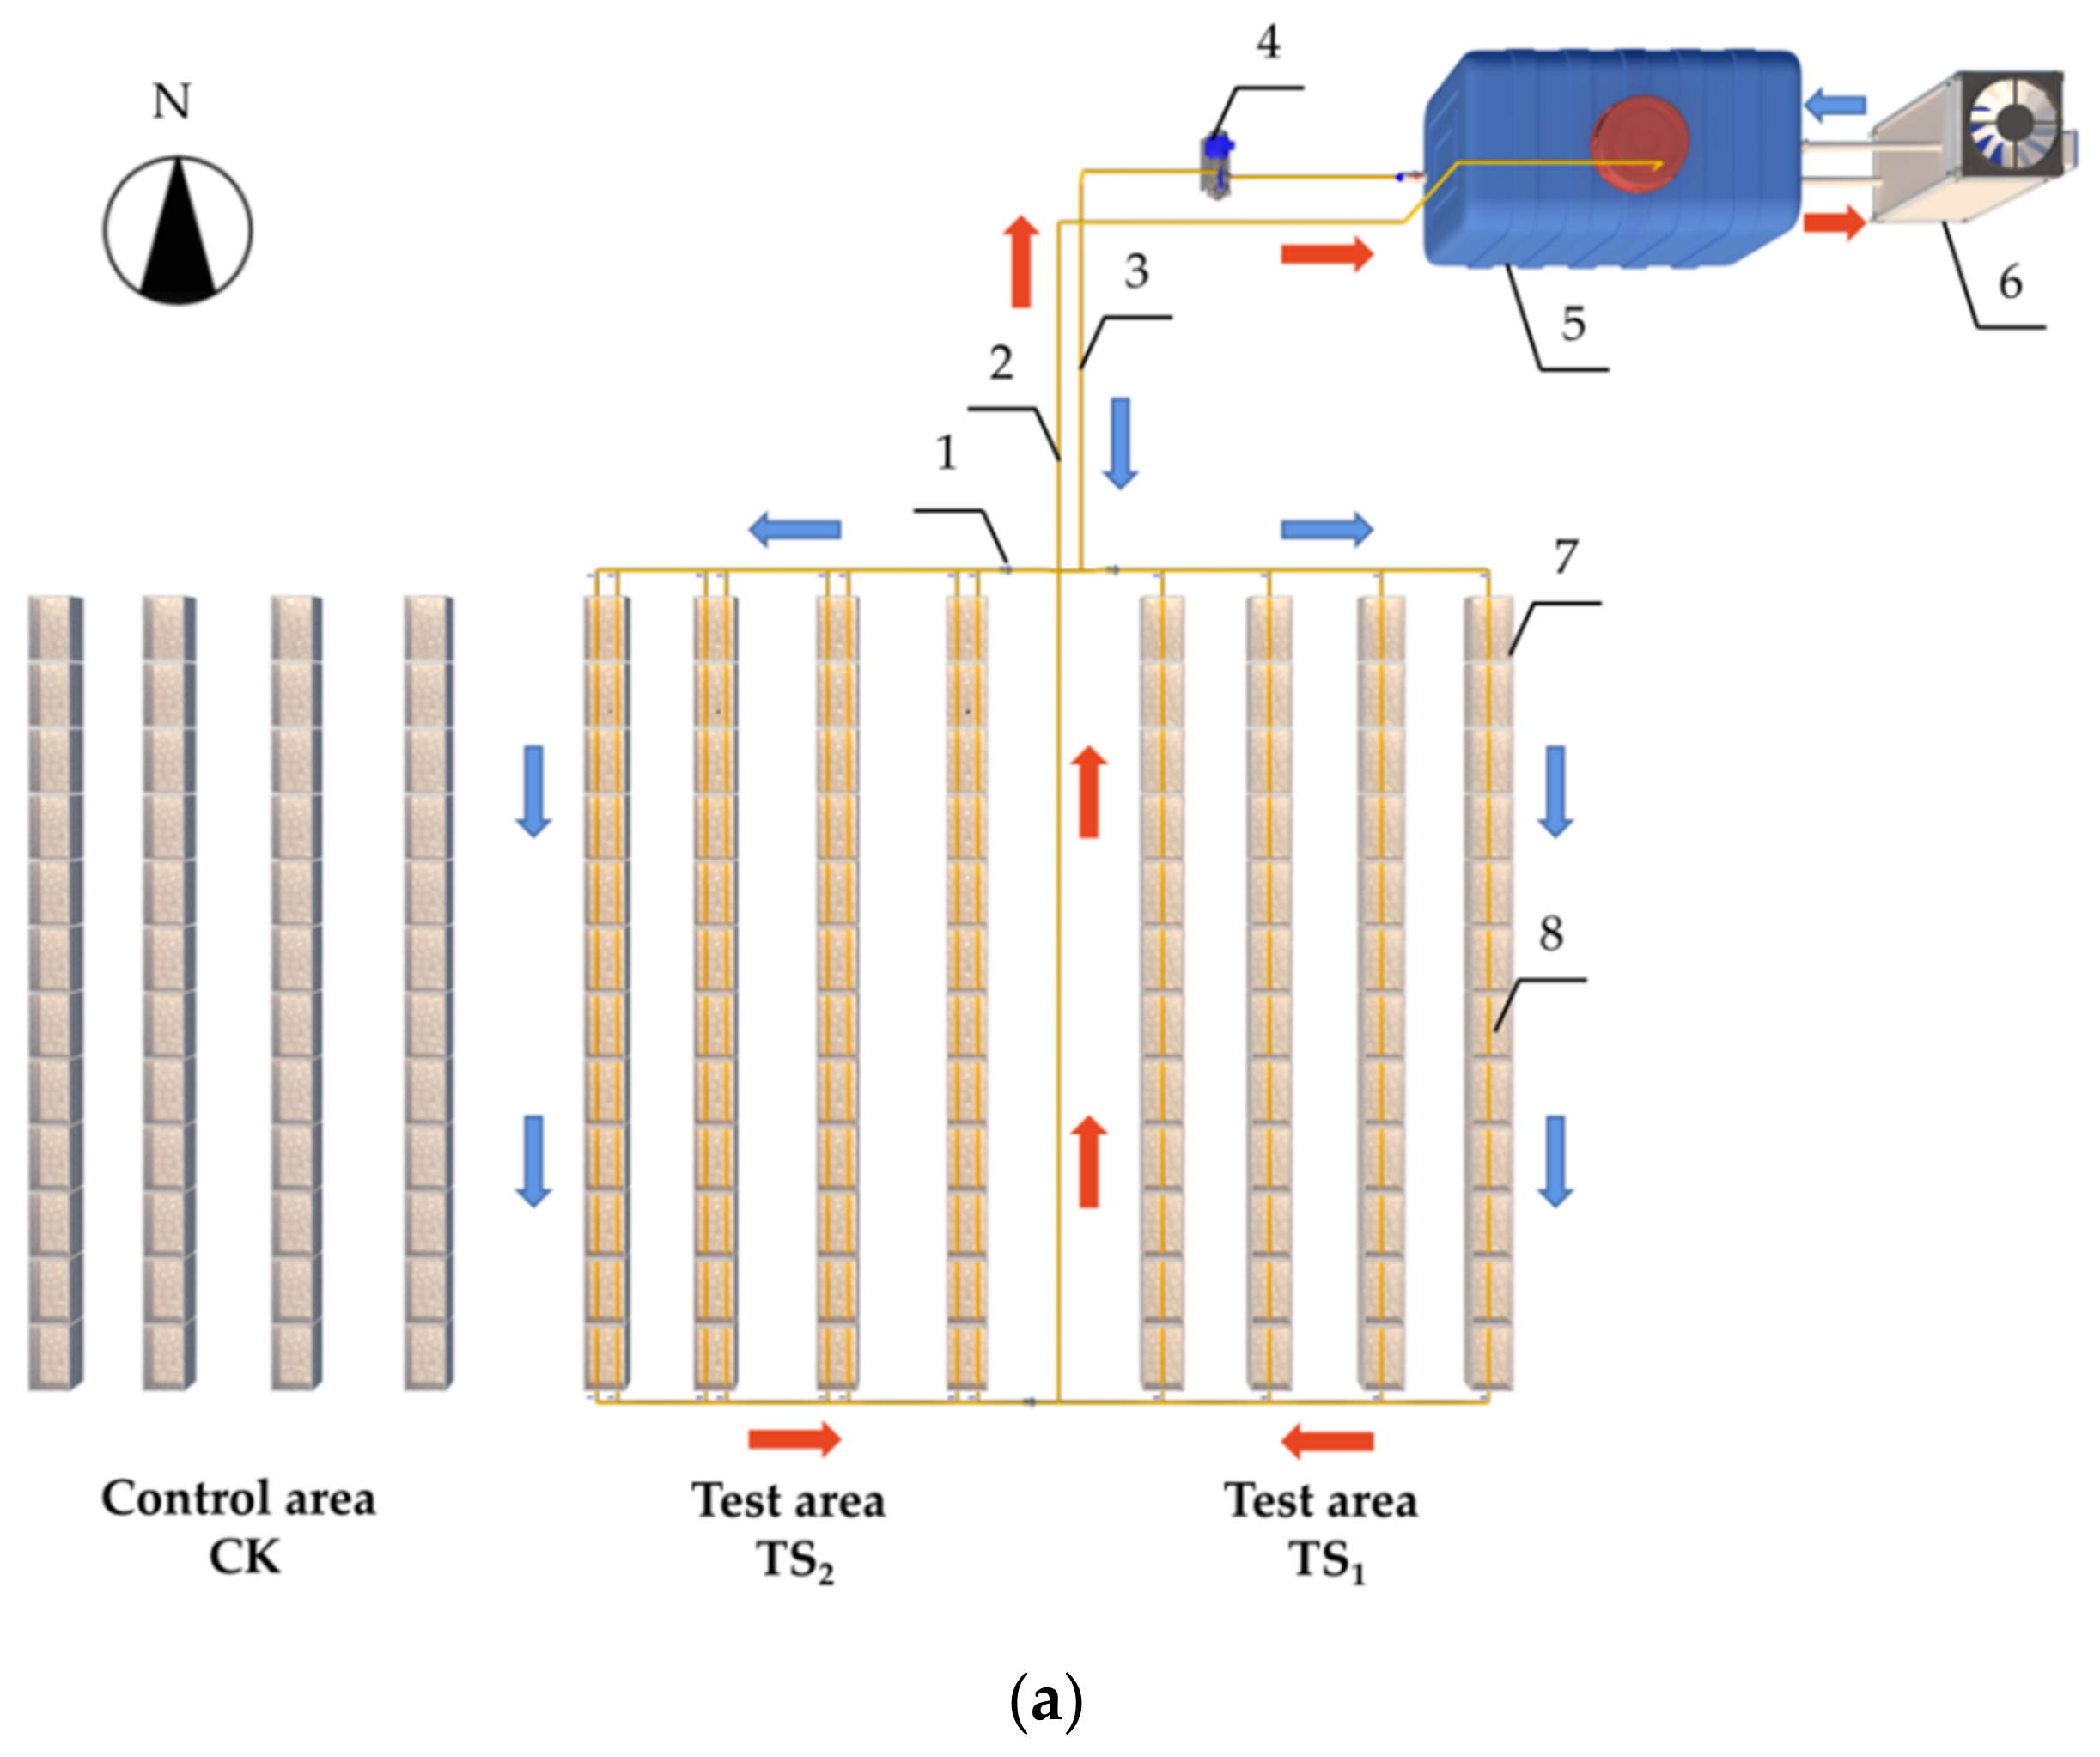
Figure 1. Schematic diagram of WCTRZSCS. (a) Integrated schematic diagram; (b) Local schematic diagram: 1 is a solenoid valve, 2 is water return pipe, 3 is water supply pipe, 4 is a water pump, 5 is a water storage tank, 6 is a chiller, 7 is a foam box, 8 is a polyethylene raised-temperature-resistance (PE-RT) pipe, 9 is a substrate temperature sensor, 10 is an arrow dripper, and 11 is transparent plastic film. Blue arrow and red arrow represent the inflow direction and return direction respectively.
Agronomy 12 01922 g001aAgronomy 12 01922 g001b
Figure 2. Diagrammatic drawing of experimental greenhouse.
Agronomy 12 01922 g002
Figure 3. Placement of sensors required for the test. (a) The placement of sensors in the vertical direction; (b) the placement of sensors on the horizontal plane. Agronomy 12 01922 i001 is the solar radiation sensor. Agronomy 12 01922 i002 is the temperature and humidity sensor. Agronomy 12 01922 i003 is substrate temperature sensor. Agronomy 12 01922 i004 is the water temperature sensor.
Agronomy 12 01922 g003
Figure 4. The variation of the substrate temperature under typical weather conditions. (a) Sunny day; (b) cloudy day.
Agronomy 12 01922 g004aAgronomy 12 01922 g004b
Figure 5. Percentage of substrate temperature in each temperature interval for seven consecutive days.
Agronomy 12 01922 g005
Figure 6. Daily substrate’s effective accumulated temperature of different treatments following tomato planting.
Agronomy 12 01922 g006
Figure 7. Effects of WCTRZSCS on tomato plant height and stem diameter. (a) Plant height; (b) stem diameter. Different lowercase letters on the same day indicate significant differences between different regions (p < 0.05).
Agronomy 12 01922 g007
Figure 8. Temperature change in the water temperature measuring point of WCTRZSCS.
Agronomy 12 01922 g008
Table 1. Detail information of the sensors.
SensorsType/ModelAmountMeasurement RangeAccuracyManufacturer
Substrate temperature sensorPT1009−50~100 °C0.2% FSSONGDAO, Shanghai, China
Water temperature sensorCopper-Copper
Nickel T
Thermocouple
9−200~200 °C±2 °CZHUJIANG, Shanghai, China
Air temperature and humidity sensorHSTL-102WS1−20~50 °C
0% RH~100% RH
/HUAKONG, Beijing, China
Solar radiation sensorHSTL-FSDJY10–1500 W/m2/HUAKONG, Beijing, China
Table 2. Detail information of the instruments.
Instruments/SoftwareModelMeasurement RangeAccuracyManufacturer
Agilent data acquisition/switch unit34970A//Keysight, Penang, MY
Data collection controllerJY-DAM16CC//JUYING ELECTRONIC, Beijing, China
Electricity meterDDSU666//CHINT, Shanghai, China
Differential scanning calorimeterQ100/±0.05 °C
±1%
TA, USA
Photosynthesis systemLI-6400//LI-COR, USA
Electronic balanceBSA224S10 mg~220 g0.1 mgSartorius, China
Leaf area meterCI-202//CID, USA
Root analysis softwareSTD4800//Regent, Canada
Table 3. Effects of WCTRZSCS on tomato roots.
AreaTotal Length/cmTotal Projection Area/cm2Total Surface Area/cm2
CK330.90 ± 64.99 b16.00 ± 1.59 b20.54 ± 2.40 b
TS1389.15 ± 29.36 a17.37 ± 0.41 a22.40 ± 1.37 a
TS2395.66 ± 12.71 a17.77 ± 0.18 a22.26 ± 0.72 ab
Note: Different lowercase letters in the same column indicate significant differences between different regions (p < 0.05).
Table 4. Effects of WCTRZSCS on leaf area, fresh and dry weight, and net photosynthetic rate.
AreaLeaf Area/cm2Net Photosynthesis Rate/(μmol·m2·s1)Dry Weight/gFresh Weight/g
CK1100.30 ± 162.12 b26.54 ± 4.64 b7.21 ± 0.73 b76.26 ± 12.30 b
TS11632.73 ± 369.51 a32.67 ± 3.00 a10.92 ± 3.48 a119.04 ± 28.95 a
TS21749.66 ± 227.73 a33.91 ± 2.21 a12.39 ± 3.05 a134.58 ± 23.19 a
Note: Different lowercase letters in the same column indicate significant differences between different regions (p < 0.05).
Table 5. Effects of WCTRZSCS on tomato growth rate and light-utilization efficiency.
AreaGrowth Rate/g·d−1Light-Utilization Efficiency/%
CK2.660.16
TS14.260.25
TS24.820.29
Table 6. Effects of WCTRZSCS on tomato yield.
AreaYield/kg·m2
CK/
TS10.80 ± 0.02 A
TS20.83 ± 0.03 A
Note: The same capital letters in the same column indicate that there are no significant differences between different regions (p < 0.1).
Table 7. Cooling performance of WCTRZSCS.
DateTotal Solar Radiation/MJAverage Temperature of the Substrate/°CActual Working Time of Cooling SystemPower Consumption/kW·hRefrigeration Capacity of the Whole Cooling System/JEnergy Consumption per Unit Ground Area of the Cooling System/W·m−2COP
TS1TS2CKTS1TS2
21 August 202113.227.324.736.910:00~17:0010:00~17:0011.22.4 × 10860.06.0
22 August 20214.326.925.729.7//////
23 August 202117.327.926.136.911:00~17:0011:00~17:009.91.9 × 10861.95.3
24 August 202118.527.625.638.311:00~17:0011:00~17:0010.82.2 × 10867.55.8
25 August 20219.324.723.534.511:40~17:0011:50~16:005.01.6 × 10835.28.7
Note: The average temperature of the substrate is the average temperature of the substrate during the working period of the cooling system. The system is not operated on 22 August 2021, which is the average temperature of the substrate during the period of 8:00~17:00. Power consumption, refrigeration capacity, energy consumption per unit ground area, and COP are the overall values of the cooling system, including TS1 and TS2.
Table 8. Economic assessment of WCTRZSCS.
Cooling Performance of WCTRZSCS/°CTS16.5
TS28.5
WCTRZSCS initial cost/RMB·m2·year1Chiller5.6
Heat dissipation components (PE-RT pipes)0.5
Water pump0.6
Water storage tank0.7
Installation and maintenance costs0.9
Electric charge/RMB·m2 15.3
Total costs of the WCTRZSCS/RMB·m2·year1 23.6
Yield/m2CK/
TS10.8
TS20.8
Total profit of the tomato/RMB·m2 1.6
The benefit of the WCTRZSCS/RMB·m2 −22
Publisher’s Note: MDPI stays neutral with regard to jurisdictional claims in published maps and institutional affiliations.