Article

Adsorptive Analysis of Azo Dyes on Activated Carbon Prepared from Phyllanthus emblica Fruit Stone Sequentially via Hydrothermal Treatment

1
Department of Chemistry, Gurukula Kangri (Deemed to be University), Haridwar 249404, India
2
Centre for DNA Taxonomy, Molecular Systematics Division, Zoological Survey of India, Kolkata 700053, India
3
Department of Chemistry, College of Science, King Saud University, P.O. Box 2455, Riyadh 11451, Saudi Arabia
4
Department of Food Science, Fu Jen Catholic University, New Taipei City 24205, Taiwan
5
Department of Chemical Technology, Faculty of Chemistry, Adam Mickiewicz University in Poznań, Uniwersytetu Poznańskiego 8, 61-614 Poznań, Poland
6
Petroleum and Chemical Engineering, Faculty of Engineering, Universiti Teknologi Brunei, Bandar Seri Begawan BE1410, Brunei
7
UMR1253, Science et Technologie du Lait et de l’œuf, INRAE, L’Institut Agro Rennes-Angers, 65 Rue de Saint Brieuc, F-35042 Rennes, France
*
Authors to whom correspondence should be addressed.
Agronomy 2022, 12(9), 2134; https://doi.org/10.3390/agronomy12092134
Submission received: 21 July 2022 / Revised: 30 August 2022 / Accepted: 30 August 2022 / Published: 8 September 2022

Abstract

:
The present work aims to provide insight into the role of the functional group in the adsorption of azo dyes namely, ethyl orange (EO), methyl orange (MO), and metanil yellow (MY), on the activated carbon (surface area 569 m2·g−1) prepared from Phyllanthus emblica fruit stone by low-pressure hydrothermal treatment (AC-HTPEFS). More specifically, this study would facilitate a better understanding of the involvement of different amino substituents (-CH3, -C2H5, phenyl group) on the adsorption of azo dye molecules. The experimental adsorption isotherms of the azo dyes quantified with different adsorbents and temperatures (25–45 °C) were utilized to know the effect of functional groups on dye adsorption. Additionally, the equilibrium data were analyzed by applying isotherm models (Freundlich, Langmuir, and Temkin) in order to elucidate the best-fit isotherm model and adsorption capacity, with the Langmuir model fitting the isotherms best as shown by the higher correlation coefficients obtained (0.984–0.994). The Langmuir monolayer adsorption capacities of EO, MO, and MY obtained at 25 °C were found to be 0.202, 0.187, and 0.158 mmol·g−1, respectively, which was attributed to the hydrophobicity and geometry of dye molecules. Moreover, adsorption kinetics conformed well with the pseudo-second-order model. The negative ΔG°, positive ΔH,° and positive ΔS° indicated the adsorption process to be favorable, endothermic, and increased randomness at the solid–liquid interface. Our findings indicate that the porous activated carbon from hydrothermally treated Phyllanthus emblica fruit stone exhibited a promising potential for the removal of azo dyes with rapid kinetics and high adsorption capacity. The present study could thus pave a way for future utilization of activated carbons produced via hydrothermal treatment techniques for wastewater applications.

1. Introduction

Azo dyes constitute a major chemical class comprising 60 to 70% of the textile dyes produced [1]. In azo dyes, the azo word originates from azote, which is obtained from a Greek word where “a” means “not” and Zoe means “to live” [1]. These dyes are comparatively inexpensive [2], and their manufacturing process does not involve many intermediate stages [3]. Azo dyes are categorized by the occurrence of at least one azo group (-N = N-) in the molecule’s structure [4]. It is worth stating that the molecular structure of azo dyes, in general, exists in a trans “form” which is more stable than the cis form, and the trans-azobenzene is basically planar in all the environments (solid or liquid) [5]. The three azo dyes, namely ethyl orange (EO), methyl orange (MO), and metanil yellow (MY), are extensively utilized in paper, textile, food, leather, pharma, and cosmetics productions [6,7].
Due to the structural complexity, synthetic origin, and low degradability, azo dyes are resistant to heat, sunlight, and different oxidizing agents [8]. In addition to this, most of the azo dyes show a carcinogenic, mutagenic, genotoxic, and lethal effect on humans and animals [1], which is possibly due to the release of aromatic amines [9]. Therefore, owing to their toxicity, there is a growing demand for productive and low-cost techniques to remove dyes from wastewater. Different techniques and methodologies are therefore developed in order to eradicate these dyes from the effluents and wastewaters. Among various techniques used for water treatment, adsorption especially utilizing activated carbons is the best technique. However, natural materials can also be used as adsorbents/biosorbents to remove different toxic substances from water [10,11,12,13,14,15,16].
A survey of the literature shows that no work has been completed so far on the adsorption of EO, MO, and MY on the raw Phyllanthus emblica fruit stone (RPEFS) and activated carbon prepared from hydrothermally treated Phyllanthus emblica fruit stone (AC-HTPEFS) at low pressure. Therefore, the present study aims to elucidate the adsorption mechanism of azo dyes namely, EO, MO and MY, by AC-HTPEFS and investigate the effect of the functional groups attached to them on the adsorption capacity. Especially, the outcome of this study would facilitate a better understanding of the role of different amino substituents (-CH3, -C2H5, phenyl group) on the adsorption of azo dyes. Furthermore, a comparison is made between RPEFS, AC-HTPEFS, and commercial activated carbon (CAC) to determine the effectiveness of the developed AC-HTPEFS at 25 °C. Both adsorption isotherms and kinetics are developed to perceive the mechanisms controlling the adsorption process through studying the azo dye adsorption as affected by the initial dye concentration, contact time, and temperature. Equilibrium data are modeled with isotherm models such as Freundlich, Langmuir, and Temkin to gain more insight into the adsorption mechanism and estimate the monolayer adsorption capacity. Additionally, the mechanism controlling the rate of adsorption is determined by fitting the kinetic results with pseudo-first-order (PFO), pseudo-second-order (PSO), and intraparticle diffusion (IPD) models.

2. Materials and Methods

2.1. Materials

The azo dyes (EO, MO, and MY) were obtained from Sigma-Aldrich (St. Louis, MO, USA), Loba Chemie (Mumbai, India), and Molychem (Mumbai, India) with a dye content of 85%, 75%, and 70%, respectively. The properties and molecular structure of dyes used in this study are shown in Table 1. The standard CAC was procured from Fisher Scientific (surface area 635 m2·g−1). All the chemicals used in this study were of analytical reagent grade and utilized without further purification.

2.2. Preparation of Adsorbents

The precursor RPEFS was procured from a local market and used after washing, drying, and crushing to uniform particle size [17]. The hydrothermally treated (HTPEFS) was prepared using an ordinary autoclave by adding the RPEFS (5 g) and water at a ratio of 1:16 and heating for 60 min. On completion of the process, the autoclave was cooled to room temperature and the resultant materials was recovered by filtration. The recovered product (HTPEFS) was rinsed with distilled water and oven-dried for 5–6 h at 100 °C. The HTPEFS so obtained after the hydrothermal treatment was further utilized to prepare activated carbon (AC-HTPEFS). For this, the HTPEFS was subjected to heat treatment (400 °C) for a period of 90 min using a muffle furnace in air atmosphere [18]. All the samples prepared were stored in sealed containers and kept in a desiccator for further use.

2.3. Adsorption Studies

The batch technique was used in order to evaluate the adsorption behavior of different adsorbents (RPEFS, HTPEFS, and AC-HTPEFS) towards the EO, MO, and MY dyes. In the batch procedure, 0.01 g of the adsorbent was added to the stoppered glass tubes, which had 10 mL of various EO, MO, and MY dye solutions at different concentrations (working concentration range for EO: 9 × 10⁻⁵–5 × 10⁻⁴ M, MO: 7 × 10⁻⁵–4.5 × 10⁻⁴ M, and MY: 7 × 10⁻⁵–4 × 10⁻⁴ M). These samples were agitated at ambient temperatures in a thermostat shaker (JSGW, Ambala, India) until the equilibrium was accomplished. The concentration of EO, MO, and MY dyes left unadsorbed in sample solutions was studied by using Carry 60 UV–VIS spectrophotometer (Agilent, Santa Clara, CA, USA) at λmax 474, 465, and 425 nm for EO, MO, and MY, respectively. Kinetic studies on azo dye adsorption were also performed at two concentrations of the adsorbates (1 × 10⁻⁴ M and 2 × 10⁻⁴ M) where the amount of adsorption was investigated as a function of time and the kinetic data used for modeling with PFO, PSO, and IPD models. For isotherm studies, a range of dye concentration mentioned above was agitated separately with 0.01 g of adsorbent at three different temperatures (25 °C, 35 °C, and 45 °C) and the isotherm data were used for modeling with Langmuir, Freundlich, and Temkin models as well as determination of thermodynamic parameters. All the adsorbents such as RPEFS, HTPEFS, AC-HTPEFS, and CAC used in this study are quite stable in water. Furthermore, the pH of all testing solutions in contact with adsorbents was found in the range of 5–6.8.

3. Results and Discussion

3.1. Characterization of the Adsorbents

The current work is a continuation of our previously published work and the detailed discussion on the characterization of the utilized adsorbents can be found in a previous study by Suhas et al. [18]. However, some of the characterization details of the utilized adsorbents were briefly discussed here. HTPEFS has 47.86% carbon content and increased to 70.23% in the AC-HTPEFS. HTPEFS was found to be rich in functional groups as was indicated by the FTIR studies which showed peaks at 3400 cm−1 for hydroxyl groups, 3000–2800 cm−1 due to C-H stretching vibrations, 1740–1700 cm−1 due to the presence of carboxyl, aldehyde, ketone, and ether groups, 1464 and 1417 cm−1 due to methoxy groups, 1078 cm−1 due to the C-O stretching of alcohols and 615 cm−1 due to the bending vibration of alcohols, whereas, limited peaks at 3400, 1629, 1413 and 615 cm−1 for hydroxyl, carboxylate anion, ether and bending vibrations of hydroxyl groups, respectively, was observed in the FTIR spectrum of the AC-HTPEFS. HTPEFS has no considerable porosity, however, the AC-HTPEFS has well-developed porosity with a total pore volume of 0.342 cm3g−1 and a noteworthy surface area of 569 m2·g−1. The SEM studies showed that the surface of AC-HTPEFS has porosity with some destruction during the morphological investigations. The structure of HTPEFS was not disturbed during the hydrothermal treatment as the sharp peaks at 16 and 22° represented the cellulosic structure, however, the broad peaks at 2θ = 22–26° in the XRD patterns of AC-HTPEFS indicate the formation of amorphous carbon. TG-DTA analyses revealed that the temperature range between 330–470 °C is quite good for the preparation of AC-HTPEFS. The inorganic elemental analysis was also carried out and a significant amount of Na, Ca, and P (104.63, 141.63, and 174.46 mg·kg−1) was found to be present in the HTPEFS with a relatively lower amount of K, Fe, Mg, and Cu were also present in the HTPEFS.

3.2. Effect of Initial Concentration and Contact Time

To investigate how the equilibrium was achieved, the adsorption of azo dyes viz. EO, MO, and MY were performed as a contact time function on AC-HTPEFS (Figure 1A–C). It is revealed from the figures that during the initial stage, the saturation curve rises sharply as the uptake of the adsorbate species (EO, MO, and MY) is faster; after that, it is carried on at a moderate rate and eventually achieved the equilibrium [19]. The reason behind the higher uptake of azo dyes through the primary stage may be the accessibility of a large number of vacant sites (active centers/accessible pores/free functional units) on the AC-HTPEFS surface; after that, the uptake was found to decrease due to repulsive forces by nearby occupied dye molecules [7,20]. Figures also show that the maximum amount of EO, MO, and MY was removed in approximately 60 min and the equilibrium was achieved in 180 min; hence, for all the adsorption studies, the experiments were conducted up to 240 min.
The effect of the initial concentration on the equilibration time was also examined using 1 × 10⁻⁴ and 2 × 10⁻⁴ M concentrations of azo dyes at different time intervals and the results are shown in Figure 1A–C. Notably, it can be observed from the figure that the adsorption capacity of AC-HTPEFS for EO, MO and MY increased on increasing the initial concentrations. Since the initial concentration deliver an important driving force to overcome the mass transfer resistance of the dyes between the bulk and solid phases [21,22], the adsorption capacity increased with a rise in initial concentration of dyes. Nevertheless, the effect of initial concentration and contact time was not studied for RPEFS and HTPEFS owing to less adsorption.

3.3. Adsorption Isotherms

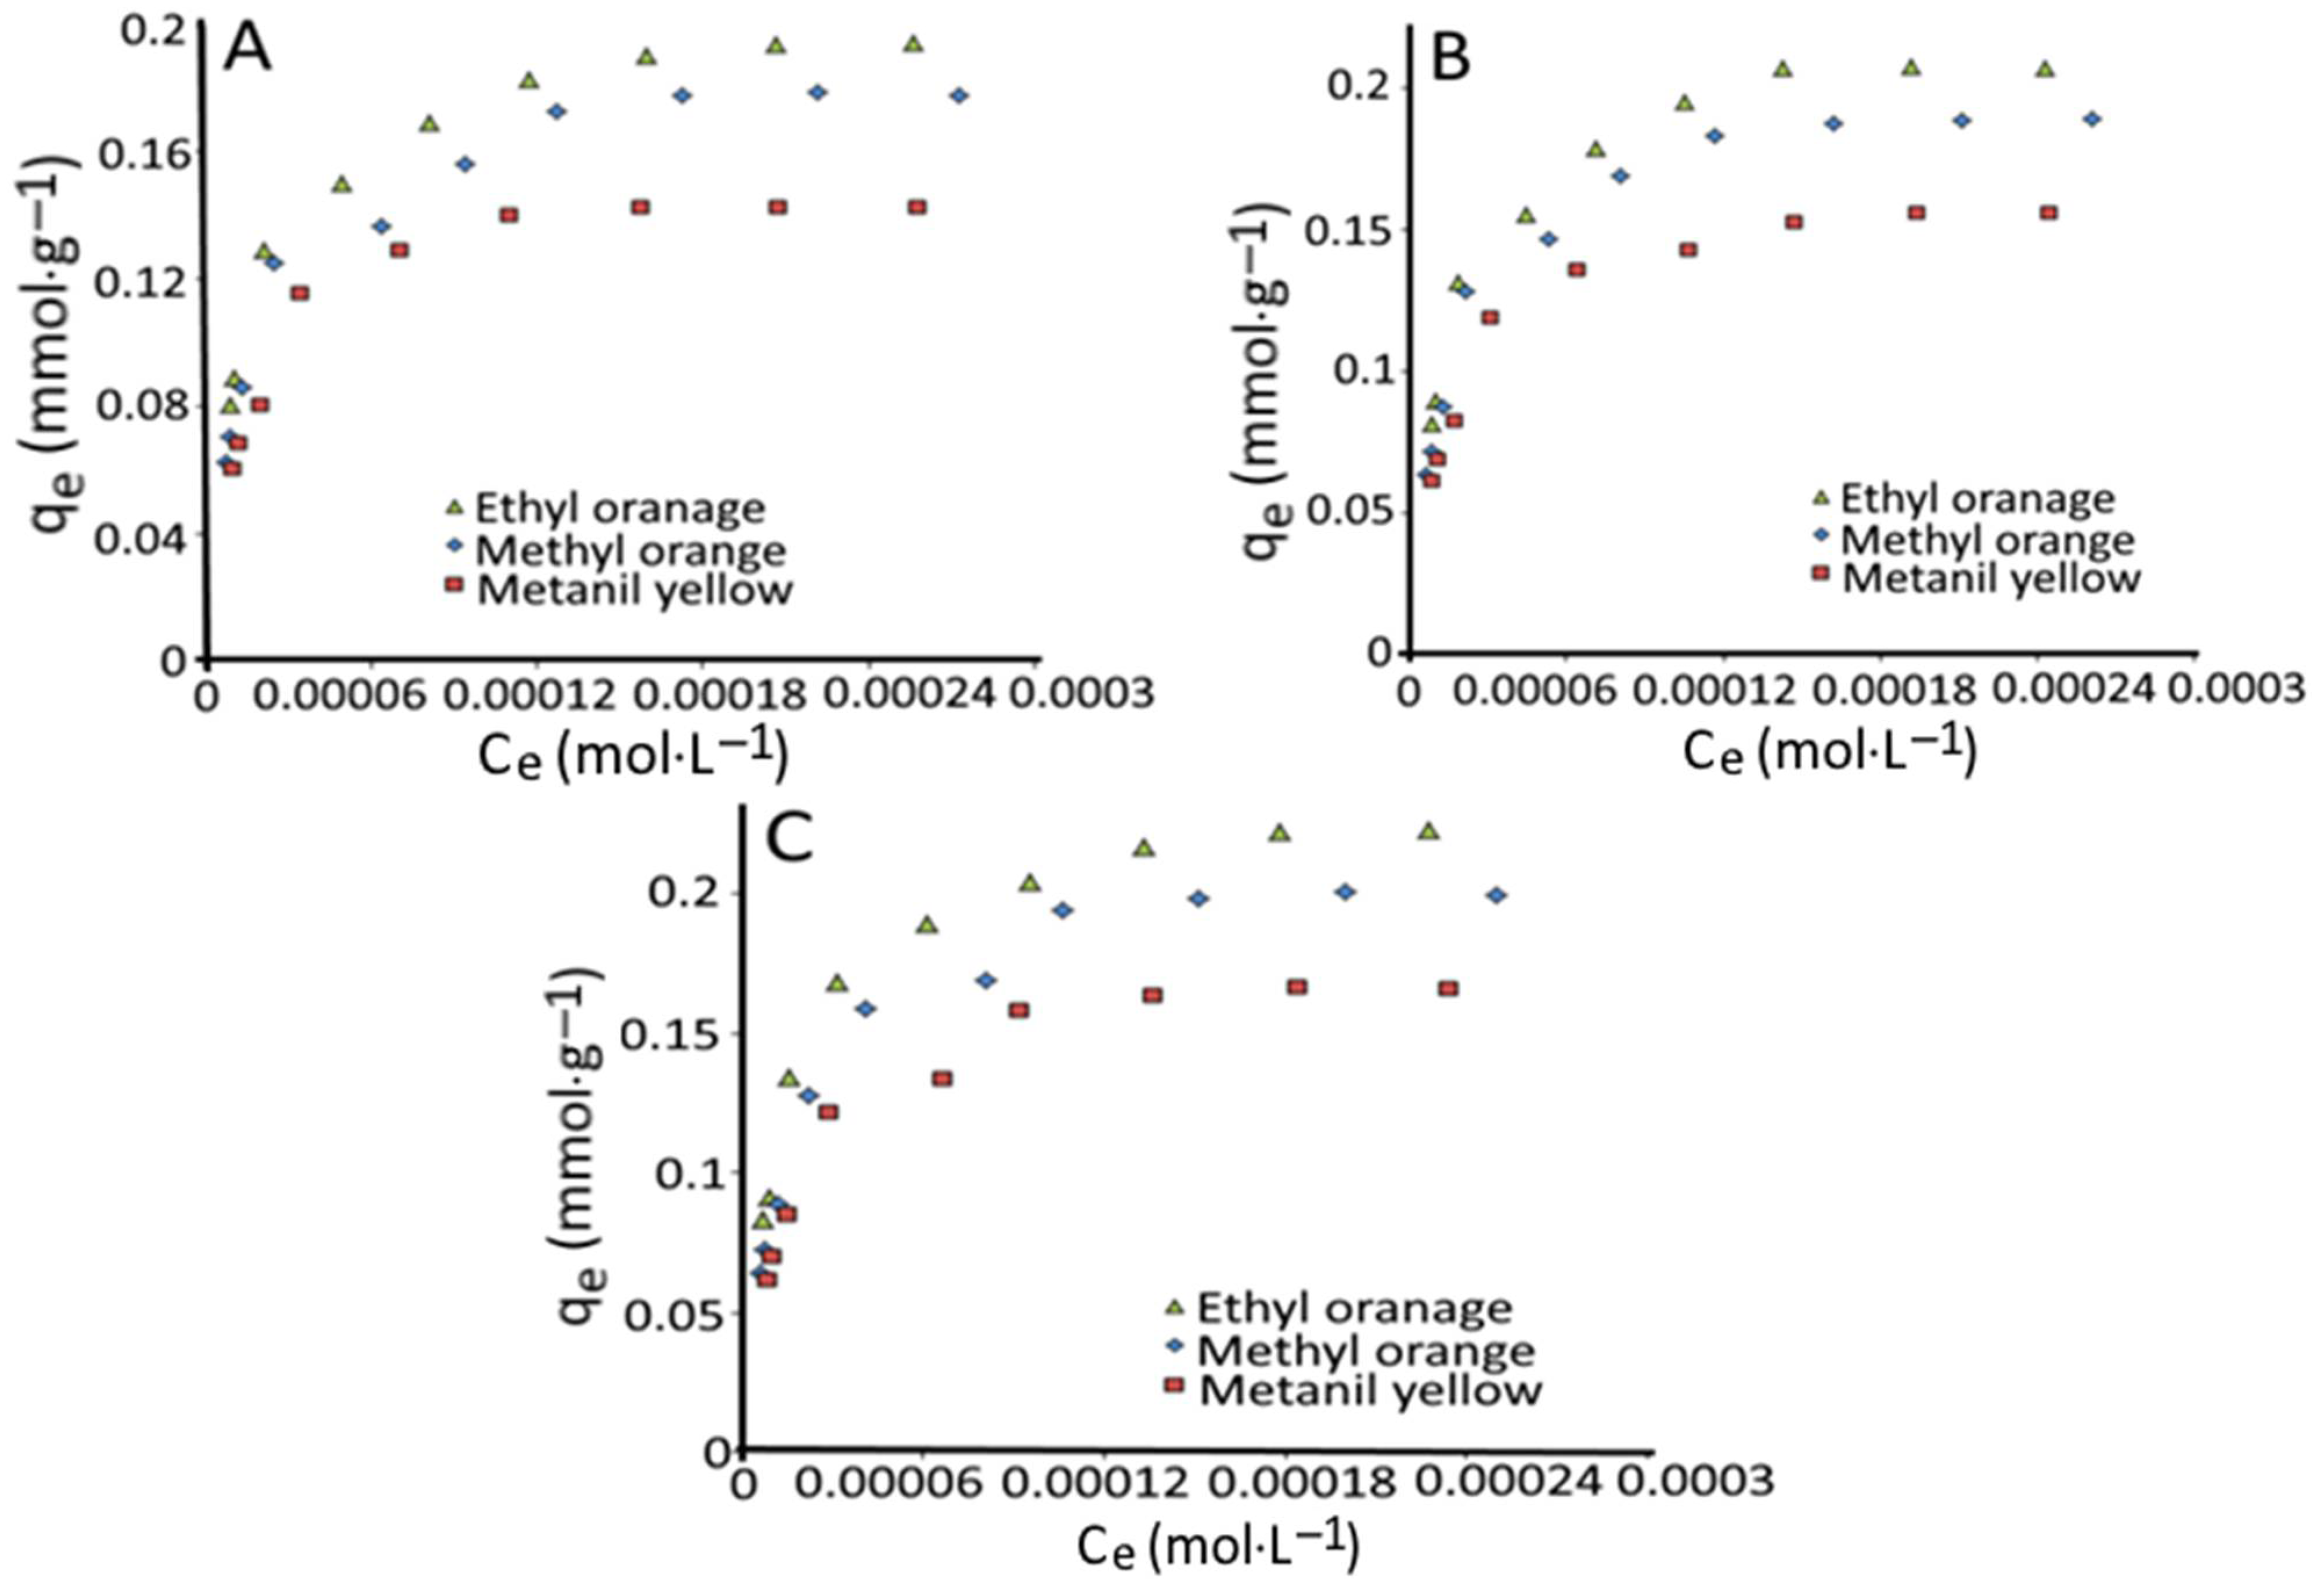
To study the adsorption capacity of AC-HTPEFS for the EO, MO, and MY adsorption, equilibrium adsorption isotherms were developed as a function of concentration at a constant temperature and the graphs are represented in Figure 2A at 25 °C. The qexp of EO, MO and MY from adsorption isotherm at 25 °C were found to be 0.194, 0.178 and 0.142 mmol·g−1, respectively. These results show that the adsorption of azo dyes on AC-HTPEFS was found in order: EO > MO > MY. Figure 2B,C shows the adsorption isotherms obtained for all three azo dyes at 35 °C and 45 °C. Evidently, the shape of all the isotherms resembled a Langmuir (L)-type according to the classification by Giles et al. [23] representing an adsorption from dilute solution characterized by monolayer adsorption molecules on the adsorbent surface.
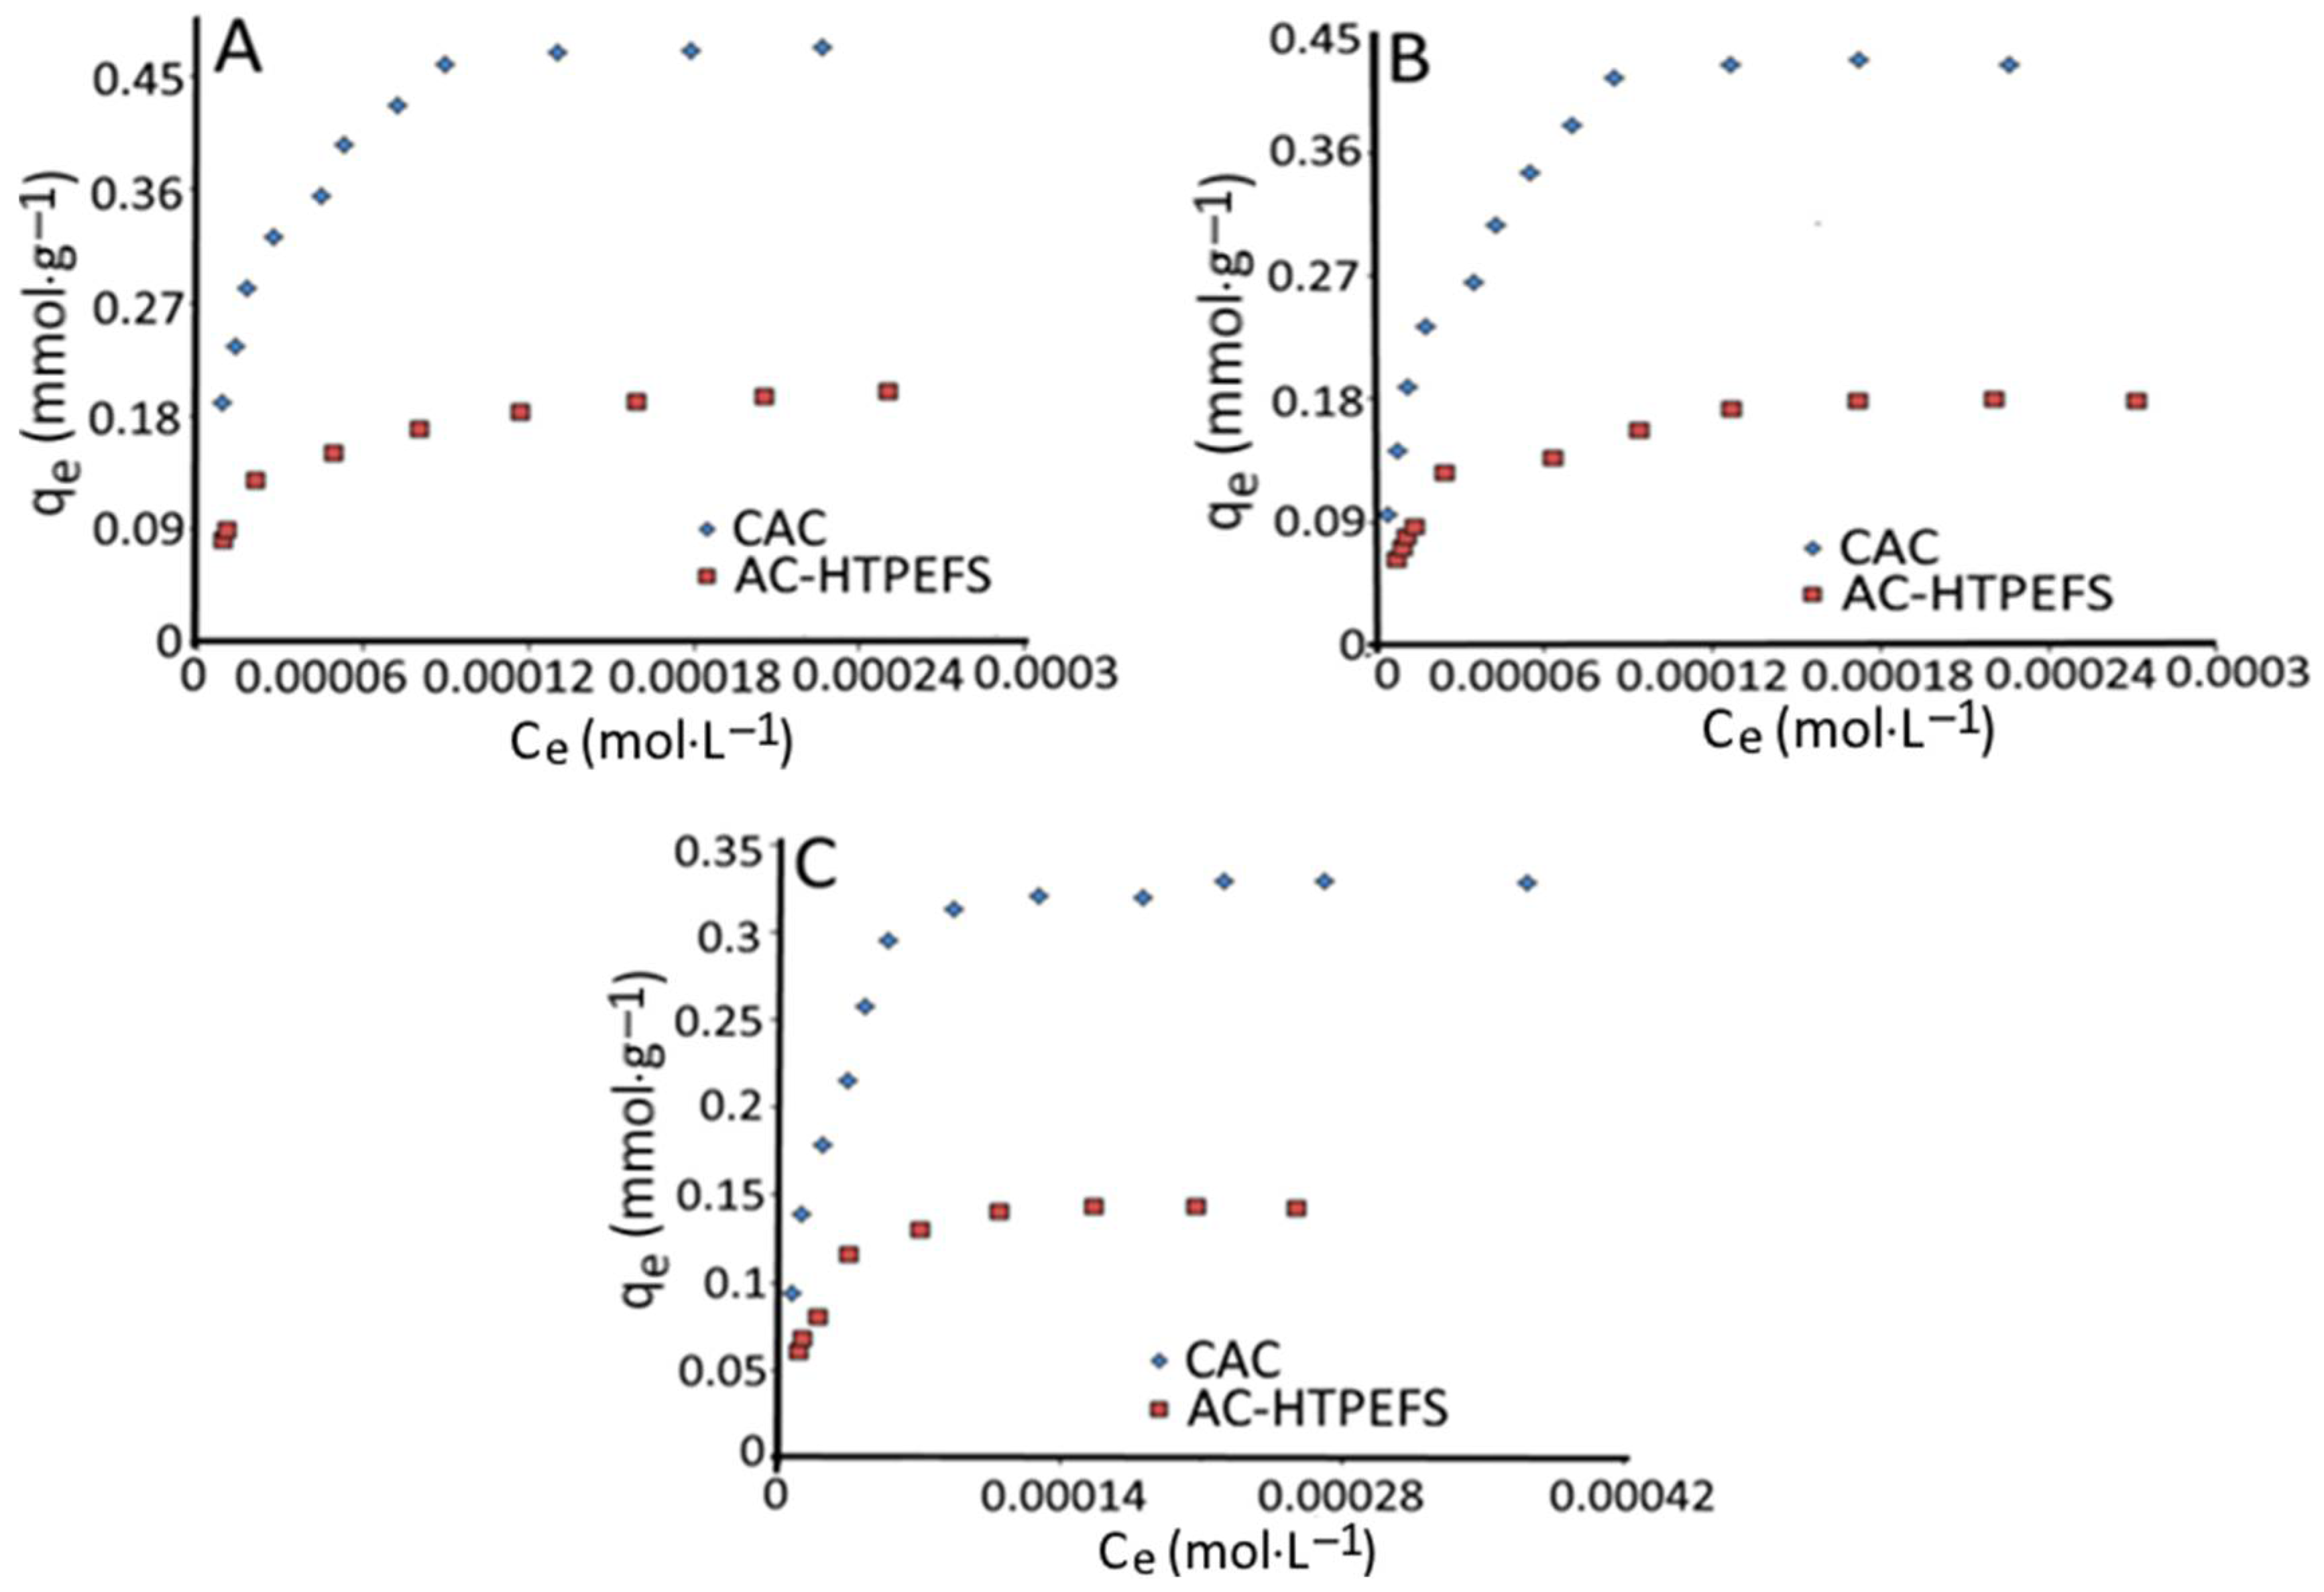
To find out the removal efficiency of developed AC-HTPEFS, a comparison has been made initially with RPEFS, HTPEFS and CAC. In the case of RPEFS and HTPEFS, the amount adsorbed was almost negligible; hence, the graphs are not shown. This may be due to the fact that RPEFS and HTPEFS have a negligible surface area and porosity and owing to the predominance of the negatively charged functional groups; therefore, the adsorption of these dyes will be less compared to cationic dyes. The adsorption on the activated carbon developed after hydrothermal treatment in Figure 3A–C at 25 °C shows a larger adsorption capacity and therefore further studies were performed only with AC-HTPEFS. A similar type of the adsorption order was also found on the CAC and the experimental adsorption capacity was reported to be 0.473, 0.423, and 0.328mmol·g−1 for EO, MO and MY, respectively. The large adsorption capacity of CAC was due to the high effective surface area (635 m2·g−1) and porosity of CAC compared to AC-HTPEFS.
To see the variation in the adsorption capacity with respect to temperature, the experiments on the removal of azo dyes on AC-HTPEFS have been performed at 25, 35, and 45 °C, and the results obtained are presented in Figure 2A–C. From the experimental results, the amount adsorbed was found to be 0.194, 0.207, and 0.222 mmol·g−1 for EO, 0.178, 0.189, and 0.199 mmol·g−1 for MO, and 0.142, 0.155, and 0.166 mmol·g−1 for MY at 25, 35, and 45 °C, respectively. It is perceived from these figures that the isotherm showed similar behavior for EO, MO, and MY adsorption on AC-HTPEFS. Nevertheless, the amount of EO, MO, and MY dyes adsorbed was observed to increase with a raise in temperature from 25 to 45 °C, indicating an apparent endothermic nature of the adsorption process.
Further, equilibrium data obtained through experiments were analyzed by applying the Langmuir, Freundlich, and Temkin isotherm models [24,25,26], and their mathematical forms are described as follows:
1 q e = 1 q max + 1 q max bC e
logq e = logK F + 1 n logC e
q e = B T   lnA T + B T   lnC e
where Ce (mol·L−1) is the equilibrium concentration of dyes, qe (mmol·g−1) is the amount of azo dye adsorbed at Ce, qmax (mmol·g−1) is the theoretical monolayer adsorption capacity, b (L·mol−1) is the Langmuir adsorption constant, KF value represents the adsorption capacity, and n value is correlated to the adsorption intensity. For the Temkin model, BT is the heat of adsorption, and it is well-defined by the expression BT = RT/bT, T is the absolute temperature (K), R is the gas constant (8.314 J·mol−1·K−1), bT is the constant corresponding to the heat of adsorption process in J·mol−1 and AT is the Temkin binding constant (L·mg−1).
For the Langmuir model, the plots (Figure 4A) were made between 1/qe versus 1/Ce, whereas, in the case of the Freundlich model, a plot (Figure 4B) was made between logqe and logCe. For the Temkin model, a linear plot between qe and lnCe was presented for all dyes at 25 °C in Figure 4C, and the adsorption parameters along with correlation coefficients are shown in Table 2. Usually, the correlation coefficient (R2) obtained from the linear regression is utilized to obtain the optimum isotherm to elaborate the adsorption process. Comparing R2 values achieved from Langmuir, Freundlich, and Temkin isotherm for the adsorption of anionic dyes EO, MO and MY clearly shows that the Langmuir isotherm has higher R2 values than Freundlich and Temkin isotherm, indicating that the Langmuir isotherm is the optimum isotherm model to fit the experimental data.
The value of monolayer adsorption capacity (qmax) achieved for EO, MO, and MY was 0.202, 0.187, and 0.158 mmol·g−1 at 25 °C, respectively. The value of b was found to be in the order of 7.11 × 10⁴, 6.43 × 10⁴, and 6.25 × 10⁴ L·mol−1 for EO, MO, and MY, respectively, which shows that the affinity of the AC-HTPEFS is more for EO and least for MY. The results show that the theoretical monolayer adsorption capacity (qm) determined by the Langmuir plot is in good agreement with the experimental adsorption capacity obtained and therefore it can be inferred that the Langmuir model fits well with the adsorption data. This finding also implied the homogeneous nature of the adsorbent surface, i.e., each dye molecule adsorption on AC-HTPEFS had equal adsorption activation energy and confirm the formation of monolayer coverage of dye molecule on the outer surface of the adsorbent. The Langmuir monolayer adsorption capacity of AC-HTPEFS was also compared with other adsorbent materials for the removal of EO, MO, and MY, and the values are provided in Table 3 [27,28,29,30,31,32,33,34,35,36].
The shape of the isotherm may also be considered with a view to predict that if an adsorption system is “favorable” or “unfavorable”. It is possible to express the features of a Langmuir isotherm in terms of a dimensionless separation factor or equilibrium parameter RL [37], which is represented as
R L = 1 1 + b   C 0
where C0 (mol·L−1) is the initial concentration, b (L·mol−1) is the Langmuir adsorption constant. According to the value of RL [37] the isotherm shape may be interpreted as follows: if RL > 1 the process is unfavorable, if RL = 1 the process is linear, if 0 < RL < 1 the process is favorable and if RL = 0 the process is irreversible. The RL for adsorption of all the three dyes on AC-HTPEFS ranged between 0 and 1, implying favorability of the adsorption process.
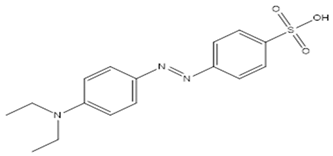
The adsorption trend of tested azo acid dyes was found to be in the order: EO > MO > MY, and the molecular structure of these azo dyes have a similar basic structure, but they vary from each other based on different amino substituents present in their structure. The EO has two ethyl groups, MO has two methyl groups, and MY has a phenyl ring attached to the nitrogen atom. All dye molecules have one sulphonic group that increases their solubility in water [38]. The molecular structure of the three azo dyes is influenced by different amino substituents attached to the nitrogen atom.
It is known that azo dyes under normal conditions exist in the trans form [39] and it is planar in all environments [5] and thus the selected dyes for the study were assumed to be planar in structure. However, it is worth stating that despite azo dyes existing in the trans form, an anomaly exists, and it can be seen in the case of MY, which has a third substituted phenyl ring leading to twisting and which makes the molecule no longer planar [40]. Based on this geometry, MO and EO will have better contact with the surface sites (pores) compared to the twisted structure of MY. This, therefore, results in less adsorption of nonplanar molecules compared to planar [41,42]. In addition to this, another parameter that is marked to have a major role in the adsorption of these dyes is the nature of the dye. The hydrophobicity of the molecule plays a significant role in adsorption. In our case, EO has two methylene more than the MO and MY (has only one phenyl ring). It is known that the molecule’s hydrophobicity increases as the alkyl chain length is increased [43] and accordingly, based on the alkyl chain length, EO will be more hydrophobic in nature than MO and MY, and thus its adsorption will be more. Amongst MO and MY on the basis of hydrophobicity, MO will be adsorbed more than MY as it has two methyl groups. It is not only the hydrophobicity of dye molecules, but also the hydrophobicity of the adsorbent surface that can favor adsorption. Accordingly, compared to HTPEFS (47.86%), AC-HTPEFS possessed a higher carbon content (70.23%) and lower functional groups as discussed in Section 3.1 facilitating higher adsorption with more hydrophobic EO, followed by MO and MY. Nevertheless, it is worth noting that in addition to other parameters hydrogen bonding and electrostatic interactions amongst dyes and oxygen-containing functional groups as conferred in the previous paragraphs on carbons are also liable for dye adsorption. Therefore, keeping in view the above points the order of adsorption is EO > MO > MY.

3.4. Thermodynamics of Adsorption

The feasibility of the adsorption process was determined with the help of different thermodynamic parameters such as free energy change (ΔG°), enthalpy change (ΔH°) and entropy change (ΔS°) of the adsorption process were also determined by utilizing the equations described as:
Δ G ° = RT   lnb
lnb = Δ H ° RT + Δ S ° R
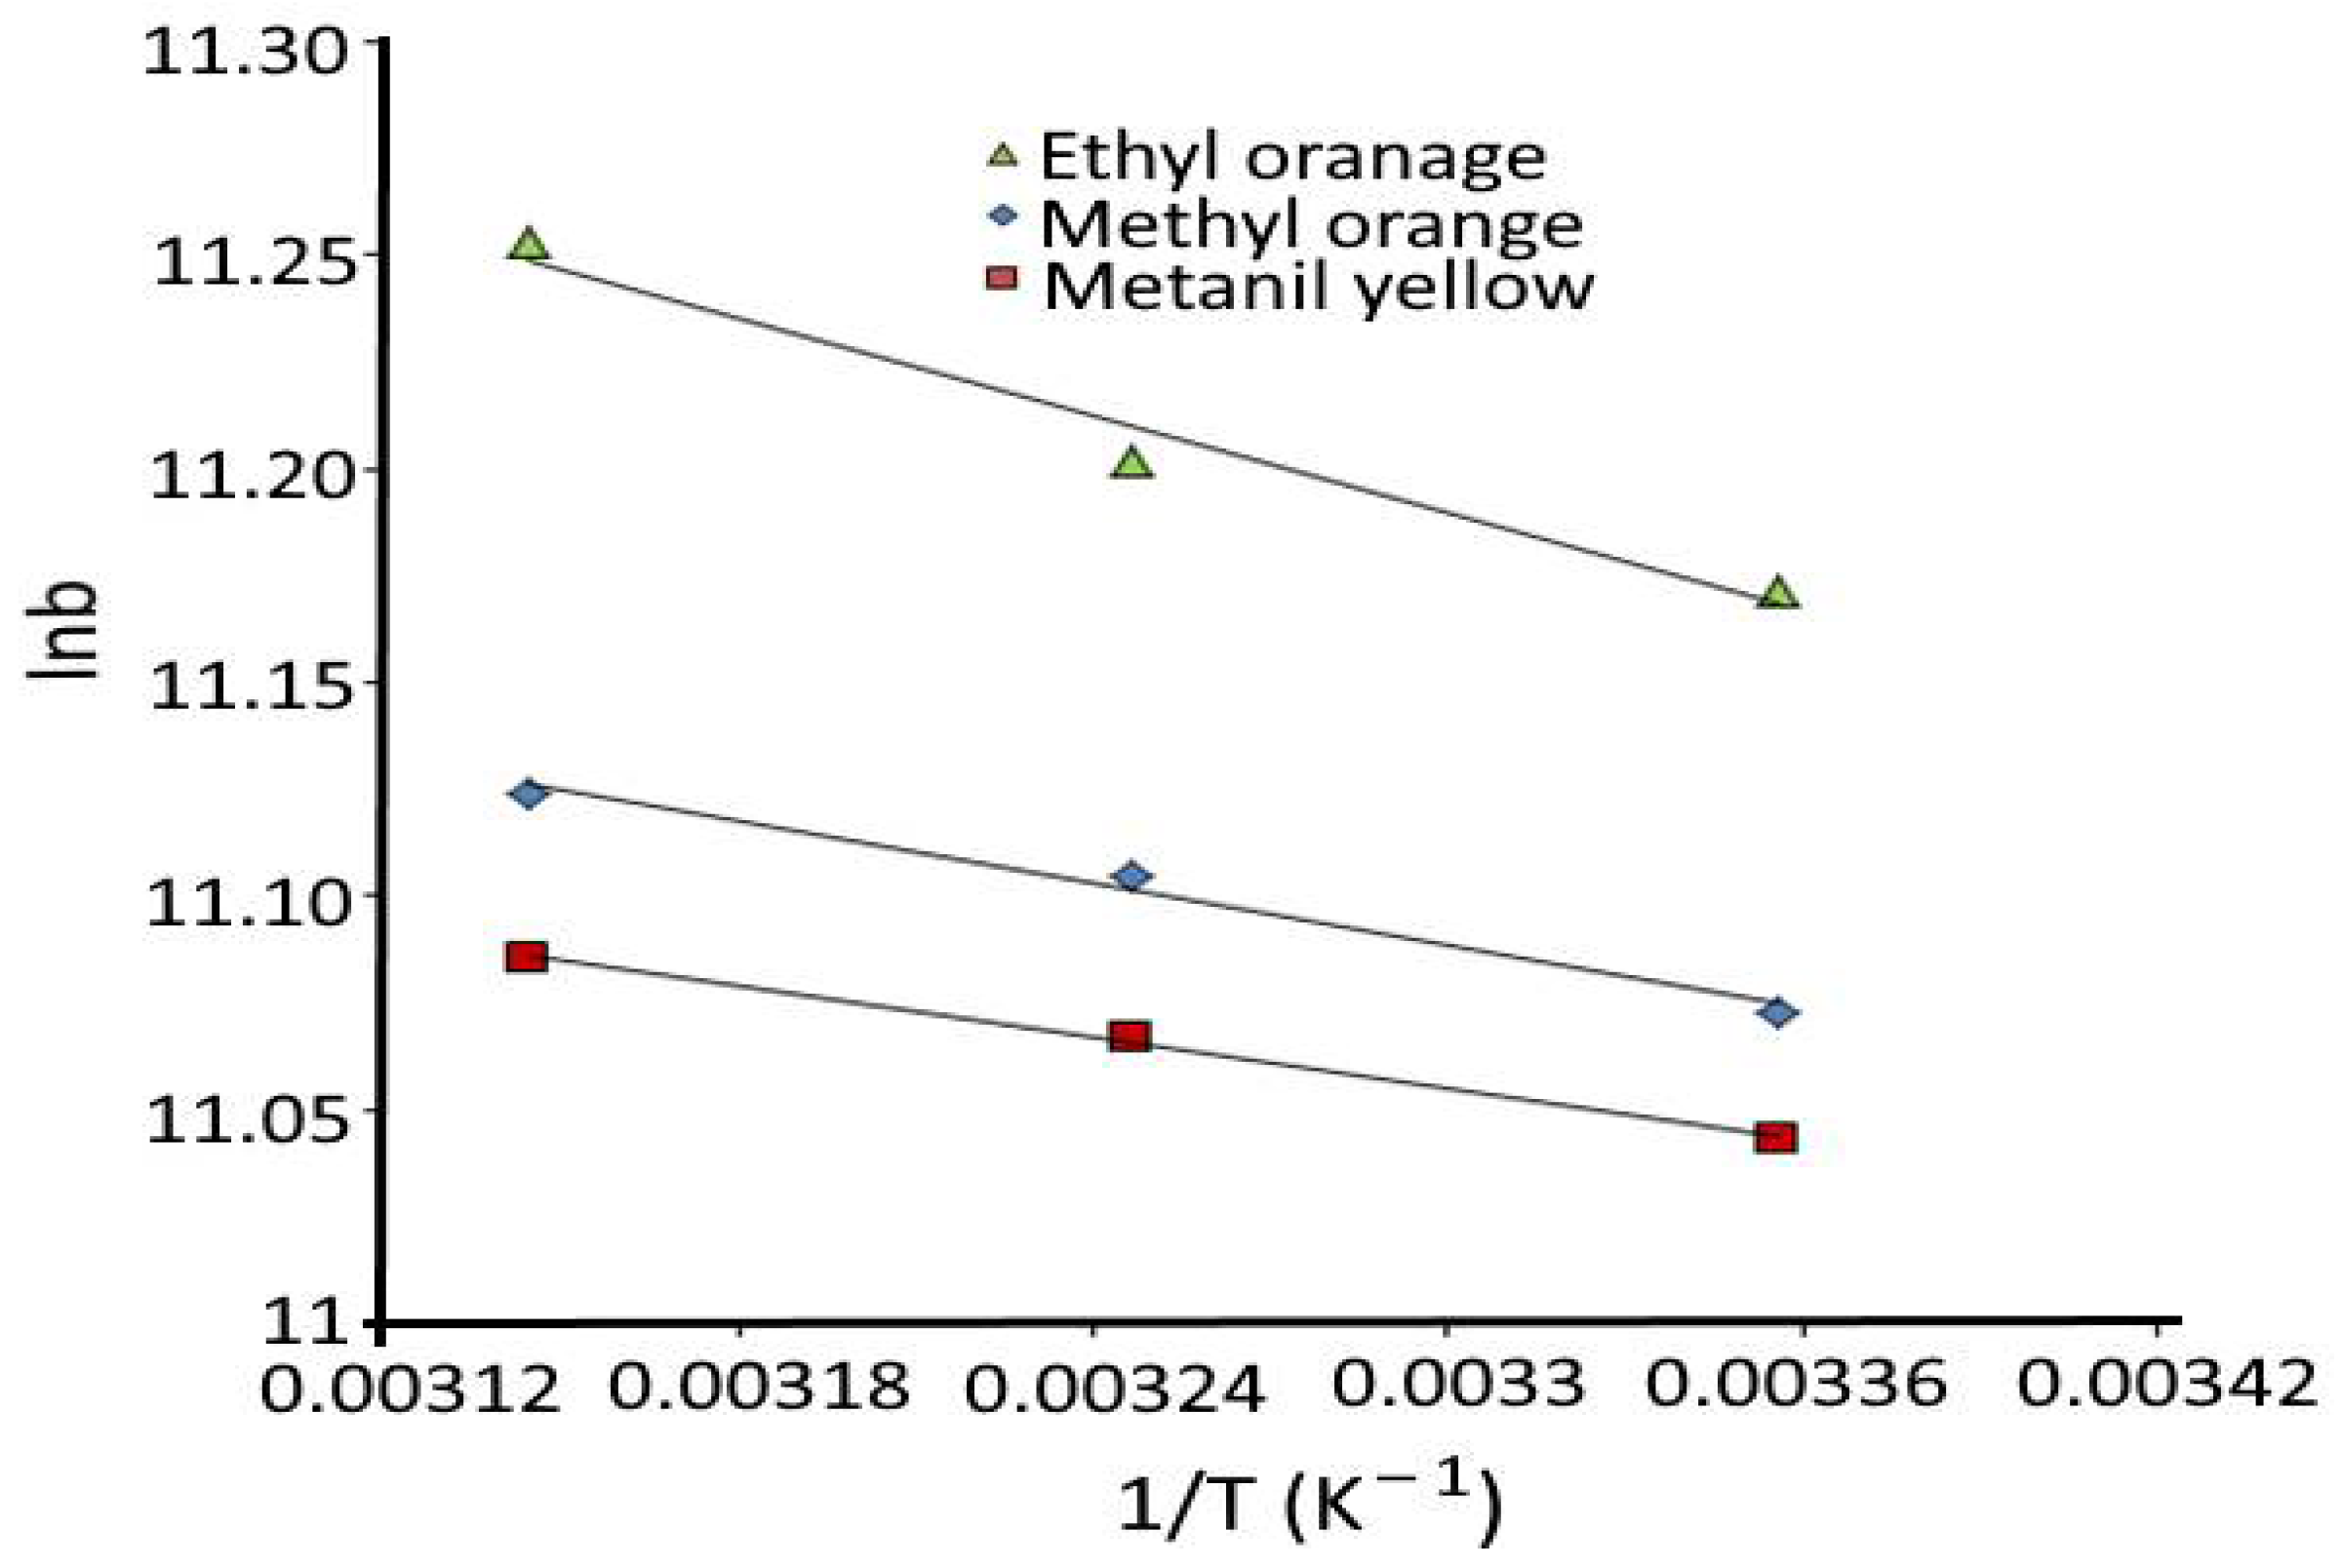
where b is the thermodynamic equilibrium constant, T is the temperature, and R is the universal gas constant (8.314 J·mol−1·K−1). The value of ΔH° and ΔS° are obtained from the slope and intercept of the plot (Figure 5) between lnb versus 1/T using the van’t Hoff equation (Equation (6)), and the values of these and other thermodynamic parameters are reported in Table 4. It was also inferred from the Table 4 that the positive value of ΔH° (3.18, 2.45 and 1.67 kJ·mol−1) for dyes EO, MO and MY show that the adsorption is endothermic in nature. The low ΔH° values reveal the physical nature of the adsorption and indicate that the dyes molecules are bound to the surface by relatively weak forces. The negative value of ΔG° (−27.7, −27.4, and −27.4 kJ·mol−1 at 25 °C) for dyes EO, MO, and MY reveals the spontaneous nature and favorability of the adsorption of dyes on AC-HTPEFS. The values of ΔG° further shows the physical adsorption of the dye molecule on the adsorbent. Positive ΔS° value shows that the organization of the dye molecules at the solid/solution interface becomes more random in nature [44].

3.5. Kinetics Studies

To determine the mechanism that controls the adsorption, kinetic studies have been carried out for the adsorption of the EO, MO and MY dyes on AC-HTPEFS for a time period of 240 min. The well-known kinetic models, PFO and PSO, were applied to verify the adsorption mechanisms of dyes. Furthermore, an IPD model [45], which is generally used for porous materials, was also applied to AC-HTPEFS to further elucidate the adsorption mechanism.
The PFO kinetic model given by Lagergren [46] was applied which is mathematically represented as:
log q e q t = logq e k 1 2.303   t
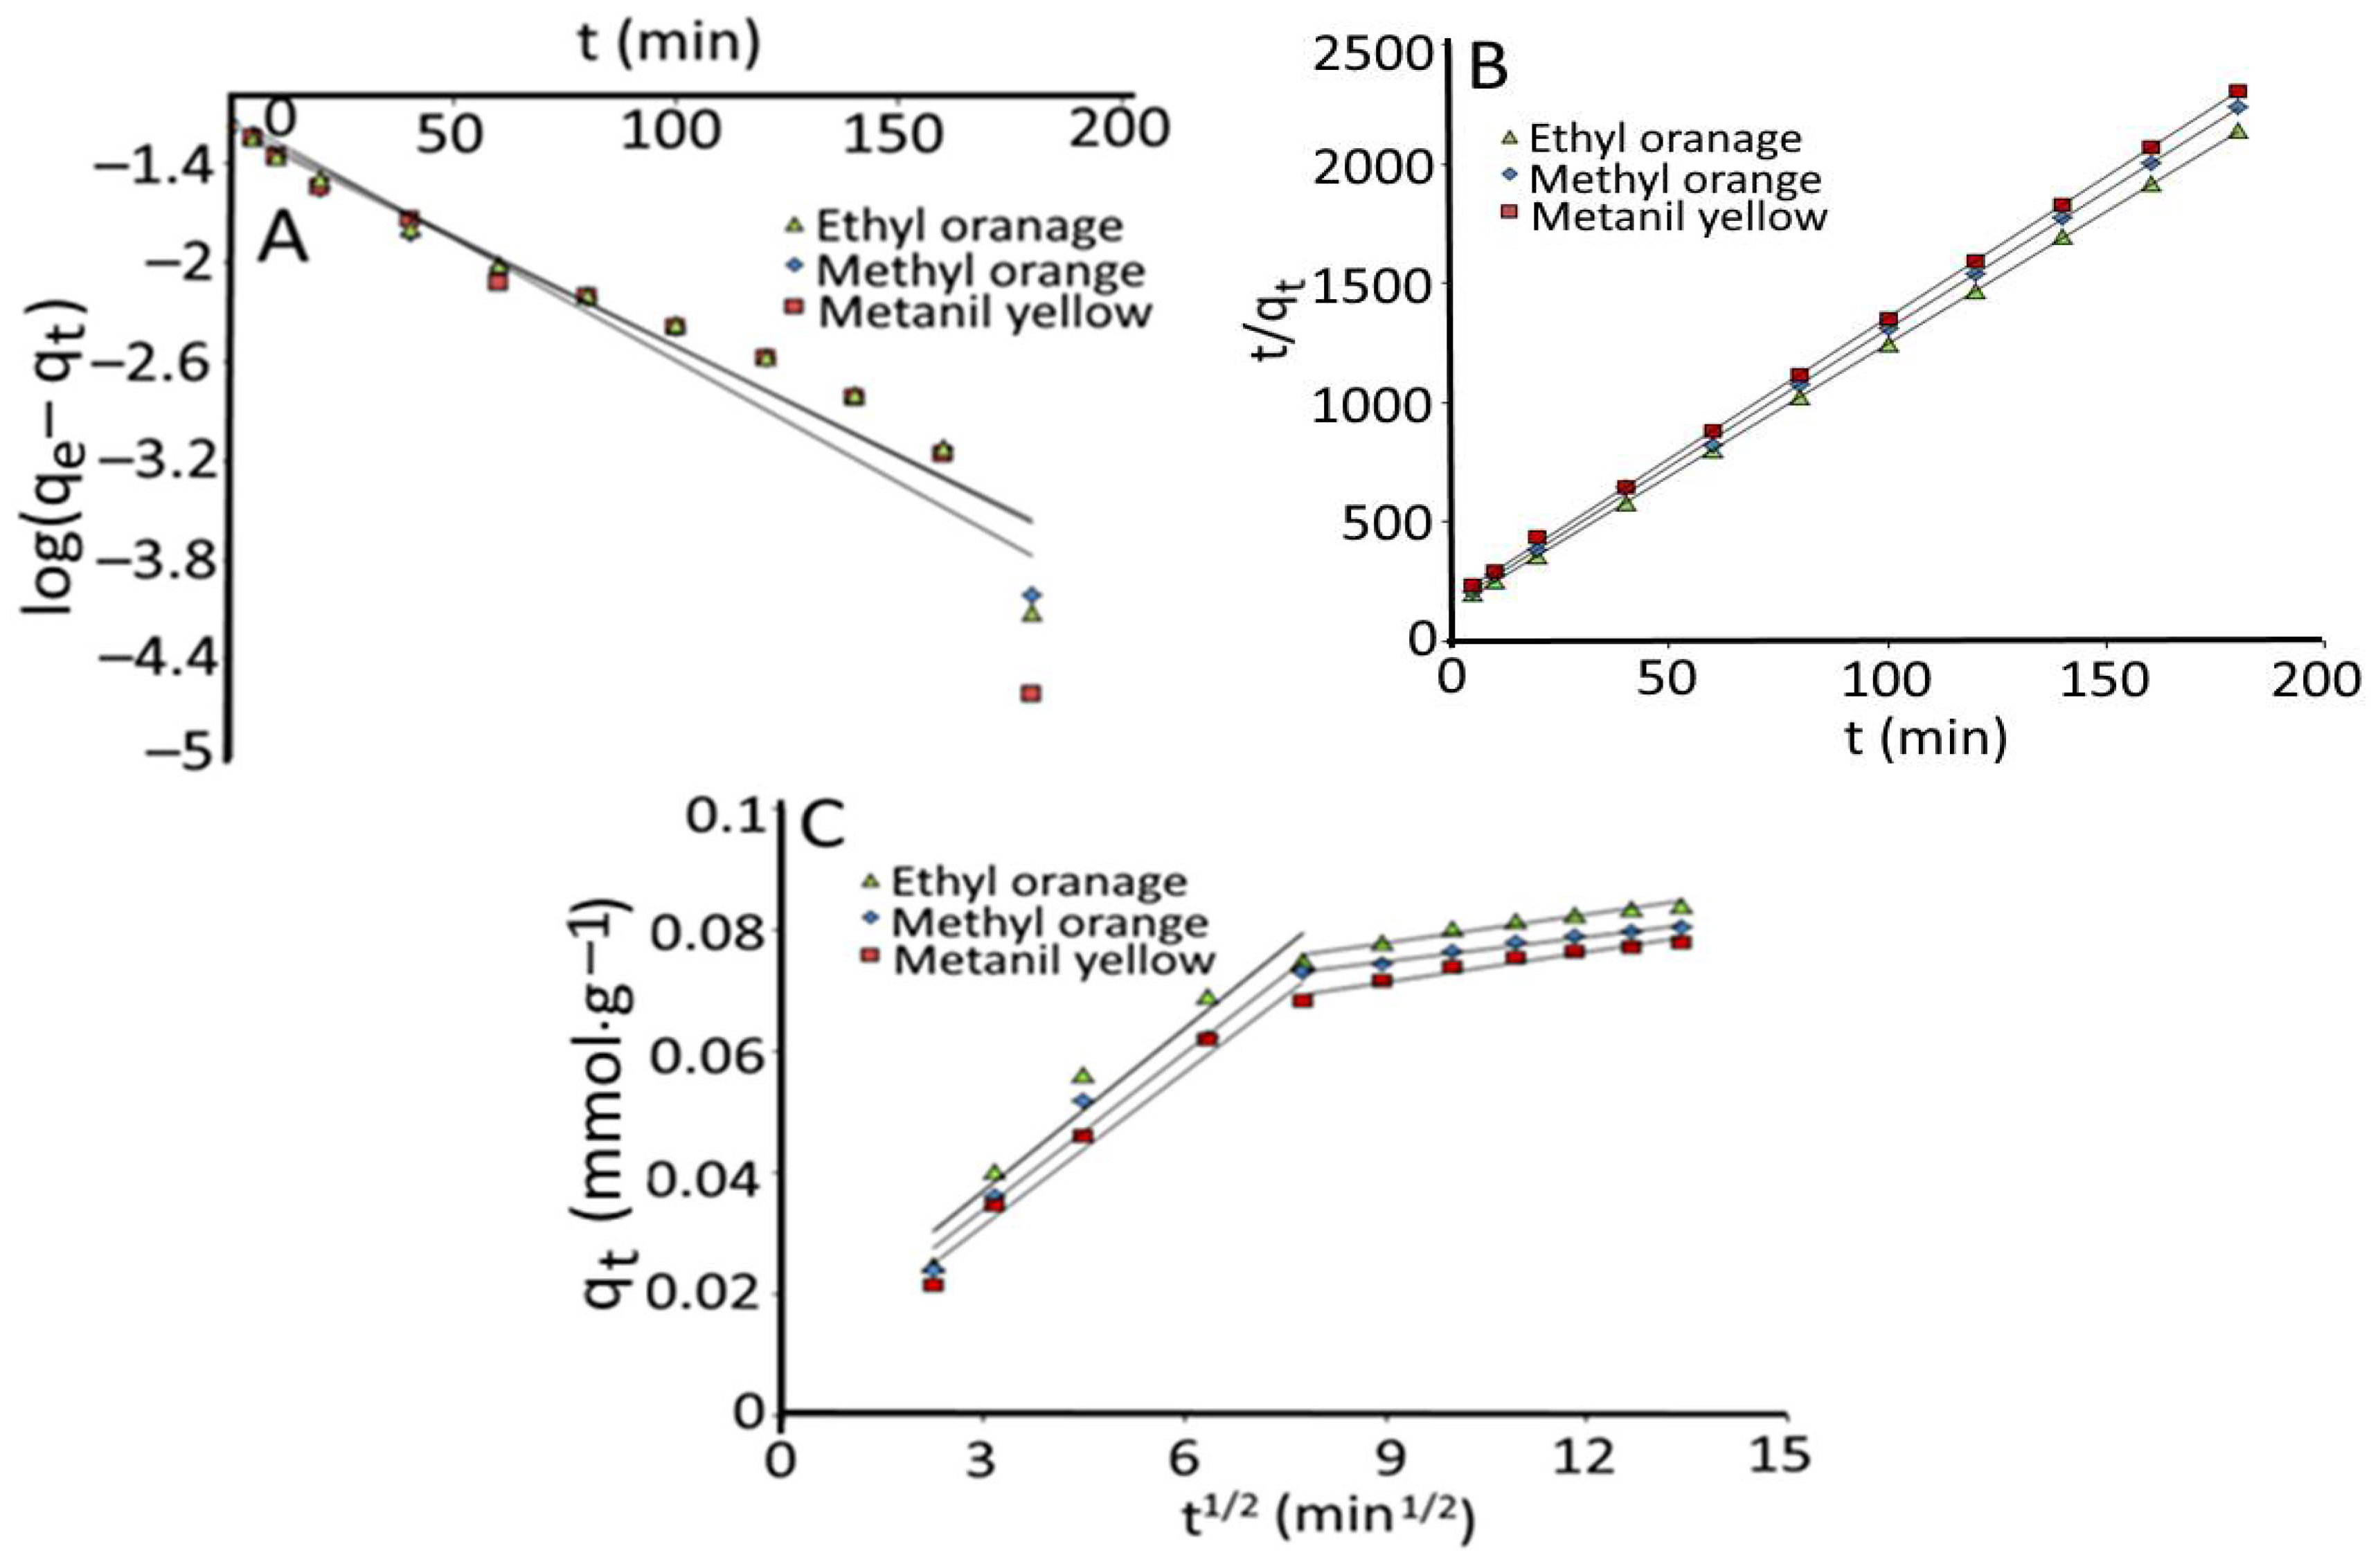
where k1 is the Lagergren adsorption rate constant (min−1) and qe and qt are the amounts of dye adsorbed (mmol·g−1) on the AC-HTPEFS at equilibrium and at time t (min), respectively. k1 and qe were calculated from the slope and intercept of the plot of log(qe − qt) versus t as shown in Figure 6A, and values are given in Table 5. It is evidenced from this table that the experimental value qe(exp) did not conform well with the theoretical values qe(cal) acquired from the linear plot for all dyes; therefore, this indicates the inapplicability of this model.
The PSO kinetic model [47] was also fitted with the experimental results, and the equation is shown as:
t q t = 1 k 2 q 2 e + 1 q e t
where k2 (g·mmol−1·min−1) is the rate constant of PSO kinetic equation. The plot between t/qt versus t is given in Figure 6B, and the values of k2 and qe (cal) obtained are given in Table 5.
It can be perceived that the theoretical values of qe(cal) obtained from the plot conform well to the experimental results qe(exp). In addition, the calculated values qe(cal) and the R2 for the kinetic models are also shown in Table 5. Evidently, the R2 value for the PFO kinetic model is found to be relatively low in comparison to PSO kinetic model. Therefore, the obtained results confirm that the azo acid dye adsorption on AC-HTPEFS follows the PSO kinetic model.
In order to know the mechanism of adsorption, the rate-controlling step, and reaction pathway, the Weber–Morris intraparticle diffusion IPD model [45] was applied for the present dye adsorption by AC-HTPEFS. The mathematical expression for this model is given as:
q t = K p · t 1 2 + C
where C is the thickness of the boundary layer and Kp is the intraparticle diffusion rate constant. The higher the value of C, the thicker is the boundary layer. According to this phenomenon, the transport processes in adsorption for porous adsorbents involve four steps, of which the second and third steps are the rate-determining steps [48]. In order to examine the IPD model, a plot is made between qt versus t1/2 for EO, MO, and MY. The slope of the plot qt versus t1/2 (Figure 6C) gives the IPD rate constant Kp. The extrapolation of the linear straight line to the time axis gives the intercept C. According to this model, the controlling step is IPD when the C = zero. At the same time, it is termed rather complex when C ≠ 0 and indicates the involvement of other mechanisms in addition to intraparticle diffusion.
Evaluating the IPD plot for three dyes reveal that the adsorption of the dye follows two different stages: film diffusion (first stage) and IPD (second stage). The IPD rate constant Kp (Kp1 for the first stage and Kp2 for the second stage) and the value of C (C1 for the first stage and C2 for the second stage) were obtained from the plot of qt versus t1/2. The IPD equation and values are given in Table 5 and observed that the value of Kp2 is lower than Kp1 in the case of all dyes, which shows that IPD is the rate-limiting step. The results show two linear sections that do not pass through the origin, which means IPD is not the only rate-controlling step [49]. Therefore, it can be concluded that the adsorptive analysis of EO, MO, and MY onto AC-HTPEFS is a complex process, and in addition to IPD, some other mechanisms are also involved.

4. Conclusions

Activated carbon with excellent adsorptive capacity for azo dyes (EO, MO, and MY) was successfully prepared from Phyllanthus emblica fruit stones through sequential hydrothermal treatment. The prepared AC-HTPEFS showed an effective adsorption power as compared to other adsorbents. The adsorption of azo dyes on AC-HTPEFS has been analyzed with the different variable parameters including initial dye concentration, contact time, and temperature. The experimental adsorption data were analyzed using different adsorption isotherm and kinetic models. The Langmuir monolayer adsorption capacity of AC-HTPEFS towards three azo dyes, EO, MO, and MY is 0.202, 0.187, and 0.158 mmol·g−1, respectively. The main differences in the adsorption amount of azo dye were related to the variation in functional groups present on each dye and their geometry as well as hydrophobicity of both AC-HTPEFS and dyes. The negative values of G° revealed the spontaneous nature, while the positive values of ΔH° indicated the endothermic nature of adsorption with physical forces being involved in the adsorption process. The best fit of isotherms by the Langmuir model showed the monolayer adsorption of azo dyes on the AC-HTPEFS and the kinetics of azo dyes followed a PSO model. The outcome of this study forms the basis for examining the viability and performance of AC-HTPEFS in the adsorption of other organic pollutants in the future.

Author Contributions

Conceptualization, S., S.K., B.S.I. and K.S.; methodology, S.K. and S.; software, S., S.K., B.S.I. and K.S.; validation, S.K., J.G., J.A., S.C. and S.; formal analysis, S.K., M.C. and S.; investigation, S.K., M.C. and S.; resources, S.K. and S.; data curation, S., S.K., B.S.I. and K.S.; writing—original draft, S.K. and S.; writing—review and editing, M.C., J.G., J.A., S.C., I.T., R.R.K. and S.; visualization, S.K., J.G., J.A., S.C., M., I.T., M.C. and S.; supervision, S. All authors have read and agreed to the published version of the manuscript.

Funding

Authors are thankful to DST, New Delhi, India, for the financial support.

Data Availability Statement

Data that support the findings are available within the article.

Acknowledgments

Authors are thankful to DST, New Delhi, India, for the financial support under Water Technology Initiative (Project No: DST/TMD/EWO/WTI/2K19/EWFH/2019/90). One of the authors (Jahangeer Ahmed) would like to extend his sincere appreciation to the Researchers Supporting Project number (RSP-2021/391), King Saud University, Riyadh, Saudi Arabia.

Conflicts of Interest

The authors declare no conflict of interest.

References

  1. Chung, K.-T. Azo dyes and human health: A review. J. Environ. Sci. Health Part C 2016, 34, 233–261. [Google Scholar] [CrossRef] [PubMed]
  2. Bafana, A.; Devi, S.S.; Chakrabarti, T. Azo dyes: Past, present and the future. Environ. Rev. 2011, 19, 350–371. [Google Scholar] [CrossRef]
  3. Hefford, R. Colourants and dyes for the cosmetics industry. In Handbook of Textile and Industrial Dyeing; Elsevier: Amsterdam, The Netherlands, 2011; pp. 175–203. [Google Scholar]
  4. Allen, R. The chemistry of azo dyes. In Colour Chemistry; Springer: Berlin/Heidelberg, Germany, 1971; pp. 21–36. [Google Scholar]
  5. Gordon, P.F.; Gregory, P. Azo Dyes. In Organic Chemistry in Colour; Springer: Berlin/Heidelberg, Germany, 1987; pp. 95–162. [Google Scholar]
  6. Saratale, R.G.; Saratale, G.D.; Chang, J.-S.; Govindwar, S.P. Bacterial decolorization and degradation of azo dyes: A review. J. Taiwan Inst. Chem. Eng. 2011, 42, 138–157. [Google Scholar] [CrossRef]
  7. Chaudhary, M.; Suhas; Singh, R.; Tyagi, I.; Ahmed, J.; Chaudhary, S.; Kushwaha, S. Microporous activated carbon as adsorbent for the removal of noxious anthraquinone acid dyes: Role of adsorbate functionalization. J. Environ. Chem. Eng. 2021, 9, 106308. [Google Scholar] [CrossRef]
  8. Ooi, J.; Lee, L.Y.; Hiew, B.Y.Z.; Thangalazhy-Gopakumar, S.; Lim, S.S.; Gan, S. Assessment of fish scales waste as a low cost and eco-friendly adsorbent for removal of an azo dye: Equilibrium, kinetic and thermodynamic studies. Bioresour. Technol. 2017, 245, 656–664. [Google Scholar] [CrossRef]
  9. Ahmad, A.; Mohd-Setapar, S.H.; Chuong, C.S.; Khatoon, A.; Wani, W.A.; Kumar, R.; Rafatullah, M. Recent advances in new generation dye removal technologies: Novel search for approaches to reprocess wastewater. RSC Adv. 2015, 5, 30801–30818. [Google Scholar] [CrossRef]
  10. Suhas; Carrott, P.; Carrott, M.R.; Singh, R.; Singh, L.; Chaudhary, M. An innovative approach to develop microporous activated carbons in oxidising atmosphere. J. Clean. Produc. 2017, 156, 549–555. [Google Scholar] [CrossRef]
  11. Suhas; Gupta, V.K.; Carrott, P.J.M.; Singh, R.; Chaudhary, M.; Kushwaha, S. Cellulose: A review as natural, modified and activated carbon adsorbent. Bioresour. Technol. 2016, 216, 1066–1076. [Google Scholar] [CrossRef]
  12. Gupta, V.K.; Suhas. Application of low-cost adsorbents for dye removal—A review. J. Environ. Manag. 2009, 90, 2313–2342. [Google Scholar] [CrossRef]
  13. Suhas; Carrott, P.J.M.; Ribeiro Carrott, M.M.L. Lignin—From natural adsorbent to activated carbon: A review. Biores. Technol. 2007, 98, 2301–2312. [Google Scholar] [CrossRef]
  14. Sadia, M.; Ahmad, I.; Ali, F.; Zahoor, M.; Ullah, R.; Khan, F.A.; Ali, E.A.; Sohail, A. Selective Removal of the emerging dye basic blue 3 via molecularly imprinting technique. Molecules 2022, 27, 3276. [Google Scholar] [CrossRef] [PubMed]
  15. Sultana, S.; Rehan, K.; Rehan, I.; Ali, F.; Waris, S.; Zahoor, M.; Salman, S.M.; Khan, S.; Rehan, M.S. Physicochemical and instrumental characterization of rice husk and its potential use as a low cost adsorbent for mutagenic dye bromophenol blue. Z. Für Phys. Chem. 2021, 235, 1263–1277. [Google Scholar] [CrossRef]
  16. Jabeen, S.; Alam, S.; Shah, L.A.; Zahoor, M.; Rahman, N.U.; Khan, F.A.; Ullah, R.; Ali, E.A.; Murthy, H.C.A.; Sohail, A. Removal of safranin-T and toluidine from water through gum Arabic/acrylamide hydrogel. Ads. Sci. Technol. 2022, 2022, 6100791. [Google Scholar] [CrossRef]
  17. Kushwaha, S.; Suhas; Chaudhary, M.; Tyagi, I.; Bhutiani, R.; Goscianska, J.; Ahmed, J.; Manila; Chaudhary, S. Utilization of Phyllanthus emblica fruit stone as a potential biomaterial for sustainable remediation of lead and cadmium ions from aqueous solutions. Molecules 2022, 27, 3355. [Google Scholar] [CrossRef] [PubMed]
  18. Suhas; Gupta, V.K.; Singh, L.P.; Chaudhary, M.; Kushwaha, S. A novel approach to develop activated carbon by an ingenious hydrothermal treatment methodology using Phyllanthus emblica fruit stone. J. Clean. Prod. 2021, 288, 125643. [Google Scholar] [CrossRef]
  19. Srivastava, V.C.; Swamy, M.M.; Mall, I.D.; Prasad, B.; Mishra, I.M. Adsorptive removal of phenol by bagasse fly ash and activated carbon: Equilibrium, kinetics and thermodynamics. Colloids Surf. A Physicochem. Eng. Asp. 2006, 272, 89–104. [Google Scholar] [CrossRef]
  20. Guo, J.; Song, Y.; Ji, X.; Ji, L.; Cai, L.; Wang, Y.; Zhang, H.; Song, W. Preparation and characterization of nanoporous activated carbon derived from prawn shell and its application for removal of heavy metal ions. Materials 2019, 12, 241. [Google Scholar] [CrossRef]
  21. Din, A.T.M.; Hameed, B.; Ahmad, A.L. Batch adsorption of phenol onto physiochemical-activated coconut shell. J. Hazard. Mater. 2009, 161, 1522–1529. [Google Scholar]
  22. Dursun, G.; Çiçek, H.; Dursun, A.Y. Adsorption of phenol from aqueous solution by using carbonised beet pulp. J. Hazard. Mater. 2005, 125, 175–182. [Google Scholar] [CrossRef]
  23. Giles, C.H.; MacEwan, T.H.; Nakhwa, S.N.; Smith, D. Studies in adsorption. Part XI. A system of classification of solution adsorption isotherms, and its use in diagnosis of adsorption mechanisms and in measurement of specific surface areas of solids. J. Chem. Soc. 1960, 111, 3973–3993. [Google Scholar] [CrossRef]
  24. Freundlich, H.M.F. Over the adsorption in solution. J. Phys. Chem. 1906, 57, 385–470. [Google Scholar]
  25. Langmuir, I. The adsorption of gases on plane surfaces of glass, mica and platinum. J. Am. Chem. Soc. 1918, 40, 1361–1403. [Google Scholar] [CrossRef] [Green Version]
  26. Temkin, M. Kinetics of ammonia synthesis on promoted iron catalysts. Acta Physiochim. URSS 1940, 12, 327–356. [Google Scholar]
  27. Muthaiyan, K.; Tamilarasan, R. Modeling of experimental data for the adsorption of methyl orange from aqueous solution using a low cost activated carbon prepared from Prosopis juliflora. Pol. J. Chem. Technol. 2013, 15, 29–39. [Google Scholar]
  28. Djilani, C.; Zaghdoudi, R.; Djazi, F.; Bouchekima, B.; Lallam, A.; Modarressi, A.; Rogalski, M. Adsorption of dyes on activated carbon prepared from apricot stones and commercial activated carbon. J. Taiwan Inst. Chem. Eng. 2015, 53, 112–121. [Google Scholar] [CrossRef]
  29. Ghosh, G.; Chakraborty, T.; Zaman, S.; Nahar, M.; Kabir, A.H.M.E. Removal of methyl orange dye from aqueous solution by a low-cost activated carbon prepared from mahagoni (Swietenia mahagoni) bark. Environ. Pollut. 2020, 6, 171–184. [Google Scholar]
  30. Ramutshatsha-Makhwedzha, D.; Mavhungu, A.; Moropeng, M.L.; Mbaya, R. Activated carbon derived from waste orange and lemon peels for the adsorption of methyl orange and methylene blue dyes from wastewater. Heliyon 2022, 8, e09930. [Google Scholar] [CrossRef]
  31. Subbaiah, M.V.; Kim, D.-S. Adsorption of methyl orange from aqueous solution by aminated pumpkin seed powder: Kinetics, isotherms, and thermodynamic studies. Ecotoxicol. Environ. Saf. 2016, 128, 109–117. [Google Scholar] [CrossRef]
  32. Machrouhi, A.; Alilou, H.; Farnane, M.; El Hamidi, S.; Sadiq, M.; Abdennouri, M.; Tounsadi, H.; Barka, N. Statistical optimization of activated carbon from Thapsia transtagana stems and dyes removal efficiency using central composite design. J. Sci. Adv. Mater. Dev. 2019, 4, 544–553. [Google Scholar] [CrossRef]
  33. Guo, X.; Wei, Q.; Du, B.; Zhang, Y.; Xin, X.; Yan, L.; Yu, H. Removal of Metanil Yellow from water environment by amino functionalized graphenes (NH2-G)–Influence of surface chemistry of NH2-G. Appl. Surf. Sci. 2013, 284, 862–869. [Google Scholar] [CrossRef]
  34. Santra, A.K.; Pal, T.K.; Datta, S. Removal of metanil yellow from its aqueous solution by fly ash and activated carbon produced from different sources. Sep. Sci. Technol. 2008, 43, 1434–1458. [Google Scholar] [CrossRef]
  35. Sayğılı, H.; Güzel, F. High surface area mesoporous activated carbon from tomato processing solid waste by zinc chloride activation: Process optimization, characterization and dyes adsorption. J. Clean. Prod. 2016, 113, 995–1004. [Google Scholar] [CrossRef]
  36. Jain, A.K.; Gupta, V.K.; Bhatnagar, A.; Suhas. Utilization of industrial waste products as adsorbents for the removal of dyes. J. Hazard. Mater. 2003, 101, 31–42. [Google Scholar] [CrossRef]
  37. Weber, T.W.; Chakravorti, R.K. Pore and solid diffusion models for fixed-bed adsorbers. AIChE J. 1974, 20, 228–238. [Google Scholar] [CrossRef]
  38. Chaudhary, M.; Suhas; Singh, R.; Yilmaz, M.; Chaudhary, S.; Kushwaha, S. Role of the similar molecular weight dyes on the adsorption by activated carbon. Desaliation Water Treat. 2021, 244, 343–354. [Google Scholar] [CrossRef]
  39. Clark, M. Handbook of Textile and Industrial Dyeing: Principles, Processes and Types of Dyes; Elsevier: Amsterdam, The Netherlands, 2011. [Google Scholar]
  40. Hummert, J. Femtosecond XUV photoelectron spectroscopy of organic molecules in aqueous solution. J. Phys. Chem. Lett. 2018, 9, 6649–6655. [Google Scholar] [CrossRef]
  41. Guo, Y.; Kaplan, S.; Karanfil, T. The significance of physical factors on the adsorption of polyaromatic compounds by activated carbons. Carbon 2008, 46, 1885–1891. [Google Scholar] [CrossRef]
  42. Cornelissen, G.; Elmquist, M.; Groth, I.; Gustafsson, Ö. Effect of sorbate planarity on environmental black carbon sorption. Environ. Sci. Technol. 2004, 38, 3574–3580. [Google Scholar] [CrossRef]
  43. Boyd, B.J.; Drummond, C.J.; Krodkiewska, I.; Grieser, F. How chain length, headgroup polymerization, and anomeric configuration govern the thermotropic and lyotropic liquid crystalline phase behavior and the air− water interfacial adsorption of glucose-based surfactants. Langmuir 2000, 16, 7359–7367. [Google Scholar] [CrossRef]
  44. Liu, Q.-S.; Zheng, T.; Wang, P.; Jiang, J.-P.; Li, N. Adsorption isotherm, kinetic and mechanism studies of some substituted phenols on activated carbon fibers. Chem. Eng. J. 2010, 157, 348–356. [Google Scholar] [CrossRef]
  45. Weber, W.J.; Morris, J.C. Kinetics of adsorption on carbon from solution. J. Sanit. Eng. Div. 1963, 89, 31–60. [Google Scholar]
  46. Lagergren, S. About the theory of so-called adsorption of soluble substances. K. Sven. Vetensk. Handl. 1898, 24, 1–39. [Google Scholar]
  47. Ho, Y.S.; McKay, G. Sorption of dye from aqueous solution by peat. Chem. Eng. J. 1998, 70, 115–124. [Google Scholar] [CrossRef]
  48. Weber, W.J., Jr. Evolution of a technology. J. Environ. Eng. 1984, 110, 899–917. [Google Scholar] [CrossRef]
  49. Duran, C.; Ozdes, D.; Gundogdu, A.; Senturk, H.B. Kinetics and isotherm analysis of basic dyes adsorption onto almond shell (Prunus dulcis) as a low cost adsorbent. J. Chem. Eng. Data 2011, 56, 2136–2147. [Google Scholar] [CrossRef]
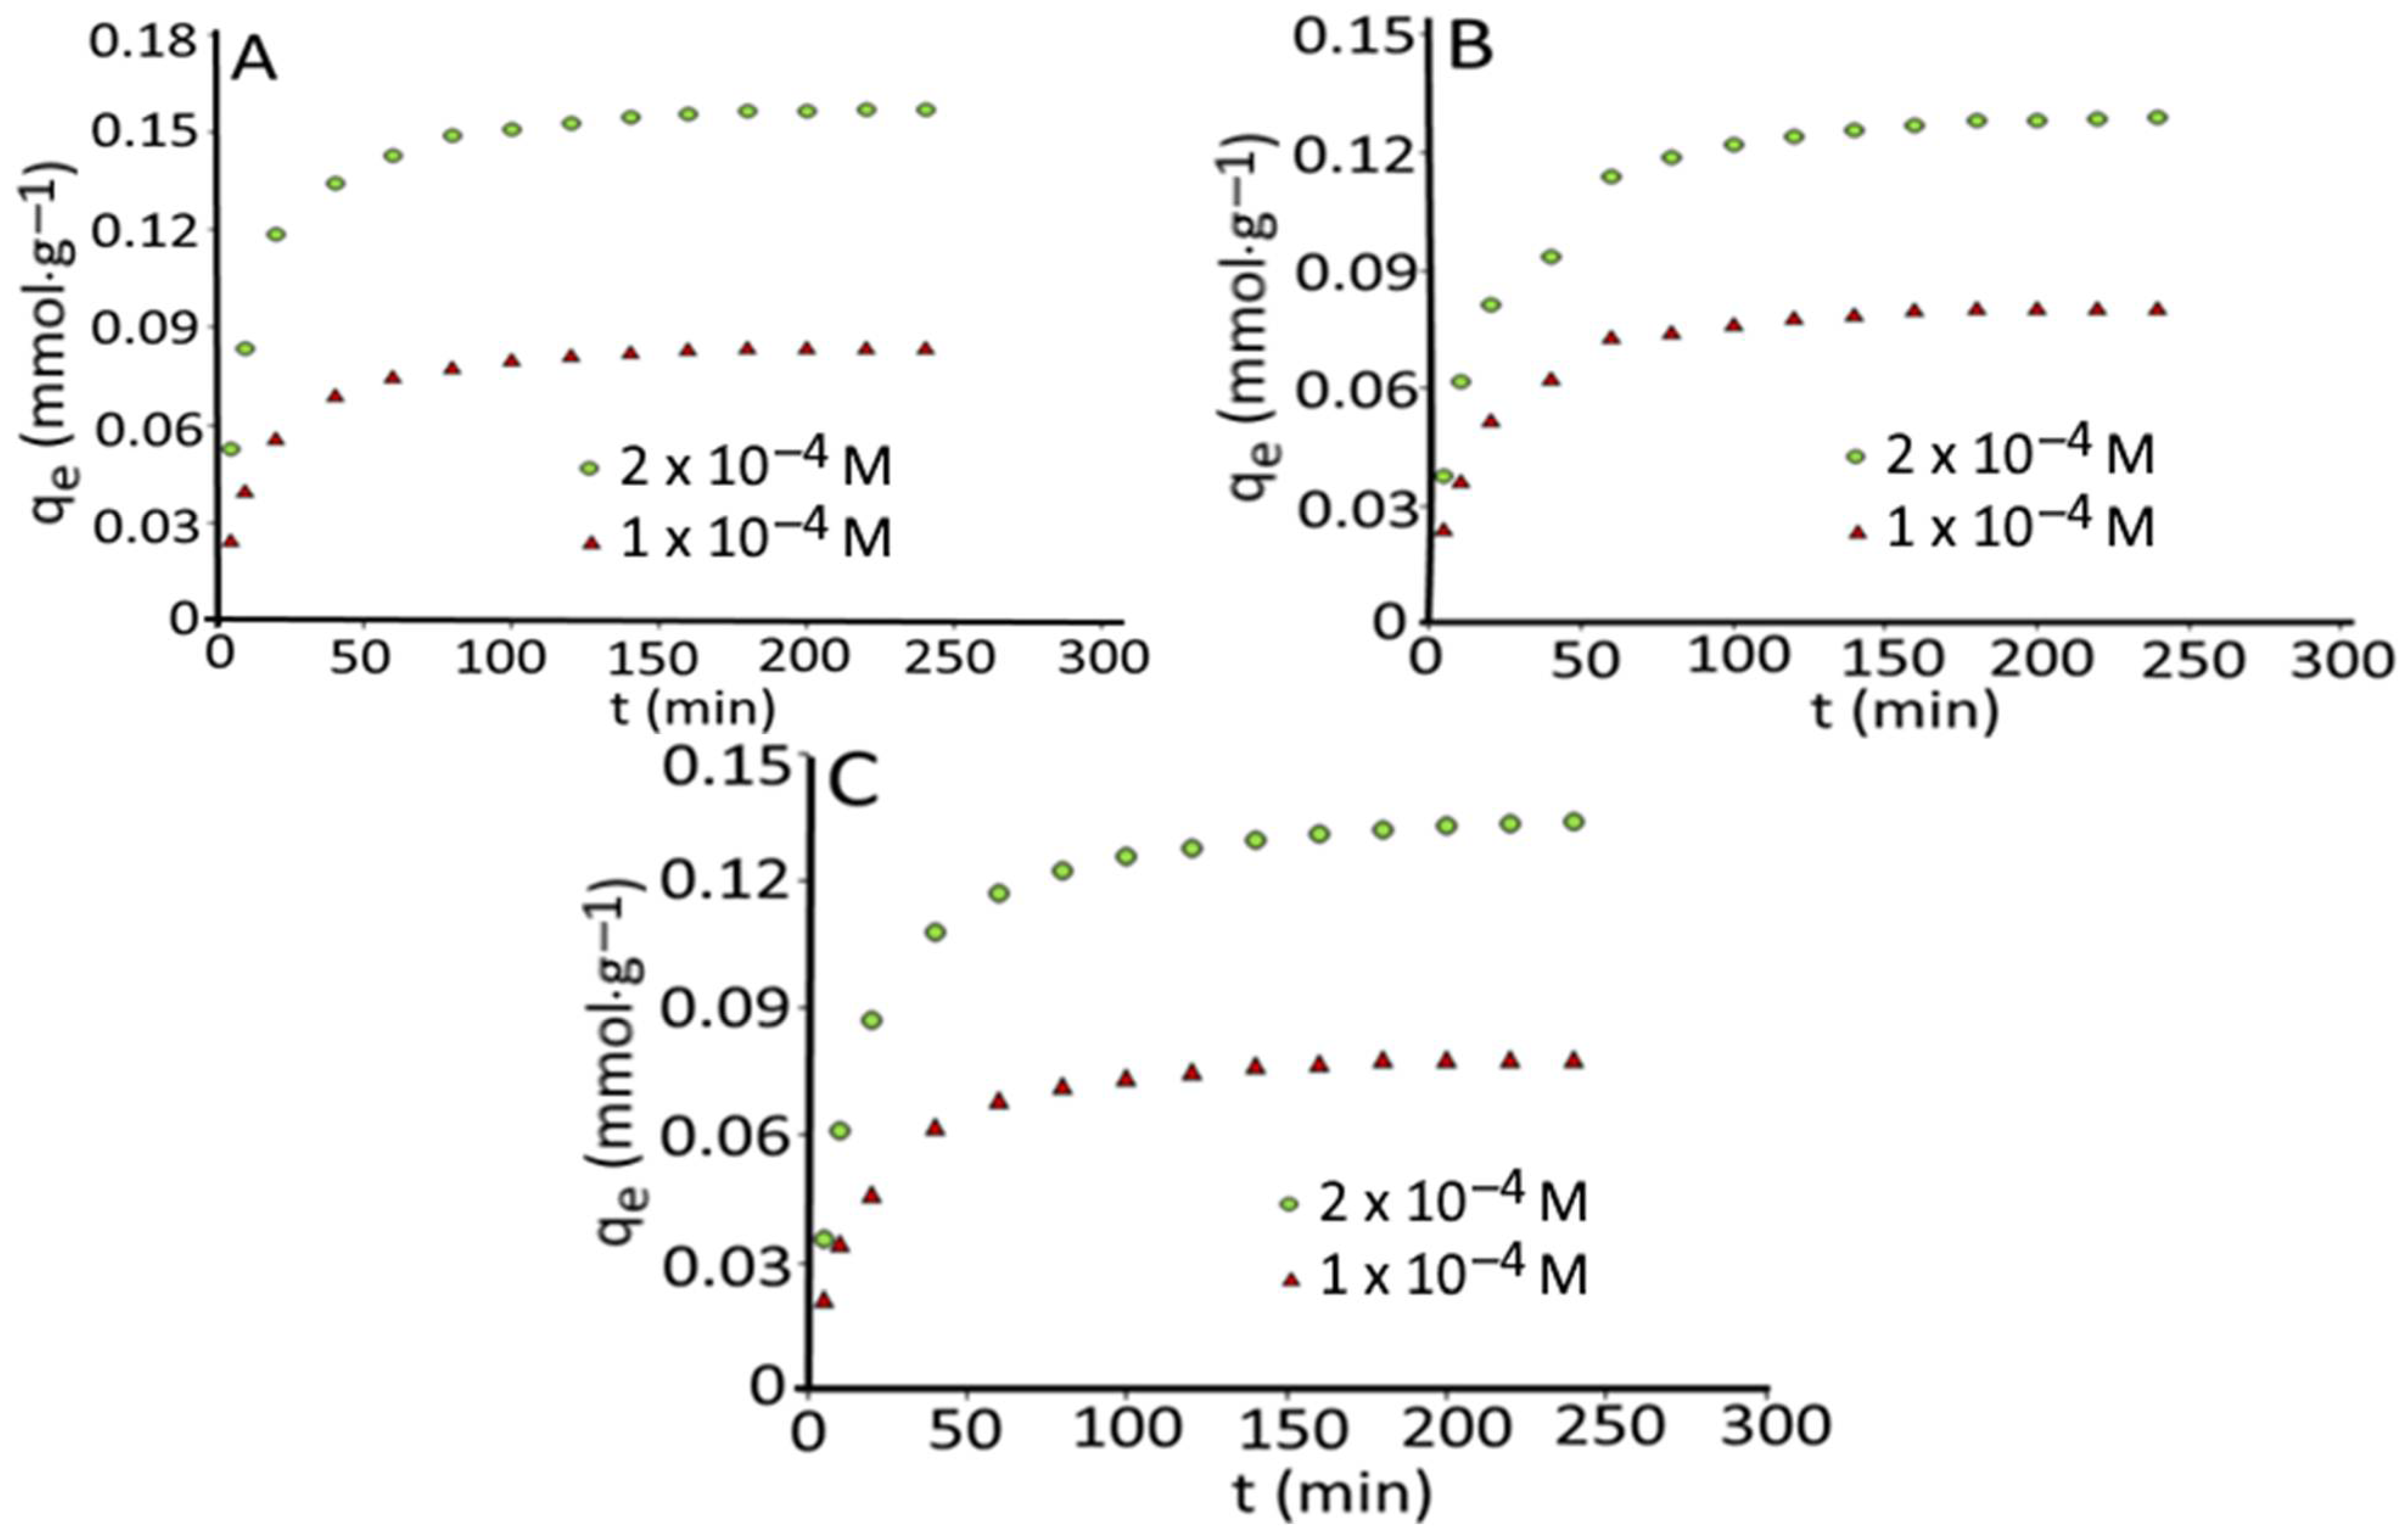
Figure 1. Effect of contact time and initial concentration on the adsorption of EO (A), MO (B), and MY (C) onto AC-HTPEFS at 25 °C.
Agronomy 12 02134 g001
Figure 2. Adsorption isotherm of EO, MO and MY onto AC-HTPEFS at 25 °C (A), 35 °C (B), and 45 °C (C).
Agronomy 12 02134 g002
Figure 3. Adsorption isotherm of EO (A), MO (B), and MY (C) onto CAC and activated carbon developed hydrothermally treated Phyllanthus emblica fruit stone (AC-HTPEFS) at 25 °C.
Agronomy 12 02134 g003
Figure 4. Langmuir (A), Freundlich (B), and Temkin (C) adsorption isotherms of EO, MO, and MY onto AC-HTPEFS at 25 °C.
Agronomy 12 02134 g004
Figure 5. Van’t Hoff plots for the adsorption of EO, MO and MY onto AC-HTPEFS.
Agronomy 12 02134 g005
Figure 6. Pseudo-first-order (A) and pseudo-second-order (B) and IPD (C) kinetic plots for the adsorption of EO, MO, and MY dyes onto AC-HTPEFS.
Agronomy 12 02134 g006
Table 1. Chemical structure and properties of ethyl orange, methyl orange, and metanil yellow dyes used in this study.
NameStructureMolecular WeightMolecular Formula
Ethyl orange (EO)Agronomy 12 02134 i001355.39C16H18N3NaO3S
Methyl orange (MO)Agronomy 12 02134 i002327.33C14H14N3NaO3S
Metanil yellow (MY)Agronomy 12 02134 i003375.38C18H14N3NaO3S
Table 2. Isotherm model parameters for the adsorptive analysis of azo dyes on AC-HTPEFS.
DyesTemperature
(°C)
LangmuirFreundlich Temkin
qmax
(mmol·g−1)
b
(L·mol−1)
R2Kf
(mmol·g−1)
nR2bT
(KJ·mol−1)
AT
(L·mg−1)
R2
EO250.2027.11 × 1040.9913.333.170.9480.1762.580.980
350.2157.33 × 1040.9914.462.970.9580.1592.330.985
450.2337.71 × 1040.9845.772.840.9390.1462.450.976
MO250.1876.43 × 1040.9903.233.070.9450.2062.380.956
350.1996.77 × 1040.9894.182.910.9500.1872.320.982
450.2106.84 × 1040.9945.132.790.9550.1462.660.976
MY250.1586.25 × 1040.9842.583.130.9380.1941.7000.973
350.1676.40 × 1040.9882.953.080.9390.1872.020.982
450.1786.52 × 1040.9933.722.920.9550.1811.910.978
Table 3. Comparison of adsorption capacities of activated carbon prepared from Phyllanthus emblica fruit stone with some previously reported adsorbents for the adsorption of EO, MO and MY dyes.
AdsorbentDyesMaximum amount AdsorbedReferences
Activated carbon prepared from Prosopis juliflora barkMethyl orange10.29 mg·g−1[27]
Activated carbon prepared from apricot stonesMethyl orange32.25 mg·g−1[28]
Activated carbon derived from Mahagoni barkMethyl orange6.071 mg·g−1[29]
Activated carbon prepared from waste orange and lemon peelsMethyl orange33 mg·g−1 [30]
Aminated pumpkin seed powderMethyl orange143.7 mg·g−1[31]
Activated carbon from Thapsia transtagana stemsMethyl orange118.10 mg·g−1[32]
AC-HTPEFSMethyl orange61.2 mg·g−1/0.187 mmol·g−1 This study
Amino functionalized graphenesMetanil yellow71.62 mg·g−1[33]
Rice Husk activated carbonMetanil yellow52.83 mg·g−1[34]
Cocunut shell derived activated carbonMetanil yellow79.69 mg·g−1[34]
Activated carbon from tomato processing solid wasteMetanil yellow385 mg·g−1[35]
AC-HTPEFSMetanil yellow59.3 mg·g−1/0.158 mmol·g−1 This study
Adsorbents from steel and fertilizer industries wastesEthyl orange198 mg·g−1[36]
AC-HTPEFSEthyl orange71.8 mg·g−1/0.202 mmol·g−1 This study
Table 4. Thermodynamic parameters for the adsorptive analysis of azo dyes on the AC-HTPEFS.
DyesTemperature (°C)−ΔG°
(kJ·mol−1)
ΔS°
(J·mol−1·K−1)
ΔH°
(kJ·mol−1)
EO25
35
45
27.7
28.7
29.8
1043.18
MO25
35
45
27.4
28.5
29.4
1002.45
MY25
35
45
27.4
28.3
29.3
97.41.67
Table 5. Kinetic parameters for the adsorptive analysis of azo dyes on the AC-HTPEFS.
DyesCo
(mol·L−1)
qe (exp)
(mmol·g−1)
Pseudo-First OrderPseudo-Second OrderIntraparticle Diffusion
qe (cal)
(mmol·g−1)
K1
(min−1)
R2qe (cal)
(mmol·g−1)
K2
(g.mmol−1
·min−1)
R2Kp1C1R2Kp2C2R2
EO1 × 10−40.0850.06373.08 × 10−20.9480.0900.9000.9990.00890.01030.9440.00160.06370.884
MO1 × 10−40.08040.07553.39 × 10−20.8800.0870.8620.9990.00860.00830.9710.00140.06250.986
MY1 × 10−40.07810.0743.09 × 10−20.9360.0850.7960.9990.00840.00610.9750.00160.05670.962
Publisher’s Note: MDPI stays neutral with regard to jurisdictional claims in published maps and institutional affiliations.