Abstract
Multi-trait selection is very helpful in plant breeding programs. This technique can select genotypes for specific traits. Yield performance of maize hybrids is influenced by genotype-by-environment interactions (GEIs). This requires multi-environmental testing to identify superior hybrids. The aims of this study were to: (1) select maize hybrids within favorable traits such as grain yield and yield attributes; (2) identify genotype and environment interactions (GEIs) within maize yield; (3) evaluate maize hybrids adaptability to four different locations in West Java; and (4) identify a representative environment for testing and developing new maize hybrids. Twenty-two maize hybrids were evaluated using a randomized block design repeated three times in each environment. The genotype by traits (GT) biplot showed that G3 maize hybrid was superior to ear weight (EW), ear weight without corn husk (EwoH), ear weight per plot (EWP), plant height (PH), ear diameter (ED), and 1000 seed weight (OSW) traits. The G22 maize hybrid was superior to ear weight without corn husk per plot (EwoP), ratio seed weight and ear weight without corn husk (RSEW), grain yield per ha (Y), seed weight (SW), and seed weight per plot (SWP) traits. Combined analysis of variance showed that genotype (G), environment (E), and their interactions (GEIs) had a significant effect on yield (p < 0.01) with contributions of 85.63%, 2.24%, and 12.13%, respectively. The combined stability measurement results and the GGE biplot reveal that G2 is a stable high-yield hybrid, while G4 and G16 are unstable high-yield hybrids. The most representative environment is Arjasari, with the sole-cropping system (ARJ M). This study reveals that the resulting maize hybrid can be useful as a substitute for commercial hybrids currently used. The stable high yield of maize hybrids can be recommended as new varieties with wide adaptation, while unstable high-yield hybrids can be recommended as varieties adapted to specific environments.
1. Introduction
Maize (Zea mays L.) is an essential and deliberate commodity that can be cultivated in various agro-ecological systems. Maize is a necessary food for most people worldwide [1]. Furthermore, maize is also useful as animal feed, especially for cattle, and as an industrial raw material [2,3,4]. To satisfy the predicted rise in food demand, maize production and productivity must improve by 2.40% per year [5]. However, maize yields have plateaued, with an average yield of 2 t·ha−1 in numerous nations [6]. Yields have recently decreased, endangering future food security [7,8,9]. The yield decline was caused by a genetic decline in maize germplasm [6]. Assembling new genetic variations of germplasm via crosses that involve different natural resources can increase superior maize yields [10]. Germplasm of the tropical maize has the potential to help the maize seed grow [6]. Nevertheless, the tropical germplasm of maize has more undesirable genes than the subtropical germplasm, which is particularly beneficial for improvement [11]. The introgression of subtropical into tropical genes of maize has been shown to improve diversity in genes and heterosis in breeding schemes of maize [12,13]. However, the hybrids developed from cross-breeding have different adaptability to environmental change [14]. As a result, a rise in grain yields is required to meet national and worldwide food demands; thus, it must be investigated in a particular environment of production to discover superior and stable hybrids.
Climate change is a major factor that influences productivity in agriculture and is unpredictable. Meanwhile, the climate conditions nearly involved rainfed agriculture, such as staple food commodities (rice, maize, and wheat) [15]. The climate will affect water availability, humidity, and sunlight intensity. The ecosystem will fluctuate in temperature and rainfall due to climate change scenarios [16]. Climate change will also affect food safety and diminish crop production since it is affected by environmental conditions such as nutrition and water availability [17].
Multiple cropping systems are an excellent tool to test multiple cultivars or maize lines. A cropping technique known as a multiple cropping system combines two or more crops in a single crop area. Through this technique, crop production can use water, fertilizer, and light more efficiently [18]. The multiple-cropping system can also increase the stability of crop yields because it can form an optimal and suitable micro-climate for plant commodities [17].
Regarding breeding programs, the major selection criteria are high yield potential, stability, and adaptability [19,20]. Through multi-environment experiments, adaptable and stable hybrids with high potential for productivity were discovered. When evaluating genotypes in various environments, breeders must contend with genotype-by-environment interactions (GEIs) [21]. A comprehensive assessment of GEIs necessitates more complex statistical approaches than ordinary analysis of variance (ANOVA) [6]. Parametric and non-parametric stability [22], AMMI [23], and GGE biplot [24,25] have been widely used to assess the GEI’s effects. Therefore, it is crucial to measure GEIs to identify high-performing hybrids in the final selection cycle and predict their potential performance in various environments.
The selection of superior maize hybrids involves many statistical measurements. The selection of high-yielding varieties using a single stability measurement was considered inaccurate, so it is necessary to combine various stability measurements [14]. Various studies have reported the combined stability measurements, including those of black soybeans [26,27], durum wheat [28,29], sweet potatoes [30], stevia [31], and rice [32]. In combining stability measurements, biplot visualization is very important to use. Currently, two biplot models are used, namely AMMI and GGE biplots. These two models can help select genotypes with broad and specific adaptations by supporting superiority and stability indices [23,24]. In addition, both of them can also identify the performance of genotypes and GEIs. This allows the identification of hybrids in several test environments based on their environmental conditions to be able to distinguish the genotypes being tested from the ideal environment [20,33]. In the GGE-biplot, the potential and stability of yields were evaluated using the average environment [34], which is determined by the average principal component scores for all environments [35,36]. GGE biplot allows the identification of superior hybrids evaluated in multiple environments, which is important for the development of maize plant breeding programs. The purpose of this study was to select maize hybrids within favorable traits such as grain yield and yield attributes; identify genotype and environmental interaction (GEIs) within maize yield; evaluate maize hybrids adaptability to four different locations in West Java; and identify a representative environment for testing and developing new maize hybrids. The results of this research can be used as a reference in selecting maize hybrids and representative environments in Indonesia.
2. Materials and Methods
2.1. Plant Materials
The genetic material consisted of 22 maize hybrids developed via cross-breeding. Table 1 provides details on the hybrid maize that was used.

Table 1.
Maize hybrids used in the study.
2.2. Experimental Design
The experiments were conducted in four different locations, and the field conditions were intercropping with soybeans or sole cropping. The four locations are in West Java Province were Arjasari (multiple cropping = ARJ CS; sole cropping = ARJ M), Karawang (multiple cropping = KRW CS; sole cropping = KRW M), Cikandang (multiple cropping = CKD CS; sole cropping = CKD M), and Lembang (multiple cropping = LMB CS; sole cropping = LMB M). Table 2 provides details regarding the test locations. Three times, the randomized block design was implemented. Five t·ha−1 of chicken manure and 200 kg·ha−1 each of the chemical fertilizers Phonska and 75 kg·ha−1 of UREA were used in the fertilization process. Weeding and hoarding were conducted according to the plant’s needs for plant maintenance, such as controlling pests and diseases.
Table 2.
Information about test environment.
2.3. Data Collection
The observed traits included grain yield and yield components such as plant height (PH), ear diameter (ED), ear length (EL), row’s number (RN), ear weight (EW), ear weight without corn husk (EWoH), ear weight per plot (EWP), ear weight without corn husk per plot (EWoP), 1000 seed weight (OSW), seed weight (SW), seed weight per plot (SWP), ratio seed weight and ear weight without corn husk (RSEW), and grain yield per ha (Y). Data collection followed the descriptors for maize. At the time of harvest, data on grain yield per plot (Kg) were gathered and converted to t·ha−1. Each hybrid’s grain yields were weighed whole using a digital scale. The sample weight (kg) obtained from a 5 × 3 m2 plot of each maize hybrid.
2.4. Data Analysis
The relationship between each trait investigated and the best maize hybrids depending on each trait was determined using the GT biplot analysis. These equations were applied [37]:
where Tij is the i-th maize hybrid average for j-th trait; Tj is the j-th trait average in all maize hybrid; sj is the j-th standard deviation trait among the maize hybrid averages; ζi1 and ζi2 were the apprising of the 1st and 2nd principal component (PC1 and PC2) scores for the i-th maize hybrid; τJ1 and τJ2 were the PC1 and PC2 scores for j-th trait, respectively; and the model error for the ith maize hybrid and j-th trait is denoted by the notation εij.
For every maize hybrid, the GEIs were estimated. Following was the statistical model for the environments’ combined ANOVA:
where Yefgh is the value of maize hybrids e in plot h and the value of each replication g in environment f; μ is the grand mean; Ge represents the effect of maize hybrids e; Ef is the environment influence; GEef is the interaction effect between maize hybrids e and environment f; Rg(f) is the replicate g effect on environment f; Bh(g) is the repeat g influence on plot h; and εefgh is the maize hybrids e influence error in plot h and repeat g of environment f, respectively.
Yefgh = μ + Ge + Ef + GEef + Rg(f) + Bh(g) + εefgh
The parametric and non-parametric stability models used for identifying stable maize hybrids. Linear regressions follow [38]’s method. Based on this model, maize hybrids indicate stability if a regression slope (bi) of 1 and a variance deviation (S2di) of 0. The mean-variance component (θi) was estimated according to [39] with the formula:
The GE variance component (θ(i)) was identified following [40] as:
Wricke’s ecovalence () was investigated according to [41] as:
Shukla’s stability variance was observed based on [42] as:
The coefficient of variance (CVi) was observed based on [43] as:
where xij = yield of maize hybrids i in environment j; = maize hybrids i yield; = average yield of environment j; = overall yield average; p and q = the maize hybrid and environment number, respectively; and SDg = a maize hybrid’s standard deviation mean across environments.
The models of stability nonparametric (S(i)) were used following [44,45] with the formula:
where rij = rank in environment j from maize hybrids i; = mean rank across all environments for each maize hybrid; and N = the number of environments. Stability parameters (NP(i)) were identified according to [46] as:
where = maize hybrids ‘i’ rank in environment ‘j’ based on adjusted data; = adjusted median rank data; Mdi = same variable determined from the unadjusted data; N = number of an environment. The non-parametric stability measured by Kang’s (KR) was assessed based on [47]. The yield performance and stability variance were assigned weightings of 1 in this procedure to find high-yielding and stable maize hybrids. The online program STABILITYSOFT was utilized to calculate the parametric and non-parametric statistics [48].
Visual estimation of yield stability and identification of the best environment were analyzed using GGE biplots. The GGE biplot model was calculated by following [25] with the formula:
where Yij is the maize hybrid I mean yield in environment j; is the overall maize hybrid average yield in environment j; and are the PC1 and PC2 singular values, respectively; and are the PC1 and PC2 scores, respectively, for maize hybrid i; and are the PC1 and PC2 scores, respectively, for environment j; is the residual of the model associated with the maize hybrid i in environment j.
3. Results
3.1. Multi-Trait Selection and Relationships between Traits Tested against Maize Hybrid Populations Genotype by Traits (GT) Biplot
Based on yield and yield attributes data from four environments with two planting patterns (sole-crop and multiple-crop), Figure 1 displays the GT biplot for maize hybrid populations. In Figure 1, six sectors are created, and several sectors have different maize hybrids and traits tested. The relationship between traits and hybrids tested is very close if they are in the same sector. The G3 maize hybrid excels in sector 1 and correlates with EW, EWoH, EWP, PH, ED, and OSW traits. The G22 maize hybrid excels in sector 2, which correlates with EWoP, RSEW, Y, SW, and SWP. The biplot in Figure 1 represents 56.82% (PC1 = 33.29% and PC2 = 23.53%), which shows a strong influence on the resulting variation. In this study, G20 maize hybrids were identified that were opposite to all the traits measured. This shows that G20 is a poor maize hybrid for all the traits tested.
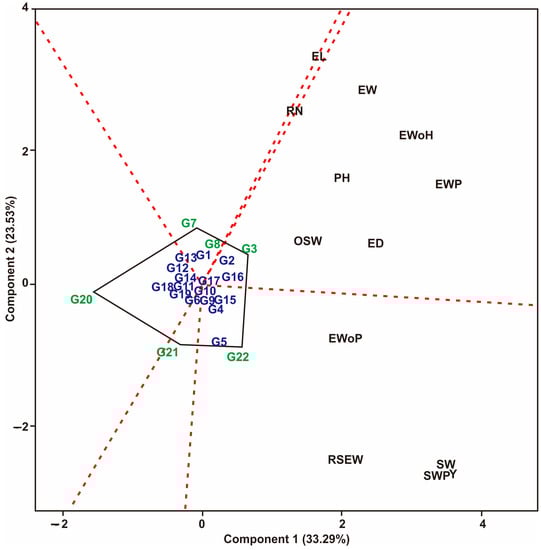
Figure 1.
Superiority of maize hybrid against multiple traits based on GT biplot. Hybrids code; see Table 1. Traits code; see data collection.
The GT biplot estimates the relationship between traits in the maize hybrid populations tested (Figure 2). A strong relationship was indicated by the acute angle produced by the traits tested (<90°). In contrast, traits with obtuse angles show a weak relationship. Figure 2 shows that EL has a very sharp angle with RN, so both have a positive and significant correlation. Other traits that form very sharp angles are EWoH with PH, EWP with OSW, and Y with SW and SWP. Figure 2 also shows an ideal point on a line marked with a small arrow, where the hybrids that approach this point are the most superior for the traits tested. According to Figure 2, the G3 hybrid is the most ideal of the others because it is closest to the “ideal center (small arrow)”, while the G20 is the least desirable hybrid because it is farthest from the “ideal center”.
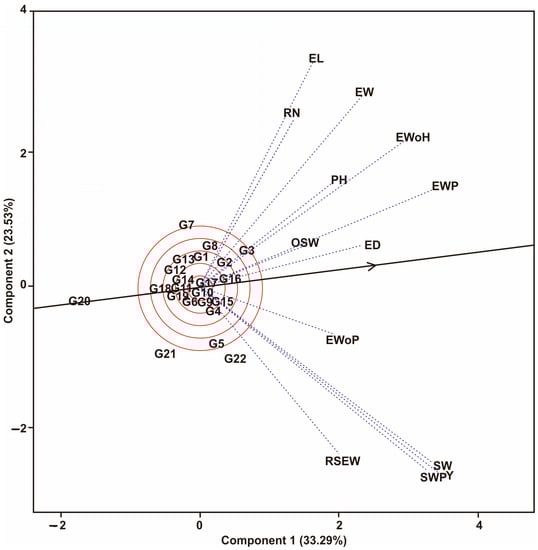
Figure 2.
Relationship between each traits based on GT biplot on the maize hybrid populations into 13 traits. Hybrids code; see Table 1. Traits code; see data collection.
Figure 3 shows the two main axes, namely the horizontal axis (which shows stability) and the vertical axis (which shows the average value), of the traits tested. Maize hybrids that follow the direction of the arrow are the expected hybrids. In addition, hybrids that approach the horizontal line show a level of consistency for all the traits evaluated. On the other hand, hybrids that move away from this line show inconsistency for all the traits evaluated. G16, G2, and G3 were identified as stable for all the traits evaluated and most favored. Meanwhile, G20 was identified as being below the vertical line and farthest from the arrow, so it had the worst score of all the traits evaluated.
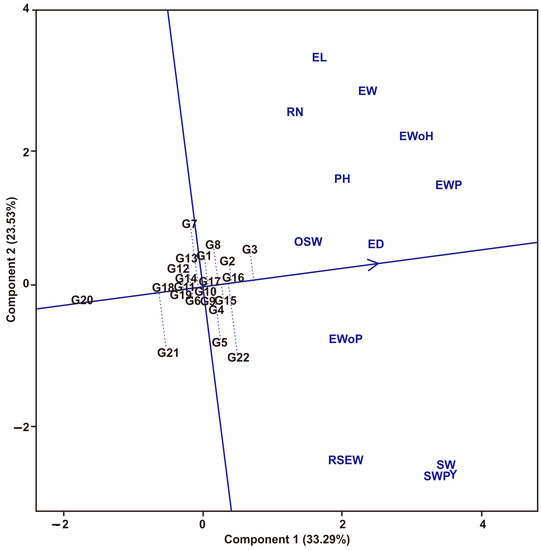
Figure 3.
The stability of maize hybrids against all traits tested using GT biplot. Hybrid code; see Table 1. Traits code; see data collection.
3.2. Genotype-by-Environment Interactions (GEIs) on Maize Hybrid Yields
The effect of genotype, environment, and their interactions (GEIs) shows a very significant influence (p < 0.01) on the yield variation of the maize hybrids (Table 3). The strongest influence was from the environment, namely 85.63%, followed by GEIs with 12.13% (Table 3). The genotype effect has the least influence, namely 2.24%. These results can also be seen from the Heatmap GEIs (Figure 4), where environments are divided into two main groups. The clusters observed in the heatmap are obtained by calculating the Euclidean distance between the environment and the tested genotype. The first environmental group consisted of KRW CS, KRW M, CKD CS, ARJ CS, and LMB CS, while the second environmental group consisted of CKD M, ARJ M, and LMB M. The first group had average yields between 2.56 and 4.19 (t·ha−1), while the second group ranged from 5.74 to 6.23 (t·ha−1). The GEI response pattern illustrated in Figure 4 shows that the genotypes tested varied and spread colors. Indicates a positive interaction with the testing environment. The colors in this order indicate the magnitude of the simulated GEIs; the darker it is, the more positive the interaction will be. G22 shows the most intense color for the LMB M and LMB CS locations. This means that G22 has the highest score in both environments compared to the other genotypes.
Table 3.
Combined ANOVA of maize hybrids in four environments with sole-crop and multiple-crop patterns.
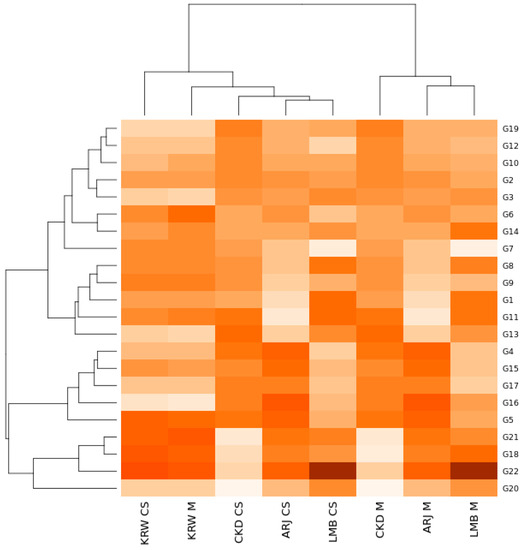
Figure 4.
GEIs heatmap between environments and maize hybrids tested in West Java. Hybrid code; see Table 1. Environment code; see experimental design. The darker it is, the more positive the interaction will be.
3.3. Yield Stability Based on Combined Stability Measurements on Maize Hybrid Populations
Table 4 shows the result of the assessment of yield stability in maize hybrids, which was evaluated based on parametric and non-parametric measurements. The average yields of maize hybrid were in the range of 3.90–4.96 t·ha−1. G5 was identified as having the best performance (highest average yield). In contrast, the G20 shows the lowest performance. Measurements of KR, NP(1), NP(2), and NP(3), show that G2 is the most consistent-yielding (stable) hybrid. Measurements of S(6), NP(4), and KR identified G5 as the most consistent yield. CVi measurement identified the G7 as the most consistent yield. Measurements of S(1), S(2), S(3), Wi2, σi2, S2di, and θi identified G10 as the most consistent hybrid for yield. The regression coefficient (bi) identifies G12 as a hybrid that has a value of bi = 1 and is declared the most stable. The θ(i) measurements identified G18 as the most stable hybrid. The G2 hybrid has the smallest average rank (AR) value and was declared the most consistent yield by all stability measurements, followed by G10, G6, and G5 (Table 5). On the other hand, G18 is the hybrid that has the highest AR value and is declared the most inconsistent hybrid in all test environments, followed by G16, G13, and G1.
Table 4.
Stability analysis of maize hybrid yields using parametric and non-parametric measurements.
Table 5.
Yield stability rank of maize hybrid using parametric and non-parametric measurements.
The grouping of maize hybrids based on stability rank was estimated using Hierarchical Cluster Analysis/HCA (dendrogram). The dendrogram classifies maize hybrids into several groups, namely the stable high yield group consisting of G2 and G5; stable low yield group consisting of G6, G8, G10, G12, and G14; unstable high yield group consisting of G22, G17, G15, G19, G3, G4, and G16; and the unstable low yield group consisting of G1, G13, G20, G9, G7, G21, G11, and G18 (Figure 5). This grouping is based on the stability ranks of all measurements. The stable high yield group is the most expected because it can adapt to various environments with good performance. The unstable high yield group can be used as an environment-specific maize hybrid because it can be adapted to a supportive/ specific environment. The unstable low yield group is the worst because it has low yields and is not adaptable to environmental changes.
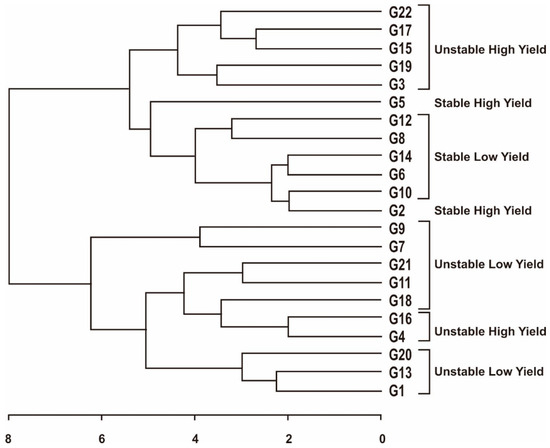
Figure 5.
Classification of maize hybrids based on parametric and non-parametric stability ranks. Hybrid code; see Table 1.
3.4. Yield Stability Based on GGE Biplot on Maize Hybrid Populations
The GGE biplot analysis of maize hybrids for sole-crop, multiple-crop, and combined environments is presented in Figure 6, Figure 7 and Figure 8, respectively. In the sole-crop pattern (Figure 6), the GGE biplot shows a contribution of 82.50% (PC1 = 46.80%; PC2 = 35.70%) of the total variation. The ‘which won where’ pattern shows seven sectors for four environments with different peak hybrids. In the first sector, a mega-environment of KRW M and LMB M was formed, with the peak hybrid being G18; in the second sector, G20 is the peak hybrid; in the third sector, the peak hybrid is G11; The fourth sector contains the CKD M environment, which consists of G10, G12, and G19 hybrids. There are no peak hybrids in this sector; the fifth sector has no environments or hybrids in it; the sixth sector has G16 as a peak hybrid; the seventh sector has no environments or hybrids in it.
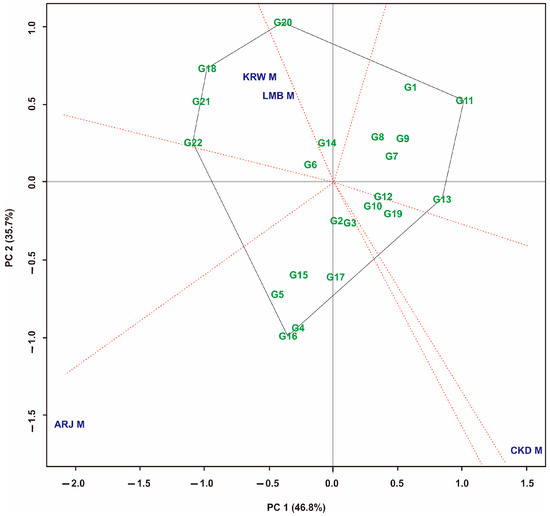
Figure 6.
GGE biplot “which, won, where” pattern of maize hybrid on sole-crop planting system. Hybrid code; see Table 1. Environment code; see experimental design.
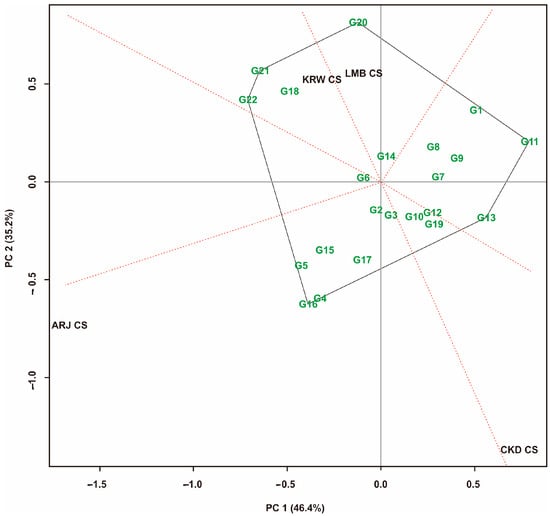
Figure 7.
GGE biplot “which, won, where” pattern of maize hybrid on multiple-cropping system. Hybrid code; see Table 1. Environment code; see experimental design.
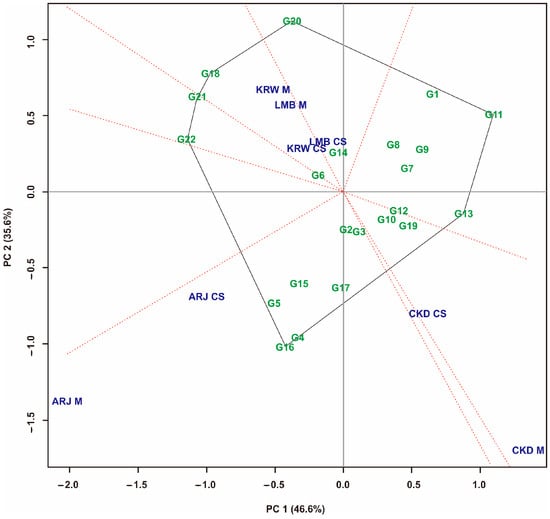
Figure 8.
GGE biplot “which, won, where” pattern of maize hybrid in all cropping systems. Hybrid code; see Table 1. Environment code; see experimental design.
For multiple-crop pattern environments, the GGE biplot shows a contribution of 81.60%, which was produced from PC1 = 46.40% and PC2 = 35.20% (Figure 7). The GGE biplot revealed six sectors, where the first sector consisted of G6 hybrids that tended to be closer to the axis center (0.00). The second sector consists of the KRW CS environment, with G21 as the peak hybrid, followed by G22 and G18. The third sector consists of LMB CS, with G20 hybrid as the peak hybrid. The fourth sector has no environment but has peak hybrids of G11 and G13. The fifth sector consists of the CKD CS environment, including G10, G12, and G19 hybrids within, but no peak hybrids. The sixth sector consists of the ARJ CS environment, with G16 as the peak sector, followed by G4.
For combined data on the multiple-crop and sole-crop environments, the GGE biplot of the eight environments revealed that PC1 and PC2 contributed 82.20% of the total variation in maize hybrid yields (Figure 8). Eight sectors were generated from all evaluated environments, with different vertex hybrids in each sector. The top hybrids in the environmental sector were the G16, G4, G18, and G20. In Figure 8, three mega-environments are formed. The first mega-environment consists of KRW M, LMB M, and KRW CS, with the G18 as a peak hybrid. The second mega-environment consists of ARJ M and ARJ CS, with the G16 and G4 as the peak hybrids. The G20 as a hybrid in a sector containing a LMB CS environment. The third mega-environment consists of CKD M and CKD CS, consists of G10, G12, and G19, but does not have peak hybrids. G11 and G13 were the peak hybrids in the no-environment sector, which indicates that they had low yields in all evaluated environments.
In this study, the selection was directed at stable high yield and unstable high yield maize hybrids. The selected hybrids based on a combination of stability measurements and GGE biplots are presented in Table 6. Table 6 shows that combined stability identifies two stable high-yield hybrids as well as seven unstable high-yield hybrids. The GGE biplot identified five stable high-yield hybrids and four unstable high-yield hybrids. The slice of all measurements shows that G2 is a stable high-yield hybrid, followed by G4 and G16, which are unstable high-yield hybrids.
Table 6.
Maize hybrids were selected based on all stability measurements.
3.5. Yield Stability Based on GGE Biplot on Maize Hybrid Populations
The ‘representative vs. discriminative’ pattern on the GGE biplot shows that ARJ M has strong discriminative and representative properties because it has an obtuse angle for the abscissa and a long vector (Figure 9). In addition, ARJ M also has high representation, so this environment is very suitable for selecting superior maize hybrids. The CKD M environment is the most suitable for selecting adaptive (specific-adapt) hybrids because it has a long environmental vector and a large angle to the abscissa. Meanwhile, LMB CS and KRW CS were the worst environments because they had short vectors and provided little information about the maize hybrids being evaluated, so they were not suitable for use as testing environments.
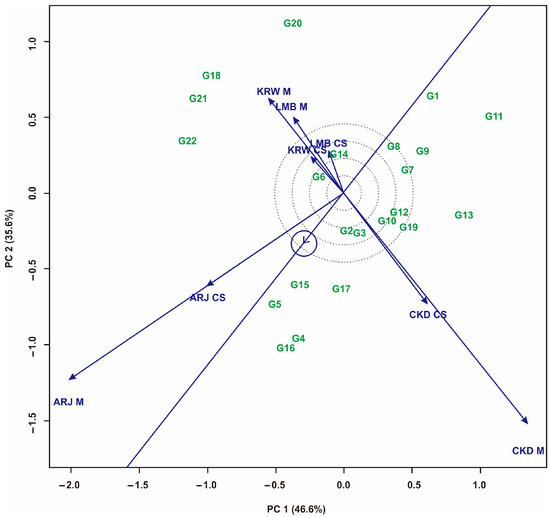
Figure 9.
GGE biplot “Representative and discriminative” pattern to determine the best environment for maize hybrids. Hybrid code; see Table 1. Environment code; see experimental design.
4. Discussion
One of the functions of the GT biplot method is to evaluate maize hybrids that are superior in specific traits. Apart from that, GT biplot can also be used to identify relationships between traits evaluated [49]. This method cannot ascertain how the combined value under various environmental conditions will affect other traits; it can only estimate the relationships between each hybrid and trait tested [50,51]. GT biplot analysis on the maize hybrids tested showed quite strong results because they represented 56.82% of the total variation (Figure 1). Several researchers also reported GT biplot measurements above 50.00%, such as wheat [50] and stevia [49]. This shows that the GT biplot results on the traits tested in maize hybrids in West Java are quite good.
In the population tested, the G3 hybrid has a high value (superior) in sector 1 and correlates with the EW, EWoH, EWP, PH, ED, and OSW traits (Figure 1). The G22 excels in sector 2 and correlates with EWoP, RSEW, Y, SW, and SWP compared to other hybrids in the sector. The maize hybrids that top the sector are superior in the sector and have a close relationship to the traits within them [49,51,52]. Currently, plant breeding programs are not only focused on high yields. Early maturity, disease resistance, and stability in various environments [19,53,54,55], as well as good quality and other agronomic traits [49,50], are the ultimate goals of breeding superior varieties. The GT biplot shows that the yields are significantly and positively correlated with SWP and SW because they are positioned very close together and have very sharp angles (Figure 2). These traits show a fairly strong relationship [51]. Other traits that are interconnected (positively correlated) are EL with RN, EWoH with PH, and EWP with OSW (Figure 2). The relationship between each trait can be used to indirectly select the expected traits. In addition, in Figure 3, the maize hybrids tested are divided by mean value (vertical line) and trait stability (horizontal line). Hybrids that approach the small arrow, are close to the line of stability (horizontal), and have values higher than the average are the expected hybrids (superior) [50]. In this study, G16, G2, and G3 were identified as being close to the small arrow (ideal point) (Figure 3), so they have the highest value of all traits evaluated.
Quantitative traits of crops are significantly influenced by environmental factors, so they are difficult to predict [21,56]. In addition, testing maize hybrids in different agro-ecological conditions is needed to select the representative environment for each hybrid. So, it is necessary to test hybrids in different agro-ecologies and seasons to indicate their adaptability. This study only carried out GEIs and stability tests on crop yields because yield is one of the main characteristics that determine whether a variety is superior.
Significant variation was presented in the combined ANOVA for maize hybrid yields (p < 0.01). The environment has the most significant influence on yield variation, namely 85.63%, followed by GEIs at 12.13% and genotype at 2.24% (Table 3). The emergence of GEIs in multi-environmental testing indicates that there are stable and unstable (adaptive to specific environments) maize hybrids. Similar findings regarding the importance of GEIs have been widely reported, such as in maize [20,33], sweet potatoes [30], rice [57,58], and soybeans [27,59]. The strong environmental influence on the yield variation indicates that external factors (the cropping system and environment) have a more significant influence than genetics. This is because yield is a quantitative trait, and many genes strongly influence that. Statistically, these results indicate that the stability order of the maize hybrids tested was not consistent in all environments. According to several researchers, environmental factors strongly influence crop yields [33,60,61]. The heatmap GEIs (Figure 4) also show the groupings and interaction patterns between the environments and the maize hybrids tested. The heatmap divided environments into two main groups. The first environmental cluster consists of KRW CS, KRW M, CKD CS, ARJ CS, and LMB CS, while the second environmental cluster consists of CKD M, ARJ M, and LMB M. The first cluster is an environmental group with a low average yield (2.56–4.19 t·ha−1), while the second cluster is an environmental group with an average high yield (5.74–6.23 t·ha−1). The GEI response pattern, illustrated in Figure 4, shows that the hybrids tested have varied and dispersed colors. This indicates an interaction with the environment tested. The difference in resulting color indicates the magnitude of the simulated GEIs; the darker the color, the more positive the interaction [62,63]. In this study, G22 showed a darker color at the LMB M and CS locations. This means that G22 has the highest score in both environments compared to the other hybrids. To illustrate the distribution of maize hybrids among GEIs, a stability analysis was performed using various stability measures.
The results of stability measures of maize hybrid yields under various environmental conditions using parametric and non-parametric methods are presented in Table 4. The average yield of maize hybrids is in the range of 3.90–4.96 t·ha−1. The measurement results showed that KR, NP(1), NP(2), and NP(3) indicated that G2 was the most consistent (stable) hybrid. Measurements of KR, S(6), and NP(4) identified G5 as the most consistent (stable). The CVi measurement identified the G7 hybrid as the most consistent (stable). Measurements of S(1), S(2), S(3), Wi2, σi2, S2di, and θi identified G10 as the most consistent (stable) hybrid. The regression coefficient (bi) identifies G12 as a hybrid with a value of bi = 1 and is declared the most stable. The θ(i) measurements identified G18 as the most stable hybrid (Table 5). The measurement results show that G2 has the smallest AR value and is declared the most consistent by all stability measurements [30,61], followed by G10, G6, and G5. In contrast, G18 was the hybrid that had the highest AR value and was declared the most inconsistent hybrid in all environments, followed by G16, G13, and G1.
To classify the maize hybrids tested, we used a Hierarchical Cluster Analysis/HCA (dendrogram) based on the stability rank of each measurement (Figure 5). This has also been reported in several previous studies, such as maize [33], barley [61], and butterfly pea [64]. The dendrogram classifies maize hybrids into several groups, namely unstable low yield, unstable high yield, stable low yield, and stable high yield. This grouping is based on the stability rank of all measurements. The stable high-yield group is the most expected because it can adapt to various environments with the best performance [20]. The unstable high-yield group can be used as an environment-specific genotype because it can adapt to a supportive environment [30]. The unstable low-yield group is the worst because it has low yields and needs to be adaptable to environmental changes.
GGE biplot analysis of maize hybrids was carried out in sole-crop, multiple-crop, and mixed environments. The visualization of the GGE biplot is presented in Figure 6, Figure 7 and Figure 8. Hybrids closer to the axis points were identified as having stable yields [35]. These hybrids had small GEIs [6,10]. Almost all hybrids that are at the top of the sole-crop sector (Figure 6) show the same position in the multiple-crop portion (Figure 7) and also a combination of both patterns (Figure 8). This is because the hybrids tested were the result of selection that had fairly consistent yields at the previous stage. The hybrids at the top of the sector had the highest yields in the environments within that sector [65]. In addition, Figure 8 also generates three mega-environments. The hybrids at the top of the mega-environment sector are the best hybrids. The hybrids at the top of the mega-environment sector are the best hybrids. On the other hand, hybrids at the top of the sector, which have no environment, are the worst. G11 and G13 were the peak hybrids in the no-environment sector, indicating that their yield performance was poor in all environments in this study [33,35,60]. Thus, the hybrids identified at the top of the sector containing the environment are environment-specific hybrids. This study’s selection is directed at stable high-yield and unstable high-yield hybrids. The measurement results show that combined stability identifies two stable high-yield hybrids and seven unstable high-yield hybrids. The GGE biplot identified five stable high-yield hybrids and four unstable high-yield hybrids. The slice of all measurements shows that G2 is a stable high-yield hybrid, and G4 and G16 are unstable high-yield hybrids (Table 6).
The visualization of the GGE biplot pattern of ‘representative vs. discriminative’, presented in Figure 9, shows that ARJ M was identified as the most representative environment. A representative environment was indicated by a long vector and the resulting angle to the abscissa [10]. In addition, ARJ M also has high representation, so this environment is very suitable for selecting superior maize hybrids. The CKD M has a large angle to the abscissa and a long vector, making it suitable for selecting adaptive hybrids [20]. LMB CS and KRW CS are the worst environments because they have short vectors. These conditions indicate that they are not suitable for use as test environments, as they provide biased information about the hybrids being evaluated [35,66,67]. The results shown by this pattern indicate that multiple-cropping selection should be carried out in different seasons and agro-ecologies. Thus, to obtain an ideal intercropping pattern, it is necessary to consider the environment and planting season.
5. Conclusions
This study reveals that the resulting maize hybrid can be useful as a substitute for currently used commercial hybrids. The genotype by traits (GT) biplot showed that the G3 maize hybrid was superior to EW, EWoH, EWP, PH, ED, and OSW traits. The G22 maize hybrid was superior to EWoP, RSEW, Y, SW, and SWP properties. A combined ANOVA showed that genotype (G), environment (E), and their interactions (GEIs) had a significant effect on yield (p < 0.01) with contributions of 2.24%, 85.63%, and 12.13%, respectively. The measurement results show that combined stability identifies two stable high-yield hybrids and seven unstable high-yield hybrids. The GGE biplot identified five stable high-yield hybrids and four unstable high-yield hybrids. The slice of all measurements shows that G2 is a stable high-yield hybrid, and G4 and G16 are unstable high-yield hybrids. Arjasari sole-cropping (ARJ M) was identified as the most suitable environment for selecting ideal maize hybrids. In contrast, Cikande sole-cropping (CKD M) was identified as the most suitable environment for selecting superior hybrids in specific environments. Stable high-yield hybrids can be recommended as new varieties with wide adaptation, while unstable high-yield hybrids can be recommended as varieties adapted to specific environments. The introgression of new germplasm into commercial hybrids is, for sure, an excellent opportunity for Indonesian maize production.
Author Contributions
Conceptualization, D.R. and H.M.; methodology, D.R.; software, H.M. and Y.M.; validation, D.R., A.K. and H.M.; formal analysis, H.M., Y.M. and A.I.; investigation, H.M., M.R.F., M.A.A. and Y.M.; resources, D.R. and Y.Y.; data curation, H.M., A.I. and Y.M.; writing—original draft preparation, D.R., H.M. and Y.M.; writing—review and editing, A.K., A.I., M., M.R.F., M.A.A. and Y.Y.; visualization, H.M. and Y.M.; supervision, D.R.; project administration, D.R. and Y.Y.; funding acquisition, D.R. All authors have read and agreed to the published version of the manuscript.
Funding
This research was funded by Universitas Padjadjaran (UNPAD), a multiyear scheme of the Competency Research Grant, Academic Leadership Grant, Post-doctoral Research Grant to Dedi Ruswandi, and the APC was funded by Universitas Padjadjaran (UNPAD).
Institutional Review Board Statement
Not applicable.
Informed Consent Statement
Not applicable.
Data Availability Statement
The data used to support the findings of this study are included within the article.
Acknowledgments
Great appreciation is given to the field assistance team from UNPAD during the multi-location yield trials.
Conflicts of Interest
The authors declare no conflict of interest. The funders had no role in the design of the study, the collection, analysis, or interpretation of data, the writing of the manuscript, or the decision to publish the results.
References
- Troyer, A.F.; Wellin, E.J. Heterosis decreasing in hybrids: Yield test inbreds. Crop Sci. 2009, 49, 1969–1976. [Google Scholar] [CrossRef]
- Shiferaw, B.; Prasanna, B.M.; Hellin, J.; Bänziger, M. Crops that feed the world 6. Past successes and future challenges to the role played by maize in global food security. Food Secur. 2011, 3, 307–327. [Google Scholar] [CrossRef]
- Bari, M.A.A.; Carena, M.J.; Messias, G. Identification of heterotic patterns between expired proprietary, NDSU, and industry short- season maize inbred lines. Crop Breed. Appl. Biotechnol. 2016, 16, 274–281. [Google Scholar] [CrossRef][Green Version]
- Murdia, L.K.; Wadhwani, R.; Wadhawan, N.; Bajpai, P.; Shekhawat, S. Maize utilization in India: An overview. Am. J. Food Nutr. 2016, 4, 169–176. [Google Scholar] [CrossRef]
- Ray, D.K.; Mueller, N.D.; West, P.C.; Foley, J.A. Yield trends are insufficient to double global crop production by 2050. PLoS ONE 2013, 8, e66428. [Google Scholar] [CrossRef]
- Mushayi, M.; Shimelis, H.; Derera, J.; Shayanowako, A.I.T. Multi-environmental evaluation of maize hybrids developed from tropical and temperate lines. Euphytica 2020, 216, 84. [Google Scholar] [CrossRef]
- Cairns, J.E.; Hellin, J.; Sonder, K.; Araus, J.L.; MacRobert, J.F.; Thierfelder, C.; Prasanna, B.M. Adapting maize production to climate change in sub-Saharan Africa. Food Secur. 2013, 5, 345–360. [Google Scholar] [CrossRef]
- Setimela, P.S.; Magorokosho, C.; Lunduka, R.; Gasura, E.; Makumbi, D.; Tarekegne, A.; Cairns, J.E.; Ndhlela, T.; Erenstein, O.; Mwangi, W. On-farm yield gains with stress-tolerant maize in eastern and Southern Africa. Agron. J. 2017, 109, 406–417. [Google Scholar] [CrossRef]
- Grote, U.; Fasse, A.; Nguyen, T.T.; Erenstein, O. Food security and the dynamics of wheat and maize value chains in Africa and Asia. Front. Sustain. Food Syst. 2021, 4, 1–17. [Google Scholar] [CrossRef]
- Maulana, H.; Maxiselly, Y.; Yuwariah, Y.; Dedi, R. Heritability and selection using GGE biplots and the Sustainability Index (SI) of maize mutants under different cropping systems in upland. Sustainability 2023, 15, 6824. [Google Scholar] [CrossRef]
- Nyoni, R.S.; Magorokosho, C.; Kamutando, C.N. Potential of temperate, tropical, and sub-tropical exotic maize germplasm for increased gains in yield performance in sub-tropical breeding programs. Agronomy 2023, 13, 1605. [Google Scholar] [CrossRef]
- Fan, X.M.; Yin, X.F.; Zhang, Y.D.; Bi, Y.Q.; Liu, L.; Chen, H.M.; Kang, M.S. Combining ability estimation for grain yield of maize exotic germplasm using testers from three heterotic groups. Crop Sci. 2016, 56, 2527–2535. [Google Scholar] [CrossRef]
- Habiba, R.M.M.; El-Diasty, M.Z.; Aly, R.S.H. Combining abilities and genetic parameters for grain yield and some agronomic traits in maize (Zea mays L.). Beni-Suef Univ. J. Basic Appl. Sci. 2022, 11, 108. [Google Scholar] [CrossRef]
- Ruswandi, D.; Syafii, M.; Maulana, H.; Ariyanti, M.; Indriani, N.P.; Yuwariah, Y. GGE biplot analysis for stability and adaptability of maize hybrids in Western Region of Indonesia. Int. J. Agron. 2021, 2021, 2166022. [Google Scholar] [CrossRef]
- Elisha, I.; Lawrence, E.U.; Idoma, K. Adaptation to Climate Change through Multiple Cropping Systems in Sokoto Adaptation to Climate Change through Multiple Cropping Systems in Sokoto State. Savanna 2018, 24, 314–322. [Google Scholar] [CrossRef]
- Abbass, K.; Qasim, M.Z.; Song, H.; Murshed, M.; Mahmood, H.; Younis, I. A review of the global climate change impacts, adaptation, and sustainable mitigation measures. Environ. Sci. Pollut. Res. 2022, 29, 42539–42559. [Google Scholar] [CrossRef] [PubMed]
- Burgess, A.J.; Cano, M.E.C.; Parkes, B. The deployment of intercropping and agroforestry as adaptation to climate change. Crop Environ. 2022, 1, 145–160. [Google Scholar] [CrossRef]
- Liu, L.; Xu, X.; Zhuang, D.; Chen, X.; Li, S. Changes in the Potential Multiple Cropping System in Response to Climate Change in China from 1960–2010. PLoS ONE 2013, 8, e80990. [Google Scholar] [CrossRef]
- Wolde, L.; Keno, T.; Tadesse, B.; Bogale, G.; T/Wold, A.; Abebe, B. Mega-environment targeting of maize varieties using AMMI and GGE bi-plot analysis in Ethiopia. Ethiop. J. Agric. Sci. 2018, 28, 65–84. [Google Scholar]
- Pramitha, J.L.; Joel, J.; Rajasekaran, R.; Uma, D.; Vinothana, K.; Balakrishnan, M.; Sathyasheela, K.R.V.; Muthurajan, R.; Hossain, F. Stability Analysis and Heterotic Studies in Maize (Zea mays L.) Inbreds to Develop Hybrids With Low Phytic Acid and High-Quality Protein. Front. Plant Sci. 2022, 12, 781469. [Google Scholar] [CrossRef]
- Andrade, M.I.; Naico, A.; Ricardo, J.; Eyzaguirre, R.; Makunde, G.S.; Ortiz, R.; Gruneberg, W.J. Genotype x environment interaction and selection for drought adaptation in sweetpotato (Ipomoea batatas [L.] Lam.) in Mozambique. Euphytica 2016, 209, 261–280. [Google Scholar] [CrossRef]
- Kiliç, H.; Akçura, M.; Aktaş, H. Assessment of parametric and non-parametric methods for selecting stable and adapted durum wheat genotypes in multi-environments. Not. Bot. Horti Agrobot. Cluj-Napoca 2010, 38, 271–279. [Google Scholar] [CrossRef]
- Gauch, H.G. A Simple Protocol for AMMI Analysis of Yield Trials. Crop Sci. 2013, 53, 1860–1869. [Google Scholar] [CrossRef]
- Yan, W. Biplot analysis of incomplete two-way data. Crop Sci. 2013, 53, 48–57. [Google Scholar] [CrossRef]
- Yan, W.; Tinker, N.A. Biplot analysis of multi-environment trial data: Principles and applications. Can. J. Plant Sci. 2006, 86, 623–645. [Google Scholar] [CrossRef]
- Goksoy, A.T.; Sincik, M.; Erdogmus, M.; Ergin, M.; Aytac, S.; Gumuscu, G.; Gunduz, O.; Keles, R.; Bayram, G.; Senyingit, E. The parametric and non-parametric stability analyses for interpreting genotype by environment interaction of some soybean genotypes. Turkish J. F. Crop. 2019, 24, 28–38. [Google Scholar] [CrossRef]
- Cubukcu, P.; Kocaturk, M.; Ilker, E.; Kadiroglu, A.; Vurarak, Y.; Sahin, Y.; Karakus, M.; Yildirim, U.A.; Goksoy, A.T.; Sincik, M. Stability analysis of some soybean genotypes using parametric and non parametric methods in multi-environments. Turkish J. F. Crop 2021, 26, 262–271. [Google Scholar] [CrossRef]
- Abate, F.; Mekbib, F.; Dessalegn, Y. Association of Different Parametric and Non parametric Stability Models in Durum Wheat (Triticum turgidum Desf.) Genotypes. Int. J. Plant Soil Sci. 2015, 7, 192–201. [Google Scholar] [CrossRef] [PubMed]
- Akçura, M.; Kaya, Y.; Taner, S. Evaluation of durum wheat genotypes using parametric and nonparametric stability statistics. Turkish J. F. Crop. 2009, 14, 111–122. [Google Scholar]
- Maulana, H.; Nafi’ah, H.H.; Solihin, E.; Ruswandi, D.; Arifin, M.; Amien, S.; Karuniawan, A. Combined stability analysis to select stable and high yielding sweet potato genotypes in multi-environmental trials in West Java, Indonesia. Agric. Nat. Resour. 2022, 56, 761–772. [Google Scholar] [CrossRef]
- Khan, M.M.H.; Rafi, M.; Ramlee, S.I.; Jusoh, M.; Mamun, M.A. AMMI and GGE biplot analysis for yield performance and stability assessment of selected Bambara groundnut (Vigna subterranea L. Verdc.) genotypes under the multi-environmental trials (METs). Sci. Rep. 2021, 11, 22791. [Google Scholar] [CrossRef]
- Kebede, G.; Worku, W.; Jifar, H.; Feyissa, F. Grain yield stability analysis using parametric and nonparametricstatistics in oat (Avena sativa L.) genotypes in Ethiopia. Grass. Res. 2023, 2023, 1–15. [Google Scholar] [CrossRef]
- Wicaksana, N.; Maulana, H.; Yuwariah, Y.; Ismail, A.; Ruswandi, Y.A.R.; Ruswandi, D. Selection of high yield and stable maize hybrids in mega-environments of Java island, Indonesia. Agronomy 2022, 12, 2923. [Google Scholar] [CrossRef]
- Scavo, A.; Mauromicale, G.; Ierna, A. Dissecting the genotype × environment interaction for potato tuber yield and components. Agronomy 2023, 13, 101. [Google Scholar] [CrossRef]
- Yan, W.; Mitchell-Fetch, J.; Beattie, A.; Nilsen, K.T.; Pageau, D.; DeHaan, B.; Hayes, M.; Mountain, N.; Cummiskey, A.; MacEachern, D. Oat mega-environments in Canada. Crop Sci. 2021, 61, 1141–1153. [Google Scholar] [CrossRef]
- Dehghani, M.R.; Majidi, M.M.; Saeidi, G.; Mirlohi, A.; Amiri, R.; Sorkhilalehloo, B. Application of GGE biplot to analyse stability of Iranian tall fescue (Lolium arundinaceum) genotypes. Crop Pasture Sci. 2015, 66, 963–972. [Google Scholar] [CrossRef]
- Yan, W.; Rajcan, I. Biplot analysis of test sites and trait relations of soybean in Ontario. Crop Sci. 2002, 42, 11–20. [Google Scholar] [CrossRef]
- Eberhart, S.A.; Russell, W.A. Stability parameters for comparing varieties. Crop Sci. 1966, 6, 36–40. [Google Scholar] [CrossRef]
- Plaisted, R.L.; Peterson, L.C. A technique for evaluating the ability of selection to yield consistently in different locations or seasons. Am. Potato J. 1959, 36, 381–385. [Google Scholar] [CrossRef]
- Plaisted, R.L. A shorter method for evaluating the ability of selections to yield consistently over locations. Am. Potato J. 1960, 37, 166–172. [Google Scholar] [CrossRef]
- Wricke, G. Übereine Methode zur Erfassung der ökologischen Streubreite in Feldversuchen. Z. Für Pflanz. 1962, 47, 92–96. [Google Scholar]
- Shukla, G.K. Some statistical aspects of partitioning genotype-environmental components of variability. Heredity 1972, 29, 237–245. [Google Scholar] [CrossRef] [PubMed]
- Francis, T.R.; Kannenberg, L.W. Yield stability studies in short-season maize: I. A descriptive method for grouping genotypes. Can. J. Plant Sci. 1978, 5, 1029–1034. [Google Scholar] [CrossRef]
- Nassar, R.; Huhn, M. Studies on Estimation of Phenotypic Stability: Tests of Significance for Nonparametric Measures of Phenotypic Stability. Biometrics 1987, 43, 45–53. [Google Scholar] [CrossRef]
- Huehn, M. Nonparametric measures of phenotypic stability. Part 1: Theory. Euphytica 1990, 47, 189–194. [Google Scholar] [CrossRef]
- Thennarasu, K. On Certain Non-Parametric Procedures for Studying Genotype-Environment Interactions and Yield Stability. Ph.D. Thesis, PJ School, IARI, New Delhi, India, 1995. [Google Scholar]
- Kang, M.S. A rank-sum method for selecting high-yielding, stable corn genotypes. Cereal Res. Commun. 1988, 16, 113–115. [Google Scholar]
- Pour-aboughadareh, A.; Yousefian, M.; Moradkhani, H.; Poczai, P.; Siddique, K.H.M. STABILITYSOFT: A new online program to calculate parametric and non-parametric stability statistics for crop traits. Apllications Plant Sci. 2019, 7, 1–6. [Google Scholar] [CrossRef]
- Amien, S.; Maulana, H.; Ruswandi, D.; Nurjanah, S. Genetic gain and relationship of yield and yield attributes of mutant and cross-bred stevia (Stevia rebaudiana) genotypes. Biodiversitas 2021, 22, 3119–3126. [Google Scholar] [CrossRef]
- Kendal, E. Comparing durum wheat cultivars by genotype × yield × trait and genotype × trait biplot method. Chil. J. Agric. Res. 2019, 79, 512–522. [Google Scholar] [CrossRef]
- Yan, W.; Frégeau-reid, J. Genotype by yield*trait (GYT) biplot: A novel approach for genotype selection based on multiple traits. Sci. Rep. 2018, 8, 8242. [Google Scholar] [CrossRef]
- Mohammadi, R. Genotype by yield*trait biplot for genotype evaluation and trait profiles in durum wheat. Cereal Res. Commun. 2019, 47, 541–551. [Google Scholar] [CrossRef]
- Van Esse, H.P.; Reuber, T.L.; van der Does, D. Genetic modification to improve disease resistance in crops. New Phytol. 2020, 225, 70–86. [Google Scholar] [CrossRef]
- Oyekunle, M.; Haruna, A.; Badu-Apraku, B.; Usman, I.S.; Mani, H.; Ado, S.G.; Olaoye, G.; Obeng-Antwi, K.; Abdulmalik, R.O.; Ahmed, H.O. Assessment of early-maturing maize hybrids and testing sites using GGE biplot analysis. Crop Sci. 2017, 57, 2942–2950. [Google Scholar] [CrossRef]
- Badu-Apraku, B.; Bankole, F.A.; Ajayo, B.S.; Fakorede, M.A.B.; Akinwale, R.O.; Talabi, A.O.; Bandyopadhyay, R.; Ortega-Beltran, A. Identification of early and extra-early maturing tropical maize inbred lines resistant to Exserohilum turcicum in sub-Saharan Africa. Crop Prot. 2021, 139, 105386. [Google Scholar] [CrossRef] [PubMed]
- Eze, C.E.; Akinwale, R.O.; Michel, S.; Burstmayr, H. Grain yield and stability of tropical maize hybrids developed from elite cultivars in contrasting environments under a rainforest agroecology. Euphytica 2020, 216, 89. [Google Scholar] [CrossRef]
- Oladosu, Y.; Rafii, M.Y.; Abdullah, N.; Magaji, U.; Miah, G.; Hussin, G.; Ramli, A. Genotype × environment interaction and stability analyses of yield and yield components of established and mutant rice genotypes tested in multiple locations in Malaysia. Acta Agric. Scand. Sect. B Soil Plant Sci. 2017, 67, 590–606. [Google Scholar] [CrossRef]
- Ikmal, A.M.; Noraziyah, A.A.S.; Ellina, Z.P.D.; Riana, T.A.T.N.A.; Amira, I.; Wickneswari, R.; Aisyah, Z.S. Genotype-by-environment interaction and stability snalysis of qDTYs pyramided rice (Oryza sativa) lines under water-Limited environments. Int. J. Agric. Biol. 2020, 24, 1835–1844. [Google Scholar] [CrossRef]
- Habtegebriel, M.H. Adaptability and stability for soybean yield by AMMI and GGE models in Ethiopia. Front. Plant Sci. 2022, 13, 950992. [Google Scholar] [CrossRef] [PubMed]
- Zdziarski, A.D.; Woyann, L.G.; Milioli, A.S.; Zanella, R.; Dallacorte, L.V.; Panho, M.C.; Benin, G. Mega-environment identification for soybean (Glycine max) breeding and production in Brazilian Midwest region. Plant Breed. 2019, 138, 336–347. [Google Scholar] [CrossRef]
- Vaezi, B.; Pour-Aboughadareh, A.; Mohammadi, R.; Mehraban, A.; Pour-Hossein, T.; Koohkan, E.; Gasemi, S.; Moradkhani, H.; Siddique, K.H.M. Integrating different stability models to investigate genotype x environment interactions and identify stable and high-yielding barley genotypes. Euphytica 2019, 215, 63. [Google Scholar] [CrossRef]
- Romão, R.F.; Nuvunga, J.J.; Silva, C.P.; Oliveira, L.A.; Mendes, C.T.E.; Balestre, M. Predictive ability of AMMI and factorial analytical models in the study of unbalanced multi-environment data. Genet. Mol. Res. 2019, 18, GMR18176. [Google Scholar] [CrossRef]
- Pham, H.; Reisner, J.; Swift, A.; Olafsson, S.; Vardeman, S. Crop phenotype prediction using biclustering to explain genotype-by-environment interactions. Front. Plant Sci. 2022, 13, 1014. [Google Scholar] [CrossRef] [PubMed]
- Dehghani, M.R.; Majidi, M.M.; Mirlohi, A.; Saeidi, G. Integrating parametric and non-parametric measures to investigate genotype 3 environment interactions in tall fescue. Euphytica 2016, 208, 583–596. [Google Scholar] [CrossRef]
- Rad, M.R.N.; Kadir, M.A.; Rafii, M.Y.; Jaafar, H.Z.E.; Naghavi, M.R.; Ahmadi, F. Genotype × environment interaction by AMMI and GGE biplot analysis in three consecutive generations of wheat (Triticum aestivum) under normal and drought stress conditions. Aust. J. Crop Sci. 2013, 7, 956–961. [Google Scholar]
- Tabu, H.I.; Tshiabukole, J.P.K.; Kankolongo, A.M.; Lubobo, A.K.; Kimuni, L.N. Yield stability and agronomic performances of provitamin A maize (Zea mays L.) genotypes in South-East of DR Congo. Open Agric. 2023, 8, 1–12. [Google Scholar] [CrossRef]
- Pobkhunthod, N.; Authapun, J.; Chotchutima, S.; Rungmekarat, S.; Kittipadakul, P.; Duangpatra, J.; Chaisan, T. Multilocation yield trials and yield stability evaluation by GGE biplot analysis of promising large-seeded peanut lines. Front. Genet. 2022, 13, 876763. [Google Scholar] [CrossRef]
Disclaimer/Publisher’s Note: The statements, opinions and data contained in all publications are solely those of the individual author(s) and contributor(s) and not of MDPI and/or the editor(s). MDPI and/or the editor(s) disclaim responsibility for any injury to people or property resulting from any ideas, methods, instructions or products referred to in the content. |
© 2023 by the authors. Licensee MDPI, Basel, Switzerland. This article is an open access article distributed under the terms and conditions of the Creative Commons Attribution (CC BY) license (https://creativecommons.org/licenses/by/4.0/).