Article

Impact of Phosphogypsum Application on Fungal Community Structure and Soil Health in Saline–Alkali-Affected Paddy Fields

1
State Key Laboratory of Black Soils Conservation and Utilization, Northeast Institute of Geography and Agroecology, Chinese Academy of Sciences, Changchun 130102, China
2
College of Life Science, Baicheng Normal University, Baicheng 137000, China
3
University of Chinese Academy of Sciences, Beijing 100049, China
4
Jilin Da’an Agro-Ecosystem National Observation Research Station, Changchun Jingyuetan Remote Sensing Experiment Station, Da’an 131317, China
*
Authors to whom correspondence should be addressed.
These authors contributed equally to this work.
Agronomy 2023, 13(11), 2726; https://doi.org/10.3390/agronomy13112726
Submission received: 26 September 2023 / Revised: 22 October 2023 / Accepted: 27 October 2023 / Published: 29 October 2023
(This article belongs to the Special Issue Saline Water Irrigation in Agriculture)

Abstract

:
Modifying saline–alkali soil is crucial for ensuring food security and expanding arable land. Microorganisms play a key role in driving various biochemical processes in agricultural ecosystems. However, limited information exists on the changes in the microbial community and soil structure in soda saline-alkali soil under modified conditions. In this study, we examined the changes in soil physicochemical properties of saline–alkali soil altered by rice planting alone and by combined application of phosphogypsum in the Songnen Plain. The results demonstrated that phosphogypsum significantly improved the soil’s physicochemical properties; it notably reduced salinity and alkalinity while enhancing nutrient structure. Additionally, the utilization efficiency of carbon (C), nitrogen (N), and phosphorus (P) increased. Fungal community diversity also significantly improved, influenced mainly by soil water content (SWC), total organic carbon (TOC), soil organic matter (SOM), total nitrogen (TN) and sodium ion (Na+). TOC, SOM, TN, ESP, and Na+ served as the primary drivers affecting the fungal community. Our findings indicate that combining rice planting with phosphogypsum application effectively modifies saline–alkali soil, regulates fungal community structure, and enhances long-term soil health. Furthermore, the beneficial effects of phosphogypsum on saline–alkali soil persist for persists for several years, largely owing to its role in promoting microbial community growth.

1. Introduction

The world population is projected to increase by 65% (3.7 billion) by 2050. This population growth, coupled with rising per capita income, will lead to increased food demand and exert pressure to expand agricultural land [1]. However, climate and environmental changes, along with a decrease in cultivated land area [2], underscore the urgent need to improve the utilization of saline–alkali soil to supplement the shortage of cultivable land. Globally, saline–alkali soil comprises approximately 9.54 × 10⁸ ha, with China alone possessing 9.91 × 10⁷ ha [3,4,5].
In the Songnen Plain of Northeast China, extensive areas of saline–alkali soil have formed due to the unique geographical and climatic conditions. The primary inhibiting factors inhibiting growth in this region include Na2CO3 and NaHCO3 content [6]. Modification methods for addressing this issue encompass physical, chemical, biological, and engineering modifications. Extensive scientific research and practical experience have demonstrated that the cultivation of rice and the application of chemical modifiers represent one of the most effective approaches to modifying soda-alkali–saline soil and increasing food production. The production of phosphogypsum, a byproduct of phosphate production, yields calcium sulfate (CaSO4·2H2O) as its primary component. This material is widely used as a soil conditioner. Previous studies have revealed that the application of Ca2+ from gypsum at high rates can displace Na+ in soil colloids, resulting in the formation of neutral sodium sulfate [7,8]. This process involves relocating Na+ below the root zone through leaching and promoting the formation of a robust calcium colloid [7,8], which enhances soil aggregate structure. Moreover, this application leads to significant reductions in soil electrical conductivity (EC), alkalinity (ESP), pH, sodium adsorption (SAR), and CH4 emissions [9,10,11].
In a study investigating the effects of phosphogypsum application on rice yield in soda-saline–alkaline soil [12], the grain yield, spike number, and seed setting rate of various rice varieties significantly increased with higher phosphogypsum application rates [12]. However, the alterations in soil structure and properties caused by phosphogypsum in saline–alkali soil are likely to affect soil microorganisms. Nevertheless, studies on the impact of phosphogypsum application on microbial communities in soda saline–alkali soil remain limited.
Soil microorganisms represent vital components of soil ecosystems, serving as essential indicators for evaluating soil quality and fertility [13]. Within agroecosystems, soil microorganisms play pivotal roles in soil formation and development, water dynamics, nutrient cycling, and crop growth, thereby contributing to sustainable soil productivity [14,15,16]. Soil fungi are not only an important component of soil microbes, but also a key indicator of ecosystem health. Most fungi rely on vegetation for their C supply and, in return, assist their host plants by facilitating the extraction of water and minerals from the soil [17]. Previous studies have demonstrated that root systems significantly influence and regulate the establishment and maintenance of soil–fungus–plant interactions [18]. Plant root exudates, comprising C substrates and secondary metabolites, play vital roles in mediating specific associations between plants and individual soil microbes [19]. The spatial and temporal distribution of specific sugars, amino acids, and organic acids around roots facilitates the formation and dynamics of fungal populations [20]. Root secretion compounds also recruit different fungi by acting as signaling molecules, attractants, stimulants, and inhibitors or repellents [20]. Fungi shape soil fungal communities by modifying the physical and chemical properties of the surrounding soil using root-derived substrates and root activities [21]. Fungi fulfill various functions in soil, including the decomposition of plant residues, the promotion of plant growth [22], and the mitigation of nutrient deficiencies [23,24]. Multiple studies have shown that agricultural practices can alter fungal communities [25]. Sparling’s research indicates that soil microbial biomass rapidly declines after initial soil development and use but stabilizes after a certain number of years of agricultural cultivation [26]. Several years later, the microbial community reaches a relatively stable state [27]. Changes in community structure alter fungal dominance, rearrange the competition among fungi, and drive the ecological assembly process of fungal community networks [28]. The pattern of symbiosis among fungi determines whether their interaction will change under the influence of external environmental factors, which will affect the stability and productivity of the ecosystem to a large extent [29,30,31,32]. However, the effects of chemical modification on the saline–alkali soil fungal community in is unclear.
In contrast to extensive research into the mechanisms of saline–alkali soil disorder in saline–alkali soil, investigations into soil microorganisms, especially the responses of soil fungal communities to environmental changes, are still limited. This study focused on elucidating the fungal mechanisms underlying saline–alkali soil improvement. The study aims to (1) explore the physicochemical properties of phosphogypsum-modified saline-alkali soil, (2) characterize soil fungal community diversity, and (3) establish relationships between specific fungal groups, soil salinity, and nutrient levels under phosphogypsum influence.

2. Materials and Methods

2.1. Study Sites and Environmental Conditions

The study was conducted in the Da’an Sodic Land Ecological Experimental Station in Jilin Province (45°58′ N, 123°88′ E, at an elevation of 128.5 m). The test area falls within a temperate semihumid and semiarid monsoon region, characterized by a typical temperate continental climate. The annual average temperature is 4.7 °C. Annual evaporation rates range from 1250 to 1650 mm, while annual precipitation varies between 370 and 400 mm, with 88% of the precipitation occurring between May and September. The area receives approximately 3014 h of sunshine annually, and the annual average effective accumulated temperature (>10 °C) is 2935 °C.

2.2. Soil Sampling and Physicochemical Properties Analysis

In November 2021, soil samples were collected from four treatment groups in the planting area: unimproved phosphogypsum (CK), and phosphogypsum improved for four (P4), five (P5), and six (P6) years. These samples were taken from the 0–15 cm soil layer. The phosphogypsum used contained 4.80% Ca and 0.13% P. All treatment groups were managed identically. Four plots were chosen for each treatment, separated by ridges. Each plot was sampled using a five-point method. After thorough mixing, the sample was divided into three portions. One part was air-dried for physical and chemical property testing, another was stored at −4 °C for enzyme activity testing, and the last was immediately placed in dry ice and transferred to −80 °C for microbial sequencing.
Soil electrical conductivity (EC) and pH values were measured using the supernatant from a 1:5 (soil:water) solution (W/V) with a conductivity meter (DDS-307A, Shanghai Leici, Shanghai, China) and a pH meter (PHS-3E, Shanghai Leici, Shanghai, China). Soil water content (SWC) was determined using the drying method. Total organic carbon (TOC) was assessed by a TOC analyzer (TOC-LCPH, Shimadu, Kyoto, Japan) using a 1:4 (soil:water) solution (W/V). Soil organic matter (SOM) content was calculated using the empirical formula (SOM = TOC × 1.724). Nitrate (NO3-N) and ammonium (NH4-N) were extracted with 2 M potassium chloride, and available phosphorus (AP) was extracted with 0.5 M sodium bicarbonate; these were measured using a continuous flow analyzer (SKALAR, Breda, The Netherlands). Total phosphorus (TP) was also assessed using the continuous flow analyzer after soil sample digestion. Total potassium (TK) was extracted by the acid dissolution method, and available potassium (AK) was extracted by 1 M ammonium acetate; these were measured by an inductively coupled plasma emission spectrometer (Shimadu, Kyoto, Japan). Total nitrogen (TN) and total carbon (TC) were determined using an elemental analyzer (Elemental Vario MACRO, Frankfurt, Germany). The exchangeable sodium ion (ENA) in the soil was measured using the ammonium acetate–ammonium hydroxide exchange method, while soil cation exchange capacity (CEC) was determined by the ammonium chloride–acetic acid exchange method. Soil alkalinity (ESP) was calculated using the formula [ESP = (ENA/CEC) × 100%].

2.3. Microbial Diversity Analysis

Per the manufacturer’s instructions, total genomic DNA samples were extracted using the OMEGA Soil DNA Kit (M5635-02) (OMEGA Bio-Tek, Norcross, GA, USA) and stored at −20 °C prior to further analysis. The quantity and quality of the extracted DNAs were assessed using a NanoDrop NC2000 spectrophotometer (Thermo Fisher Scientific, Waltham, MA, USA) and agarose gel electrophoresis, respectively.
The ITS gene was amplified using specific primers ITS5 and ITS2 (F: GGAAGTAAAAGTCGTAACAAGG; R: GCTGCGTTCTTCATCGATGC). Sample-specific 7-bp barcodes were incorporated into the primers for multiplex sequencing. The PCR mix contained 5 μL of 5× buffer, 0.25 μL of Fast pfu DNA polymerase (5 U/μL), 2 μL (2.5 mM) of dNTPs, 1 μL (10 uM) of each forward and reverse primer, 1 μL of DNA Template, and 14.75 μL of ddH2O. Thermal cycling started with an initial denaturation at 98 °C for 5 min, followed by 25 cycles of denaturation at 98 °C for 30 s, annealing at 53 °C for 30 s, and extension at 72 °C for 45 s, concluding with a final extension of 5 min at 72 °C. PCR amplicons were purified using Vazyme VAHTSTM DNA Clean Beads (Vazyme, Nanjing, China) and quantified with the Quant-iT PicoGreen dsDNA Assay Kit (Invitrogen, Carlsbad, CA, USA). After individual quantification, amplicons were pooled in equal amounts and pair-end 2 × 250 bp sequenced on an Illumina MiSeq platform using the MiSeq Reagent Kit v3 (Illumina, Sa Diego, CA, USA) at Shanghai Personal Biotechnology Co., Ltd. (Shanghai, China).
Microbiome bioinformatics was conducted using QIIME2 2019.4 [33], with minor adjustments according to the official tutorials (https://docs.qiime2.org/2019.4/tutorials/, accessed on 28 September 2022). In brief, raw sequence data were demultiplexed using the demux plugin and then primers were removed using the cutadapt plugin [34]. Sequences were subsequently quality-filtered, denoized, merged, and subjected to chimera removal using the DADA2 plugin [35,36]. Microbial internal transcribed spacer amplicon sequences were clustered using the “dada2” algorithm to obtain nonmonad amplicon sequence variation (ASV). ASVs were aligned with mafft [37] and used to construct a phylogeny with fasttree2 [38]. Taxonomy was assigned to ASVs via the classify-sklearn naïve Bayes taxonomy classifier in the feature-classifier plugin [38] against the UNITE Release 8.0 Database [39]. Alpha diversity metrics (Observed species, Shannon, Simpson, Chao 1 richness) and beta diversity metrics (Bray–Curtis dissimilarity) were estimated using the diversity plugin, with samples rarefied to a consistent number of sequences per sample.

2.4. Statistical Analysis

Alpha diversity metrics were employed to analyze species diversity, encompassing observed species, Chao1 richness, Shannon’s index, and Simpson’s index. These indices were calculated using QIIME2 (Version 2019.4) and visualized with R software (Version 2.15.3) (http://www.r-project.org, accessed on 28 September 2022). For assessing fungal community structure, beta diversity was analyzed using the nonmetric multidimensional scaling (NMDS) method based on Bray–Curtis distance metrics, executed through the vegan package in R software. Analysis of similarities (ANOSIM) was conducted using the anosim function in the vegan package, and significant differences between groups were assessed based on Bray–Curtis distance values.
Fisher’s LSD method was utilized to test differences between treatments, and Pearson correlation was applied to ascertain statistically significant correlations between classification groups and environmental variables. Redundancy analysis (RDA) was conducted to correlate environmental variables with microbial community structure. All data are presented as the average value and standard error from four repeated measurements, and significance was assessed at the 5% level. Fisher’s LSD and correlation analyses were executed using SPSS 24.0 (SPSS Inc., Chicago, IL, USA), while RDA was performed using CANOCO 4.5 software (Informer Technologies, Los Angeles, CA, USA). Linear discriminant analysis effect size (LEfSe) analysis was conducted using the “ggtree” function in the “vegan” package version 2.6–4 of R software (R Foundation for Statistical Computing, Vienna, Austria).

3. Results

3.1. Physicochemical Properties

Soil pH, EC, ENa, and ESP were significantly influenced by phosphogypsum modification (p < 0.05) (Table 1), all exhibiting a decreasing trend. Compared with treatment A, treatment B displayed notably lower pH and ESP levels, with average reductions of 16.31% and 78.89%, respectively.
The highest EC and ENa levels were observed in CK, while the lowest were in P4, showing decreases of 73.61% and 76.15%, respectively. TOC, SOM, and TK content noticeably increased, reaching peak values in treatment D. Conversely, SWC, TN, TP, and NH4-N content were highest in treatment P4 and lowest in treatment CK (Table 1). The highest AP was recorded in treatment P4, which was approximately five times greater than that in treatment CK (Table 1).
Table 2 details the impact of phosphogypsum modification on soil ion content. Compared with CK, P4 significantly reduced the levels of HCO3, Cl, Mg2+, K+, and Ca2+ by average percentages of 94.14%, 86.68%, 90.49%, 79.65%, and 85.72%, respectively (p < 0.05). Similar trends were observed for SO42− and Na+ contents, which showed average decreases of 25.58% and 75.29% in P6, respectively (p < 0.05).

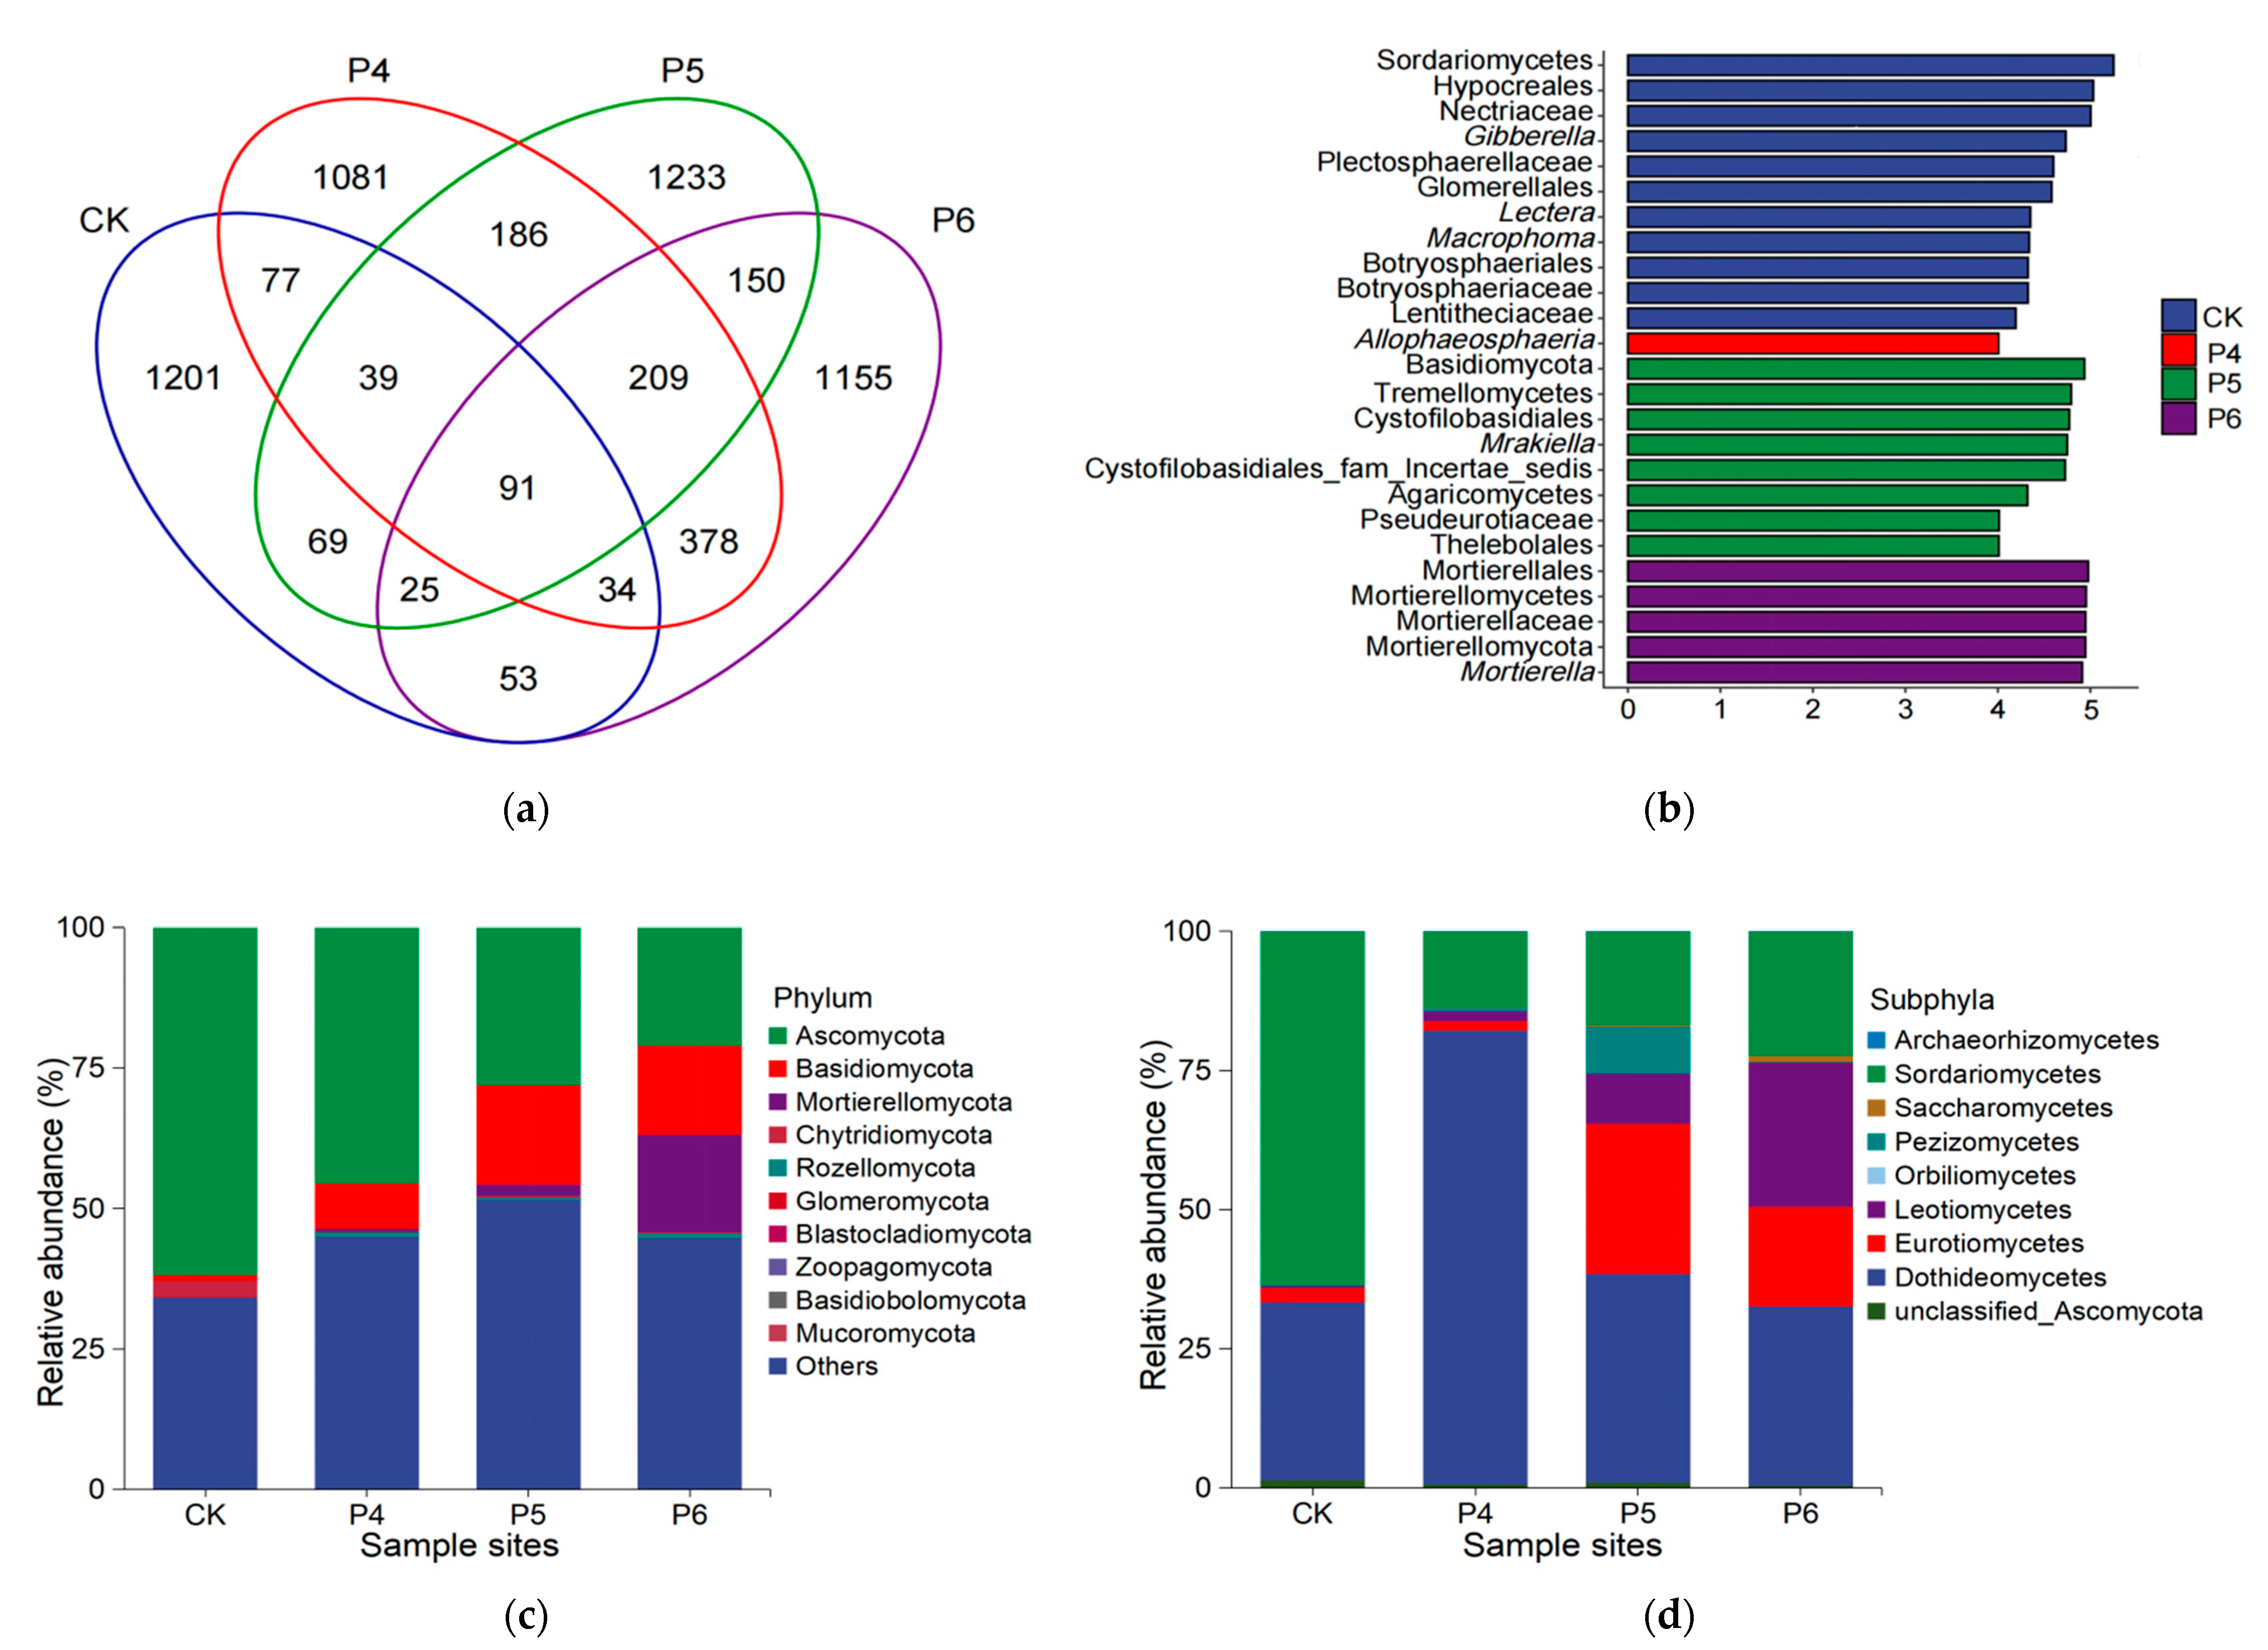
3.2. Fungal Community Composition and Diversity

As depicted in Figure 1a, the ASVs identified in treatments CK, P4, P5, and P6 were 1, 589, 2095, 2002, and 1890, respectively. The Venn diagram revealed that a total of 5981 ASVs were present in at least one of the four sites, constituting the core fungal ASVs. Site-specific independent ASVs were 1201 in CK, 1081 in P4, 1233 in P5, and 1155 in P6.
The fungal communities were primarily composed of the phylum Ascomycota (39.13%), followed by Basidiomycota (10.69%) and Mortierellomycota (4.94%), collectively representing over 50% of all sequences (Figure 1c). Ascomycota was less abundant in treatment P6 than in CK (p < 0.05), while Basidiomycota had a higher relative abundance in P5 compared with CK (p < 0.05). Notably, Mortierellomycota and Rozellomycota showed the highest relative abundance in treatment P6 (p < 0.05).
Regarding the most abundant phylum, Ascomycota, we analyzed the relative abundance distributions at the subphyla level (Figure 1d). Dothideomycetes accounted for approximately 45.75% of the subphyla, followed by other dominant groups like Sordariomycetes (29.11%), Eurotiomycetes (12.29%), Leotiomycetes (9.29%), and Pezizomycetes (2.27%). The relative abundance of Dothideomycetes increased first and then decreased under phosphogypsum treatment. The relative abundance of Sordariomycetes decreased gradually following phosphogypsum treatment (p < 0.05), whereas that of Leotiomycetes and Saccharomycetes increased gradually and reached a maximum at P6 (p < 0.05).
To identify key soil microbiota phylotypes associated with different years of modification, the treatments of CK, P4, P5, and P6 underwent LEfSe analyses (Figure 1b). The LDA results revealed 11 discriminative features (LDA > 4, p < 0.05) in CK, with Sordariomycetes, Hypocreales, and Glomerellales as the primary microbiota. P4 also showed dominant fungal microorganisms (LDA > 4, p < 0.05), with the major microbiota being Allophaeosphaeria. In P5, eight dominant microflora (LDA > 4, p < 0.05) were identified, mainly consisting of Basidiomycota, Tremellamycetes, and Agaricomycetes. P6 had five dominant microorganisms (LDA > 4, p < 0.05), chiefly Mortierellomycetes, Mortierellomycota, and Mortierellales. The primary microbiota was further classified and identified via evolutionary cluster analysis.
For estimating and comparing soil alpha diversity and richness, we utilized the Simpson, observed species, Chao1, and Shannon indices (Figure 2). The lowest values for observed species, Shannon’s diversity, and Chao1 were found in CK but showed a consistent upward trend with increasing years of modification. The highest values for observed species and Chao1 occurred in P4, while the peak for Shannon’s diversity was in P5 (Figure 2).
An NMDS analysis based on Bray–Curtis distance was used to assess the beta diversity of the fungal community across different treatments (Figure 3a). Anosim analysis confirmed significant differences in the fungal community composition among the treatments. A noticeable difference in fungal community structure between CK and other treatments was observed (p < 0.05, Supplementary Materials Table S1), strongly suggesting that phosphogypsum modification significantly altered the community structure and diversity of soil fungi.

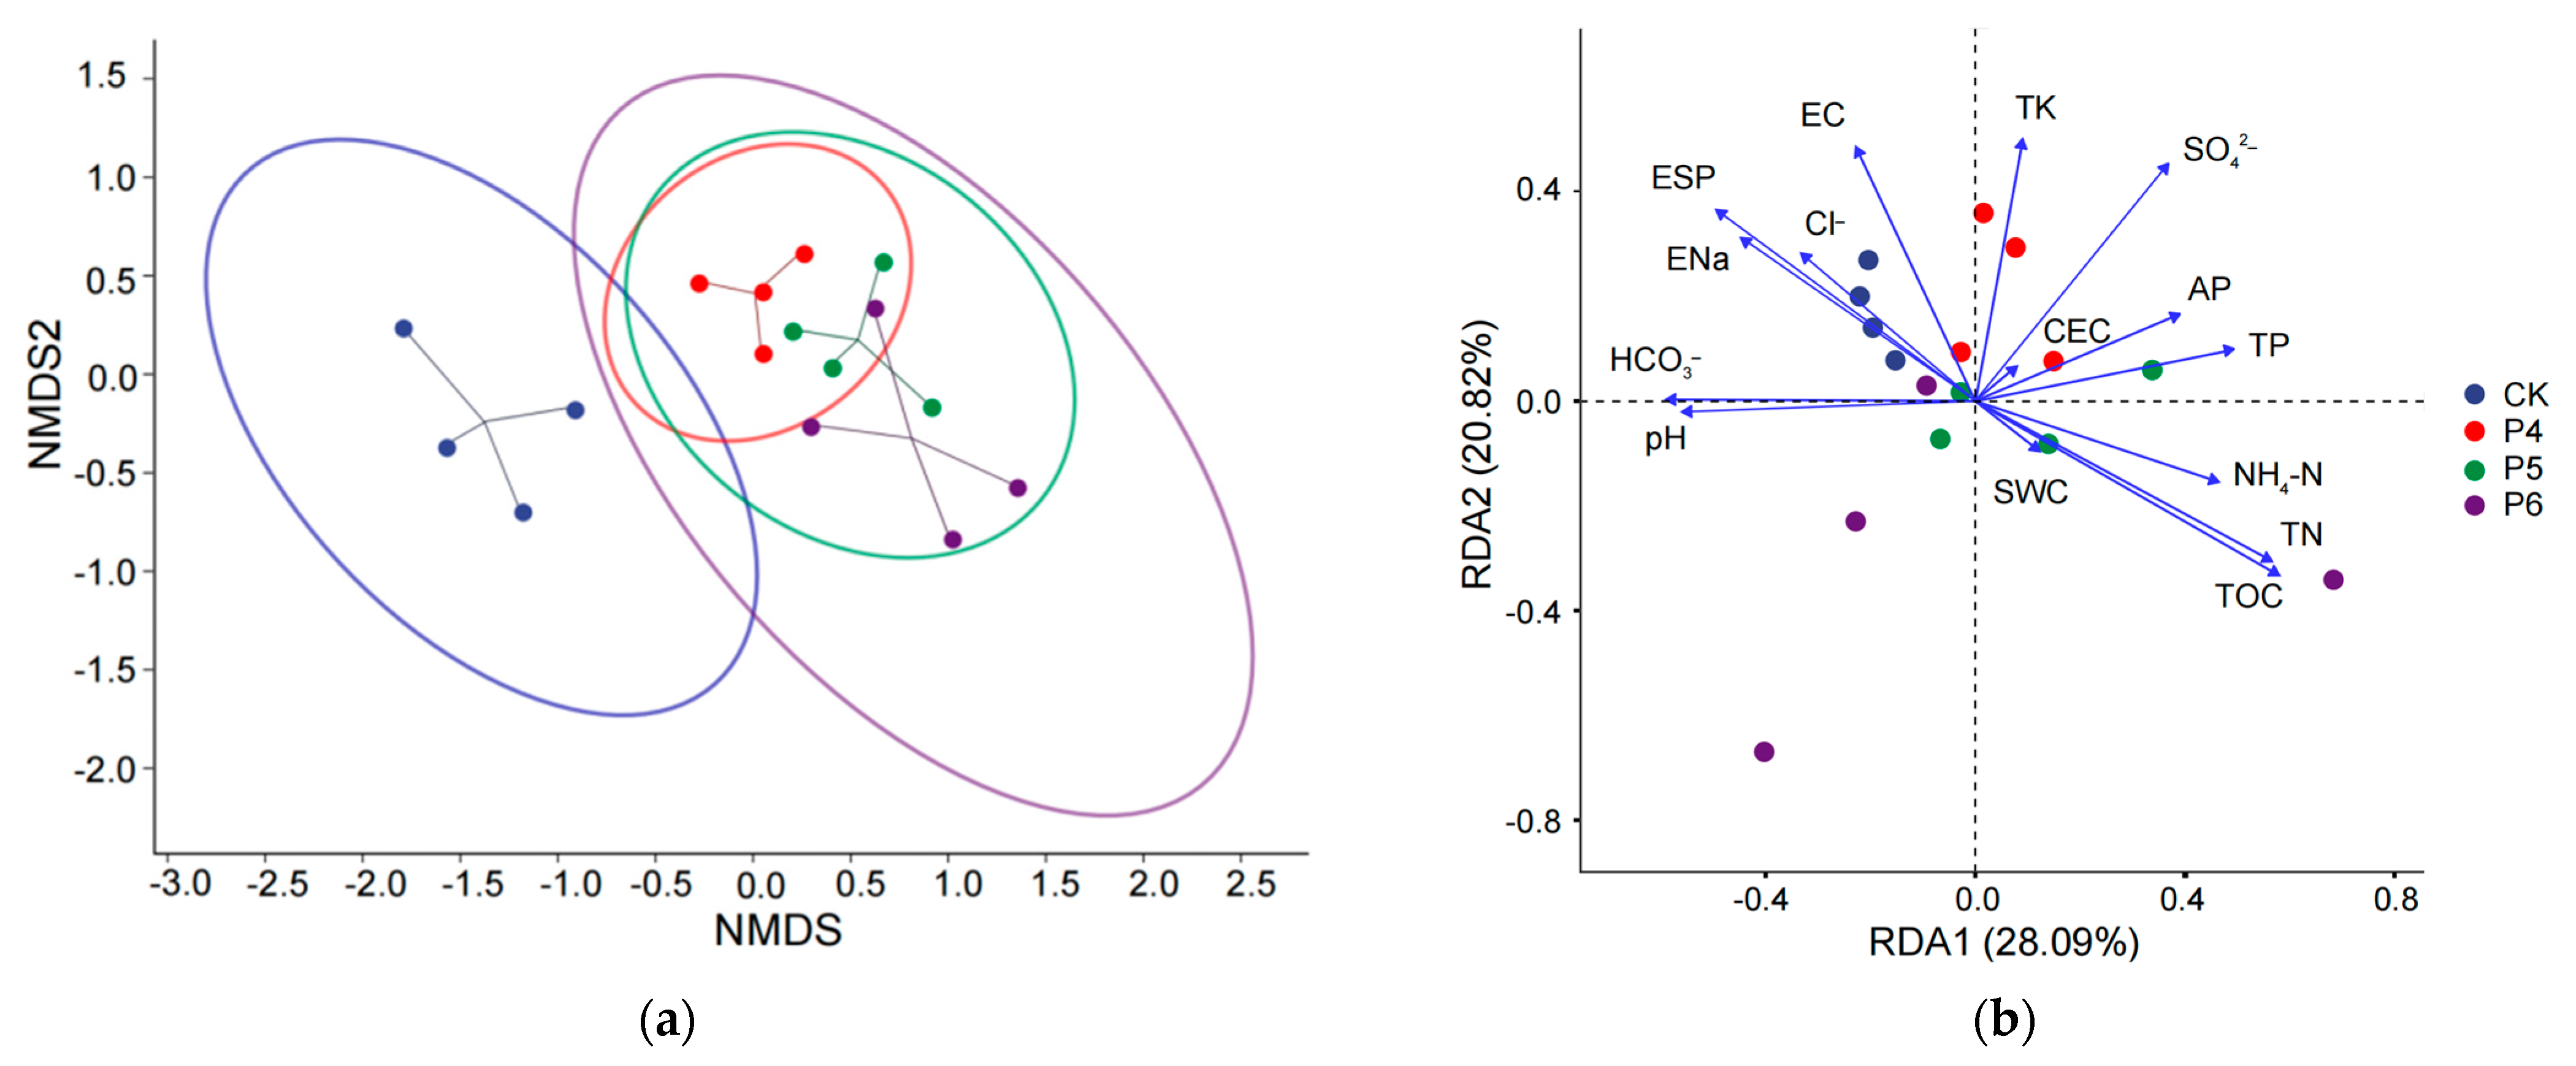
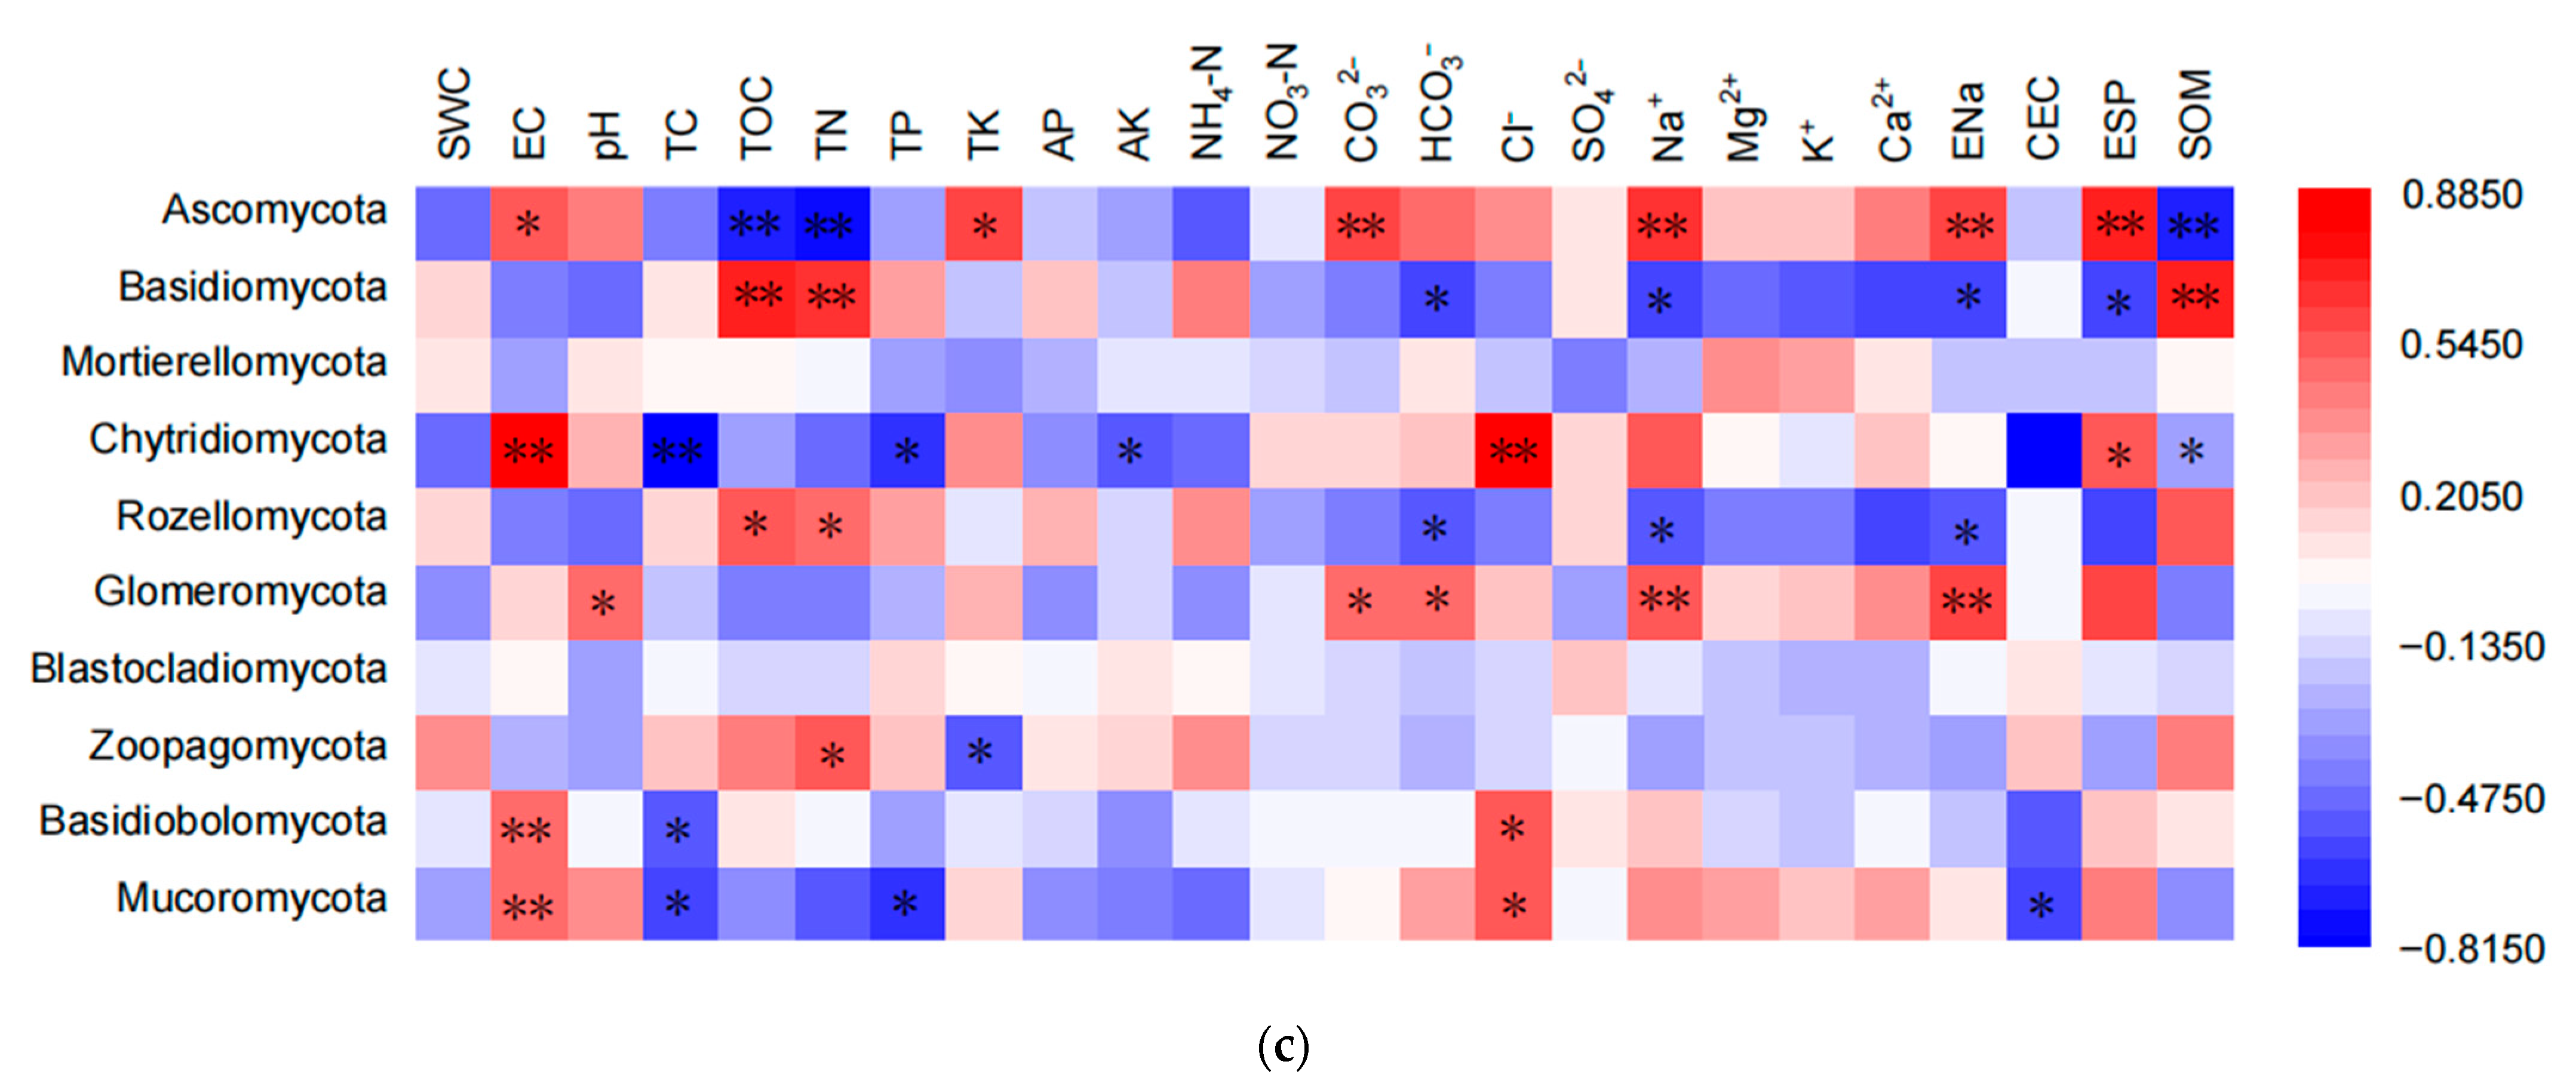
3.3. Influences of Environmental Parameters on Fungal Diversity and Community Structure

Pearson correlation coefficients indicated that fungal community richness indices (Chao1 and observed species) were significantly positively correlated with SWC, TOC, SOM, TN, AP, and NH4-N. They were negatively correlated with pH, HCO3, Cl, Na+, ENa, and ESP (Table 3). Regarding the diversity index, the Shannon index exhibited a strong positive correlation with SWC, TOC, SOM, and TN, whereas the Simpson index was significantly negatively correlated with Na+. Taken together, SWC, TOC, SOM, TN, and Na+ played a pivotal role in affecting fungal alpha diversity.
Pearson correlation analysis between the relative abundance of fungi at the phylum level and environmental factors was also conducted (Figure 3b). Ascomycota was strongly negatively correlated with TOC, SOM, and TN but positively correlated with EC, TK, CO32−, Na+, ENa, and ESP. In contrast, Basidiomycota showed a positive correlation with TOC, SOM, and TN and a negative correlation with HCO3, Na+, ENa, and ESP. Rhodobacteria, also significantly influenced by the addition of phosphogypsum, followed a similar trend to Basidiomycota: it was positively correlated with TOC and TN and negatively correlated with HCO3, Na+, and ENa. Further Pearson correlation analysis focusing on the subphyla of Ascomycota revealed that the relative abundance of Ascomycetes was strongly negatively correlated with SWC, TOC, SOM, TN, TP, and NH4-N and positively correlated with EC, pH, CO32−, Cl, HCO3, Na+, Mg2+, Ca2+, K+, ENa, and ESP (Supplementary Materials Figure S1). Overall, the concentrations of TOC, SOM, and Na+ were closely related to the composition of the fungal community.
RDA was used to evaluate the fungal community structure and significant changes in environmental factors (Figure 3c). The eigenvalues of the first and second axes were 28.09% and 20.82%, respectively. The cumulative percentage variance of species data showed that the first two RDA axes accounted for 48.91% of the structural variation. RDA results indicated that TOC, SOM, TN, ESP, and Na+ (p < 0.05) are significant factors influencing the fungal community structure across all samples (Supplementary Materials Table S2).

4. Discussion

In the present study, the soil’s saline–alkali barrier was significantly reduced following phosphogypsum modification. This can likely be attributed to the dissolved Ca2+ in phosphogypsum migrating through the soil profile under the influence of permeated water. A subsequent replacement reaction with NaHCO3 and Na2CO3 in the saline–alkali soil displaced the exchangeable Na on the soil colloid, thereby enhancing the soil’s cohesiveness and permeability while reducing salt alkalization. Previous studies have confirmed that during rice cultivation, organic acids exuded from rice roots not only neutralize soil pH but also absorb salts. Our results are consistent with these findings. The soluble salt ions (HCO3, CO32−, Cl, Ca2+, and Mg2+) in the soil decreased significantly, and soil fertility and nutrient structure improved markedly. The availability of nitrogen (NH4-N) and phosphorus (AP) in the soil also significantly increased. Earlier investigations have indicated that saline–alkali soil generally contains low levels of organic matter and has poor C sequestration capacity [40]. In phosphogypsum-modified soil, the introduction of organic residues into the soil through aboveground residues and root fragments was notable, further promoting the accumulation of organic matter and the rate of C mineralization.
Soil fungi play a crucial role in the decomposition of organic matter, nutrient cycling, soil fertility maintenance, and crop growth and development [41,42]. Reports suggest that fungal communities are more sensitive to environmental changes and better indicators of these changes than vegetation communities [43]. In the present study, the diversity and richness of fungal communities increased due to improvements in soil properties as a result of phosphogypsum modification. These changes alleviated several environmental pressures, such as high pH, high ionic strength, nutrient scarcity, and water loss due to poor soil permeability. Existing evidence confirms that pH is a significant factor affecting soil fungal communities in various habitats [44,45,46]. A high pH environment can adversely affect microbial metabolism and growth processes, lowering total soil nutrients [47,48,49]. Studies have shown that improved water resource utilization can reduce community stress levels, thus increasing the ratio of fungi to bacteria. Water stimulation of root productivity is also beneficial for fungi [50]. Research indicates that soil nutrients may influence changes in fungal diversity [51], as soil fungi are primarily heterotrophic and rely heavily on exogenous C for growth [19]. Soil C serves as a fundamental energy source and constituent element for fungi, influencing their distribution [52]. Phosphogypsum modification undoubtedly created a more suitable environment for fungi, promoting internal diversity and enhancing resilience to external conditions.
Interesting shifts were also observed in the structure of soil fungal communities. Under different treatments, Ascomycota was the predominant soil fungal phylum in the experimental area, showing strong adaptability and broad distribution, consistent with prior research into soil fungal structure in paddy fields [53,54]. However, as the years of modification increased, the dominance of Ascomycota gradually declined, while the relative abundance of Basidiomycota, Mortierellomycota, and Rozellomycota increased significantly. Studies suggest that soil nutrients are factors driving changes in fungal community structure [51,55]. Increased exogenous C intensifies competition within the fungal community and shifts in the C/N ratio also affect the allocation of fungal and bacterial resources. The dominance of Basidiomycetes in soil, which may be related to their ability to degrade complex lignocellulosic components [56], secretes various extracellular plant cell-wall-degrading enzymes that break down cellulose, hemicellulose, and lignin (the major components of plant biomass) [57]. The improvement due to phosphogypsum increased above- and belowground vegetation residues and the strong decomposition capacity of Basidiomycetes promoted the import of organic matter. Mortierellomycota participates in the mineralization of soil organic matter, allowing the decomposition of crop residues into organic matter in soil and organic fertilizers [58]. Therefore, increased Mortierellomycota richness significantly contributes to soil nutrient conversion and availability [59]. Rozellomycota tends to thrive in high-quality environments, further supporting effective soil improvement [60].

5. Conclusions

In summary, the combined use of rice cultivation and phosphogypsum application significantly improves soil quality and alters fungal community structure in saline-alkali soil. These findings align with the objectives of our study, where we aimed to explore the effects of phosphogypsum application on saline-alkali soil and its microbial communities. Our results highlight the crucial role of environmental factors, particularly TOC, SOM, and ESP, in shaping soil fungal communities. The observed shifts in soil fungal communities have significant implications for ecosystem function, as they can impact soil processes and nutrient cycling. These findings are of practical importance for restoring fragile habitats in large-scale soda saline-alkali soils in the Songnen Plain, supporting sustainable soil resource utilization, and enhancing grain production capacity.

Supplementary Materials

The following supporting information can be downloaded at: https://www.mdpi.com/article/10.3390/agronomy13112726/s1, Table S1: anosim test performed on the experimental sites using fungi community structure, Table S2: redundancy analysis and permutation test performed on the experimental sites using fungi community structure, Figure S1: Pearson correlation analysis between the relative abundance of fungi at the Ascomycetes subphylum level and environmental factors (soil physicochemical characteristics and soil ion content).

Author Contributions

W.L. and Z.L. designed and planned the research. G.L., Z.F., Y.X., Y.J., J.H., T.Y. and G.Z. performed experiments and analyzed the data. M.W., M.L. and H.Y. helped with designing, executing, and interpreting experiments. G.L. and Z.F. wrote and Z.L. and W.L. edited the manuscript. W.L. and Z.L. agreed to serve as the authors responsible for contact and communication. All authors have read and agreed to the published version of the manuscript.

Funding

This research was funded by the Strategic Priority Research Program of the Chinese Academy of Sciences (Project No. XDA28110105, XDA28110102), the National Key Research and Development Program of China (Project No. 2022YFD1500505), the Science and Technology Project of Education Department of Jilin Province (Project No. JJKH20230019KJ), and the Science and Technology Development Plan Project of Baicheng city (Project No.202206).

Data Availability Statement

Not applicable.

Conflicts of Interest

The authors declare that the research was conducted in the absence of any commercial or financial relationships that could be construed as a potential conflict of interest.

References

  1. Wirsenius, S.; Azar, C.; Berndes, G. How much land is needed for global food production under scenarios of dietary changes and livestock productivity increases in 2030? Agric. Syst. 2010, 103, 621–638. [Google Scholar] [CrossRef]
  2. Food and Agricultural Organization. FAO Statistical Yearbook 2020, World Food and Agriculture; Food and Agriculture Organization of the United Nations: Rome, Italy, 2022; p. 2. [Google Scholar]
  3. Wicke, B.; Smeets, E.; Dornburg, V.; Vashey, B.; Gaiser, T.; Turkenburg, W.; Faaij, A. The global technical and economic potential of bioenergy from salt-affected soils. Energy Environ. Sci. 2011, 4, 2669–2681. [Google Scholar] [CrossRef]
  4. Singh, A. Salinization of agricultural lands due to poor drainage: A viewpoint. Ecol. Indic. 2018, 95, 127–130. [Google Scholar] [CrossRef]
  5. Zaman, F. The Socioeconomic Impact of Climate Change: Assessing the Vulnerability and Adaptive Capacity of the Coastal People in Bangladesh. Master’s Thesis, University of Dhaka, Dhaka, Bangladesh, 2018. [Google Scholar]
  6. Wang, M.M.; Rengasamy, P.; Wang, Z.C.; Yang, F.; Ma, H.Y.; Huang, L.H.; Liu, M.; Yang, H.Y.; Li, J.P.; An, F.H.; et al. Identification of the most limiting factor for rice yield using soil data collected before planting and during the reproductive stage. Land Degrad. Dev. 2018, 29, 2310–2320. [Google Scholar] [CrossRef]
  7. Dobermann, A.; Fairhurst, T. Rice: Nutrient Disorders & Nutrient Management; Potash and Phosphate Institute, and Manila, IRRI: Singapore, 2000. [Google Scholar]
  8. Mahmoodabadi, M.; Yazdanpanah, N.; Rodríguez Sinobas, L.; Pazira, E.; Neshat, A. Reclamation of calcareous saline sodic soil with different amendments (I): Redistribution of soluble cations within the soil profile. Agric. Water Manag. 2013, 120, 30–38. [Google Scholar] [CrossRef]
  9. Hanay, A.; Büyüksönmez, F.; Kiziloglu, F.M.; Canbolat, M.Y. Reclamation of saline-sodic soils with Gypsum and MSW compost. Compost Sci. Util. 2013, 12, 175–179. [Google Scholar] [CrossRef]
  10. Sun, W.; Xiao, E.; Pu, Z.; Krumins, V.; Dong, Y.; Li, B.; Hu, M. Paddy soil microbial communities driven by environment- and microbe-microbe interactions: A case study of elevation-resolved microbial communities in a rice terrace. Sci. Total Environ. 2018, 612, 884–893. [Google Scholar] [CrossRef]
  11. Tian, T.; Zhang, C.L.; Zhu, F.; Yuan, S.X.; Guo, Y.; Xue, S.G. Effect of phosphogypsum on saline-alkalinity and aggregate stability of bauxite residue. T. Nonferr. Metal. Soc. 2021, 31, 1484–1495. [Google Scholar] [CrossRef]
  12. Miao, L.; Liang, Z.; Ma, H.Y.; Huang, L.H.; Wang, M.M. Responses of rice (Oryza saliva L.) growth and yield to phosphogypsumamendment in saline-sodic soils of North-East China. J. Food Agric. Environ. 2010, 8, 827–833. [Google Scholar]
  13. Zhou, S.M.; Zhang, M.; Zhang, K.K.; Yang, X.W.; He, D.X.; Yin, J.; Wang, C.Y. Effects of reduced nitrogen and suitable soil moisture on wheat (Triticum aestivum L.) rhizosphere soil microbiological, biochemical properties and yield in the Huanghuai Plain, China. J. Integ. Agric. 2020, 19, 234–250. [Google Scholar] [CrossRef]
  14. Aon, M.A.; Cabello, M.N.; Sarena, D.E.; Colaneri, A.C.; Franco, M.G.; Burgos, J.L.; Cortassa, S.I. Spatio-temporal patterns of soil microbial and enzymatic activities in an agricultural soil. Appl. Soil Ecol. 2001, 18, 239–254. [Google Scholar] [CrossRef]
  15. Goberna, M.; Sánchez, J.; Pascual, J.A.; Garciá, C. Surface and subsurface organic carbon, microbial biomass and activity in a forest soil sequence. Soil. Biol. Biochem. 2006, 38, 2233–2243. [Google Scholar] [CrossRef]
  16. Khan, M.N.; Mobin, M.; Abbas, Z.K.; Alamri, S.A. Fertilizers and their contaminants in soils, surface and groundwater. Encycl. Anthr. 2018, 5, 225–240. [Google Scholar] [CrossRef]
  17. Gomes, S.I.F.; Merckx, V.S.F.T.; Kehl, J.; Gebauer, G. Mycoheterotrophic plants living on arbuscular mycorrhizal fungi are generally enriched in 13C, 15N and 2H isotopes. J. Ecol. 2020, 108, 1250–1261. [Google Scholar] [CrossRef]
  18. Badri, D.V.; Vivanco, J.M. Regulation and function of root exudates. Plant Cell Environ. 2010, 32, 666–681. [Google Scholar] [CrossRef]
  19. Broeckling, C.D.; Broz, A.K.; Bergelson, J.; Manter, D.K.; Vivanco, J.M. Root exudates regulate soil fungal community composition and diversity. Appl. Environ. Microbiol. 2008, 74, 738–744. [Google Scholar] [CrossRef] [PubMed]
  20. Bringhurst, R.M.; Cardon, Z.G.; Gage, D.J. Galactosides in the rhizosphere: Utilization by Sinorhizobium meliloti and development of a biosensor. Proc. Natl. Acad. Sci. USA 2001, 98, 4540–4545. [Google Scholar] [CrossRef] [PubMed]
  21. Philippot, L.; Spor, A.; Hénault, C.; Bru, D.; Bizouard, F.; Jones, C.M.; Sarr, A.; Maron, P.A. Loss in microbial diversity affects nitrogen cycling in soil. ISME J. 2013, 7, 1609–1619. [Google Scholar] [CrossRef]
  22. Bridge, P.; Spooner, B. Soil fungi: Diversity and detection. Plant Soil 2001, 232, 147–154. [Google Scholar] [CrossRef]
  23. Augé, R. Arbuscular mycorrhizae and soil/plant water relations. Can. J. Soil Sci. 2004, 84, 373–381. [Google Scholar] [CrossRef]
  24. Bashan, Y.; Salazar, B.; Puente, M.E. Responses of native legume desert trees used for reforestation in the Sonoran Desert to plant growth-promoting microorganisms in screen house. Biol. Fert. Soils 2009, 45, 655–662. [Google Scholar] [CrossRef]
  25. Burke, R.A.; Molina, M.; Cox, J.E.; Osher, L.J.; Piccolo, M.C. Stable carbon isotope ratio and composition of microbial fatty acids in tropical soils. J. Environ. Qual. 2003, 32, 198–206. [Google Scholar] [CrossRef] [PubMed]
  26. Sparling, G.P. Biological indicators of soil health. In Soil Microbial Biomass, Activity and Nutrient Cycling as Indicators of Soil Health; Pankhurst, C., Doube, B.M., Gupta, V.V.S.R., Eds.; CAB International: Wallingford, UK, 1997; Volume 12, pp. 97–120. [Google Scholar]
  27. Saggar, S.; Yeates, G.W.; Shepherd, T.G. Cultivation effects on soil biological properties, microfauna and organic matter dynamics in Eutric Gleysol and Gleyic Luvisol soils in New Zealand. Soil Till. Res. 2001, 58, 55–68. [Google Scholar] [CrossRef]
  28. Ji, L.; Xin, Y.; Guo, D. Soil Fungal Community Structure and Its Effect on CO2 Emissions in the Yellow River Delta. Int. J. Environ. Res. Public Health 2023, 20, 4190. [Google Scholar] [CrossRef] [PubMed]
  29. Zhang, X.; Chen, B.; Yin, R.; Xing, S.; Fu, W.; Wu, H.; Hao, Z.; Ma, Y.; Zhang, X. Long-term nickel contamination increased soil fungal diversity and altered fungal community structure and co-occurrence patterns in agricultural soils. J. Hazard Mater. 2022, 436, 129113. [Google Scholar] [CrossRef] [PubMed]
  30. Banerjee, S.; Walder, F.; Büchi, L.; Meyer, M.; Held, A.Y.; Gattinger, A.; Keller, T.; Charles, R.; van der Heijden, M.G.A. Agricultural intensification reduces microbial network complexity and the abundance of keystone taxa in roots. ISME J. 2019, 3, 1722–1736. [Google Scholar] [CrossRef] [PubMed]
  31. Hu, Y.; Veresoglou, S.D.; Tedersoo, L.; Xu, T.; Ge, T.; Liu, L.; Chen, Y.; Hao, Z.; Su, Y.; Rillig, M.C.; et al. Contrasting latitudinal diversity and co-occurrence patterns of soil fungi and plants in forest ecosystems. Soil Biol. Biochem. 2019, 131, 100–110. [Google Scholar] [CrossRef]
  32. Bender, S.F.; Wagg, C.; van der Heijden, M.G.A. An Underground Revolution: Biodiversity and Soil Ecological Engineering for Agricultural Sustainability. Trends Ecol. Evol. 2016, 31, 440–452. [Google Scholar] [CrossRef]
  33. Bolyen, E.; Rideout, J.R.; Dillon, M.R.; Bokulich, N.A.; Abnet, C.; Al-Ghalith, G.A.; Alexander, H.; Alm, E.J.; Arumugam, M.; Asnicar, F.; et al. QIIME 2: Reproducible, interactive, scalable, and extensible microbiome data science. PeerJ Prepr. 2018, 6, e27295v2. [Google Scholar] [CrossRef]
  34. Martin, M. Cutadapt removes adapter sequences from high-throughput sequencing reads. EMBnet 2011, 17, 10–12. [Google Scholar] [CrossRef]
  35. Callahan, B.J.; McMurdie, P.J.; Rosen, M.J.; Han, A.W.; Johnson, A.J.A.; Holmes, S.P. DAD2: High-resolution sample inference from illumina amplicon data. Nat. Methods 2016, 13, 581–583. [Google Scholar] [CrossRef] [PubMed]
  36. Katoh, K.; Misawa, K.; Kuma, K.; Miyata, T. MAFFT: A novel method for rapid multiple sequence alignment based on fast Fourier transform. Nucleic Acids Res. 2002, 30, 3059–3066. [Google Scholar] [CrossRef] [PubMed]
  37. Price, M.N.; Dehal, P.S.; Arkin, A.P. FastTree: Computing large minimum evolution trees with profiles instead of a distance matrix. Mol. Biol. Evol. 2009, 26, 1641–1650. [Google Scholar] [CrossRef]
  38. Bokulich, N.A.; Kaehler, B.D.; Rideout, J.R.; Dillon, M.; Boylen, E.; Knight, R.; Huttley, G.A.; Caporaso, J.G. Optimizing taxonomic classification of marker-gene amplicon sequences with QIIME 2’s q2-feature-classifier plugin. Microbiome 2018, 6, 90. [Google Scholar] [CrossRef] [PubMed]
  39. Kõljalg, U.; Nilsson, R.H.; Abarenkov, K.; Tedersoo, L.; Taylor, A.F.; Bahram, M.; Bates, S.T.; Bruns, T.D.; Bengtsson-Palme, J.; Callaghan, T.M.; et al. Towards a unified paradigm for sequence-based identification of fungi. Mol. Ecol. 2013, 22, 5271–5277. [Google Scholar] [CrossRef] [PubMed]
  40. Gong, H.; Li, Y.; Li, S. Effects of the interaction between biochar and nutrients on soil organic carbon sequestration in soda saline-alkali grassland: A review. Glob. Ecol. Conserv. 2021, 26, e01449. [Google Scholar] [CrossRef]
  41. Brzostek, E.R.; Greco, A.; Drake, J.E.; Finzi, A.C. Root carbon inputs to the rhizosphere stimulate extracellular enzyme activity and increase nitrogen availability in temperate forest soils. Biogeochemistry 2013, 115, 65–76. [Google Scholar] [CrossRef]
  42. Crowther, T.W.; Van Den Hoogen, J.; Wan, J.; Mayes, M.A.; Keiser, A.D.; Mo, L.; Averill, C.; Maynard, D.S. The global soil community and its influence on biogeochemistry. Science 2019, 365, eaav0550. [Google Scholar] [CrossRef]
  43. Huang, L.; Bai, J.; Wen, X.; Zhang, G.; Zhang, C.; Cui, B.; Liu, X. Microbial resistance and resilience in response to environmental changes under the higher intensity of human activities than global average level. Glob. Chang. Biol. 2020, 26, 2377–2389. [Google Scholar] [CrossRef]
  44. Maroua, J.; Labidi, S.; Bahri, B.A.; Laurelle, F.; Tisserant, B.; Jeddi, F.B.; Lounès-Hadj Sahraoui, A. Soil properties and climate affect arbuscular mycorrhizal fungi and soil microbial communities in Mediterranean rainfed cereal cropping systems. Pedobiologia 2021, 87–88, 150748. [Google Scholar] [CrossRef]
  45. Lui, D.; Liu, G.; Chen, L.; Wang, J.; Zhang, L. Soil pH determines fungal diversity along an elevation gradient in Southwestern China. Sci. China Life Sci. 2018, 61, 718–726. [Google Scholar] [CrossRef]
  46. Tao, Z.; Wang, N.F.; Liu, H.Y.; Zhang, Y.Q.; Yu, L.Y. Soil pH is a key determinant of soil fungal community composition in the Ny-Ålesund region, Svalbard (High Arctic). Front. Microbiol. 2016, 7, 227. [Google Scholar] [CrossRef]
  47. Sun, R.; Dsouza, M.; Gilbert, J.A.; Guo, X.; Wang, D.; Guo, Z.; Ni, Y.; Chu, H. Fungal community composition in soils subjected to long-term chemical fertilization is most influenced by the type of organic matter. Environ. Microbiol. 2016, 18, 5137–5150. [Google Scholar] [CrossRef] [PubMed]
  48. Liu, J.; Sui, Y.; Yu, Z.; Shi, Y.; Chu, H.; Jin, J.; Liu, X.; Wang, G. Soil carbon content drives the biogeographical distribution of fungal communities in the black soil zone of northeast China. Soil Biol. Biochem. 2015, 83, 29–39. [Google Scholar] [CrossRef]
  49. Liu, K.; Liu, Z.; Zhou, N.; Shi, X.; Lock, T.R.; Kallenbach, R.L.; Yuan, Z. Diversity-stability relationships in temperate grasslands as a function of soil pH. Land Degrad. Dev. 2022, 33, 1704–1717. [Google Scholar] [CrossRef]
  50. Williams, M.A.; Rice, C.W. Seven years of enhanced water availability influences the physiological, structural, and functional attributes of a soil microbial community. Appl. Soil Ecol. 2007, 35, 535–545. [Google Scholar] [CrossRef]
  51. Sterkenburg, E.; Bahr, A.; Durling, M.B.; Clemmensen, K.E.; Lindahl, B.D. Changes in fungal communities along a boreal forest soil fertility gradient. New Phytol. 2015, 207, 1145–1158. [Google Scholar] [CrossRef] [PubMed]
  52. Yang, Y.; Gao, Y.; Wang, S.; Xu, D.; Yu, H.; Wu, L.; Lin, Q.; Hu, Y.; Li, X.; He, Z.; et al. The microbial gene diversity along an elevation gradient of the Tibetan grassland. ISME J. 2014, 8, 430–440. [Google Scholar] [CrossRef]
  53. Zhang, Y.; Li, Q.; Chen, Y.; Dai, Q.; Hu, J. Mudflat reclamation causes change in the composition of fungal communities under long-term rice cultivation. Can. J. Microbiol. 2019, 65, 530–537. [Google Scholar] [CrossRef]
  54. Letuma, P.; Arafat, Y.; Waqa, M.; Lin, F.; Lin, W.; Zhang, Y.; Masita, M.; Fan, K.; Li, Z.; Lin, W. Gene mutation associated with esl mediates shifts on fungal community composition in rhizosphere soil of rice at grain-filling stage. Sci. Rep. 2018, 8, 17521. [Google Scholar] [CrossRef]
  55. Tedersoo, L.; Bahram, M.; Põlme, S.; Kõljalg, U.; Yorou, N.S.; Wijesundera, R.; Ruiz, L.V.; Vasco-Palacios, A.M.; Thu, P.Q.; Suija, A.; et al. Global diversity and geography of soil fungi. Science 2014, 346, 1256688. [Google Scholar] [CrossRef] [PubMed]
  56. Lundell, T.K.; Mäkelä, M.R.; Hildén, K. Lignin-modifying enzymes in filamentous basidiomycetes–ecological, functional and phylogenetic review. J. Basic Microbiol. 2010, 50, 5–20. [Google Scholar] [CrossRef] [PubMed]
  57. Marian, I.M.; Vonk, P.J.; Valdes, I.D.; Barry, K.; Bostock, B.; Carver, A.; Daum, C.; Lerner, H.; Lipzen, A.; Park, H.; et al. The Transcription Factor Roc1 Is a Key Regulator of Cellulose Degradation in the Wood-Decaying Mushroom Schizophyllum commune. mBio 2022, 13, e0062822. [Google Scholar] [CrossRef] [PubMed]
  58. Shi, Y.; Qiu, L.; Guo, L.; Man, J.; Shang, B.; Pu, R.; Ou, X.; Dai, C.; Liu, P.; Yang, Y.; et al. Fertilizers Reduce the Accumulation of Cd in Panax notoginseng (Burk.) F.H. by Improving the Quality of the Microbial Community. Front. Plant Sci. 2020, 11, 888. [Google Scholar] [CrossRef] [PubMed]
  59. Osorio, N.W.; Habte, M. Soil phosphate desorption induced by a phosphate-solubilizing fungus. Commun. Soil Sci. Plant 2014, 45, 451–460. [Google Scholar] [CrossRef]
  60. Cao, J.; Wang, H.; Holden, N.M.; Adamowski, J.F.; Biswas, A.; Zhang, X.; Feng, Q. Soil properties and microbiome of annual and perennial cultivated grasslands on the Qinghai-Tibetan Plateau. Land Degrad. Dev. 2021, 32, 5306–5321. [Google Scholar] [CrossRef]
Figure 1. (a) Venn diagram representing the number of shared and unique amplicon sequence variations (ASVs) in the fungal communities of the different experimental sites. Each ellipse represents a treatment, the overlapping area between ellipses represents shared ASVs between groups, and the number of each block represents the number of ASVs contained within the block. Microbial internal transcribed spacer amplicon sequences were clustered using the “dada2” algorithm to obtain nonmonad ASVs. (b) Linear discriminant analysis (LDA) score. Enriched taxa with an LDA score >4 are shown in the histogram. The ordinate is the classification unit with significant differences between groups, and the horizontal coordinate is a bar chart to visually display the LDA analysis logarithm scores of each classification unit. The taxa are sorted by score value size to describe their specificity within the sample grouping. Longer lengths indicate more significant differences in the taxon, and the color of the bar plot indicates the sample group corresponding to the taxon with the highest abundance. (c) Relative abundances of fungi from the experimental sites at the phylum level. (d) Relative abundances of fungi from the experimental sites at the subphyla level. CK, P4, P5, and P6 indicate unmodified saline–alkali paddy fields and modification by phosphogypsum for 4, 5, and 6 years, respectively.
Agronomy 13 02726 g001
Figure 2. Simpson index, observed species, Chao1 richness, and Shannon index analyses of soil fungal microorganisms. CK, P4, P5, and P6 indicate unmodified saline–alkali paddy fields and modification by phosphogypsum for 4, 5, and 6 years, respectively. The ends of the whiskers represent the minima and maxima, the bottom and top of the box are the first and third quartiles, respectively, and the line inside the box is the median. * Indicates significant differences at the 0.05 level.
Agronomy 13 02726 g002
Figure 3. (a) Nonmetric multidimensional scaling plots of fungal community structure based on Bray–Curtis distance. Each ellipse represents a treatment. (b) Redundancy analysis of soil physicochemical properties and the microbial community structure of fungi. The figure presents the scores of samples and significantly varied environmental factors (soil physicochemical characteristics and soil ion content) on the first two axes. (c) Pearson correlation analysis between the relative abundance of fungi at the phylum level and environmental factors (soil physicochemical characteristics and soil ion content). Correlation coefficients are colored from dark red (positive correlation) to dark blue (negative correlation). Color intensity is proportional to the correlation coefficients. SWC, soil water content; EC, electric conductivity; TC, total carbon; TOC, total organic carbon; SOM, soil organic matter; TN, total nitrogen; TP, total phosphorus; TK, total potassium; AP, available phosphorus; AK, available potassium; NH4-N, nitrate; NO3-N, ammonium; ENa, exchangeable sodium ion; CEC, cation exchange capacity; ESP, soil alkalinity. CK, P4, P5, and P6 indicate unmodified saline–alkali paddy fields and modification by phosphogypsum for 4, 5, and 6 years, respectively. * Indicates significant difference at the 0.05 level; ** indicates significant difference at the 0.01 level.
Agronomy 13 02726 g003aAgronomy 13 02726 g003b
Table 1. Soil physicochemical characteristics at the different experimental sites of different treatments.
CKP4P5P6
SWC (%)15.05 ± 0.53 a21.78 ± 1.03 b19.77 ± 1.41 b19.48 ± 1.38 b
EC (μS·cm−1)1319.50 ± 377.81 a643.50 ± 75.53 b538.75 ± 124.52 b348.25 ± 17.88 b
pH10.03 ± 0.19 a8.39 ± 0.15 b9.21 ± 0.30 c9.28 ± 0.18 c
TC (%)1.15 ± 0.14 a1.23 ± 0.05 a1.34 ± 0.05 a1.27 ± 0.05 a
TOC (%)0.28 ± 0.02 a0.53 ± 0.04 b0.53 ± 0.08 b0.57 ± 0.07 b
SOM (%)0.49 ± 0.04 a0.92 ± 0.07 b0.92 ± 0.14 b0.99 ± 0.11 b
TN (mg·kg−1)321.24 ± 34.02 a561.82 ± 39.11 b559.34 ± 86.66 b556.15 ± 54.04 b
TP (mg·kg−1)356.10 ± 36.71 a522.14 ± 28.29 b443.56 ± 21.79 bc410.79 ± 18.23 ac
TK (mg·kg−1)22,370.98 ± 381.40 a22,227.74 ± 160.32 ab20,854.42 ± 794.73 ab20,633.82 ± 572.73 b
AP (mg·kg−1)9.57 ± 1.93 a45.90 ± 7.94 b23.58 ± 3.20 c18.24 ± 2.21 ac
AK (mg·kg−1)118.28 ± 7.94 a120.17 ± 11.64 a124.70 ± 6.35 a100.77 ± 8.57 a
NH4-N (mg·kg−1)2.54 ± 0.43 a4.06 ± 0.53 b3.53 ± 0.52 ab3.60 ± 0.29 ab
NO3-N (mg·kg−1)57.71 ± 43.14 a3.94 ± 2.27 a1.86 ± 0.23 a10.41 ± 1.63 a
ENa (cmol·kg−1)6.36 ± 1.09 a1.54 ± 0.59 b2.46 ± 0.74 b1.52 ± 0.42 b
CEC (cmol·kg−1)16.58 ± 3.05 a17.86 ± 0.65 a18.87 ± 0.46 a15.70 ± 0.98 a
ESP (%)39.75 ± 3.75 a8.39 ± 3.10 b13.33 ± 4.06 b9.58 ± 2.42 b
SWC, soil water content; EC, electric conductivity; TC, total carbon; TOC, total organic carbon; SOM, soil organic matter; TN, total nitrogen; TP, total phosphorus; TK, total potassium; AP, available phosphorus; AK, available potassium; NH4-N, nitrate; NO3-N, ammonium; ENA, exchangeable sodium ion; CEC, cation exchange capacity; ESP, soil alkalinity. CK, P4, P5, and P6 indicate unmodified saline–alkali paddy fields and modification by phosphogypsum for 4, 5, and 6 years, respectively. Different letters indicate significant differences between different treatments (ANOVA, LSD test, p < 0.05).
Table 2. Soil ion content at the different experimental sites of different treatments.
CKP4P5P6
CO32− (mg·kg−1)372.60 ± 154.89---
HCO3 (mg·kg−1)9274.81 ± 1195.90 a543.51 ± 188.02 b1963.59 ± 625.71 b2685.53 ± 1728.99 b
Cl (mg·kg−1)812.95 ± 293.27 a108.28 ± 7.46 b118.93 ± 9.67 b146.44 ± 15.90 b
SO42− (mg·kg−1)445.65 ± 284.79 ac1662.78 ± 165.00 b914.52 ± 164.85 a331.67 ± 54.04 c
Na+ (mg·kg−1)2268.71 ± 125.65 a664.20 ± 181.23 b748.15 ± 178.08 b560.57 ± 94.56 b
Mg2+ (mg·kg−1)373.62 ± 118.29 a35.52 ± 13.65 b75.64 ± 24.72 b169.37 ± 141.28 ab
K+ (mg·kg−1)46.74 ± 12.45 a9.51 ± 1.18 b14.10 ± 3.48 b22.45 ± 13.92 ab
Ca2+ (mg·kg−1)2117.52 ± 293.94 a302.37 ± 156.33 b452.01 ± 132.43 b593.93 ± 445.62 b
CK, P4, P5, and P6 indicate unmodified saline–alkali paddy fields and modification by phosphogypsum for 4, 5, and 6 years, respectively. Different letters indicate significant differences between different treatments for ion content (ANOVA, LSD test, p < 0.05).
Table 3. Pearson correlation analysis of fungal alpha diversity and environmental factors (soil physicochemical characteristics and soil ions content) at the experimental sites of different treatments.
Chao1Observed_SpeciesShannonSimpson
SWC (%)0.816 **0.812 **0.593 *0.320
EC (μS·cm−1)−0.455−0.454−0.460−0.130
pH−0.642 **−0.637 **−0.2380.041
TC (%)0.2670.2690.3860.270
TOC (%)0.592 *0.588 *0.523 *0.057
SOM (%)0.592 *0.588 *0.523 *0.057
TN (mg·kg−1)0.660 **0.654 **0.517 *0.104
TP (mg·kg−1)0.676 **0.668 **0.2430.068
TK (mg·kg−1)−0.361−0.361−0.598 *−0.310
AP (mg·kg−1)0.612 *0.607 *0.1840.612 *
AK (mg·kg−1)0.0010.0040.0640.270
NH4-N (mg·kg−1)0.554 *0.542 *0.221−0.047 *
NO3-N (mg·kg−1)−0.470−0.466−0.2720.058
ENa (cmol·kg−1)−0.503 *−0.499 *−0.430−0.007
CEC (cmol·kg−1)0.2760.2760.1560.193
ESP (%)−0.579 *−0.575 *−0.467−0.055
CO32− (mg·kg−1)−0.221−0.219−0.305−0.092
HCO3 (mg·kg−1)−0.541 *−0.538 *−0.461−0.132
Cl (mg·kg−1)−0.508 *−0.506 *−0.372−0.074
SO42− (mg·kg−1)0.4130.409−0.012−0.065
Na+ (mg·kg−1)−0.573 *−0.570 *−0.502 *−0.069
Mg2+ (mg·kg−1)−0.408−0.404−0.387−0.211
K+ (mg·kg−1)−0.416−0.412−0.370−0.153
Ca2+ (mg·kg−1)−0.477−0.475−0.475−0.159
SWC, soil water content; EC, electric conductivity; TC, total carbon; TOC, total organic carbon; SOM, soil organic matter; TN, total nitrogen; TP, total phosphorus; TK, total potassium; AP, available phosphorus; AK, available potassium; NH4-N, nitrate; NO3-N, ammonium; ENA, exchangeable sodium ion; CEC, cation exchange capacity; ESP, soil alkalinity. * Indicates significant differences at the 0.05 level; ** indicates significant differences at the 0.01 level.
Disclaimer/Publisher’s Note: The statements, opinions and data contained in all publications are solely those of the individual author(s) and contributor(s) and not of MDPI and/or the editor(s). MDPI and/or the editor(s) disclaim responsibility for any injury to people or property resulting from any ideas, methods, instructions or products referred to in the content.

