Article

Impact of Adding Anaerobic Digestate to Soil and Consequences on Crop Performance

1
School of Biological Science, University of Aberdeen, Aberdeen AB24 3UU, UK
2
BETA Tech Center, University of Vic—Central University of Catalonia, C/de Roda 70, 08500 Vic, Spain
*
Author to whom correspondence should be addressed.
Agronomy 2023, 13(12), 2889; https://doi.org/10.3390/agronomy13122889
Submission received: 20 October 2023 / Revised: 14 November 2023 / Accepted: 18 November 2023 / Published: 24 November 2023

Abstract

:
Anaerobic digestate is proposed as an alternative to inorganic fertilisers, but a better understanding of how anaerobic digestates impact the soil and how plant growth is influenced is needed for wider acceptance. In this study, a series of pot experiments were conducted growing spring barley (Hordeum vulgare L.) in a range of soils with the application of digestate or synthetic fertiliser. Two application rates corresponding to total nitrogen at 120 and 480 kg ha−1 were used together with unfertilised soil as a control. Growth characteristics were measured as plant height, number of tillers, straw biomass, grain biomass and total biomass. Most growth characteristics (tillering, and straw and grain yield) increased with increasing application rates of nitrogen. An increase of 7–20% in plant height was observed with anaerobic digestate compared to synthetic fertilisers. However, results differed depending on the source of digestate and soil type. The nitrogen balance index (the ratio of the chlorophyll to polyphenolic compounds, which is linked to the nitrogen status of the crop) showed an increase of 40–50% for digestate applied at a nitrogen rate of 480 kg ha−1 compared to the control. By measuring nitrogen as ammonium, nitrate and nitrite in the different soils over 35 days, differential nitrogen release was also demonstrated, with soil water concentrations of ammonium decreasing rapidly after an early peak in all the treatments, and nitrate peaking after days 3–4. Results suggest that digestate may be used to replace synthetic fertilisers when applied in a range of soils.

1. Introduction

Anaerobic digestion and composting are increasingly used in Scotland to treat organic wastes, such as food waste [1]. The nutrients in digestate produced from food waste can be returned to agriculture as organic fertilisers. This can reduce the need for inorganic fertilisers [2]. Their use as soil amendments can improve the physical, chemical and biological properties of the soil [3] which can maintain soil quality [4] and reduce fertiliser costs [5]. Consequently, digestate could be a valuable component of sustainable agricultural systems, integrating nutrient management and waste treatment [3].
Field and pot trials report positive impacts of digestate applications on crop yields. For example, in wheat experiments, if digestate was incorporated into the soil immediately after spreading, the yield increased over 20% in comparison with the unamended plots [6]. In barley and ryegrass pot experiments, the digested plant material was as effective as the inorganic fertiliser, showing no yield differences [6,7,8,9]. Yields of forage ryegrass and white clover following application of digestate were observed to be either similar to or exceed the yields with the same amount of nitrogen (N) added as a mineral fertiliser at 27 kg N ha −1, 86 kg N ha −1 and 149 kg N ha −1 [10].
When applying anaerobic digestate to soil, rapid availability of N is expected due to the high content of N in the form of NH4+. However, it has also been observed that highly biodegradable digested materials (digestates from cattle slurry–glycerine mixtures) caused high soil respiration which leads to N immobilisation and denitrification after application to the soil [4]. By contrast, for less biodegradable digested materials, less soil respiration was induced and NH4+ was rapidly nitrified in soil and made available to crops [4]. The application of digestate carries a risk of excess ammonia (NH3) volatilization and/or loss of oxidized forms of N, through nitrate (NO3) leaching or nitrous oxide (N2O) emissions [11]. Moreover, high rates of digestate application may result in phytotoxic levels of NH3 [12].
The present study aims to evaluate the effects of using digestate as fertilisers in soils amended with different sources of digestate. This will be assessed by a range of plant traits to understand (i) which soil factors govern the plant response to digestate amendments and how the plant response to digestate applications changes with soil type, (ii) how digestate amendments affect soils and how different digestates behave in different soils, (iii) how plant responses change over time after the addition of digestate, and (iv) how soil N changes with the addition of digestate.

2. Materials and Methods

2.1. Soil

Soils from five different locations were used in this study: (1) Craibstone, Aberdeen (57.1120 N, 2.1225 W), (2) Insch, Aberdeenshire (57.3518 N, −2.6187 W), (3) Hartwood, Lanarkshire (57.605229 N, −2.318115 W), (4) Pilmore, Perthshire (56.2737 N, 3.0340 W) and (5) Crudie, Aberdeenshire (55.8078857 N, −3.8738236 W). Soil samples were collected from topsoil, 0–15 cm depth, air-dried for a week at 15 °C and passed through a 4 mm sieve. The soil texture class was determined using the hydrometer method [13].

2.2. Anaerobic Digestate

The digestates were collected from two anaerobic digestion plants; one at Glenfarg (Perthshire, UK) and the other at Turiff (Aberdeenshire, UK). Both digestates were characterised by a similar content of dry matter (DM).
The first digestate from Glenfarg, Powerhouse (initial feedstock 20% fish waste, 77% food waste and 3% wastes from grain processing), had an alkaline pH (8.5), an electrical conductivity (EC) of 1.4 µS cm−1, a bulk density of 0.98 g cm−3 and a C/N ratio of 6.4 (information provided by the industry). The feedstock was mainly obtained from food waste from different restaurants and markets.
The second digestate from Turiff, Gaskfarm, which came from a pig farm, used pig slurry and other animal wastes as feedstock (10% pig slurry, 15% cattle stomach content, 30% cattle abattoir dissolved air flotation (DAF) slurry, 25% fish factory DAF slurry, 10% fish mortalities and 10% bakery waste), had a similarly alkaline pH (8.6), an EC of 1.7 µS cm−1, a similar bulk density of 0.92 g cm−3 to the other digestate and a C/N ratio of 8.9 (information provided by the farm).
Digestates were pasteurised at 38 °C for 60 days and 43.5 °C for 40 days for the Powerhouse and Gaskfarm digestates, respectively. Digestates presented a proportion of 5% and 4% dry matter (DM) for the Powerhouse and Gaskfarm, respectively. Both digestates were liquids and were stored in airtight plastic containers (10 dm3 volume).
The total N in the samples was determined by NC analyser [14]. A total of five replicates of 10–12 mg of (after drying) digestate were air-dried in an oven at 40 °C for 24–48 h. An alternative method, Flow Injection Analysis (FIAstar 5000, AN 5246, FOSS) was used to determine total phosphorous (TP) of the soil, plant and digestate.

2.2.1. Experiment 1—Impact of Adding Anaerobic Digestate to Soil on Barley Yield and Elemental Composition

A greenhouse study was performed using 3 L plastic pots containing 2.5 kg of soil with five replicates per treatment. This experiment used Craibstone soil and the Powerhouse digestate. Five treatments were established; control soil without fertiliser, soil with the addition of urea (CH4N2O) and monoammonium phosphate (MAP) (NH4H2PO4) fertiliser at a low N rate (120 kg ha−1; S120) and a high N rate (480 kg ha−1; S480) and digestate at a low N rate (120 kg ha−1; D120) and high N rate (480 kg ha−1; D480). The amounts of digestate and inorganic fertiliser applied were calculated according to the N concentration (Table 1) and based on similar studies from Mortola et al. (2019) [15]. The crop used in this study was spring barley, (Hordeum vulgare L. var. Concerto). For all experiments, seeds were sown in multi-purpose compost in a growing chamber at 20 °C for two weeks with controlled illumination (12 h light, 12 h dark). Seeds were watered three times a week. Seedlings of uniform size were then transplanted to pots in the glasshouse with an average temperature of 23 °C during the day and 13 °C at night. The pots were set out in a complete randomised design. The pots were maintained at a water holding capacity of 80% during the experiment. Plant height and number of tillers were measured every two weeks. Pore water samples were taken from each pot every four weeks using rhizon samplers. The pH and EC were measured in the extracted pore water. Finally, plants were harvested at maturity (142 days). At harvest, the grain and straw were harvested separately. Plants were cut at the soil surface and gently cleaned to remove any soil.
An identical greenhouse study was performed using Insch soil and the Gaskfarm anaerobic digestate. The amount of Gaskfarm digestate and inorganic fertiliser applied were calculated according to the N concentration (Table 2). Plants were harvested at maturity (130 days).

2.2.2. Experiment 2—Impact of Digestate on Barley Production over Six Weeks

A six-week greenhouse study was performed using a fully randomised design, with five replicates per treatment which are the same as those on the experiment 1. The amendment of the soil was carried out by weighing 400 g of soil into each pot (0.5 L) and soils from three different locations were used; Hartwood, Pilmore and Crudie. As for experiments 1 and 2, five treatments were established; control soil without fertiliser, urea and MAP fertiliser at low N rate (120 kg ha−1; S120) and high N rate (480 kg ha−1; S480) and Gaskfarm digestate at low N rate (120 kg ha−1; D120) and high N rate (480 kg ha−1; D480). The amount of digestate and inorganic fertiliser applied were calculated according to the N concentration (Table 1). The ratio of the chlorophyll to polyphenolic compounds, referred to as the Nitrogen Balance Index (NBI), is linked to the nitrogen status of the crop [16]. The NBI was recorded using a Dualex (Dual excitation) instrument (DUALEX® Optical leaf clip meter) in week 6. Plant height and number of tillers were measured every two weeks. Dry biomass of the shoots was measured after 43 days in the glasshouse.

2.2.3. Experiment 3—Soil Nitrogen Dynamics

The effects of applying anaerobic digestate and inorganic fertiliser (urea and MAP) were tested to understand the changes in N species in the soil water in Hartwood, Pilmore and Crudie soils. Three treatments were established; control soil without fertiliser application, urea and MAP fertilisers used at a N rate of 480 kg ha−1 (S480) and digestate at a N rate of 480 kg ha−1 (D480). A total of 36 samples of 50 g fresh soils were placed in tubes. A total of 24.54 mL digestate was added to D480. No water was applied at this rate. A total of 14.6 mL of water, 1.22 mL of 50 g L−1 urea and 0.3 mL of 50 g L−1 MAP was added in the S480 (Table 2). Each treatment was replicated 4 times and was stored in a dark chamber. The temperature in the incubator was set at 20 °C. Tubes were irrigated 2–3 times a week to maintain 80% water holding capacity. The experimental design was completely randomised. A rhizon was placed in each of the soils (and left in place for the duration of the experiment) to extract 5 mL of pore water on each sampling day. Sampling took place on days 1, 2, 3, 4, 5, 7, 14, 21, 28 and 35. Concentrations of NH4+, nitrate (NO3) and nitrite (NO2) in the pore water extract were determined colorimetrically (see Section 2.3.2).

2.3. pH, EC, Nitrogen and Carbon Analysis

Soil pH (Thermo Scientific Orion 3 Star, Waltham, MA, USA) and EC (Mettler Toledo LE703) were measured in experiment 1 and 2 every month, using fresh soil extracted from pots with a 5 cm diameter soil corer. Soil water solutions were prepared at a 1:5 ratio.
Soil and plant total C and N were determined using a NCS analyser (Carlo Erba Instruments—NA 2500 Series). A total of 4–8 mg of plant sample or 9–11 mg of soil was measured. Hay powder (BCR-129) was used as plant reference material. CRM NCSZC 73001 and CRM NCSZC 73007 were used as soil reference material,

2.3.1. Measurement of Total Nitrogen and Phosphorus in Soil and Plant

Flow Injection Analysis (FIAstar 5000, AN 5246, FOSS) was used to determine total phosphorous (TP) of the digestate in the experiment 1. Samples were digested according to Kjeldahl method (ISO 5663 [17]) using selenium as a catalyst and sulphuric acid. The N concentration was then determined according to the amount of ammonium in the sample. A total of 10 mL was added to each sample of an indicator stock solution made with 0.01 M NaOH and 10 mL of (95% w/v) ethanol in a carrier solution of 1 Kjeltab S 3.5 in 5% v/v H2SO4 and 3.5 M of NaOH for a total of 2% v/v. The concentration of TP was determined using a sulfuric acid medium. A total of 4.8% v/v H2SO4; ammonium molybdate reagent 1% w/v ammonium molybdate and 3.5% v/v H2SO4; 0.02% w/v of stannous chloride, 2.8% v/v H2SO4 and 0.2% v/v of DEHA; 1.5 M of NaOH at a 6% w/v; KH2PO4 at 0.4% w/v; and finally, a rinsing solution made with 6.5% w/v of NaOH and 0.6% w/v of Na2-EDTA was used for each sample. A total of 3 blanks and 3 certified reference material (CRM DC73319-Certified Value 0.735 mg Tot P g−1 and 1.87 mg Tot N g−1) were added to the samples run. Peak height areas were calculated. Total N concentrations were measured at wavelengths of 590 nm. Total P concentrations were measured at wavelengths of 720 nm.

2.3.2. Determination of Ammonium, Nitrate and Nitrite in Soil Pore Water Samples

Ammonium in the porewater samples was measured using the modified indophenol green method (following the protocol of the Analytical Services Unit, 2012). A total of 100 µL of the soil pore water sample, 50 µL of colour reagent (1 M sodium salicylate and 15 µM sodium nitroprusside) and 20 µL of 0.1% (w/v) dichloroisocyanuric acid sodium salt dihydrate were added into the wells of a 96-well plate. A total of 5 standards of KCl (10, 25, 50, 100 and 250 µM), and a blank (0 µM) were used to generate the calibration graph. Three replicates per sample were included. After a 30-min incubation at room temperature, the colour intensity was measured at 620 nm.
Measurements of NO2 and NO3 were obtained using the modified Klett-Summerson photoelectric colorimeter method. The analysis was conducted in two stages. The first determined the concentrations of NO3 and NO2 as one analytical parameter. The second stage determined the concentration of only NO2. This method was performed on a 96-well plate. The NO2 content was measured using a total of 50 µL of soil pore water sample, 60 µL of 5% sulphanilamide in 3.3 M HCl (w/v) and 20 µL of 0.3% N-(1-naphthyl)-ethylenediamine in 0.12 M HCl (w/v). A total of 6 standards (10, 25, 50, 100, 150 and 200 µM), a blank (0 µM) and 3 replicates per sample were included in every well plate. The colour intensity was measured immediately at 540 nm. Afterwards, the NO3 content was measured by adding 20 µL of 7% vanadium chloride in 1 M HCl (w/v) and incubating the plate at 35 °C incubators for 120 min. The colour intensity was also measured at 540 nm. The NO3 concentration was calculated by subtracting the NO2 concentration from the combined NO2 and NO3 concentrations.

2.3.3. Measurement of Calcium, Magnesium and Potassium Content of Soils and Plants

Nitric acid digestion was used to digest plant and soil material. A total of 2.5 mL HNO3 (70% w/w) and 2.5 mL H2O2 (30% w/w) were added to each sample (0.100–0.200 g). A total of 7 blanks and 3 controls were used in every digestion (CRM NCSZC 73001, NCS ZC 73002 and CRM NCSZC 73007 for soil and CRM NCSZC 7300 for plants with CRM values for Ca, Mg and K, respectively, 5680 ± 165 mg/kg, 1530 ± 54.2 mg/kg and 7670 ± 204 mg/kg). Samples were digested for 1 h at 100 °C, then for 1 h at 120 °C and finally at 140 °C for 2 h. Samples were made up to 50 mL using deionized water. Microwave plasma atomic emission spectrometry was used to determine the Ca, Mg and K concentrations at wavelengths of 422.673, 383.829 and 769.897 nm, respectively (MP-AES Agilent 4100).

2.4. Statistical Analysis

The total soil N data and measurements of height, tillers and nutrients over time were analysed using a general linear model with repeated measures. For the biomass data, one-way ANOVA was used. For multiple comparisons, Fisher’s test procedure was used. The statistical software package IBM SPSS (IBM SPSS Statistics for Windows, Version 19.0. Armonk, NY, USA: IBM Corp.) was used.
Soil properties were analysed using repeated measures to assess the effect of treatments, sampling time and their interaction on tested soil variables. Comparisons between different treatments were conducted using a Fisher test. A three-way ANOVA was used to compare time, soil type and digestate amendment for the N species using repeated measures (NH4+, NO2 and NO3). For multiple comparison tests, a Fisher’s test was used.

3. Results

The physicochemical properties of the soils and digestates used during the trials were characterised and are presented in the following Table 3 and Table 4, respectively.

3.1. Application of Powerhouse Digestate to Soil—Experiment 1

3.1.1. Plant Growth

No significant difference in the final plant height (p > 0.05) was observed between treatments (Supplementary Figure S1). A significant difference (p < 0.01) in the numbers of tillers and straw biomass was found, with higher tillering in the D120 treatment (23 tillers) (Supplementary Figure S2) compared to the unfertilised control (six tillers); straw biomass was significantly higher in D480 than in D120; and all treatments had significantly higher biomass than the unfertilised control. Similarly, a significant increase (p < 0.01) was observed in the grain biomass in the treatments over the unfertilised control, but with no significant difference between the grain biomass produced when N was applied as digestate or fertiliser.

3.1.2. Soil Properties

No significative difference was observed between treatments in soil pH or EC (p > 0.05) in the experiment where the Powerhouse digestate was used. The mean soil pH was 6.1, 5.8, 5.1, 5.7 and 4.9 for the control, D120, D480, S120 and S480, respectively. The mean EC was 0.73, 0.612, 0.896, 0.5525, 1.15 µS/cm for the control, D120, D480, S120 and S480, respectively.

3.1.3. Concentration of Elements in Plant Material

Potassium (K) concentration in the grain was significantly different between the control and the treatments, with the control having the highest K concentration, followed by S480, S120, D120 and D480 (with no significant differences between treatments). By contrast, there was a significant difference in magnesium (Mg) in the grain just between the control and the treatments, with highest Mg concentration in S480, followed by S120, D120, D480 and the control. There was a significant difference between treatments (p < 0.01) in the concentration of Ca in the straw. The highest concentration of Ca was observed in S480, followed by D480, D120, S120 and the control. There were no significant differences between treatments for the grain concentration of calcium (Ca). The concentrations of K and Mg in the straw were not significantly different (p > 0.05) between treatments (Table 5).

3.2. Application of Gaskfarm Digestate to Soil—Experiment 1

3.2.1. Plant Growth

No differences in plant height (p > 0.05) were observed due to the application of fertiliser to the soil (Supplementary Figure S3). A significant difference (p < 0.01) in tiller numbers between treatments was observed. Plants grown under treatment D480 had significantly more tillers (23 tillers) (Supplementary Figure S4) than S480 and control treatments, and plants grown under treatment S120 (22) and D120 (14) had significantly more tillers than plants grown in treatment S480 (five tillers) or the control (three tillers). A significant difference (p < 0.01) between treatments for straw biomass was found, with higher straw biomass observed in the plants grown under D480 than in S120 or D120, which was higher than S480 or the control. For grain biomass, no significant difference (p > 0.05) was observed between treatments D480 and S120, but otherwise the trends were the same as for the straw biomass. A significantly lower value of grain biomass (p < 0.01) was observed for S480 compared to all other treatments including the control, but there was no significant difference between the other treatments.

3.2.2. Soil Properties

A significant decrease in soil pH (p < 0.01) was observed for treatments D480, S120 and S480 (pH values of 5.4, 5.3 and 4.2, respectively) compared to the control and treatment D120 in the Gaskfarm experiment (pH values of 6.0 and 5.9, respectively). For soil EC the only a significant difference was an increase of ~30% between treatment D480 (EC 0.523) and treatments D120, S120 and the control (p < 0.05) (EC values of 0.348, 0.665 and 0.341 µS/cm, respectively), with other treatments not being statistically different from each other.

3.2.3. Concentration of Elements in Plant Material

There was a significant difference between the Ca concentration in the grain between the different treatments (p < 0.05), with the highest content in S480, followed by D120, D480, control and S120 (Table 6). However, there was no significant different in the concentration of K or Mg in the grain (p > 0.05) between treatments.
There was also no significant difference in the concentration of Ca or Mg in the straw between treatments (p > 0.05). However, there was a significant difference in the concentration of K in straw (p < 0.05), with highest concentration in D480, followed by S120, D120, control and S480.

3.3. Impact of Anaerobic Digestate (Using Gaskfarm Digestate) in a Range of Soils—Experiment 2

There was no significant effect of treatments or soil types on final plant height (p > 0.05). However, there was a significant difference for the interaction between soil type and treatment (p < 0.01). Significant differences in the numbers of tillers were observed between treatments and soil types (p < 0.01). A significant interaction was observed between soil type and treatment (p < 0.01). Plants grown on the Hartwood soil had a higher number of tillers in D480 (six tillers), followed by D120 (five tillers), S120 (four tillers), control (four tillers) and S480 (three tillers). Plants grown on the Pilmore soil had a higher number of tillers in D480 (nine tillers) than the other treatments. Plant grown on the Crudie soil had a higher number of tillers in D480 (10 tillers), control (seven tillers), S120 (six tillers), D120 (five tillers) and S480 (four tillers). A significantly higher number of tillers was observed in D480 in Pilmore and Crudie soils when compared to the rest of the treatments (Control, D120, S120 and S480).
For straw biomass, a significant increase over the control at six weeks (p < 0.05) was only observed in Hartwood D120 and D480, and Pilmore S120 (Figure 1). No significant effect on straw biomass of soil type or interaction between treatments and soil type was observed (p > 0.05).
The TN in the straw showed no significant differences between soil types (p > 0.05). However, a significant interaction was observed between soil type and treatment (p < 0.05).
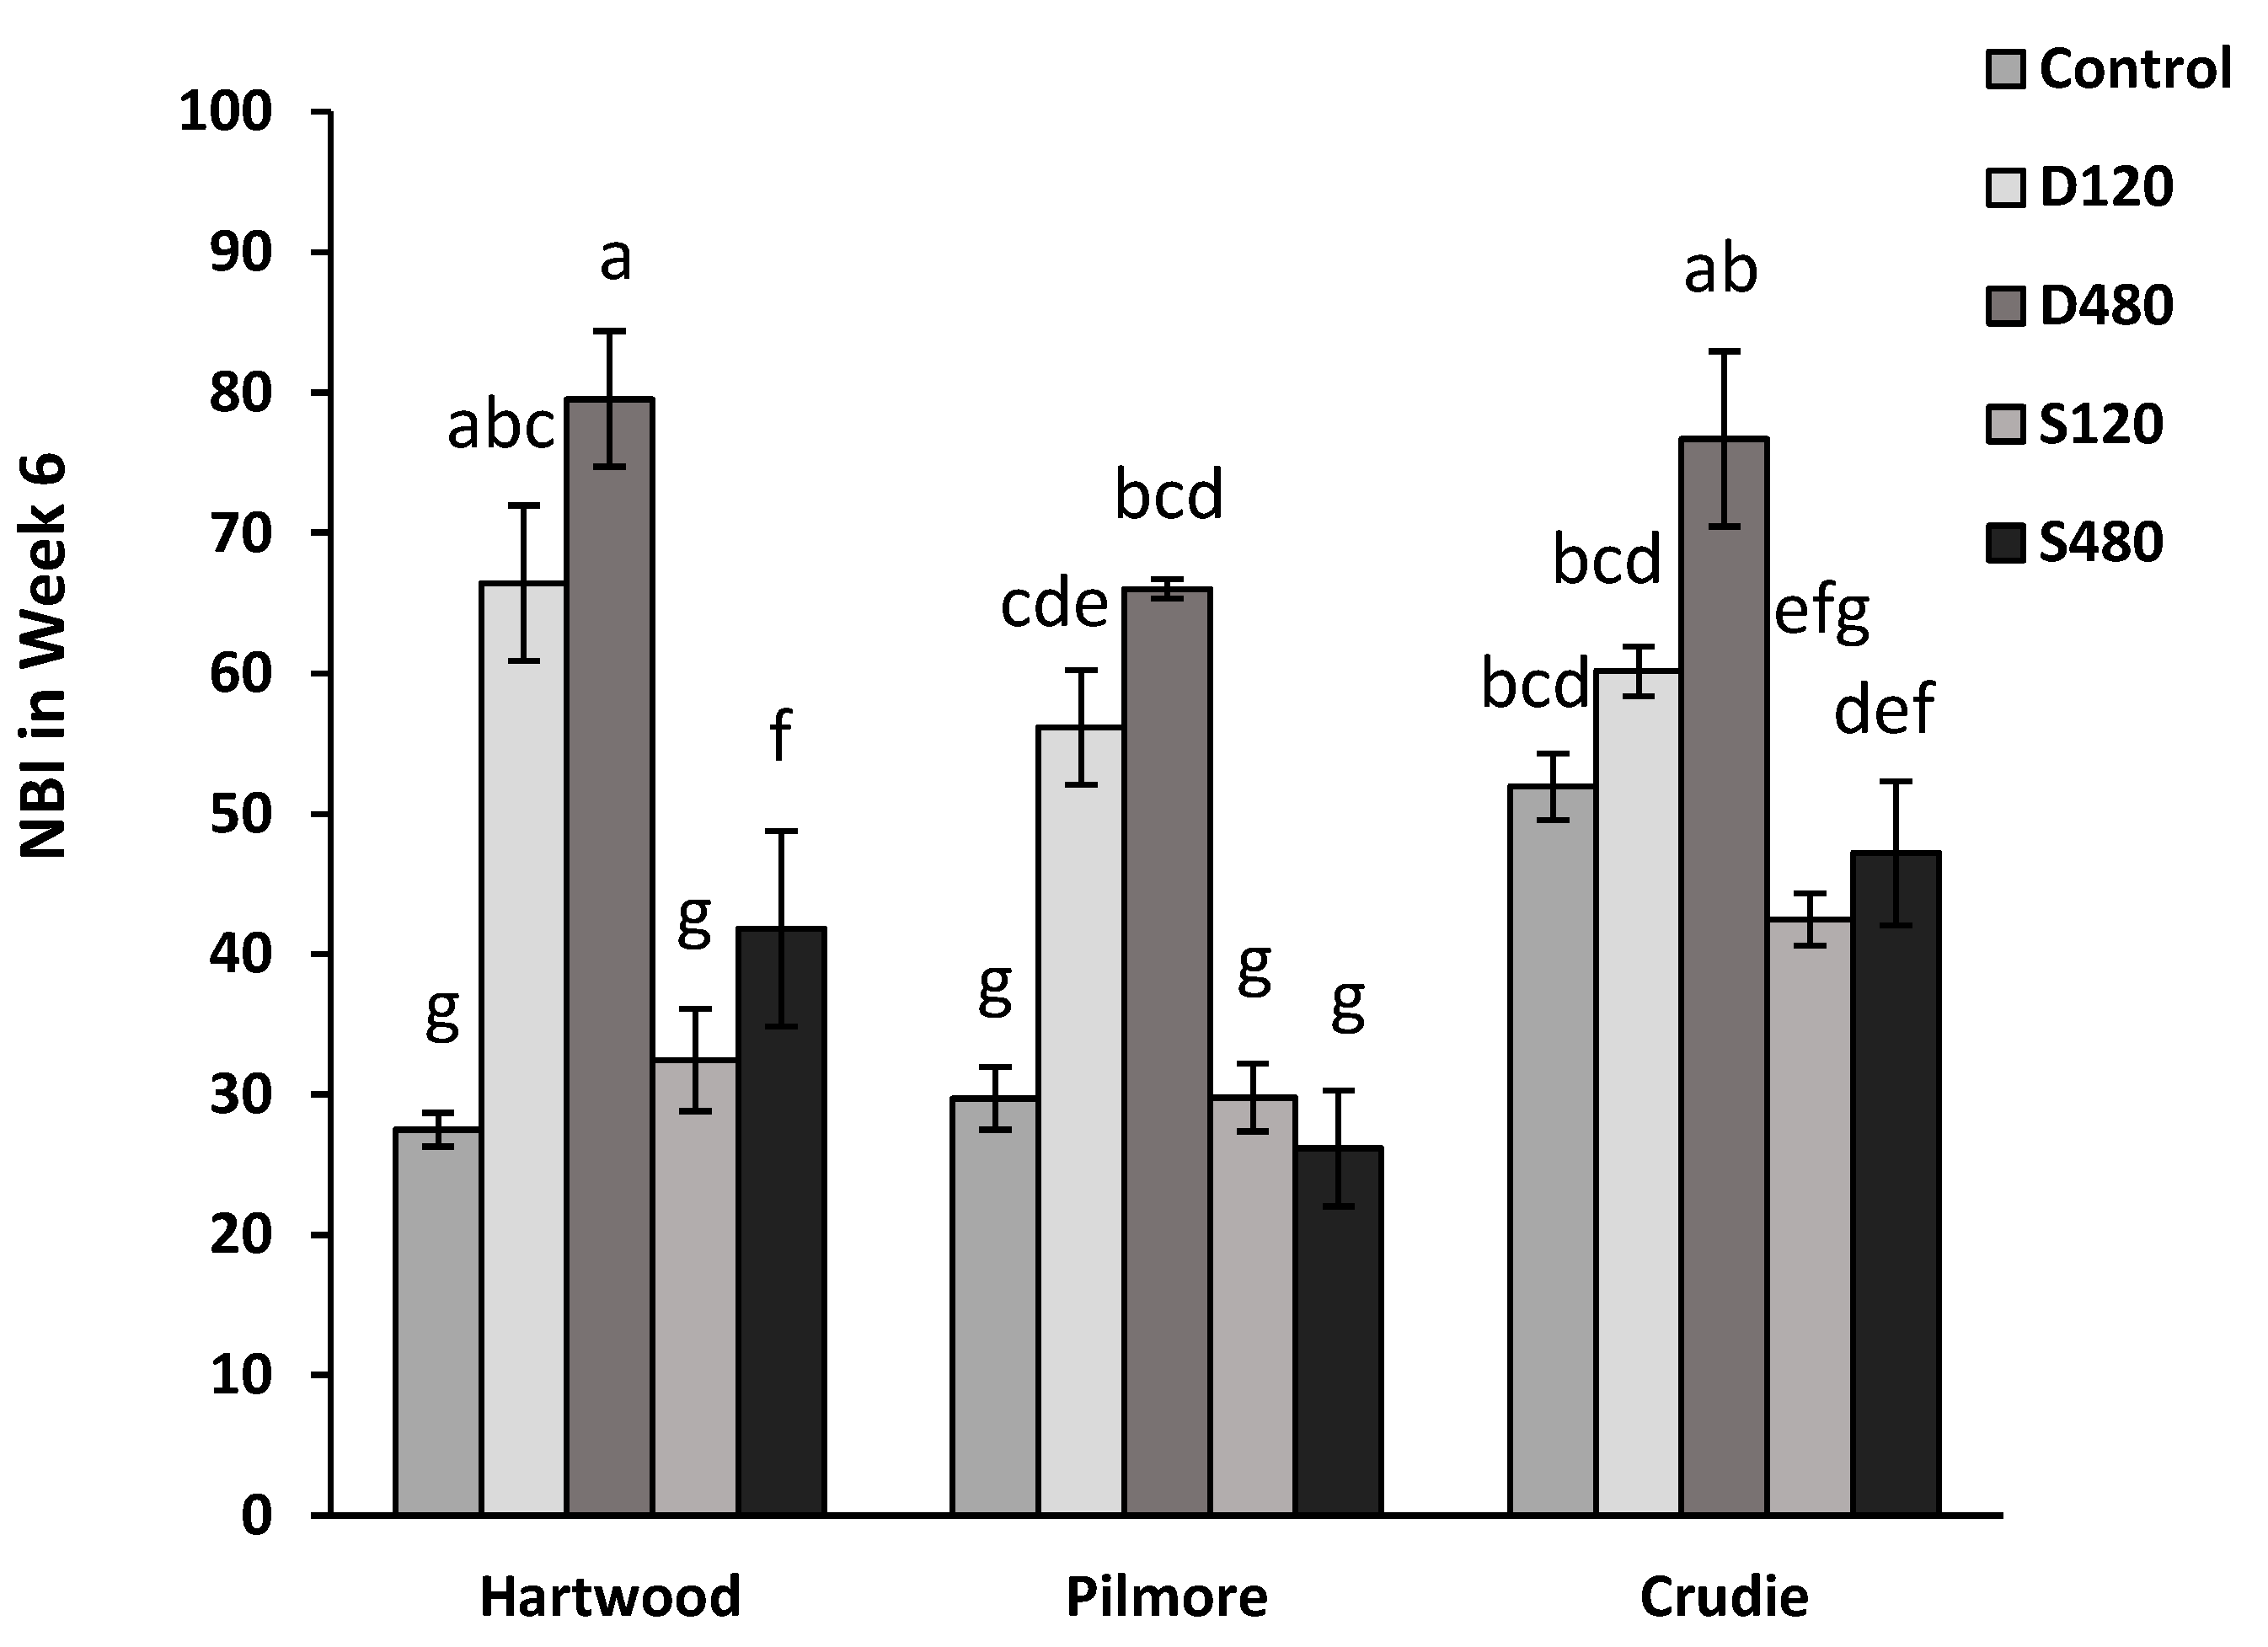
The NBI (Nitrogen Balance Index) was found to be significantly different across digestate/fertiliser treatments (p < 0.01) and soils (p < 0.05) in week 6 of the experiment (Figure 2). Plants grown on the Hartwood soil had a significant increase in NBI over the control in week 6 in treatments D120, D480 and S120, with the digestate treatments being significantly higher than the synthetic fertiliser. For plants grown on the Pilmore soil, the increase was only significant for the digestate treatments (D480 and D120), and for plants grown on the Crudie soil it was only significant in D480.
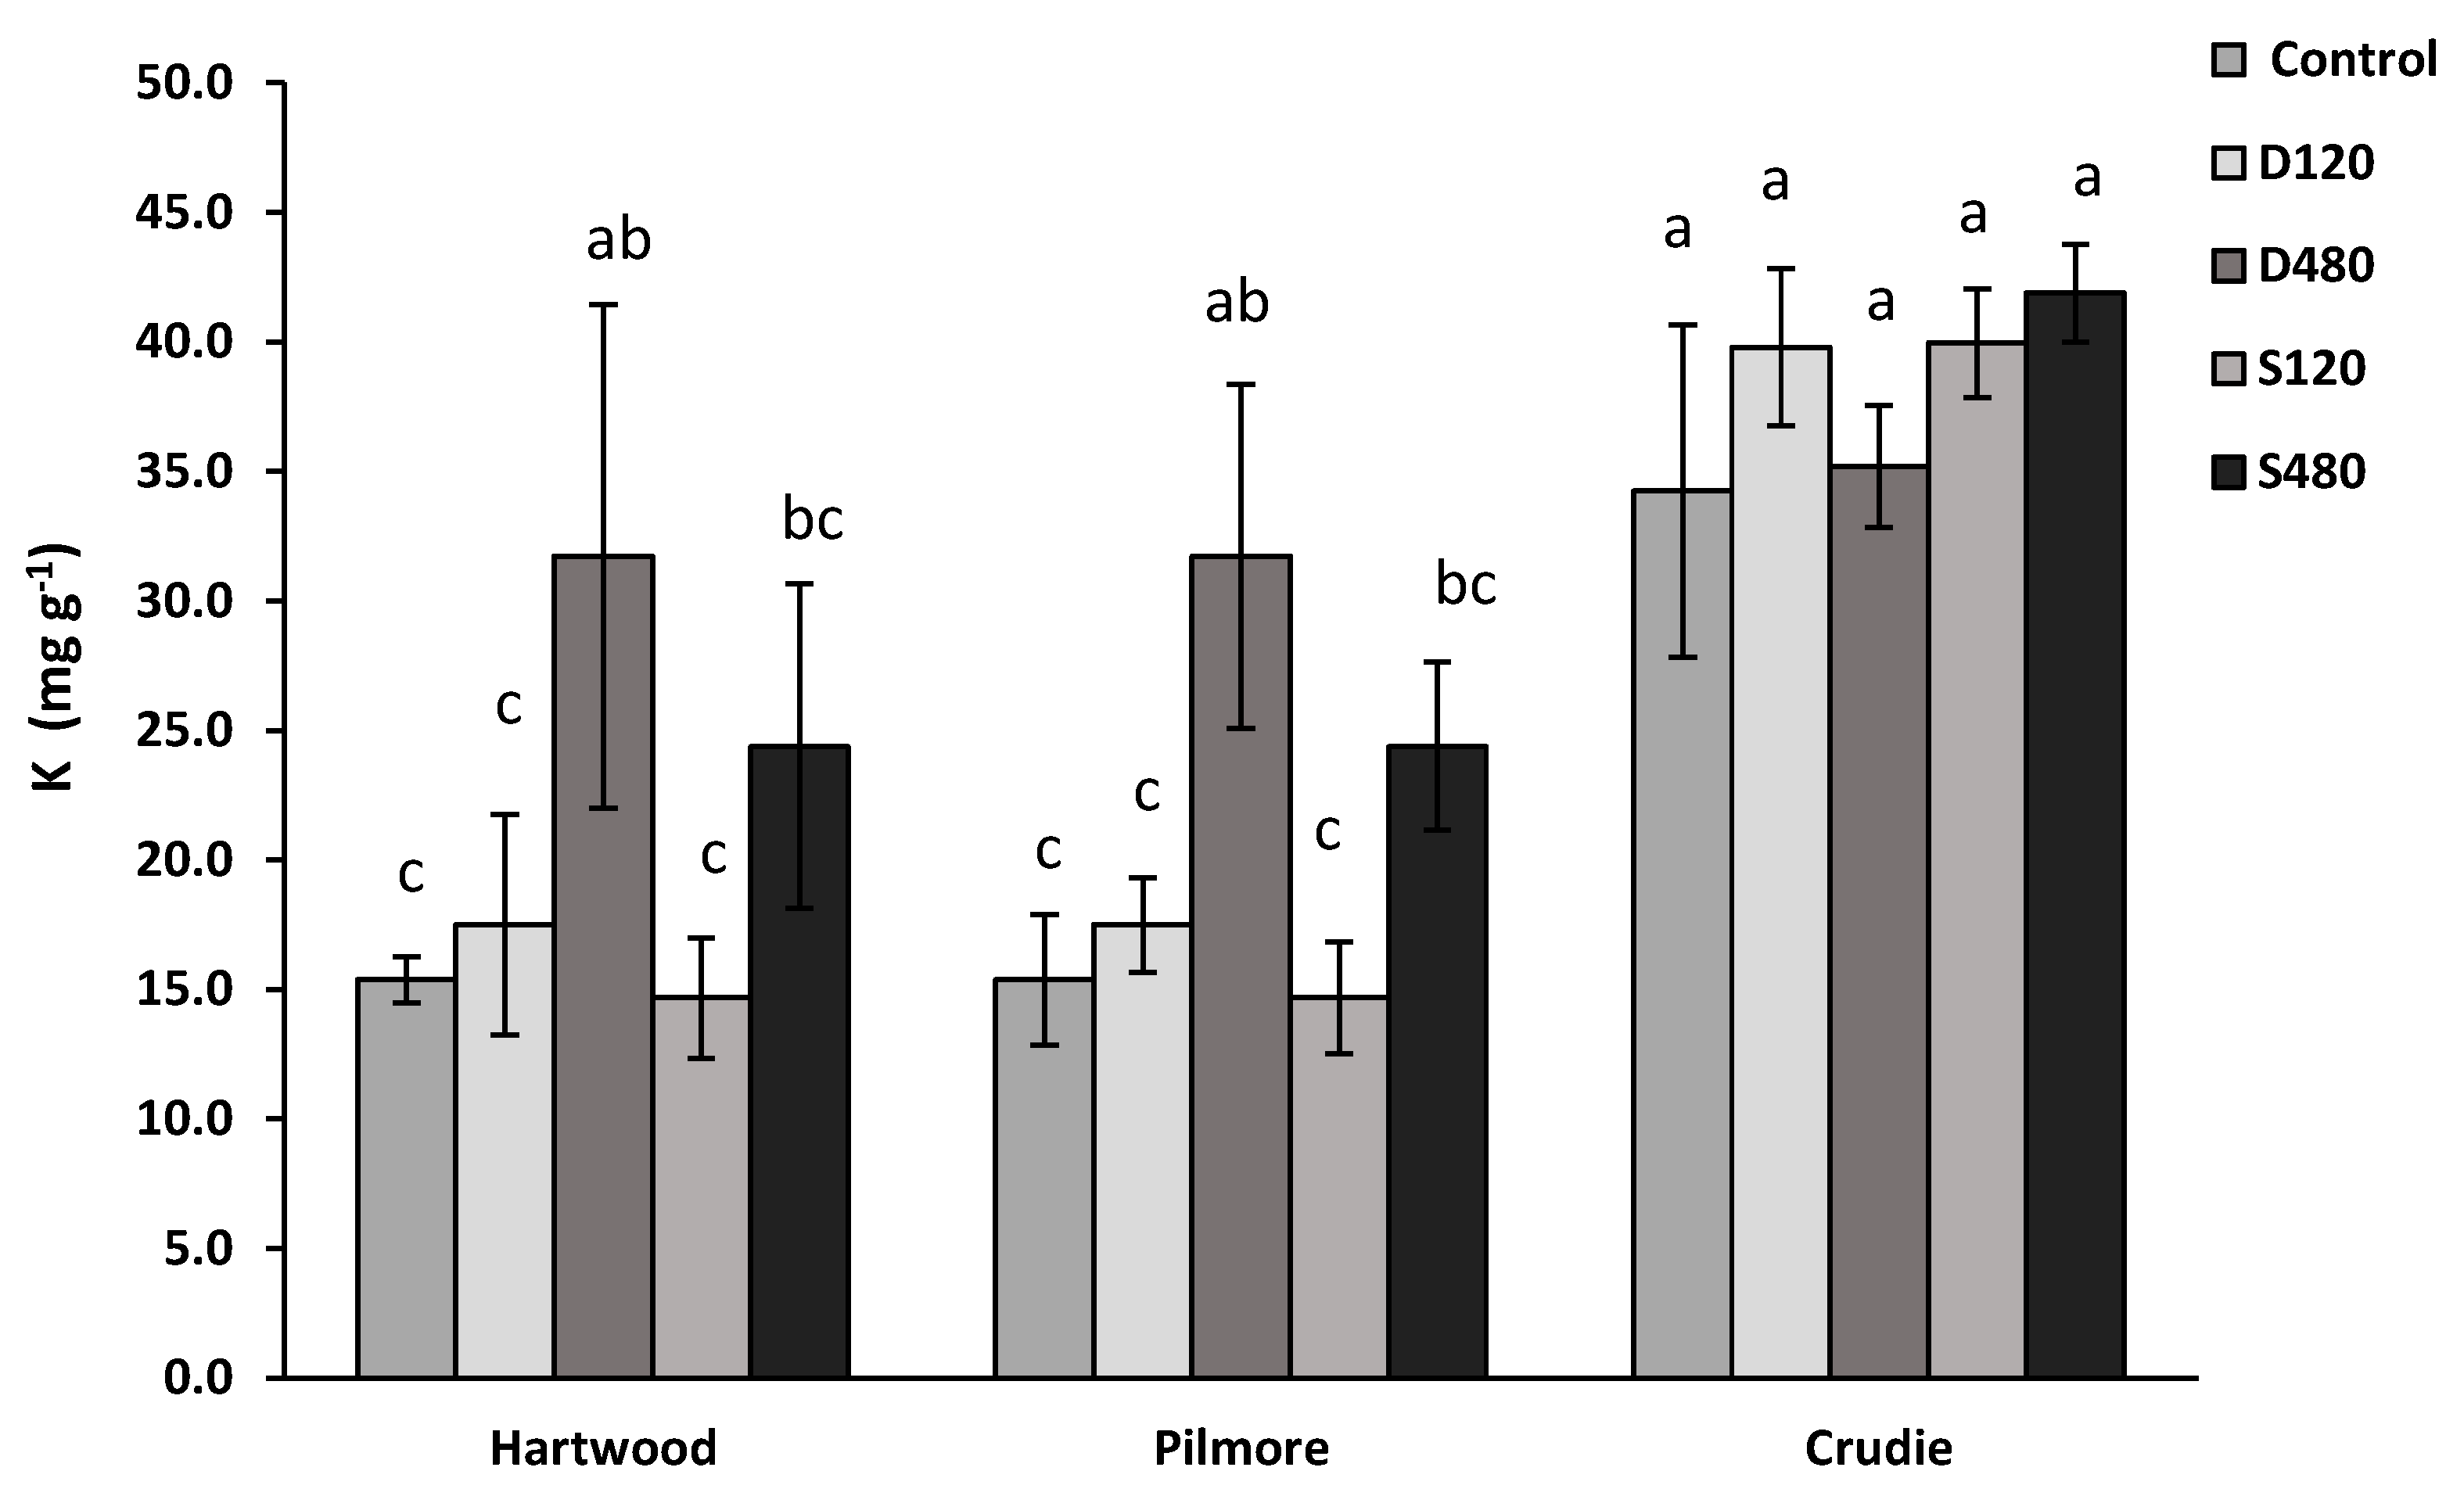
The concentration of Ca in the straw (Figure 3) was not significantly different due to treatment, soil type or their interaction. However, K in straw (Figure 4) was significantly different across soil types (p < 0.01) but not between treatments (p > 0.05); also, there was no significant interaction between soil type and treatment (p < 0.05). The concentration of Mg in the straw (Figure 5) was not significantly different between treatments (p > 0.05) or soil types (p > 0.05), and there was no significant interaction between soil type and treatment.

3.4. Soil Nitrogen Dynamics—Experiment 3

3.4.1. Ammonium

After achieving peak values (Day 1 in Pilmore and Crudie or Day 2 in Hartwood) of NH4+ concentration in the pore water, there was a gradual decrease in concentration after five days (Figure 6). The NH4+ levels remained very low (<1.5 mg L−1) throughout the 35 days of incubation. The soils treated with urea and MAP showed a similar concentration of NH4+ to the control (<0.6 mg L−1) in Pilmore and Crudie soils.
There were no significant differences in NH4+ pore water concentrations between soils, days or between treatments (p > 0.05). Pore water NH4+ concentrations from Pilmore and Crudie soils were significantly different to Hartwood soils. A significant interaction in pore water NH4+ concentrations was found between treatments and soils (p < 0.01); on average across all days the control soils had different concentrations compared to the D480 or S480 treatment. There was a significant difference (p < 0.01) between the D480 and control when compared with the treatments. No significant differences were found on days 14, 21, 28 or day 35 (p > 0.05) for pore water NH4+ concentrations. There was a no significant difference (p > 0.05) in NH4+ concentrations between different soils and times.

3.4.2. Nitrite

The concentration of NO2 in the pore water was found to be low (below 2 mg L−1) in all the samples. The concentration of NO2 in the pore water were not significantly different between soils, days and treatments (p > 0.05). The concentration in controls were not significantly different (p > 0.05) from the D480 or S480 treatments. The NO2 pore water concentration in Pilmore soil was significantly different (p < 0.01) to Crudie and Hartwood soils. The differences in concentration were significant between days 1, 2, 4 and 14 (p < 0.01, p < 0.01, p < 0.05 and p < 0.01, respectively). There was no significant difference in the concentration between soils and days. The NO2 concentration was higher after two weeks and decreased until week 4, where the plateau started. The NO2 concentration in control was <0.25 mg L−1, while in S480 it was <0.9 mg L−1 and in D480 it was <1.6 mg L−1.

3.4.3. Nitrate

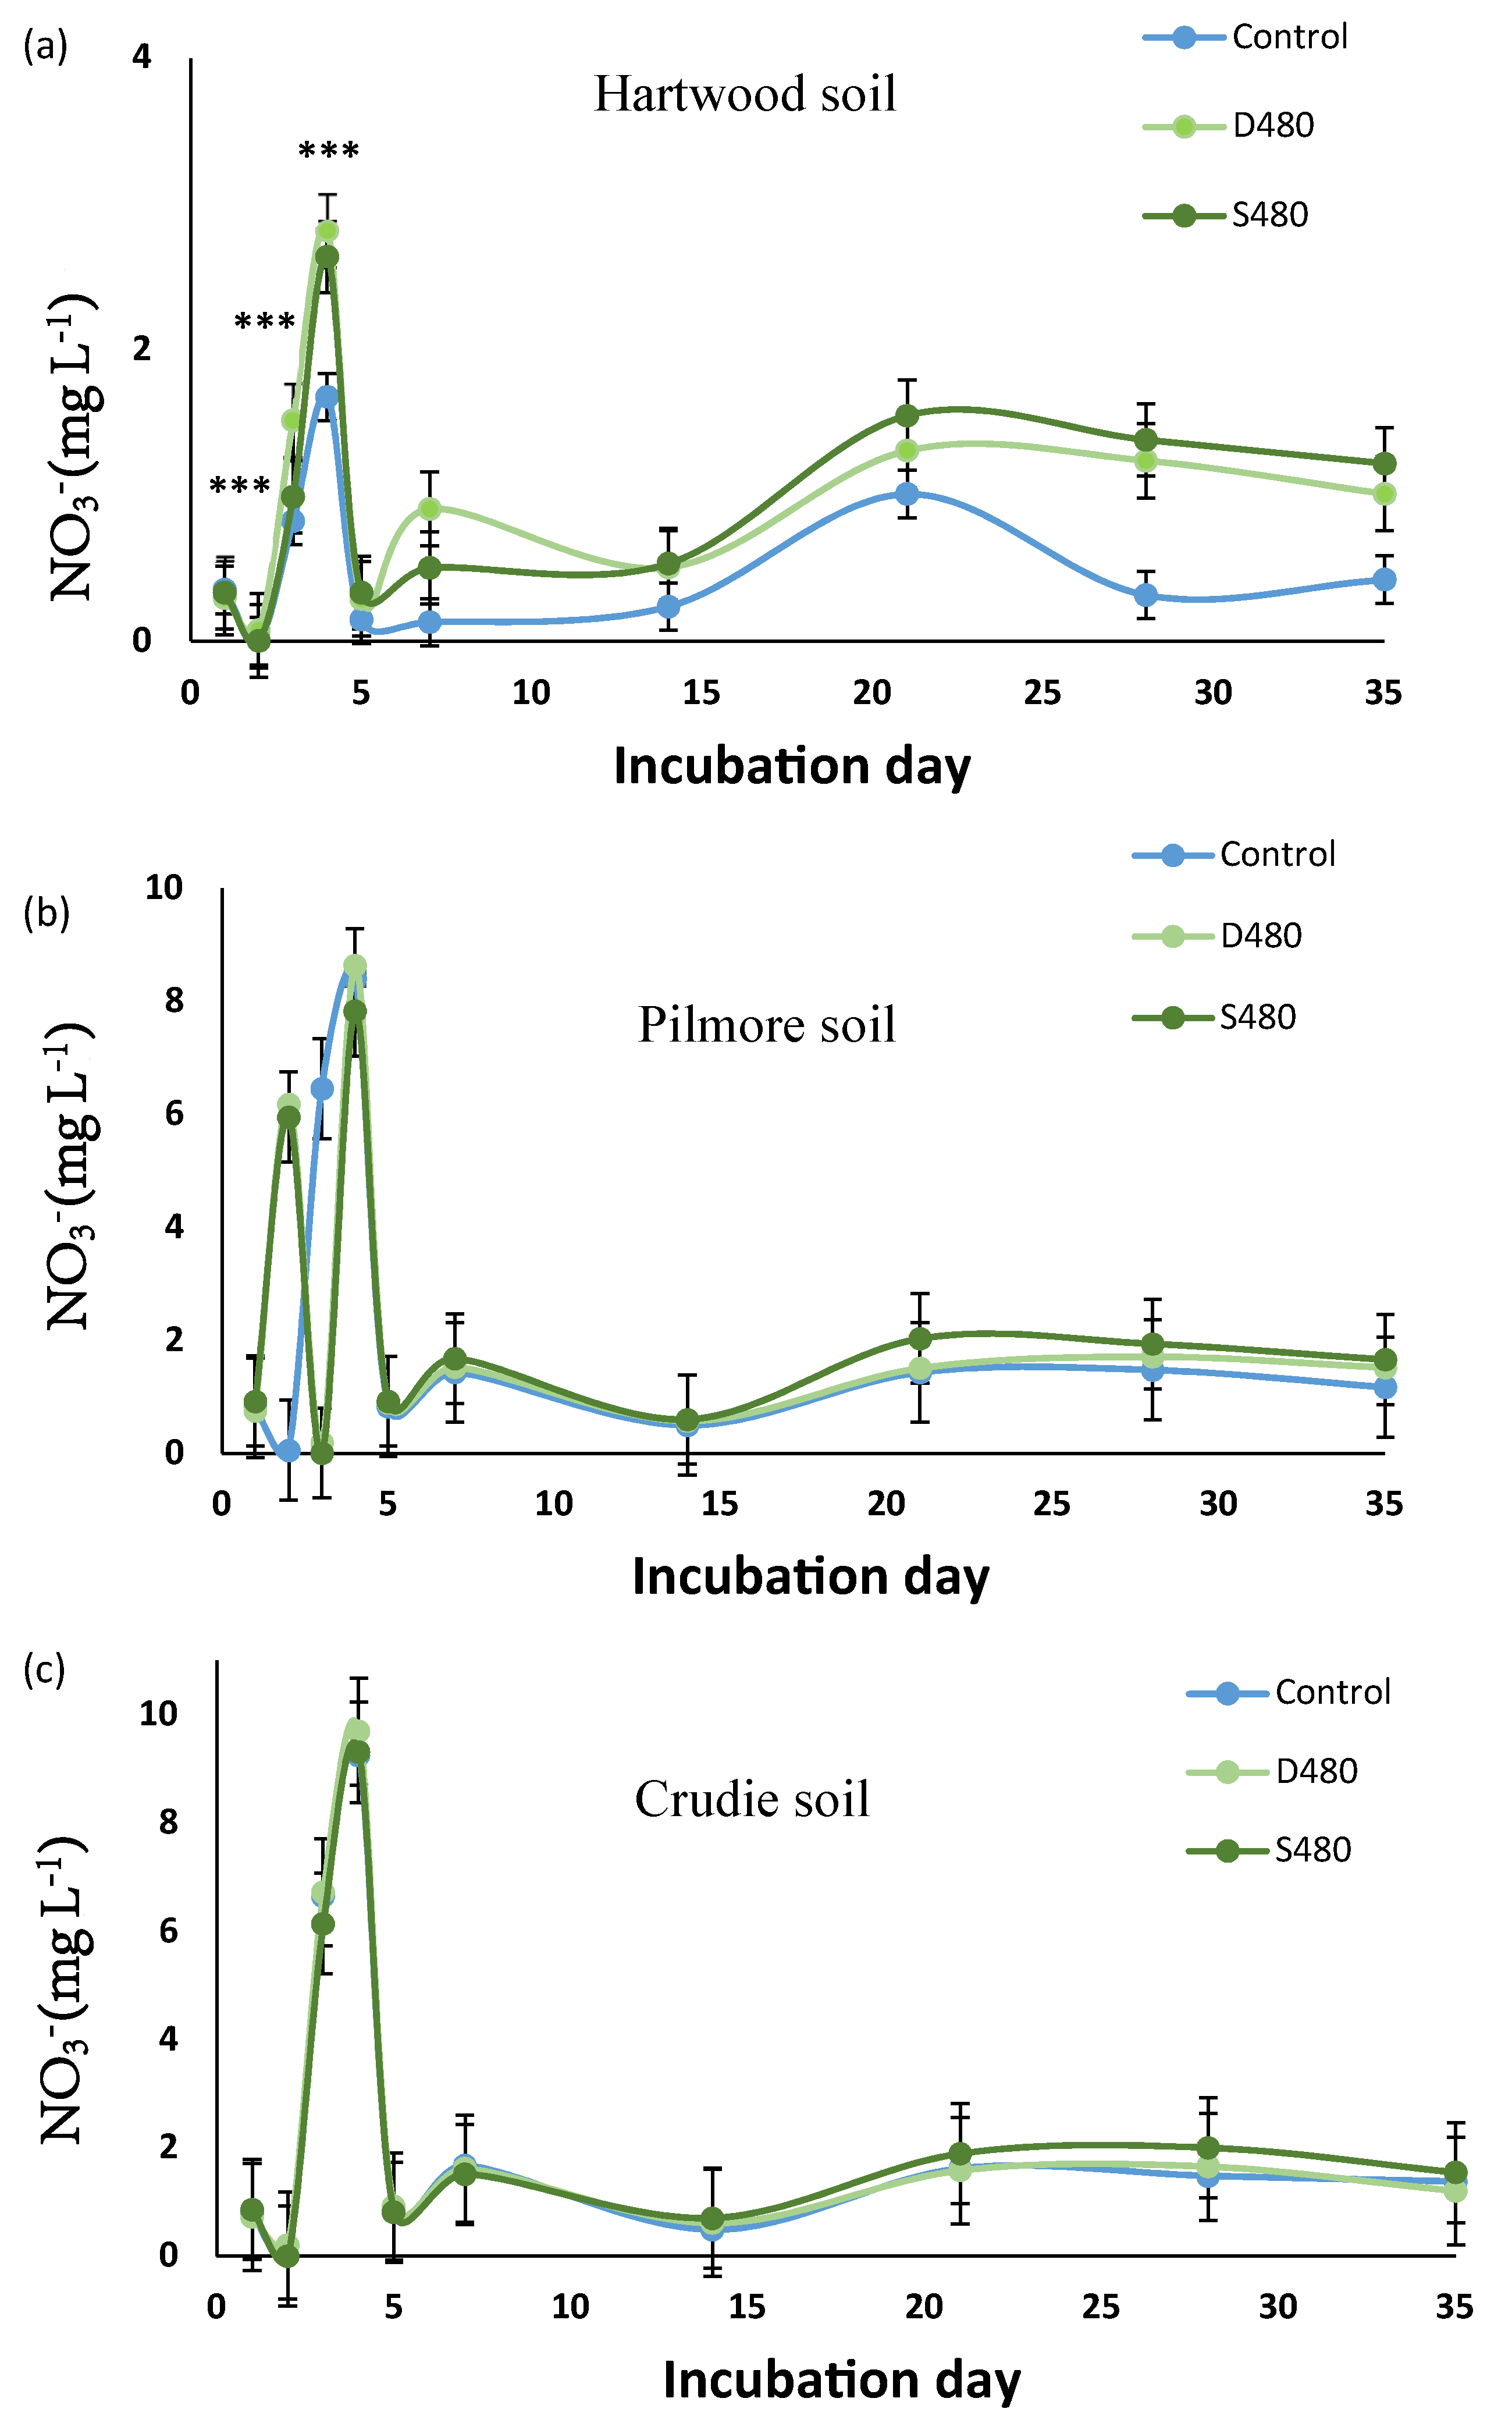
A similar trend to NH4+ was observed for pore water NO3 concentration. The NO3 concentration increased after day 3, with a maximum peak on day 4, decreasing on day 5. For pore water NO3 concentration, there were no significant differences in the interaction between soil types and days and treatments (p > 0.05). There was a significant difference in NO3 concentrations of pore water from the Hartwood soil compared to Pilmore and Crudie (p < 0.01) across soils and time. Days 2, 3, and 4 resulted in non-significant differences in pore water NO3 (Figure 6). After 1–2 days, the concentration was similar for all the treatments, but after day 3, the concentrations went up further and decreased on day 5. After 3 weeks, NO3 concentration in the pore water increased slowly in all the treatments. The NO3 concentrations in the soil pore water were below 10 mg L−1 in all the samples.

4. Discussion

4.1. Impacts of High Applications of Digestate

In all experiments, there was no significant impact on plant height or grain yield of applying the N as digestate rather than as synthetic fertiliser (Table 7). This suggests that these traits were not limited by the form of N delivered to the plant (i.e., there was sufficient available N even when it was applied as digestate) when compared to a synthetic nitrogen source, and there was no benefit achieved by the supply of other macro and micro-nutrients to the crop by the digestate (even if significant increases were observed in the concentration of other nutrients in the plants grown on digestate-amended soils (Table 5). The significant increase in plant height over the (unfertilised) control is as expected due to the increased availability of N to the crop). Other authors have also observed increased plant height over the control and similar values between the different forms of N when the N required by the plant was applied as digestate or as synthetic fertiliser [18]. Similarly, no significant impacts on biomass yield compared to synthetic fertilisers were observed, for example in leeks [19,20], Chinese cabbage or lettuces [21]. Others observed digestates sourced from food wastes produced similar or even up to 40% increase in yields of wheat and ryegrass compared to synthetic fertilisers, perhaps due to deficiencies in other nutrients in the specific soils studied, which were supplied by the digestates [22,23,24]. Hansen et al. (2004) [25] found that application of manure generated similar N uptake and a good yield response with barley. Barłóg et al. (2019) [26] found higher grain yields, and improved grain quality was observed after the application of digestate in spring barley. In all experiments, except for experiment 1, there was a significant increase in number of tillers when N was applied as digestate compared to synthetic fertiliser. This suggests that number of tillers was limited by the form of the N delivered to the plant with benefits from macro and micro-nutrients supplied to the crop in the digestate. The type of N fertiliser was also observed to affect the density of tillers and stimulated stem growth in another experiment [27]. In all soils, there was a significant increase in number of tillers over the control, again as expected due the increased availability of N to the crop. Some chemical and physical properties of soil that are important in controlling the response to digestate include water holding capacity, pH and EC. Those factors will be affected directly by the anaerobic digestion and the final product, the digestate. Overall, the findings suggest that in some soils there can be significant positive impacts on crop growth of providing the N required as digestate instead of synthetic fertiliser, but this may not be reflected in increases in grain yield if N supplied by the synthetic fertiliser is sufficient. In all experiments except for experiment 1, a significant increase was observed in the N concentration in the plant N over synthetic fertiliser. Similar increases in N concentration with application of N as digestate were observed by [28]. The impacts of using digestate rather than synthetic fertiliser on the concentrations of Ca, K and Mg in the grain and straw were negative or non-significant in all cases except for straw Mg in experiment 1. This may be due to the increased growth stimulated by the digestate, resulting in dilution of the available Ca, K and Mg in the plant; it also suggests the plant is receiving limited benefits from the digestate supply of these micronutrients.

4.2. Impact of Lower Applications of Digestate

At the lower N rate, there was a significant increase in plant height over the control only in experiment 1. At the lower N rate, using digestate compared to synthetic fertiliser resulted in a significant decrease in tiller numbers in experiment 1. This suggests that number of tillers was limited by the form of the N delivered to the plant at this lower rate. There was a significant increase in number of tillers over the control (except in experiment 2), as expected, due the increased availability of N to the crop. Again, in contrast to the higher rate, there was no impact of type of N on the straw biomass or harvest index in any of the experiments, and there was no significant increase over the control in experiment 2, suggesting a reduced impact on straw production at the lower rate of application. This was reflected in non-significant differences in HI.
In contrast to the higher rate, there was no significant increase in N concentration when N was applied as digestate compared to synthetic fertiliser in any of the experiments, and there was a significant drop in the concentration of N. The impacts of using digestate rather than synthetic fertiliser on the concentrations of Ca, K and Mg in the grain and straw were zero or non-significant in all cases, except for the straw Mg in experiment 1. As for the higher rate, this suggests the crop was getting limited benefits from the micronutrients contained in the digestate, although this was insufficient to have a negative impact on crop growth or yield. Similar findings have been reported by other authors [4].
Overall, the findings suggest that at the lower rate, the positive impacts on crop growth of providing the N required as digestate instead of synthetic fertiliser are reduced, and in some aspects of crop growth the effects are negative, potentially due to the N being in a less available form, and therefore N could be limiting.

4.3. The Interaction between Treatment and Soil Characteristics on Crop Growth

The multiple soil experiment (experiment 2) was designed to see if plants grown on different soils responded to the same anaerobic digestate treatment in different ways. Significant interaction in terms of plant height, number of tillers, total nitrogen accumulation and biomass were found. This interaction indicates that the response of plants to the same treatment is influenced by the soil. This is crucial to understanding the suitability of anaerobic digestate across multiple soils with different physiochemical properties; the present findings should not be extrapolated to all soil types and field conditions, however, the current work adds further evidence as to the potential value of digestate and the impact of soil properties on the plant response to digestate, with the caveat that the response is likely to be variable based on soil properties. Further studies are needed for a better understanding of the parameters responsible for the interaction due to the limited number of soils tested in this study.

4.4. Nitrate Leaching

Sufficient N is needed for optimum crop production, whereas excessive fertiliser applications can increase the cost of production and risk NO3 leaching. Nitrogen availability from applied N sources must be known for the efficient management of N inputs. The process of release of organic N sources involves biological decomposition, the N availability being controlled by chemical composition [29] and soil environment [30]. No significant differences were found when adding a synthetic fertiliser and/or digestate. However, significant differences between soils were found, with a soil effect in Hartwood soil different to the other two soils. Hartwood was the only clay sandy loam soil, while the rest are sandy or sandy loam soils.
The NH4+ concentration was observed to decrease rapidly in all the treatments after the start of the incubation. This rapid decline may be due to ammonia volatilization or nitrification of NH4+. A large decrease in NH4+ was also observed in other experiments and was independent of soil properties and amount of biomass added [4]. The most critical barrier for using digestates as a direct commercial fertiliser is the instability in NH4+ and the potential volatilisation of ammonia. Untreated digestates usually have a pH of around 7.5 to 8.5. At these above-neutral pH values, ammonia volatilisation is favoured. However, Odlare et al. (2008) [31] did not find significant changes in the pH of soils when applying digestate. A similar answer was found in our experiments when using Powerhouse digestate. No significative difference was observed between treatments in soil pH or EC (p > 0.05). However, a significant decrease in soil pH (p < 0.01) was observed for treatments D480, S120 and S480 compared to the control and treatment D120 in the Gaskfarm experiment.
Using NH4+ as the only N source for plants can also lead to acidification. Nitrification of the digestate before application to the soil would be a potential method towards stabilising the N and making the digestate more suitable for soil incorporation. Nitrification converts NH4+ into NO3 which is less volatile in the soil, although highly mobile and so could potentially increase NO3 leaching. The initial ammonia spike is short lived and the concentration of NH4+ in the pore water drops quickly; increased NH4+ concentration in the pore water was only observed up to the middle incubation times.
In the pore water taken from the Hartwood soils, there was an increased peak of NO3 (in both the digested and fertiliser amended soil), indicating that nitrification was occurring withal in this soil compared to the other soils. Increases in the NO2 concentration in the pore water were observed in the digestate treatments but not in the fertiliser treatment. Under optimal soil conditions, the response to mineral N fertiliser application was very fast, resulting in a high rate of nitrification.
The NH4+ concentration in the water collected from the Hartwood and Crudie soils was significantly different from Pilmore, potentially due to a difference in soil pH. As the ammonium increases, the pH decreases due to the fertiliser potential. However, the pH from these results seems to be unlikely to provide different biological processes due to the similar acidic nature of the soils used are in a pH range of 5–6.

4.5. Conclusions

This research measured the impacts on N dynamics of adding digestate compared to adding the same amount of N in synthetic fertiliser in a range of soils. At N application rates that were higher than recommended for synthetic fertilisers, most experiments showed either a significant increase or no significant difference in yield and plant biomass production with digestate compared to synthetic fertiliser. At the recommended N rate, significantly higher yields were observed with the digestate from Powerhouse than with synthetic fertiliser, while the Gaskfarm digestate resulted in lower yields. This suggests that, to avoid possible yield reductions due to a proportion of N in the digestate being unavailable to the crop, a slightly higher rate of N application may be required for digestate than for synthetic fertilisers (the percentage of total N that is in plant available form is 74 (±27)% for Powerhouse and only 36 (±11)% for Gaskfarm—see Table 4). Digestate is presented as an alternative to synthetic fertilisers and could also be used as a substitute for compost, but to avoid increased N pollution of the wider environment there is an urgent need for a system to predict the availability of N from the digestate and further release of N over time, and to recommend the optimum rate of digestate application. The results suggest that replacing synthetic fertilisers with digestate could maintain or improve yields and may ultimately reduce agricultural dependence on inorganic fertilisers and the energy and economic costs associated with their use.

Supplementary Materials

The following supporting information can be downloaded at: https://www.mdpi.com/article/10.3390/agronomy13122889/s1.

Author Contributions

Conceptualization, J.H.-S.; methodology, J.H.-S.; software, J.H.-S.; validation, J.H.-S.; formal analysis, J.H.-S.; investigation, J.H.-S.; resources, J.H.-S.; data curation, J.H.-S.; writing—original draft preparation, J.H.-S.; writing—review and editing, J.H.-S., J.S. and G.J.N. All authors have read and agreed to the published version of the manuscript.

Funding

This study was funded by The LEVERHULME TRUST (Grant DS-2017-073). Juana Hallat-Sanchez, a Leverhulme Trust Doctoral Scholar, is part of the 15 PhD scholarships of the “Leverhulme Centre for Doctoral Training in Sustainable Production of Chemicals and Materials” at the University of Aberdeen (Scotland, UK).

Data Availability Statement

Data is contained within the article or Supplementary Material.

Acknowledgments

This study has been carried out thanks to the funding of the Leverhulme CDT. The authors also acknowledge Andrew for providing the digestate from his farm (Gaskfarm) and the other owners of the digestate (Powerhouse). This study was supported by the University of Aberdeen, UK. The authors thank Michael McGibbon for his technical assistance.

Conflicts of Interest

The authors declare no conflict of interest.

References

  1. SEPA. Scottish Environment Protection Agency. The Waste (Scotland) Regulations 2012. 2012. Available online: https://www.legislation.gov.uk/ssi/2012/148 (accessed on 23 June 2022).
  2. Walsh, J.J.; Rousk, J.; Edwards-Jones, G.; Jones, D.L.; Williams, A.P. Fungal and bacterial growth following the application of slurry and anaerobic digestate of livestock manure to temperate pasture soils. Biol. Fertil. Soils 2012, 48, 889–897. [Google Scholar] [CrossRef]
  3. Tampio, E.; Tapio, S.; Rintala, J. Agronomic characteristics of five different urban waste digestates. J. Environ. Manag. 2016, 169, 293–302. [Google Scholar] [CrossRef] [PubMed]
  4. Alburquerque, J.A.; De la Fuente, C.; Bernal, M.P. Chemical properties of anaerobic digestates affecting C and N dynamics in amended soils. Agric. Ecosyst. Environ. 2012, 160, 15–22. [Google Scholar] [CrossRef]
  5. Sigurnjak, I.; Vaneeckhaute, C.; Michels, E.; Ryckaert, B.; Ghekiere, G.; Tack, F.M.G.; Meers, E. Fertiliser performance of liquid fraction of digestate as synthetic nitrogen substitute in silage maise cultivation for three consecutive years. Sci. Total Environ. 2017, 599, 1885–1894. [Google Scholar] [CrossRef]
  6. Stinner, W.; Deuker, A.; Leithold, G. Effects of different manuring systems with and without biogas digestion on nitrogecycle and crop yield in mixed organic dairy farming systems. Nutr. Cycl. Agroecosyst. 2008, 82, 209–232. [Google Scholar]
  7. Gunnarsson, A.; Bengtsson, F.; Caspersen, S. Use efficiency of nitrogen from biodigested plant material by ryegrass. J. Plant Nutr. Soil Sci. 2010, 173, 113–119. [Google Scholar] [CrossRef]
  8. Bougnom, B.P.; Niederkofler, C.; Knapp, B.A.; Insam, H. Residues from renewable energy production: Their value for fertilising pastures. Biomass Bioenergy 2012, 39, 290–295. [Google Scholar] [CrossRef]
  9. Möller, K.; Müller, T. Effects of anaerobic digestion on digestate nutrient availability and crop growth: A review. Eng. Life Sci. 2012, 12, 242–257. [Google Scholar] [CrossRef]
  10. Coelho, J.J.; Hennssy, A.; Casey, I.; Woodcock, T.; Kennedy, N. Responses of ryegrass, white clover, soil plant primary macronutrients and microbial abundance to application of anaerobic digestates, cattle slurry and inorganic N-fertiliser. Appl. Soil Ecol. 2019, 144, 112–122. [Google Scholar] [CrossRef]
  11. Nicholson, F.A.; Bhogal, A.; Rollett, A.; Taylor, M.; Williams, J.R. Precision application techniques reduce ammonia emissions following food-based digestate applications to grassland. Nutr. Cycl. Agroecosyst. 2018, 110, 151–159. [Google Scholar] [CrossRef]
  12. Van der Eerben, L.J.M.; de Visser, P.H.B.; van Dijk, C.J. Risk of damage to crops in the direct neighborhood of ammonia sources. Environ. Pollut. 1998, 102, 49–53. [Google Scholar] [CrossRef]
  13. Beretta, A.N.; Silbermann, A.V.; Paladino, L.; Torres, D.; Bassahun, D.; Musselli, R.; García-Lamohte, A. Soil texture analyses using a hydrometer: Modification of the Bouyoucos method. Cienc. Investig. Agrar. 2014, 41, 263–271. [Google Scholar] [CrossRef]
  14. Analytical Services Unit, Departament of Plant and Soil Science, School of Biological Sciences, University of Aberdeen: Aberdeen, UK, 2021. Available online: https://www.abdn.ac.uk/study/undergraduate/degree-programmes/828/CD27/plant-and-soil-science/ (accessed on 23 June 2022).
  15. Mortola, N.; Romaniuk, R.; Consenstino, V.; Eiza, M.; Carfagno, P.; Rizzo, P.; Bres, P.; Riera, N.; Roba, M.; Dutti, M.; et al. Potential Use of a Poultry Manure Digestate as a Biofertiliser: Evaluation of Soil Properties and Lactuca sativa Growth. Pedosphere 2019, 29, 60–69. [Google Scholar] [CrossRef]
  16. Cerovic, Z.G.; Cartelat, A.; Goulas, Y.; Meyer, S.; Stafford, J. In-the-Field Assessment of Wheat-Leaf Polyphenolics Using the New Optical Leaf-Clip Dualex; Stafford, J.V., Ed.; Precision Agriculture ‘05, 43-250; Wageningen Academic Publishers: Wageningen, The Netherlands, 2005. [Google Scholar]
  17. ISO 5663; Water Quality-Determination of Kjeldahl Nitrogen—Method after Mineralisation with Selenium. ISO: Geneva, Switzerland, 1984.
  18. Maddonni, G.A.; Otegui, M.E. Intra-specific competition in maize: Early establishment of hierarchies among plants affects final kernel set. Field Crops Res. 2004, 85, 1–13. [Google Scholar] [CrossRef]
  19. Ross, D.J.; Tate, K.R.; Speir, T.W.; Stewart, D.J.; Hewitt, A.E. Influence of biogas-digester effluent on crop growth and soil biochemical properties under rotational cropping. N. Z. J. Crop Hortic. Sci. 1989, 17, 77–87. [Google Scholar] [CrossRef]
  20. Bath, B.; Elfstrand, S. Use of Red Clover-Based Green Manure in Leek Cultivation. Biol. Agric. Hortic. 2008, 25, 269–286. [Google Scholar] [CrossRef]
  21. De Jager, M.; Giani, L. An investigation of the efects of hydrochar application rate on soil amelioration and plant growth in three diverse soils. Biochar 2021, 3, 349–365. [Google Scholar] [CrossRef]
  22. Abubaker, J.; Risberg, K.; Pell, M. Biogas residues as fertilisers—Effects on wheat growth and soil microbial activities. Appl. Energy 2012, 99, 126–134. [Google Scholar] [CrossRef]
  23. Haraldsen, T.K.; Andersen, U.; Krogstad, T.; Sørheim, R. Liquid digestate from anaerobic treatment of source separated household waste as fertiliser for barley. Waste Manag. Res. 2011, 29, 1271–1276. [Google Scholar] [CrossRef]
  24. Rigby, H.; Smith, S.R. The nitrogen fertiliser value and other agronomic benefits of industrial biowastes. Nutr. Cycl. Agroecosyst. 2014, 98, 137–154. [Google Scholar] [CrossRef]
  25. Hansen, D.J.; Blackmer, A.M.; Mallarino, A.P.; Wuebker, M.A. Performance-based evaluations of guidelines for nitrogen fertilizer application after animal manure. Agron. J. 2004, 96, 34–41. [Google Scholar]
  26. Barłóg, P.; Hlisnikovský, L.; Kunzová, E. Yield, content and nutrient uptake by winter wheat and spring barley in response to applications of digestate, cattle slurry and NPK mineral fertilizers. Arch. Agron. Soil Sci. 2019, 66, 1481–1496. [Google Scholar] [CrossRef]
  27. George, J.R.; Obermann, D. Spring defoliation to improve summer supply and quality of switchgrass. Agron. J. 1989, 81, 47–52. [Google Scholar] [CrossRef]
  28. Calderon, M.P.; Alburquerque, J.A.; Bustamante, M.A.; Carrillo, R.C. Guide for Agricultural Use of Digested Materials by Biomethanization; PSE: Madrid, Spain, 2011. (In Spanish) [Google Scholar]
  29. Rowell, D.M.; Prescott, C.E.; Preston, C.M. Decomposition and nitrogen mineralisation from biosolids and other organic materials: Relationship with initial chemistry. J. Environ. Qual. 2001, 30, 1401–1410. [Google Scholar] [CrossRef]
  30. Cookson, W.R.; Cornforth, I.S.; Rowarth, J.S. Winter soil temperature (2–15 C) effects on nitrogen transformations in clover green manure amended or unamended soils; a laboratory and field study. Soil Biol. Biochem. 2002, 34, 1401–1415. [Google Scholar] [CrossRef]
  31. Odlare, M.; Pell, M.; Svensson, K. Changes in soil chemical and microbiological properties during 4 years of application of various organic residues. Waste Manag. 2008, 28, 1246–1253. [Google Scholar] [CrossRef]
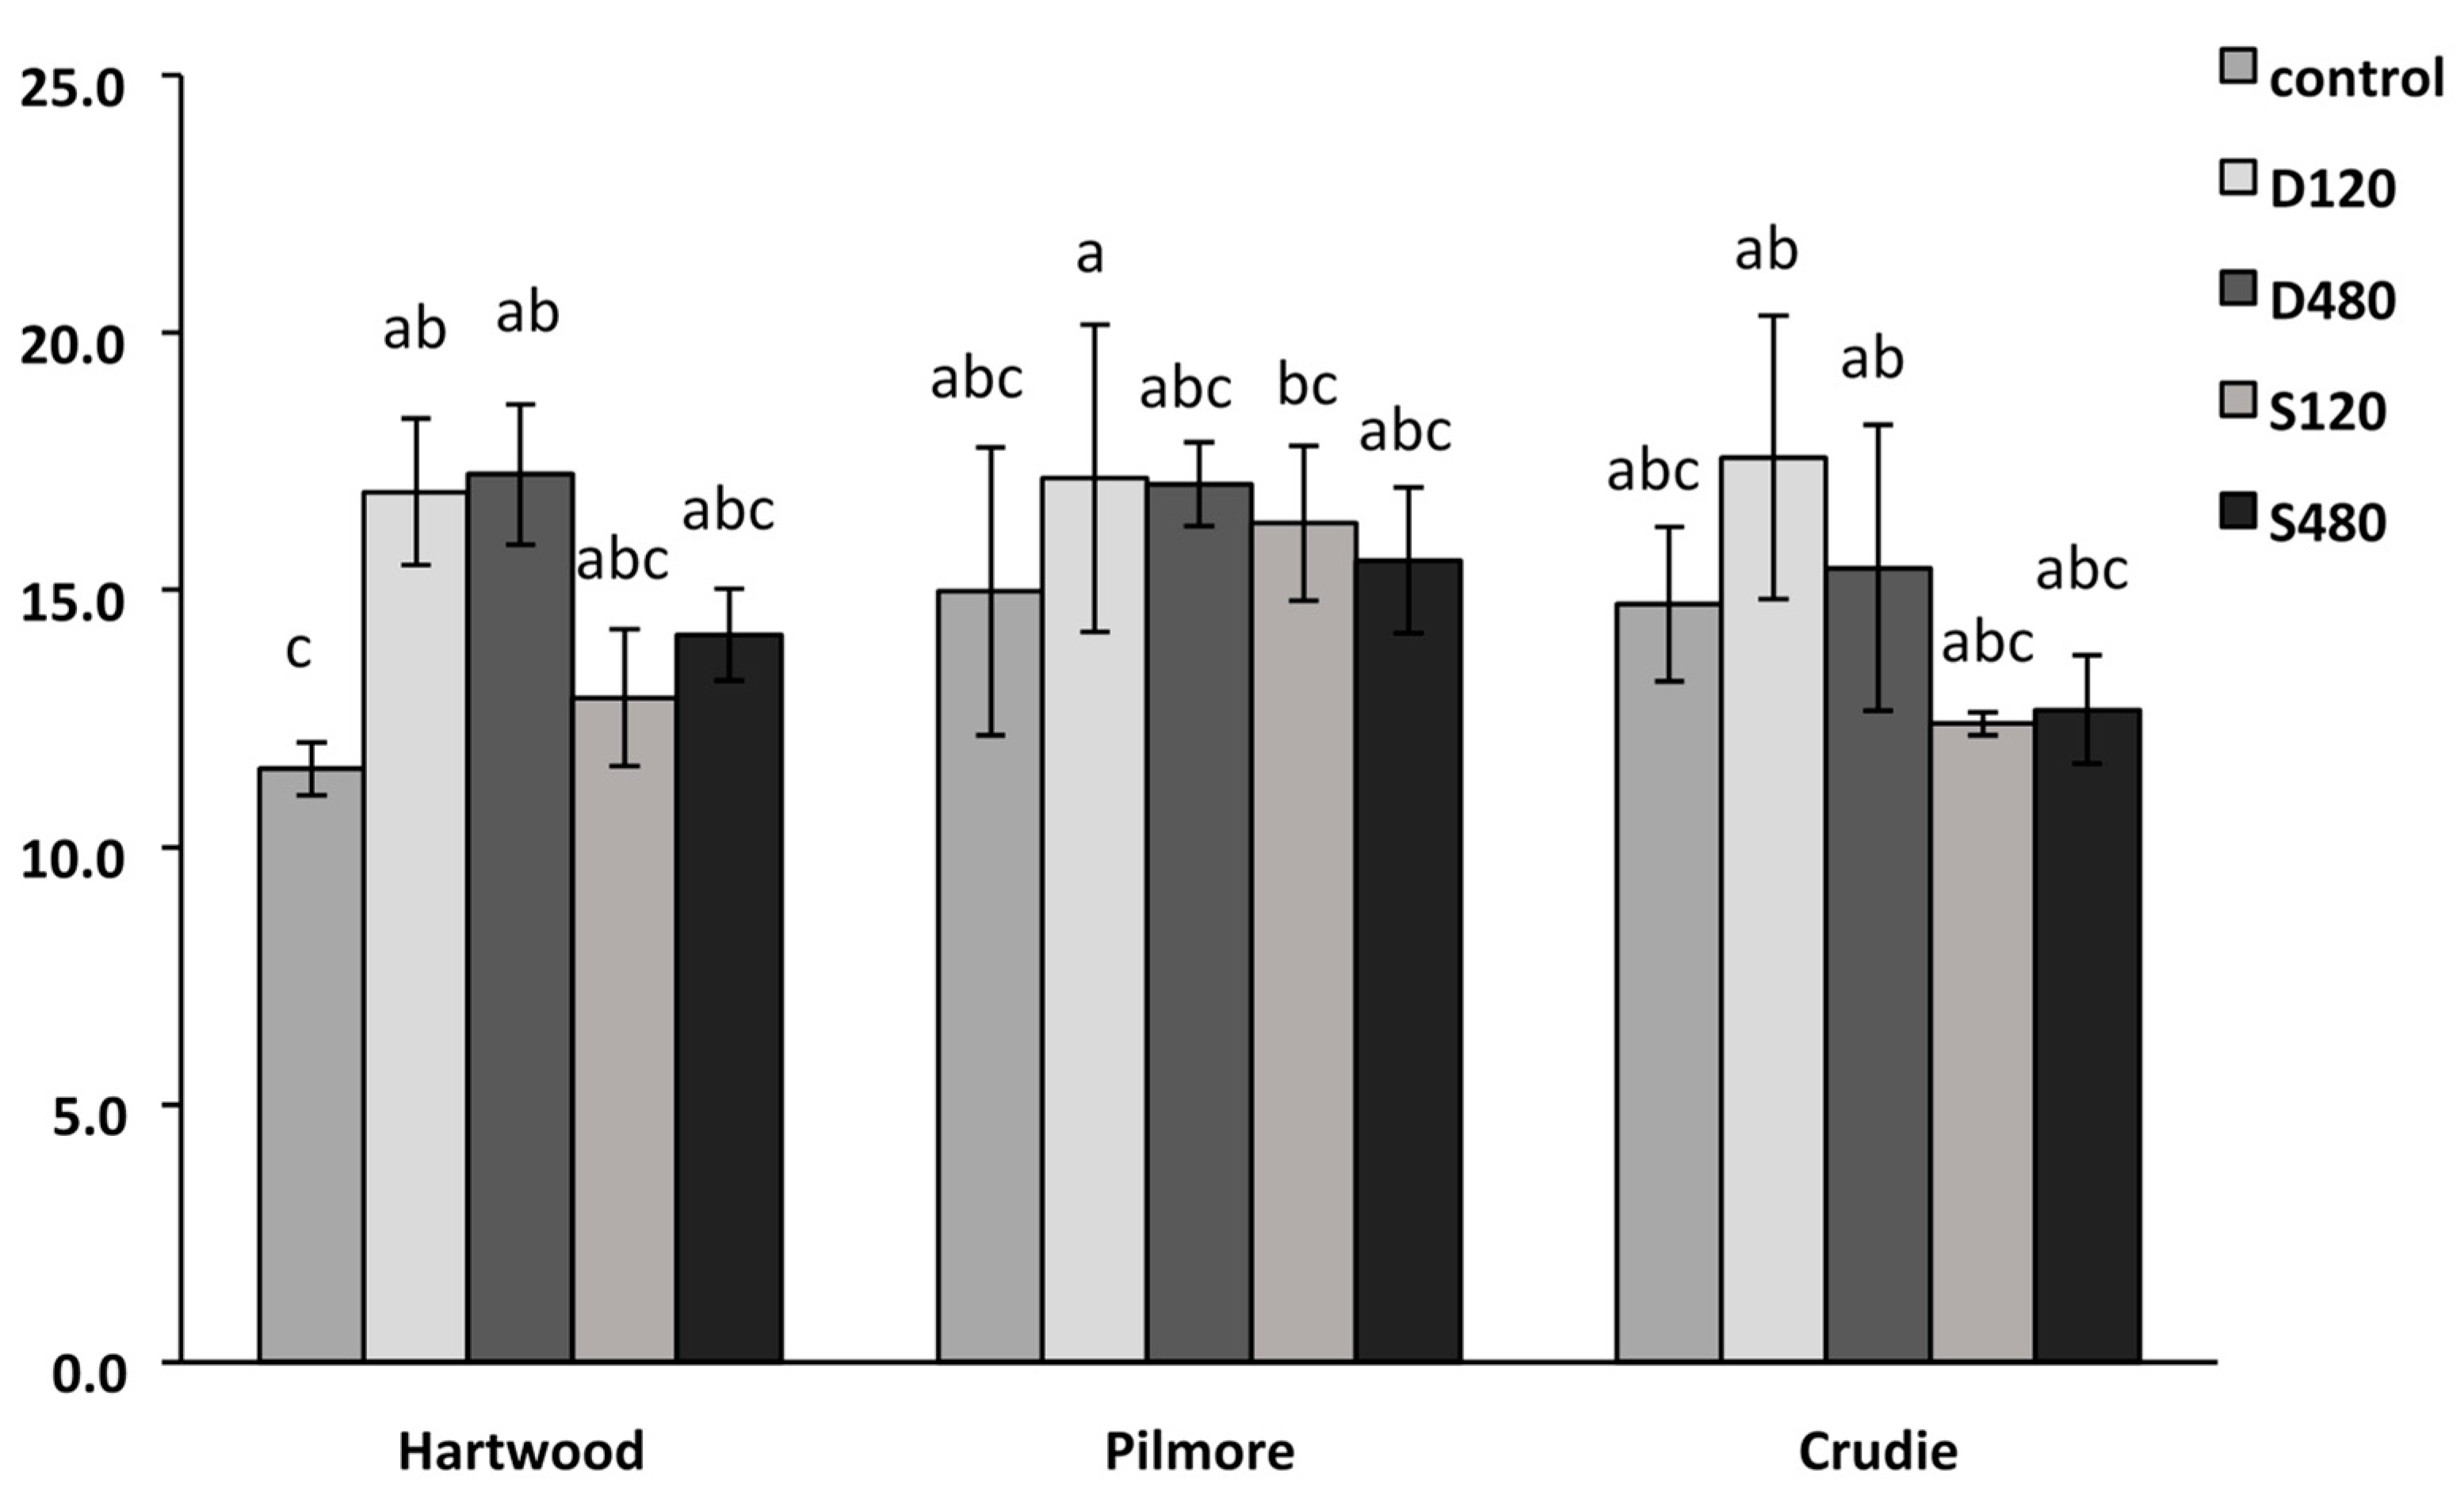
Figure 1. Final straw biomass in experiment 2: Hartwood, Pilmore and Crudie soils are presented. Control: untreated control, S = synthetic fertiliser, D = digestate; the number indicates the rate of nitrogen applied in kg ha−1. Comparison using post hoc Fisher’s test (α = 0.05). Single letters indicate groups with no significant difference. Error bars represent the standard error of the mean (n = 5).
Agronomy 13 02889 g001
Figure 2. Nitrogen Balance Index (NBI) level in barley leaves in week 6 in experiment 2: Hartwood, Pilmore and Crudie soils are presented. Control: untreated control, S = synthetic fertiliser, D = digestate; the number indicates the rate of nitrogen applied in kg ha−1. Comparison using post hoc Fisher’s test (α = 0.05). Single letters indicate groups with no significant difference. Error bars represent the standard error of the mean (n = 4).
Agronomy 13 02889 g002
Figure 3. Calcium (Ca) concentration in straw part for the experiment 2 in Hartwood soil, Pilmore soil and Crudie soil. Control: untreated control, S = synthetic fertiliser, D = digestate; the number indicates the rate of nitrogen applied in kg ha−1. Error bars represent the standard error of the mean (n = 4).
Agronomy 13 02889 g003
Figure 4. Potassium (K) concentration in straw part for the experiment 2 in Hartwood soil, Pilmore soil and Crudie soil. Control: untreated control, S = synthetic fertiliser, D = digestate; the number indicates the rate of nitrogen applied in kg ha−1. Comparison using post hoc Fisher’s test (α = 0.05). Single letters indicate groups with no significant difference. Error bars represent the standard error of the mean (n = 4).
Agronomy 13 02889 g004
Figure 5. Magnesium (Mg) concentration in straw part for the experiment 2 in Hartwood soil, Pilmore soil and Crudie soil. Control: untreated control, S = synthetic fertiliser, D = digestate; the number indicates the rate of nitrogen applied in kg ha−1. Error bars represent the standard error of the mean (n = 4).
Agronomy 13 02889 g005
Figure 6. Nitrate (NO3) in soil pore water from soils amended with digestate over a 35-day period. Control: untreated control, S = synthetic fertiliser, D = digestate; the number indicates the rate of nitrogen applied in kg ha−1. A = Hartwood soil, B = Pilmore soil and C = Crudie soil. Comparison using post hoc Fisher’s test (α = 0.05). Error bars point to the standard error of the mean and replicates (n = 4). Significant differences between treatments on days are indicated: *** p < 0.001.
Agronomy 13 02889 g006
Table 1. Amount of N, P and water added to each treatment for Powerhouse digestate experiment. The concentration of P and N in the digestate was 0.99 mg g−1 and 8.33 mg g−1; 365.39 mg g−1 of P and 1390.60 mg g−1 of N in 120 N ha−1 and 5562.40 mg g−1 of P and 1461.58 mg g−1 of N in 480 N ha−1, respectively. Note: S = synthetic fertiliser, D = digestate; the number indicates the rate of nitrogen applied in kg ha−1; MAP = monoammonium phosphate.
TreatmentsD120D480S120S480
Digestate (mL)91.3360--
Urea (mL of 50 g L−1)--28.4112.3
(MAP) (mL of 50 g L−1)--6.1724.3
Table 2. Amount of N, P and water added to each treatment for Gaskfarm digestate experiment. The concentration of P and N in the digestate was 0.76 mg g−1 and 5.33 mg g−1; 308.62 mg g−1 of P and 1424.23 mg g−1 of N in 120 N ha−1 and 1216.86 mg g−1 of P and 5615.54 mg g−1 of N in 480 N ha−1, respectively. Note: S = synthetic fertiliser, D = digestate; the number indicates the rate of nitrogen applied in kg ha−1.
TreatmentsD120D480S120S480
Digestate (mL)6.12524.54--
Urea (mL of 50 g L−1)--0.31.22
monoammonium phosphate MAP (mL of 50 g L−1)--0.30.3
Table 3. Physiochemical properties of the soils and pore water measured over the trials. Values represent means (n = 3). Elemental concentrations expressed in terms of dry weight. Values are the means and the standard deviation. The Craibstone soil texture was not measured.
TreatmentsCraibstoneInschHartwoodPilmoreCrudie
pH5.2 ± 0.015 ± 0.015.7 ± 0.015.3 ± 0.016.1 ± 0.01
EC μS cm−10.53 ± 0.20.35 ± 0.20.51 ± 0.20.18 ± 0.10.12 ± 0.1
Total N (% by weight)0.39 ± 0.050.32 ± 0.050.20 ± 0.020.35 ± 0.050.33 ± 0.01
Total C (% by weight)4.14 ± 0.13.64 ± 0.13.15 ± 0.65.73 ± 0.14.98 ± 0.25
Clay (% by weight)-14 ± 0.0125 ± 0.0120 ± 0.0115 ± 0.01
Silt (% by weight)-30 ± 0.0129 ± 0.0114 ± 0.0123 ± 0.01
Sand (% by weight)-56 ± 0.0146 ± 0.0166 ± 0.0162 ± 0.01
Ca (mg g−1)6.14 ± 1.156.87 ± 0.423.37 ± 0.26.70 ± 0.62.76 ± 0.8
K (mg g−1)2.44 ± 1.150.95 ± 0.781.29 ± 0.92.86 ± 0.52.81 ± 0.6
Mg (mg g−1)1.41 ± 0.276.46 ± 0.271.55 ± 0.055.81 ± 0.23.69 ± 0.2
Soil Texture-Sandy LoamClay Sandy LoamSandyMedium Sandy-Loam
Table 4. Physiochemical properties of the digestates. Values represent means (n = 4). Elemental concentrations are expressed in terms of dry weight. Values are the means and the standard deviation.
PowerhouseGaskfarm
pH8.58.6
Total N (% by weight)8.33 ± 0.095.33 ± 0.07
Total C (% by weight)27.91 ± 1.1138.34 ± 2.58
Total P (% by weight)0.99 ± 0.330.76 ± 0.62
NO3 and NO2-N (mg g−1)24.53 ± 9.0711.23 ± 3.68
Plant available N (% by weight)74 ± 2736 ± 11
Table 5. Concentrations of Ca, K and Mg in the grain and shoots of plants grown in experiment 1. Note: Control: untreated control, S = synthetic fertiliser, D = digestate; the number indicates the rate of nitrogen applied in kg ha−1. Values are the means and the standard error of the mean (n = 5).
Nutrients
(mg kg−1 Dry Matter)
Treatments
TissueControlD120S120D480S480p-Value
CaGrain350 ± 10290 ± 40280 ± 9290 ± 10310 ± 100.492
KGrain6000 ± 3004840 ± 404900 ± 304350 ± 605100 ± 3000.002
MgGrain780 ± 70930 ± 80980 ± 60840 ± 501040 ± 400.034
CaShoot5000 ± 10007000 ± 10007000 ± 100016,000 ± 200017,000 ± 20000.001
KShoot25,000 ± 100027,700 ± 70023,000 ± 100032,100 ± 80027,000 ± 20000.331
MgShoot1100 ± 3001300 ± 7001200 ± 700800 ± 8001800 ± 4000.249
Table 6. Grain and shoot concentrations of Ca, K and Mg in mg kg−1. Control: untreated control, S = synthetic fertiliser, D = digestate; the number indicates the rate of nitrogen applied in kg ha−1. Values are the means and the standard error of the mean (n = 5).
Nutrients
(mg kg−1 Dry Matter)
Treatments
TissueControlD120S120D480S480p-Value
CaGrain1500 ± 2002100 ± 5001300 ± 5001700 ± 1002600 ± 3000.012
KGrain6000± 6005000 ± 20006000 ± 10006000± 10005000 ± 10000.072
MgGrain1900 ± 6002000 ± 10001900 ± 2002000 ± 2002700 ± 7000.319
CaShoot15,000 ± 400151,000 ± 90016,000 ± 100025,000± 160033,200 ± 30000.075
KShoot28,000± 400029,000 ± 300037,000± 300046,000± 300023,300 ± 40000.035
MgShoot4700± 3004300 ± 6005200 ± 4004700 ± 3006100 ± 7000.220
Table 7. Summary of plant traits in response to digestate treatment (D480) compared to synthetic fertiliser amendment (S480) and unfertilised soil (C). A “✓” indicates a significant increase in the digestate treatment, a “x” indicates a significant decrease in the digestate treatment, and a “-” indicates no difference in the digestate treatment. Experiments 1 and 2.
TraitsPowerhouse Experiment 1Gaskfarm
Experiment 1
Experiment 2
S480CS480CS480C
Plant height---
Tiller number-
HIxx
Straw biomass--
Grain biomass--
Disclaimer/Publisher’s Note: The statements, opinions and data contained in all publications are solely those of the individual author(s) and contributor(s) and not of MDPI and/or the editor(s). MDPI and/or the editor(s) disclaim responsibility for any injury to people or property resulting from any ideas, methods, instructions or products referred to in the content.