Article

Physiological Characteristics, Crop Growth and Grain Yield of Twelve Wheat Varieties Cultivated in the North China Plain

1
Beijing Key Laboratory of Urban Hydrological Cycle and Sponge City Technology, College of Water Sciences, Beijing Normal University, No. 19, Xinjiekouwai St, Haidian District, Beijing 100875, China
2
College of Water Resource and Hydropower, Sichuan Agricultural University, Ya’an 625014, China
3
YingBo Agricultural Development Co., Ltd. of Dacaozhuang Xingtai City, Xingtai 055550, China
*
Author to whom correspondence should be addressed.
Agronomy 2023, 13(12), 3041; https://doi.org/10.3390/agronomy13123041
Submission received: 23 October 2023 / Revised: 9 December 2023 / Accepted: 10 December 2023 / Published: 12 December 2023
(This article belongs to the Section Farming Sustainability)

Abstract

:
Climate change and water resource shortages have become important problems limiting winter wheat production in the North China Plain (NCP). Understanding the physiological characteristics of different wheat varieties and their relationship with crop growth and yield is of great importance for addressing climate change through a scientific approach, adopting reliable wheat varieties, and ensuring food production. This study was conducted throughout three winter wheat seasons from 2018 to 2021. The crop growth, physiological indicators, crop yields, and water productivity (WP) of 12 wheat varieties widely cultivated in the NCP were measured to investigate the relationships between physiological characteristics and crop yield. The results showed that among the three wheat seasons, the maximum plant height of each wheat variety was relatively stable, while the changes in maximum plant density (PDm), maximum leaf area index (LAIm), and maximum dry matter (DMm) were highly variable. The gas exchange parameters and fluorescence parameters of wheat flag leaves varied with growth stage, and certain varieties were sensitive to water stress. The wheat grain yield, seasonal crop evapotranspiration (ETa), and WP of the 12 varieties were similar in the 2019–2020 and 2020–2011 seasons and were approximately 25%, 7%, and 19% higher than those in the 2018–2019 season, respectively, in which there were consecutive cool events in the winter and spring. Generally, the grain yields were positively correlated with PDm, LAIm, DMm, ETa, the harvest index, and WP, at a significance level of 0.01. The high-yield wheat varieties had higher photosynthetic rates in the middle and late grain-filling stages. Based on these relationships, high-yield wheat varieties may be selected to address climate change in the NCP as well as other regions in the world. Considering the variations in yield and WP in the three different climatic conditions, we recommend Yingbo700, Lunxuan103, Shimai26, Shinong086, Han6172, and Hanong1412 as high-yield and drought-resistant wheat varieties to be used in the NCP.

1. Introduction

The increasingly evident climate changes will severely affect the development of agriculture globally [1]. Due to a 1 °C increase in the global mean temperature, the global yields of wheat, rice, maize, and soybean are estimated to be reduced by 3–7% without CO2 fertilization, effective adaptation, and genetic improvement [2]. The increase in drought and extreme heat events has already caused a 9–10% decrease in global cereal production [3]. It has been reported that crop varieties play an important role in the scientific response to climate change [4,5,6], and drought-resistant crop varieties can also alleviate the water resource pressure faced by agricultural production [7]. Therefore, studying the physiological and ecological characteristics of different crop varieties in the field and selecting the highest quality crop variety plays an important guiding role in implementing scientific-based strategies for addressing climate change and the rational utilization of water resources and ensuring food production.
Crop varieties have different responses according to their physiological and ecological characteristics, which vary with meteorological factors and water. For example, when wheat crops were exposed to a high temperature of 41 °C and a drought of 30% field water capacity (FWC) for 7 days after flowering, this resulted in a decrease of the maximum photosynthetic efficiency of 17.2% for the variety ‘Pannonis’ and 5.6% for the variety ‘Tobak’ [8]. During the wheat milking stage, mild (65–70% FWC), moderate (55–60% FWC), and severe (40–45% FWC) water drought treatments were applied. The leaf net photosynthetic rate, leaf stomatal conductance, and leaf transpiration rate of the drought-resistant variety ‘Shijiazhuang8’ were 23.5–27.6%, 34.3–49.4%, and 18.5–23.6% higher than those of ‘Yanmai20’, respectively [9]. In an environment 6 °C above the normal temperature, beginning 10 days after anthesis and lasting to maturity, the wheat varieties ‘Larry’ and ‘Zenda’ had a 5-day reduction at the milking stage, and their yields decreased by 7% and 5%, respectively, while the milking stage remained unchanged for the wheat variety ‘WB Cedar’, and its yield decreased by 9% [10]. Although the authors of these studies have well analyzed the response regularities of growth and physiological indicators to the environment for different crop varieties, due to the environmental variables of temperature or water during a certain stage of crop growth controlled by researchers, the results often focus on the response of crops to a controlled environment [8,10,11,12]. Natural climate change is more complex, occurring throughout the entire growth stage of crops and including various extreme climates. Therefore, high-yield crop varieties must have the ability to resist multiple adverse climate conditions. However, there is little research on the physiological and ecological characteristics of crop varieties under various climate changes, and there are even fewer articles on the relationship between the morphological and physiological characteristics of different crops and yield factors.
The North China Plain (NCP) is an important grain production base in China, producing approximately 58% of China’s total wheat and 25% of China’s total maize [13]. However, climate change and water resource issues pose a great challenge to wheat production in the region [14]. In the wheat growing season from 1961 to 2015, the minimum and maximum temperatures increased by 0.53 and 0.20 °C 10−1 a−1, respectively. The solar radiation decreased by 0.25 MJ m−2 d−1 10−1 a−1, and precipitation was more unstable [15]. Moreover, extreme weather conditions such as spring frost or late spring cold events [16,17,18], dry hot winds [19], drought and heat stress [20,21,22] occur more frequently and are detrimental to wheat production. Moreover, the water resources in the NCP are very scarce, accounting for only 3% of the country’s water supply [13]. To ensure wheat production, approximately 200–300 mm of water is pumped for irrigation every year, which consequently results in excessive exploitation of groundwater [23,24]. From 2002 to 2014, groundwater reserves in the North China Plain decreased at a rate of 7.2 ± 1.1 billion m3 per year [25], and the groundwater level in the central NCP decreased at a rate of 1.35 m per year [26]. The lack of water resources and the deterioration of the water environment seriously affect the development of local agriculture and the economy. Therefore, it is urgent to find suitable methods to mitigate climate change and water scarcity issues to ensure and improve wheat yield in the NCP.
Therefore, a three-season winter wheat experiment was conducted in a long-term wheat-cultivated field in the NCP with the following objectives: (1) explore the response regularity of physiological and ecological characteristics of different wheat varieties to the natural meteorological environments under deficit irrigation, (2) Evaluate yield and water productivity, analyze the relationship between yield factors and growth and physiological indicators, and (3) screen high-yield and drought-resistant wheat varieties suitable for climate and water conditions in the NCP.

2. Materials and Methods

2.1. Experimental Site

The field experiment was conducted from October 2018 to June 2021 at the Dacaozhuang Seeds Experimental Station, Ningjin County, Xingtai City, Hebei Province (Figure 1). The site is located at 37°30′ N latitude and 114°56′ E longitude, with an altitude of 26 m. The average temperature is 13 °C, the sunshine duration is between 2000 and 2800 h, the cumulative rainfall is 430 mm, and the evaporation is approximately 1600 mm (1981–2018). The site is in the central and western North China Plain, which has a typical temperate continental monsoon climate. Rain and heat occur in the same period, and approximately 70% of the annual average rainfall is concentrated from June to August. Physical and chemical soil characteristics are uniformly distributed in the experimental station. The surface soil texture of 0–60 cm is silty loam, with 11% clay, 63% silt, and 26% sand. The field water capacity is 0.36 cm3 cm−3, and the soil bulk density is 1.45 g cm−3 [23,27]. Due to climate change, extreme high and low temperatures and long periods with few rainfall events have been frequently observed in the NCP as well as in the study region [18,28,29].

2.2. Experimental Design

Twelve winter wheat varieties widely cultivated in the NCP, as well as in the Hebei Province, were selected for this field experiment. Detailed information on these wheat varieties is shown in Table 1, and the information is sourced from the Hebei Province Crop Approval Announcement. The plot for each variety was 50 m × 4.5 m. Considering the large field area for each wheat variety and uniformly distributed soil characteristics in the experimental field, there was no replication for the wheat variety. Each wheat variety was sown on 16 October 2018, 20 October 2019, and 18 October 2020. The sowing depth was approximately 4 cm, the row spacing was 15 cm, and the sowing density was the same, at approximately 3.75 million seeds ha−1. In the three growing seasons, the heading stage of 12 varieties was concentrated at the end of April, the flowering period was concentrated in early May, and the harvest period was around 7 June [27]. The field management of water and fertilizer in this study was the same as that at the local experimental station. There were three irrigation events for each variety distributed by a semifixed sprinkler irrigation system: after sowing, before overwintering, and at the elongation stage. The irrigation schedule in the three wheat growing seasons was similar, and the irrigation depths in the three events were 40, 90, and 90 mm in the 2018–2019 and 2019–2020 seasons and 55, 90, and 90 mm in the 2020–2021 seasons. Irrigation just after sowing was used to promote wheat seed germination and healthy development in the seedling stage. Winter irrigation was used to enhance root development in the winter period. Irrigation at the stem elongation stage was used to support the high crop evapotranspiration in the fast growth period from elongation to the gain-filling stage.
Each variety was fertilized twice in a season. Compound fertilizer at 600 kg ha−1 (108 kg N ha−1, 72 kg P2O5 ha−1, and 90 kg K2O ha−1) was applied before sowing as the base fertilizer, and 337 kg of urea (155 kg N ha−1) was applied by a sprinkler fertigation system at the elongation stage as the topdressing. Weeds and pests in the experimental field were controlled by farmers at the station following local field management.

2.3. Data Collection and Preprocessing

2.3.1. Climate Data

A microclimate station approximately 50 m away from the experimental field, including a data logger (CR1000, Campbell Scientific Inc., Logan, UT, USA), temperature and humidity sensors (model PTS-3, Jinzhou Sunshine Meteorological Technology Co., Ltd, Jinzhou, China), a wind sensor (model EC-9S, Jinzhou Sunshine Meteorological Technology Co., Ltd, Jinzhou, China), a solar radiation sensor (model TBQ-9, Jinzhou Sunshine Meteorological Technology Co., Ltd, Jinzhou, China), and a tipping bucket rain gauge (Model L3, Jinzhou Sunshine Meteorological Technology Co., Ltd, Jinzhou, China), was used to measure the climate data in the field. All climatic sensors were installed at a height of 2 m, and the data were sampled at 10 s intervals. The sampled data were automatically processed into hourly and daily data for analysis. The historical daily meteorological data from 1981 to 2018 were collected from the China Meteorological Data Sharing Service System (http://cdc.nmic.cn/home.do) (accessed on 15 July 2021). The dataset includes daily maximum (Tmax), minimum (Tmin) and mean temperature (Tmean), daily total solar radiation (Rs), daily mean relative humidity (RH), and daily rainfall.

2.3.2. Soil Water Data

During each wheat growth period for each wheat variety, the sample-drying method was used to measure the soil water content of the 0–180 cm soil layer at 20 cm intervals at the sowing period and harvest. These sites were used for measurement, and the mean data were used to calculate seasonal crop evapotranspiration (ETa). After wheat regreening in the later month of March, a portable soil water meter (TRIME-PICO, IMKO, Ettlingen, Germany) was also used to measure the soil water content every 7–10 days until harvest. The data measured by the portable soil water meter were calibrated using the data from the drying method, and then the calibrated data were used for analysis of the soil water variation and distribution in the experimental season.

2.3.3. Crop Growth Data

Plant density (PD), height (PH), leaf area index (LAI), and dry matter (DM) were measured every two weeks after wheat regeneration. For each variety, three plots that had a 1 m row with well-growing wheat plants were selected as continuous observation sites, and then the stem number of these plots was determined to obtain the plant density. Moreover, the heights of 15 wheat plants surrounding these plots were measured. Furthermore, 20 wheat plants near the sample plots were cut at ground level. Their leaf area was measured by a leaf area meter (LI-3000C, Li-COR Inc., Lincoln, NE, USA), and dry matter was measured by the oven-drying method. The detailed method used to calculate the leaf area index and dry matter can be found in [27].
For each variety at maturity, ten 1-m2 areas were selected randomly to measure the grain yield, 20 wheat plants were chosen to determine the grain number per spike, and 10 repeated samples were chosen to measure the 1000-grain weight. The drying method was used to measure the water content of the sampled grain for each wheat variety, and then the grain yield, 1000-grain weight, and single spike grain weight were converted to those with a standard 13% water content.

2.3.4. Crop Physiological Data

The crop physiological parameters, including the leaf net photosynthetic rate (Pn), transpiration rate (Tr), stomatal conductivity (Gs), the maximum quantum yield of PSII (Fv/Fm), the effective quantum yield of PSII (ΦPSII), photochemical quenching (qP), and nonphotochemical quenching (NPQ), were measured by a portable photosynthesis system (Li-6800, Li-COR, USA) with a leaf chamber fluorometer (Li-6800-01A, Li-COR, USA). The water use efficiency at the leaf level (LWUE) was computed as the ratio of Pn to Tr. In the heading (around 28 April), middle (around 15 May) and late (around 25 May) grain-filling stages, three flag leaves from three different plants of each variety were selected to measure these physiological parameters on sunny days. Both light and dark conditions are needed for photosynthetic data measurement, and detailed methods for data measurement and calculation can be found in the references [27,31].

2.4. Calculation of Indicators

The water balance equation was used to calculate crop evapotranspiration (ETa, mm) when the sprinkler irrigation method was used [27,32]:
ET a = I + P + Δ W + S g D R f
where I and P are the irrigation amount and cumulative precipitation during the whole growth period, respectively, ΔW is the change in soil water storage in the soil profile from sowing to harvest, and the soil layer is 0–180 cm in depth in this study, Sg is the capillary rise from the lower soil layer to the crop root zone, D is the downward drainage from the crop root zone, and Rf is the surface runoff. All units are expressed in mm. Due to the groundwater depth (approximately 40 mm lower than the ground surface) and the small amount of rainfall during the entire growth period, Sg was taken as zero. The sprinkler irrigation depth was well controlled, and the soil surface was flat, so no surface runoff was observed during the experimental period. Therefore, D and Rf were also taken as zero.
The harvest index (HI) and water productivity (WP, kg m−3) were calculated according to the following equations [33,34,35]:
HI = Y MD
WP = 0.1 Y ET a
where Y is the grain yield (kg ha−1), MD is the dry matter at maturity (kg ha−1), and ETa is the seasonal crop evapotranspiration (mm).

2.5. Statistical Analysis

Data were collated in Microsoft Excel 2013, the one-way ANOVA method in SPSS 21 (SPSS, Inc., Chicago, IL, USA) was used to analyze the data of different wheat varieties, and the Duncan test was used for multiple comparisons of differences at the 5% significance level. In the process of wheat variety selection, principal component analysis and the hierarchical cluster method in SPSS 21 (IBM Co., Armonk, NY, USA) were used to select the high-yield and drought-resistant wheat varieties based on the indices of yield and WP in these three wheat seasons. The principal component analysis utilizes the idea of dimensionality reduction and the method of linear transformation to transform coordinate systems of multiple indicators into new coordinate systems of a few comprehensive indicators so that the properties of the original indicators can be represented by new indicators with certain significance [36]. The hierarchical cluster method begins with each element as a separate cluster and then iteratively merges the closest clusters and builds up the dendrogram [37]. In addition, graphs were created using Origin 2022 (OriginLab Co., Northampton, MA, USA).

3. Results

3.1. Meteorological Conditions and Soil Water Content

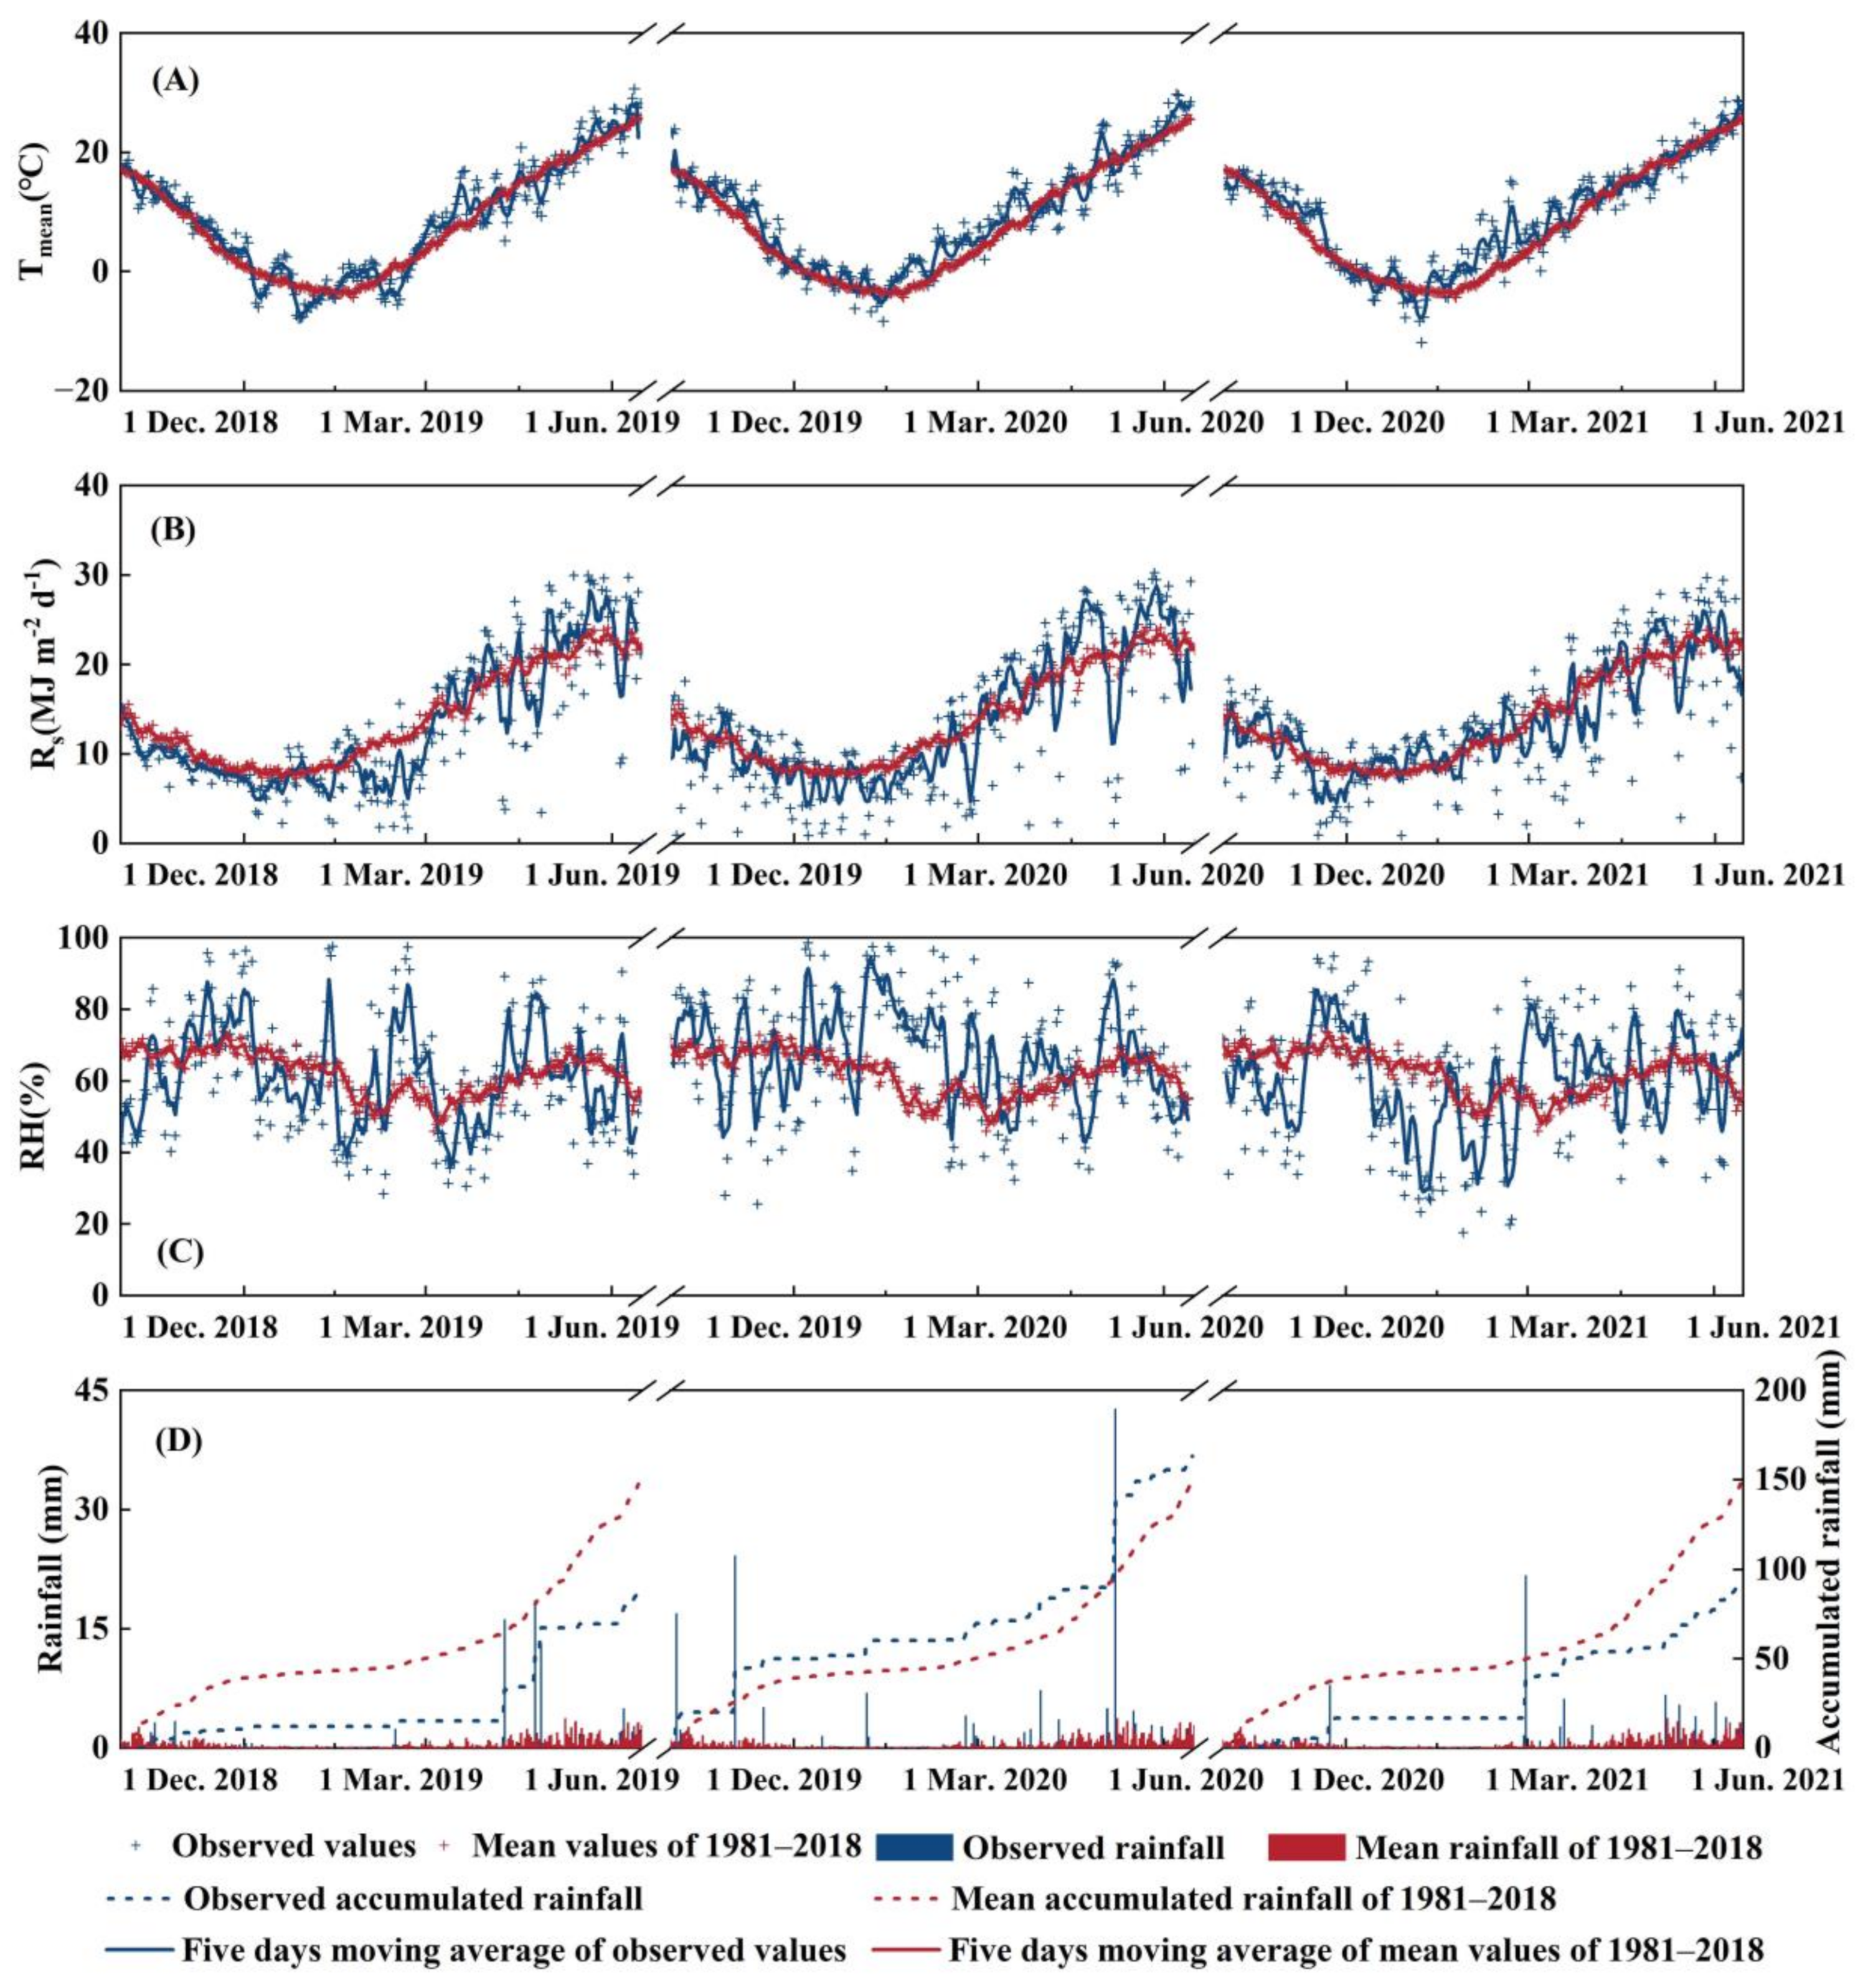
Figure 2 shows the seasonal trends of daily Tmean, Rs, RH, and rainfall in the three wheat seasons of 2018–2019, 2019–2020, and 2020–2021, and the corresponding average data over 1981–2018. Generally, the trend of meteorological elements in the three wheat growing seasons was similar and similar to the long-term average. The Tmeans in the wheat seasons of 2018–2019, 2019–2020, and 2020–2021 were 8.4, 9.2, and 9.2 °C, respectively, which were slightly (0.4–1.2 °C) higher than that (8.0 °C) in the 1981–2018 period.
The daily Rs were generally within 30 MJ m−2 d−1 and the daily RH was between 20% and 100% in the three wheat seasons. Rs and RH in different wheat growth periods fluctuate greatly owing to the different rainfall amounts during the wheat growing season. The cumulative rainfall amounts in these three wheat seasons were 89.2, 141.7, and 95.5 mm, respectively. Based on the mean rainfall of 140.8 mm in the wheat seasons in 1981–2018, it could be concluded that 2018–2019 and 2020–2021 were dry seasons, while 2019–2020 was a normal season. Among these three wheat growing seasons, the frequency of rainfall in the 2018–2019 wheat season was the lowest, and rainfall was mainly concentrated in April, with a total amount of 52.2 mm, accounting for 67% of rainfall in the entire growth season. The frequency of rainfall in 2020–2021 was higher, with rainfall mainly being distributed from March to May. The highest rainfall frequency was in the 2019–2020 season, with rainfall events occurring almost every month.
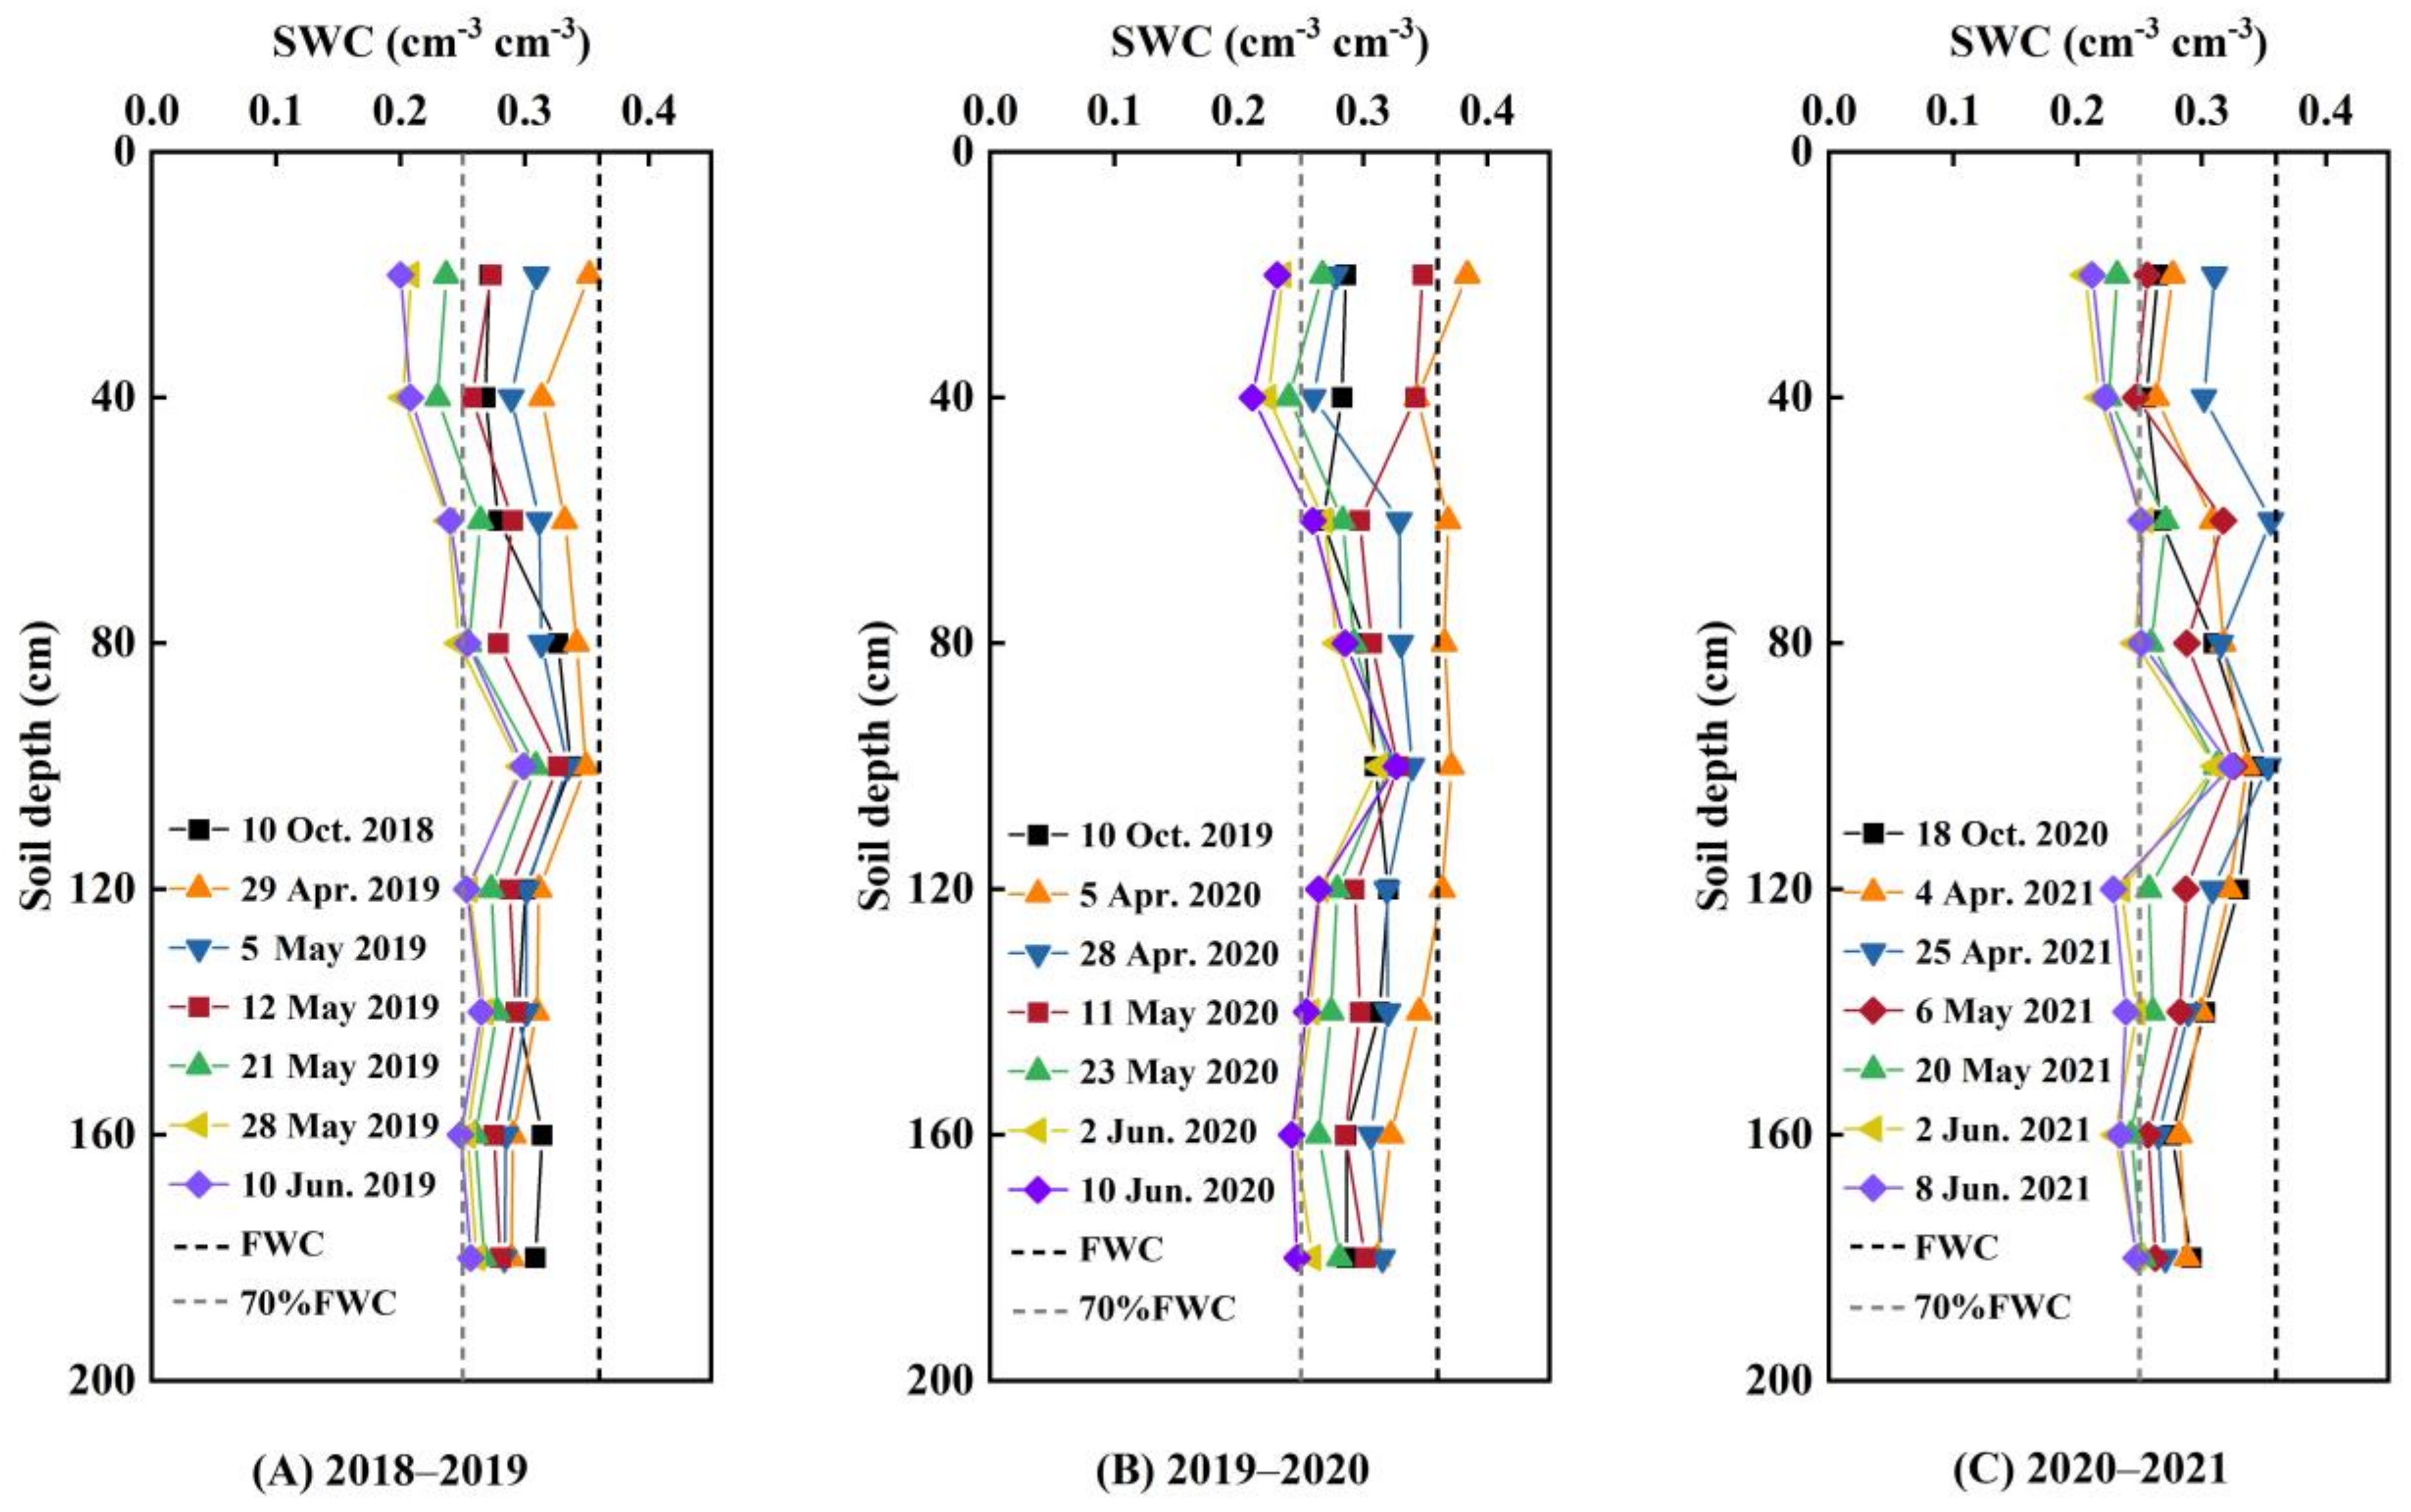
The variation in soil water content (SWC) in the 0–180 cm soil layer at different wheat stages in the 2018–2021 seasons is shown in Figure 3. The SWC in each soil layer before sowing in the three wheat seasons was approximately 0.30 cm3 cm−3, approximately 83% of the FWC. However, due to differences in irrigation and rainfall, the changes in SWC in these three wheat seasons were different. In the middle of May in the 2018–2019 and 2020–2021 seasons and at the end of May in the 2019–2020 season, the SWC of the 0–40 cm soil layer decreased to 70% of the FWC. Before harvest, the SWCs of the 0–40 cm soil layer in the dry seasons, which were those of 2018–2019 and 2020–2021, were approximately 0.20 cm3 cm−3 (equivalent to 56% FWC), while in the normal season, the season of 2019–2020, was 0.23 cm3 cm−3 (equivalent to 56% FWC). Generally, the SWC of the 0–120 cm soil layer was highly variable in the three wheat seasons. This result indicates that the 0–120 cm soil layer was the main water supply area for wheat, and no obvious deep leakage occurred down into the soil layer deeper than 120 cm.

3.2. Crop Growth Characteristics

The maximum plant height (PHm), maximum density (PDm), maximum LAI (LAIm), and maximum dry matter (DMm) of the 12 wheat varieties in the three growth seasons are shown in Table 2. Generally, wheat variety significantly influences wheat growth. The PHm ranged from 68 mm to 86 mm among the 12 varieties in the three seasons. Variety Shimai No. 22 had the highest mean PHm (84 cm) over the three seasons, while Yingboaifeng8 had the lowest PHm (69 mm). The mean PHm for the 12 wheat varieties in the three seasons was very close, with values of 76.4, 75.4, and 77.3 cm, respectively. The coefficients of variation (CVs) of the mean PHm for the 12 varieties over the three seasons were less than 5%, indicating slight effects of climate on PHm.
There was an obvious difference in PDm among the three wheat seasons. The PDm of the 12 varieties in the 2019–2020 season was 1747–2344 plants m−2, while there were 1247–1571 plants m−2 in the 2018–2019 season and 1183–1631 plants m−2 in the 2020–2021 season. The lower PDm in the 2018–2019 and 2020–2021 seasons implied that wheat in these two seasons was subjected to low-temperature stress in the winter, although, the seasonal means in these three seasons were close to the annual means (Figure 2A). In the 2018–2019 and 2020–2021 wheat seasons, the wheat variety Shinong086 had the highest PDm (1790 stems m−2), while Shixin828 had the lowest PDm (1392 stems m−2), indicating that Shinong086 had the strongest frost resistance and that Shinxin 828 was very sensitive to low temperatures. In the 2019–2020 wheat season, which was denominated the normal season, the Gaoyou2018 variety had the highest PDm (2344 plants m−2), while Shixin828 had the lowest PDm (1747 plant m−2), indicating that Gaoyou2018 had the strongest tillering ability and Shixin828 had the weakest tillering ability.
The maximum leaf area index varied from 5.4 to 6.9 for the 12 wheat varieties in the 2018–2019 seasons and was close to that in the 2020–2021 season (4.7–7.2 in), and both were lower than those in the 2019–2020 season (7.1–8.1). Similarly, the maximum aboveground dry matter observed at harvest ranged from 15.2 to 18.2 t ha−1 in the 2018–2019 season and was close to that (16.8–20.3 t ha−1) in the 2020–2021 season; both were lower than those (22.2–25.7 t ha−1) in the 2019–2020 season. Generally, the highest LAIm (7.5 over the 12 varieties) in the 2019–2020 wheat season resulted in the largest DMm (23.3 t ha−1), and the lower LAIm (6.1 and 6.3) in the other two seasons resulted in a lower DMm (16.8 and 18.6 t ha−1).

3.3. Crop Physiological Characteristics

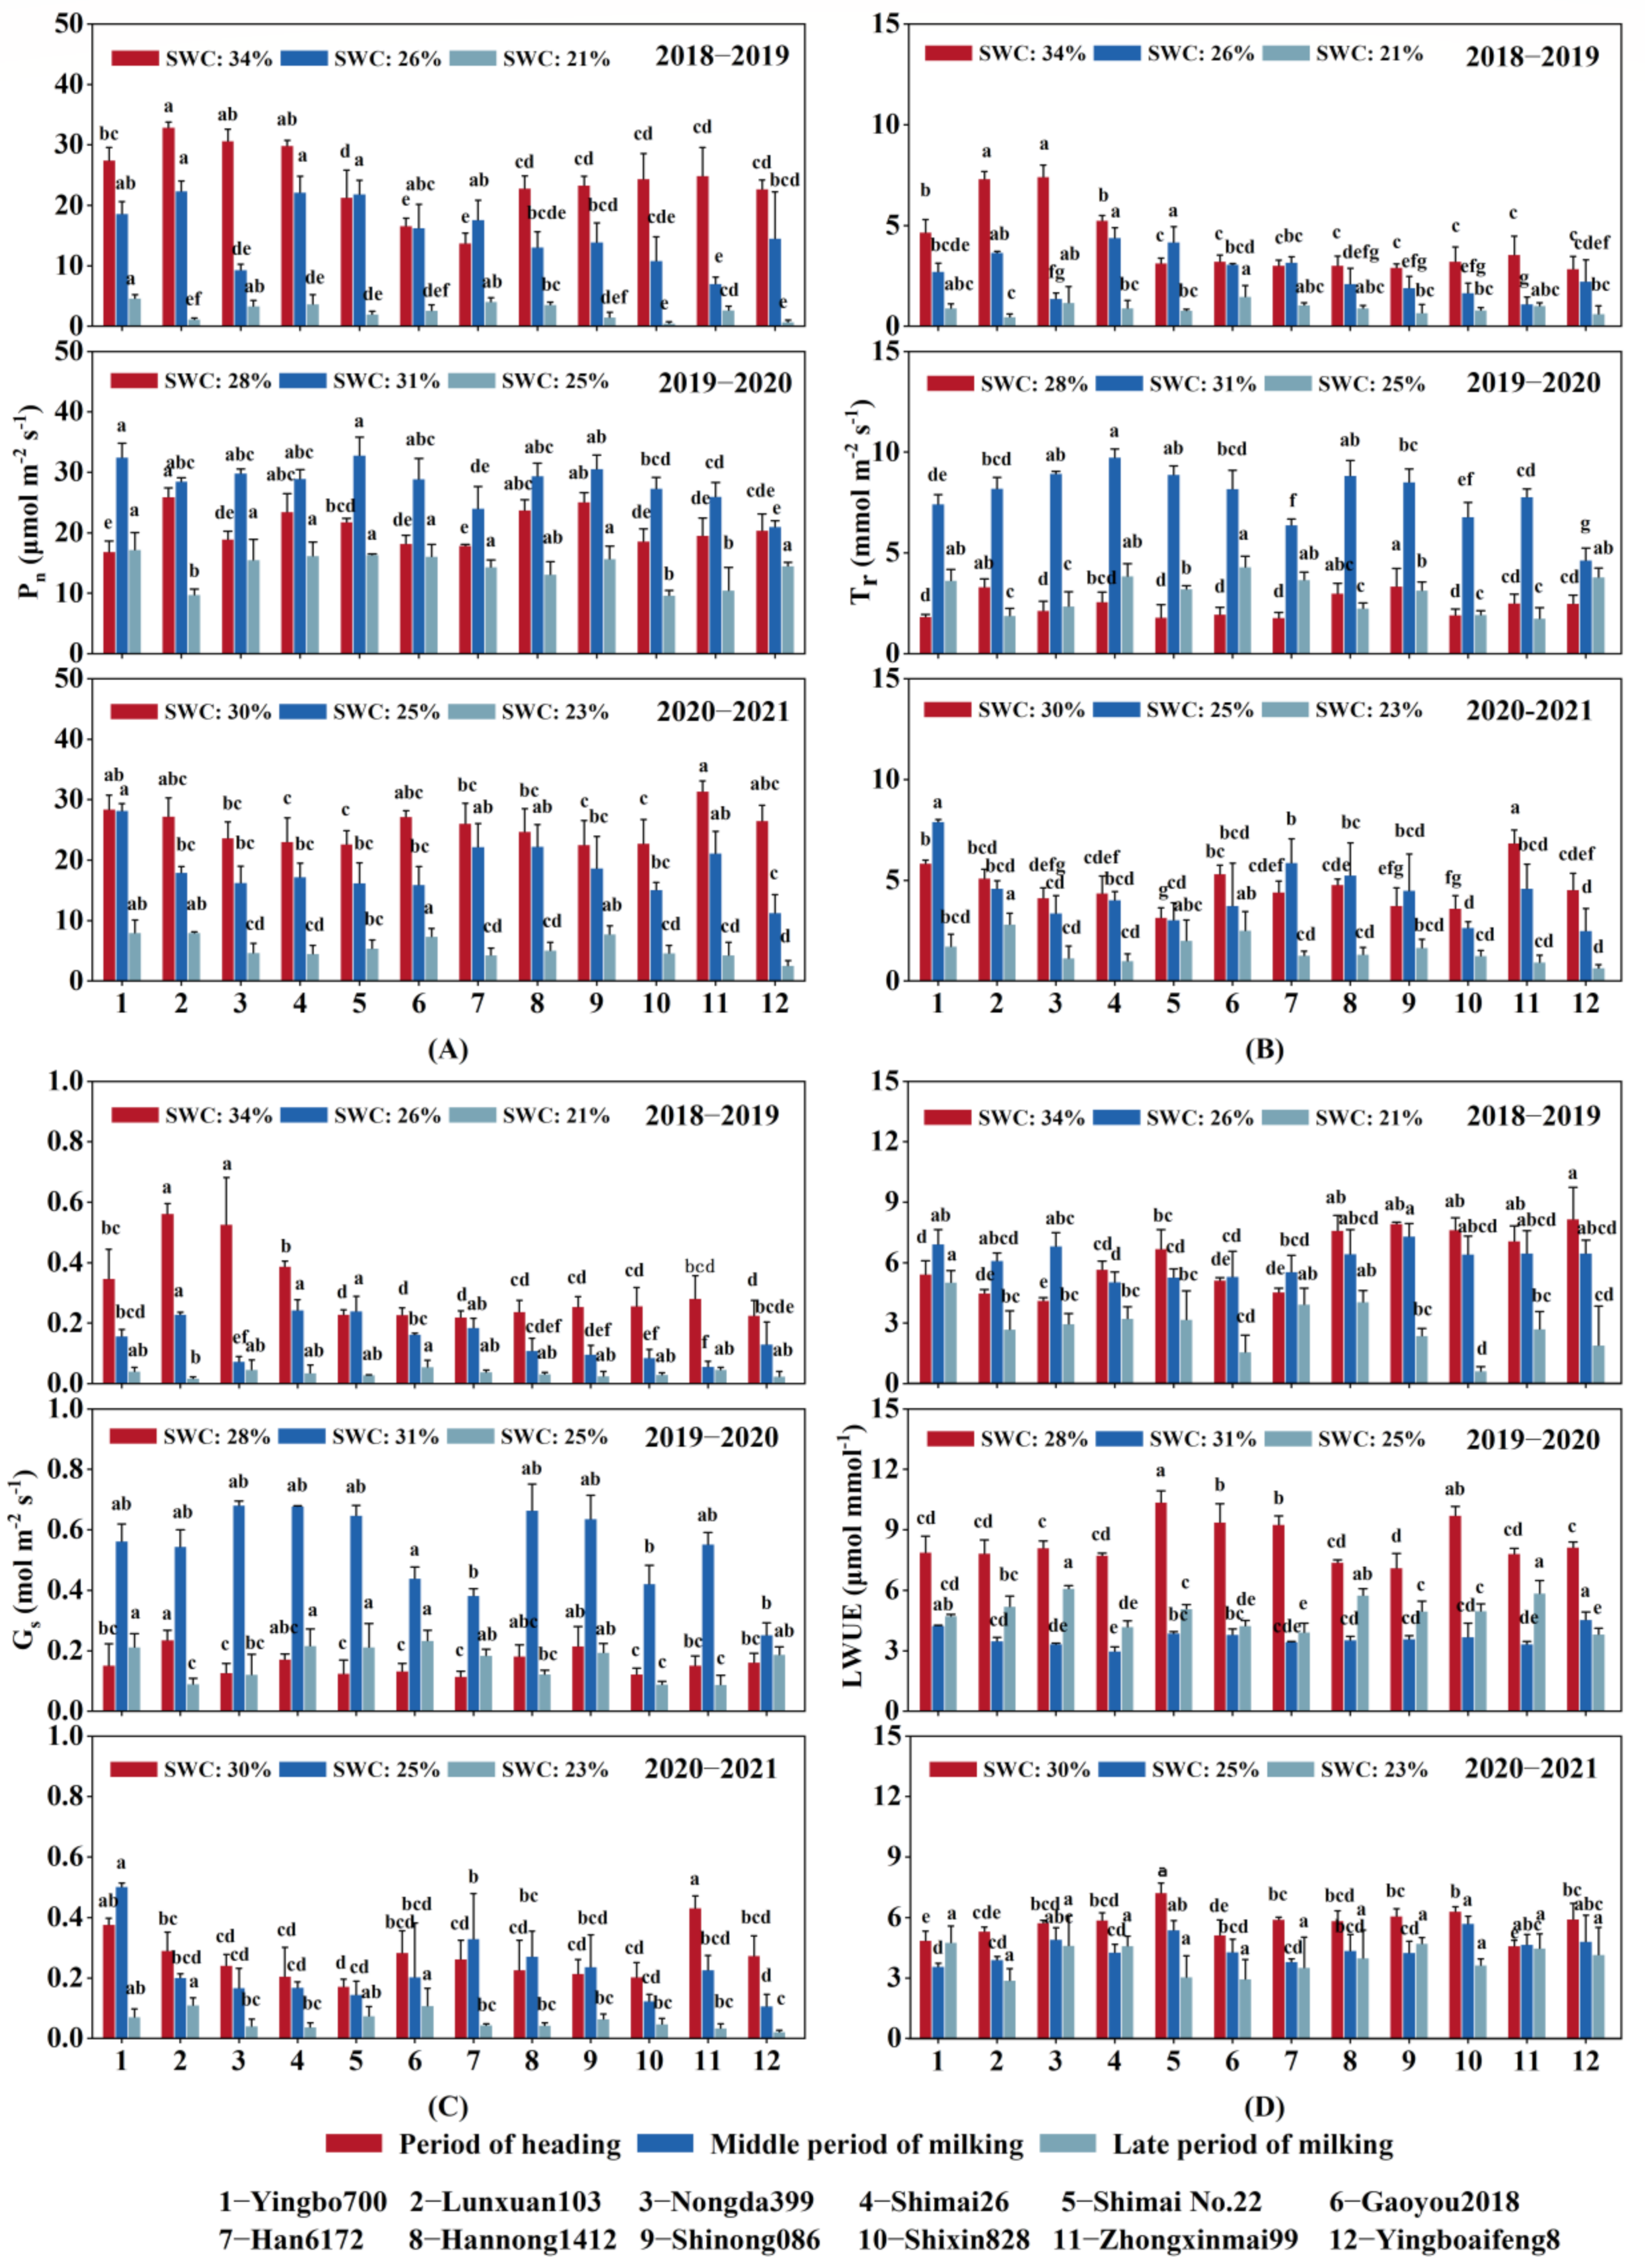
The gas exchange parameters of Pn, Tr, Gs, and LWUE of flag leaves for the 12 wheat varieties measured at the heading, middle and late grain-filling stages in the 2018–2021 wheat seasons are shown in Figure 4. There were clear variations in these four physiological characteristics among the 12 wheat varieties. At the heading and middle grain-filling stages, the Pns varied in the ranges of 13.8–32.9 and 7.0–22.4 μmol m−2 s−1 in the 2018–2019 season, 18.6–25.9 and 23.1–32.6 μmol m−2 s−1 in the 2019–2020 season, and 23.1–34.5 and 11.4–28.2 μmol m−2 s−1 in the 2020–2021 season.
The variations in Pn were greatly influenced by the field SWC and growth stages. In the dry seasons (the 2018–2019 and 2020–2021 seasons), the Pn values showed the following order (from high to low): heading stage > middle grain-filling stage > late grain-filling stage. In the normal precipitation season (the 2019–2020 season), the Pn trend (from high to low) was as follows: middle grain-filling stage > heading stage > late grain-filling stage. In the heading and middle grain-filling stages, the SWC was higher than 0.25 cm3 cm−3 (approximately 70% FWC), and the Pn was between 15 and 35 μmol m−2 s−1 during the daytime, while in the late grain-filling stage, the mean SWC was 0.20 cm3 cm−3 (approximately 56% FWC) in the 2018–2019 season and 0.23 cm3 cm−3 (approximately 64% FWC) in the 2020–2021 season. Then, the corresponding Pns were 3–10 and 10–20 μmol m−2 s−1, respectively. Among the 12 varieties in the driest season of 2018–2019, varieties Lunxuan103, Shimai26, and Yingbo700 had a higher Pns, while Gaoyou2018, Han6172, and Zhongxinmai99 had lower Pns.
In most varieties, the parameters Tr and Gs showed similar changes as Pn. Both Tr and Gs were also closely related to SWC and growth stage. Generally, the Tr and Gs values were the highest at the heading stage (4.15–4.66 mmol m−2 s−1 and 0.27–0.31 mmol m−2 s−1, respectively), followed by the middle grain-filling stage (2.64–4.35 mmol m−2 s−1 and 0.15–0.22 mmol m−2 s−1, respectively) and late grain-filling stage (0.91–1.53 mmol m−2 s−1 and 0.04–0.06 mmol m−2 s−1, respectively) in the dry season (the 2018–2019 and 2020–2021 seasons). In addition, these parameters were the highest at the middle grain-filling stage (7.78 and 0.54 mmol m−2 s−1, respectively), followed by similar values at the heading (2.4 and 0.16, mmol m−2 s−1) and late grain-filling (3.0 mmol m−2 s−1 and 0.16 mmol m−2 s−1, respectively) stages in the normal precipitation season (the 2019–2020 season).
The LWUEs, the ratio of Pn to Tr, for the 12 wheat varieties varied greatly with wheat variety and growth stage. Generally, the LWUEs were higher at the heading stage (5.7–8.4 μmol mmol−1), followed by the middle grain-filling stage (3.7–6.2 μmol mmol−1) and at the later grain-filling stage (2.9–4.9 μmol mmol−1). Among the 12 wheat varieties, Yingbo700, Han6172 and Hannong1412 had higher LWUEs (5–8 μmol mmol−1), while Gaoyou2018, Shixin828, and Yingboaifeng8 had lower LWUEs (3–5 μmol mmol−1).
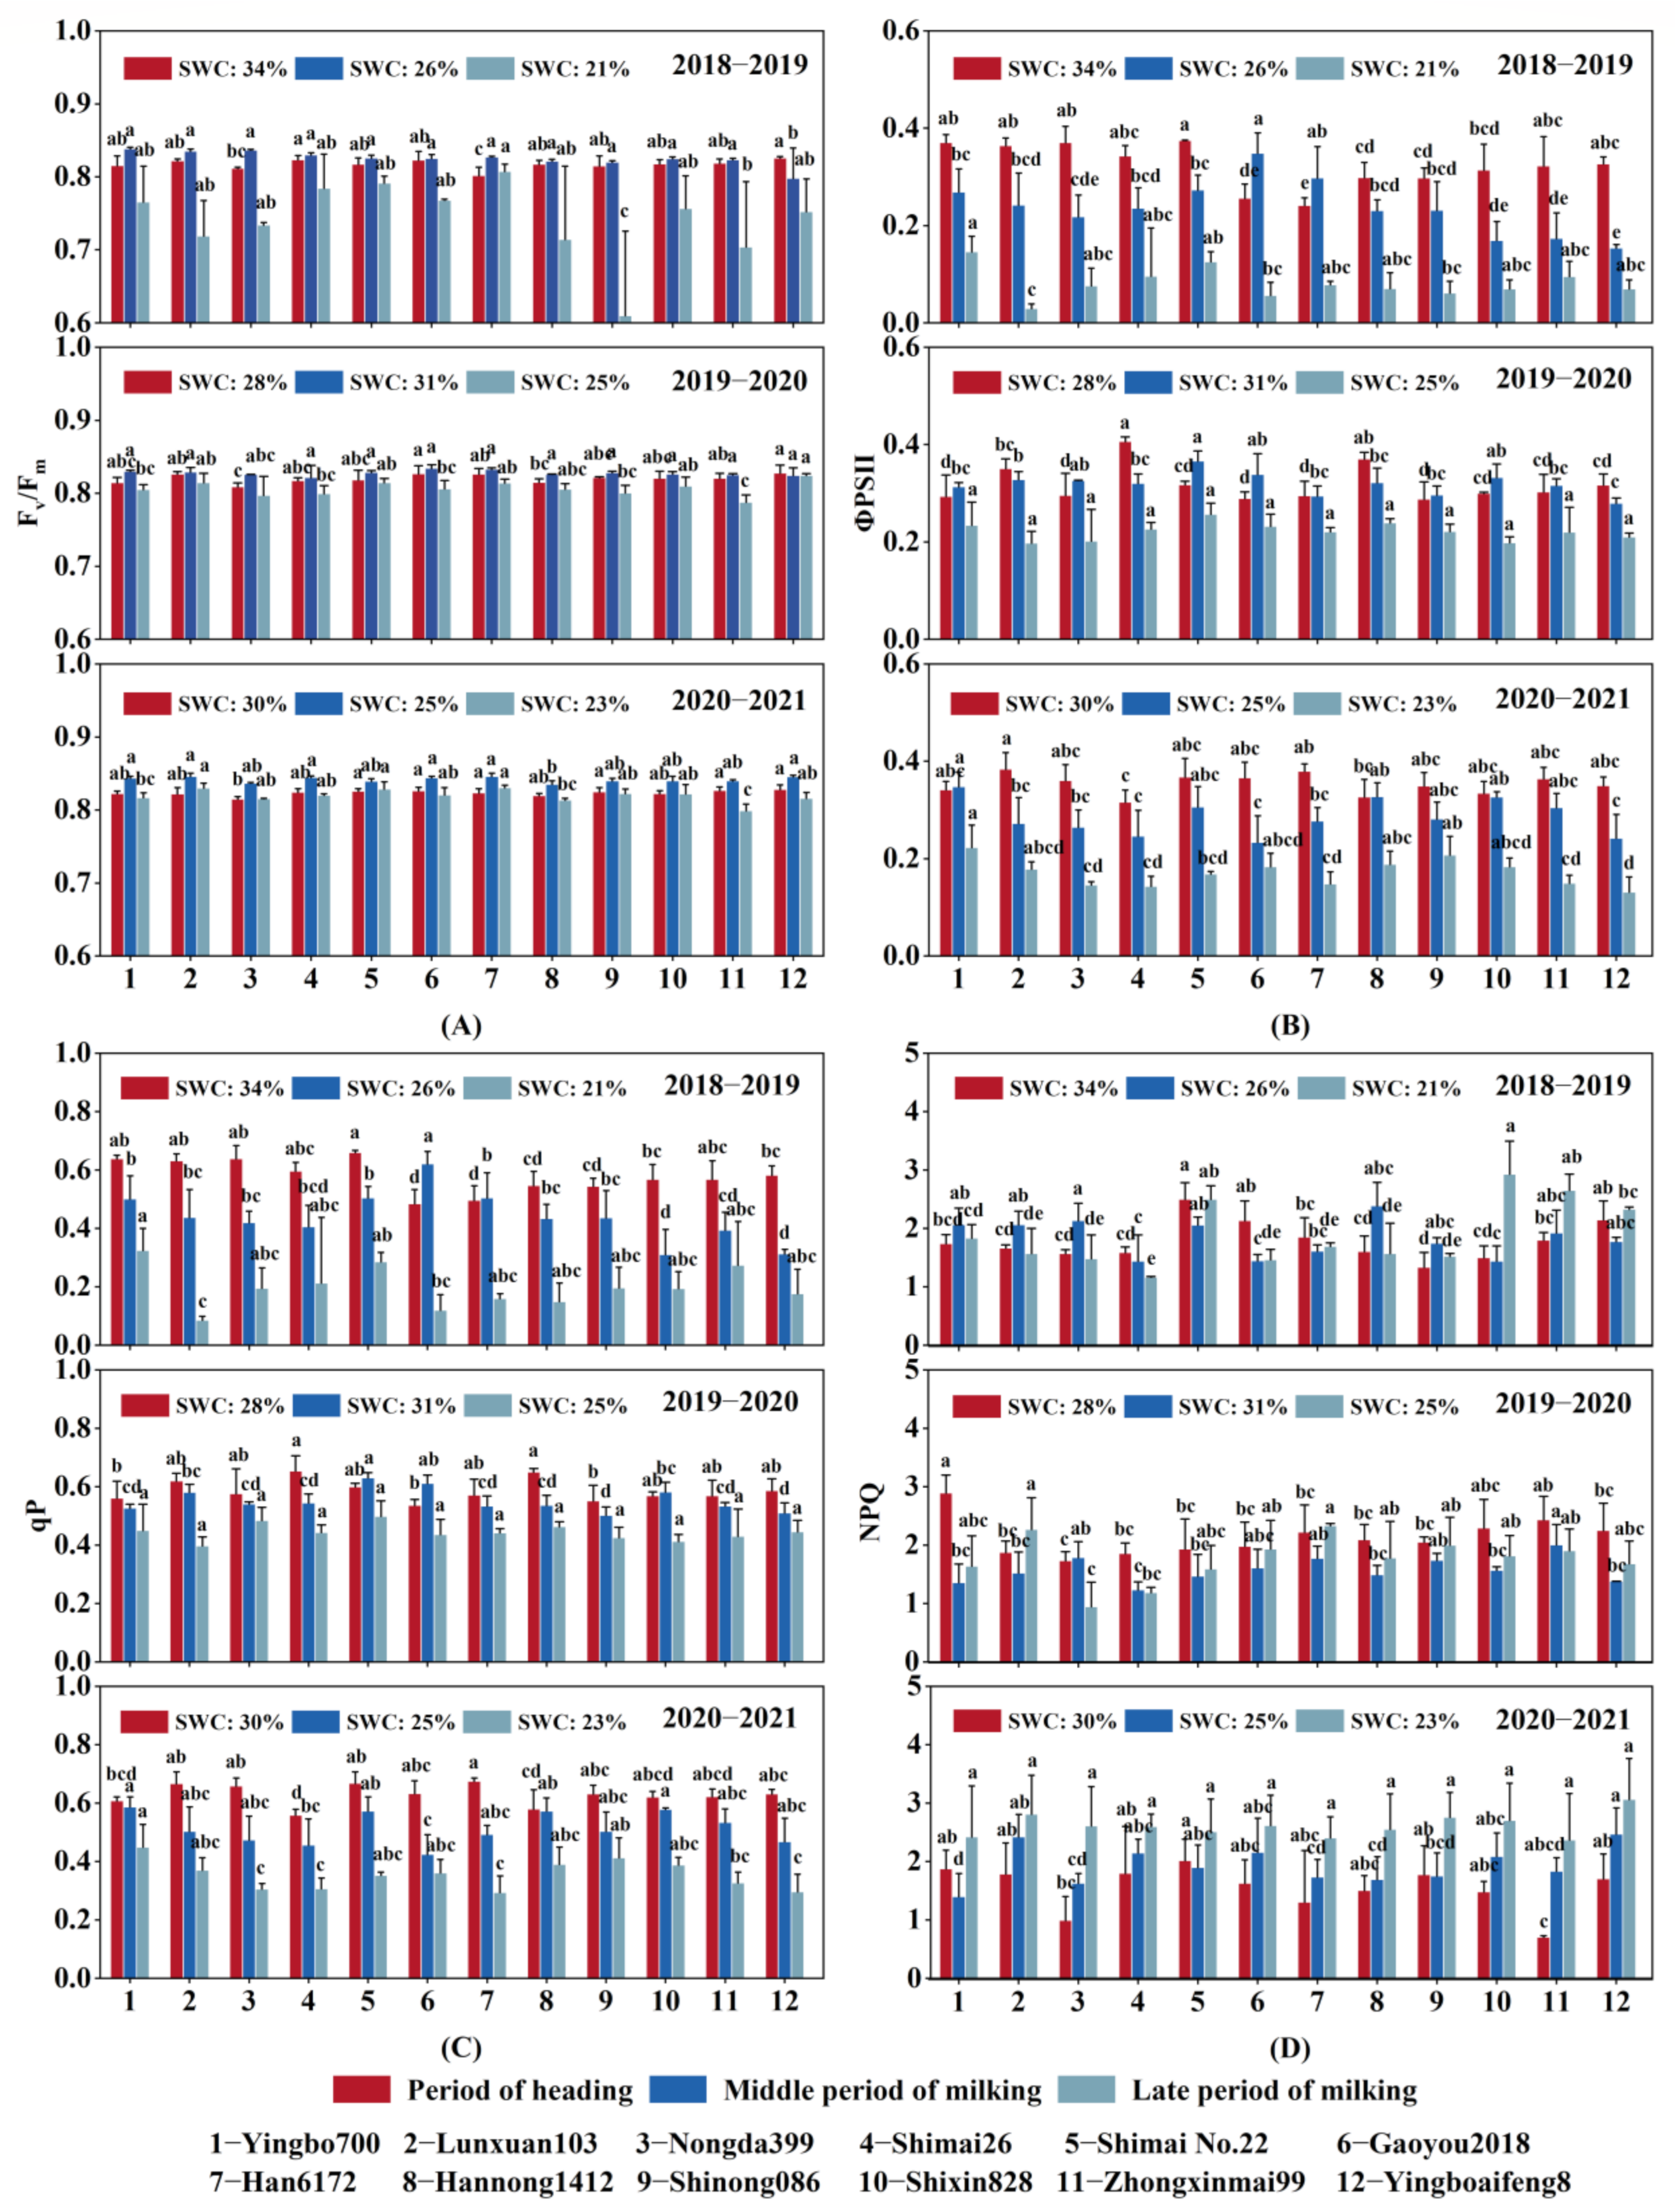
The fluorescence parameters of Fv/Fm, ΦPSII, qP, and NPQ of flag leaves for the 12 wheat varieties at the heading and middle and late grain-filling stages in the 2018–2021 wheat seasons are presented in Figure 5. The differences in Fv/Fm among all wheat varieties were relatively small at the heading and middle grain-filling stages, with values of approximately 0.80. However, the Fv/Fm at the late grain-filling stage was between 0.60 and 0.81 in the 2018–2019 season and approximately 0.80 in the 2019–2020 and 2020–2021 seasons. Among the 12 varieties at the late grain-filling stage in the 2018–2019 season, Han6172, Shimai26, and Shimai No. 22 had higher Fv/Fm values of approximately 0.80, while Shinong086, Hannong1412, and Zhongxinmai99 had lower values of 0.61, 0.71, and 0.70, respectively. This result indicates that the potential stress resistance of the first three wheat varieties was relatively high, while that of the last three varieties was relatively low. The variation in ΦPSII in different varieties was closely related to SWC, where a higher SWC generally resulted in ΦPSII.
In the three wheat seasons, the qP of most varieties generally decreased from 0.58 to 0.63 at the heading stage, from 0.44 to 0.58 at the middle grain-filling stage, and finally from 0.20 to 0.44 at the late grain-filling stage, indicating a declining trend with the growth process of winter wheat. In the dry seasons (2018–2019 and 2020–2021), qPs decreased greatly from 0.58 to 0.20 and from 0.63 to 0.35, respectively, while they decreased from 0.59 to 0.44 in the normal precipitation season (2019–2020). The changes in NPQ were evident among wheat varieties but not at different growth stages. In the dry season of 2018–2019, Shimai No. 22, Shixin828, Zhongxinmai99, and Yingboaifeng8 had higher NPQ values of 2.05–2.28, while Shimai26, Gaoyou 2018 and Han6172 had lower NPQ values of 1.31–1.65, indicating that the former varieties used more light energy for heat dissipation than the latter varieties.

3.4. Wheat Grain Yield and Water Productivity

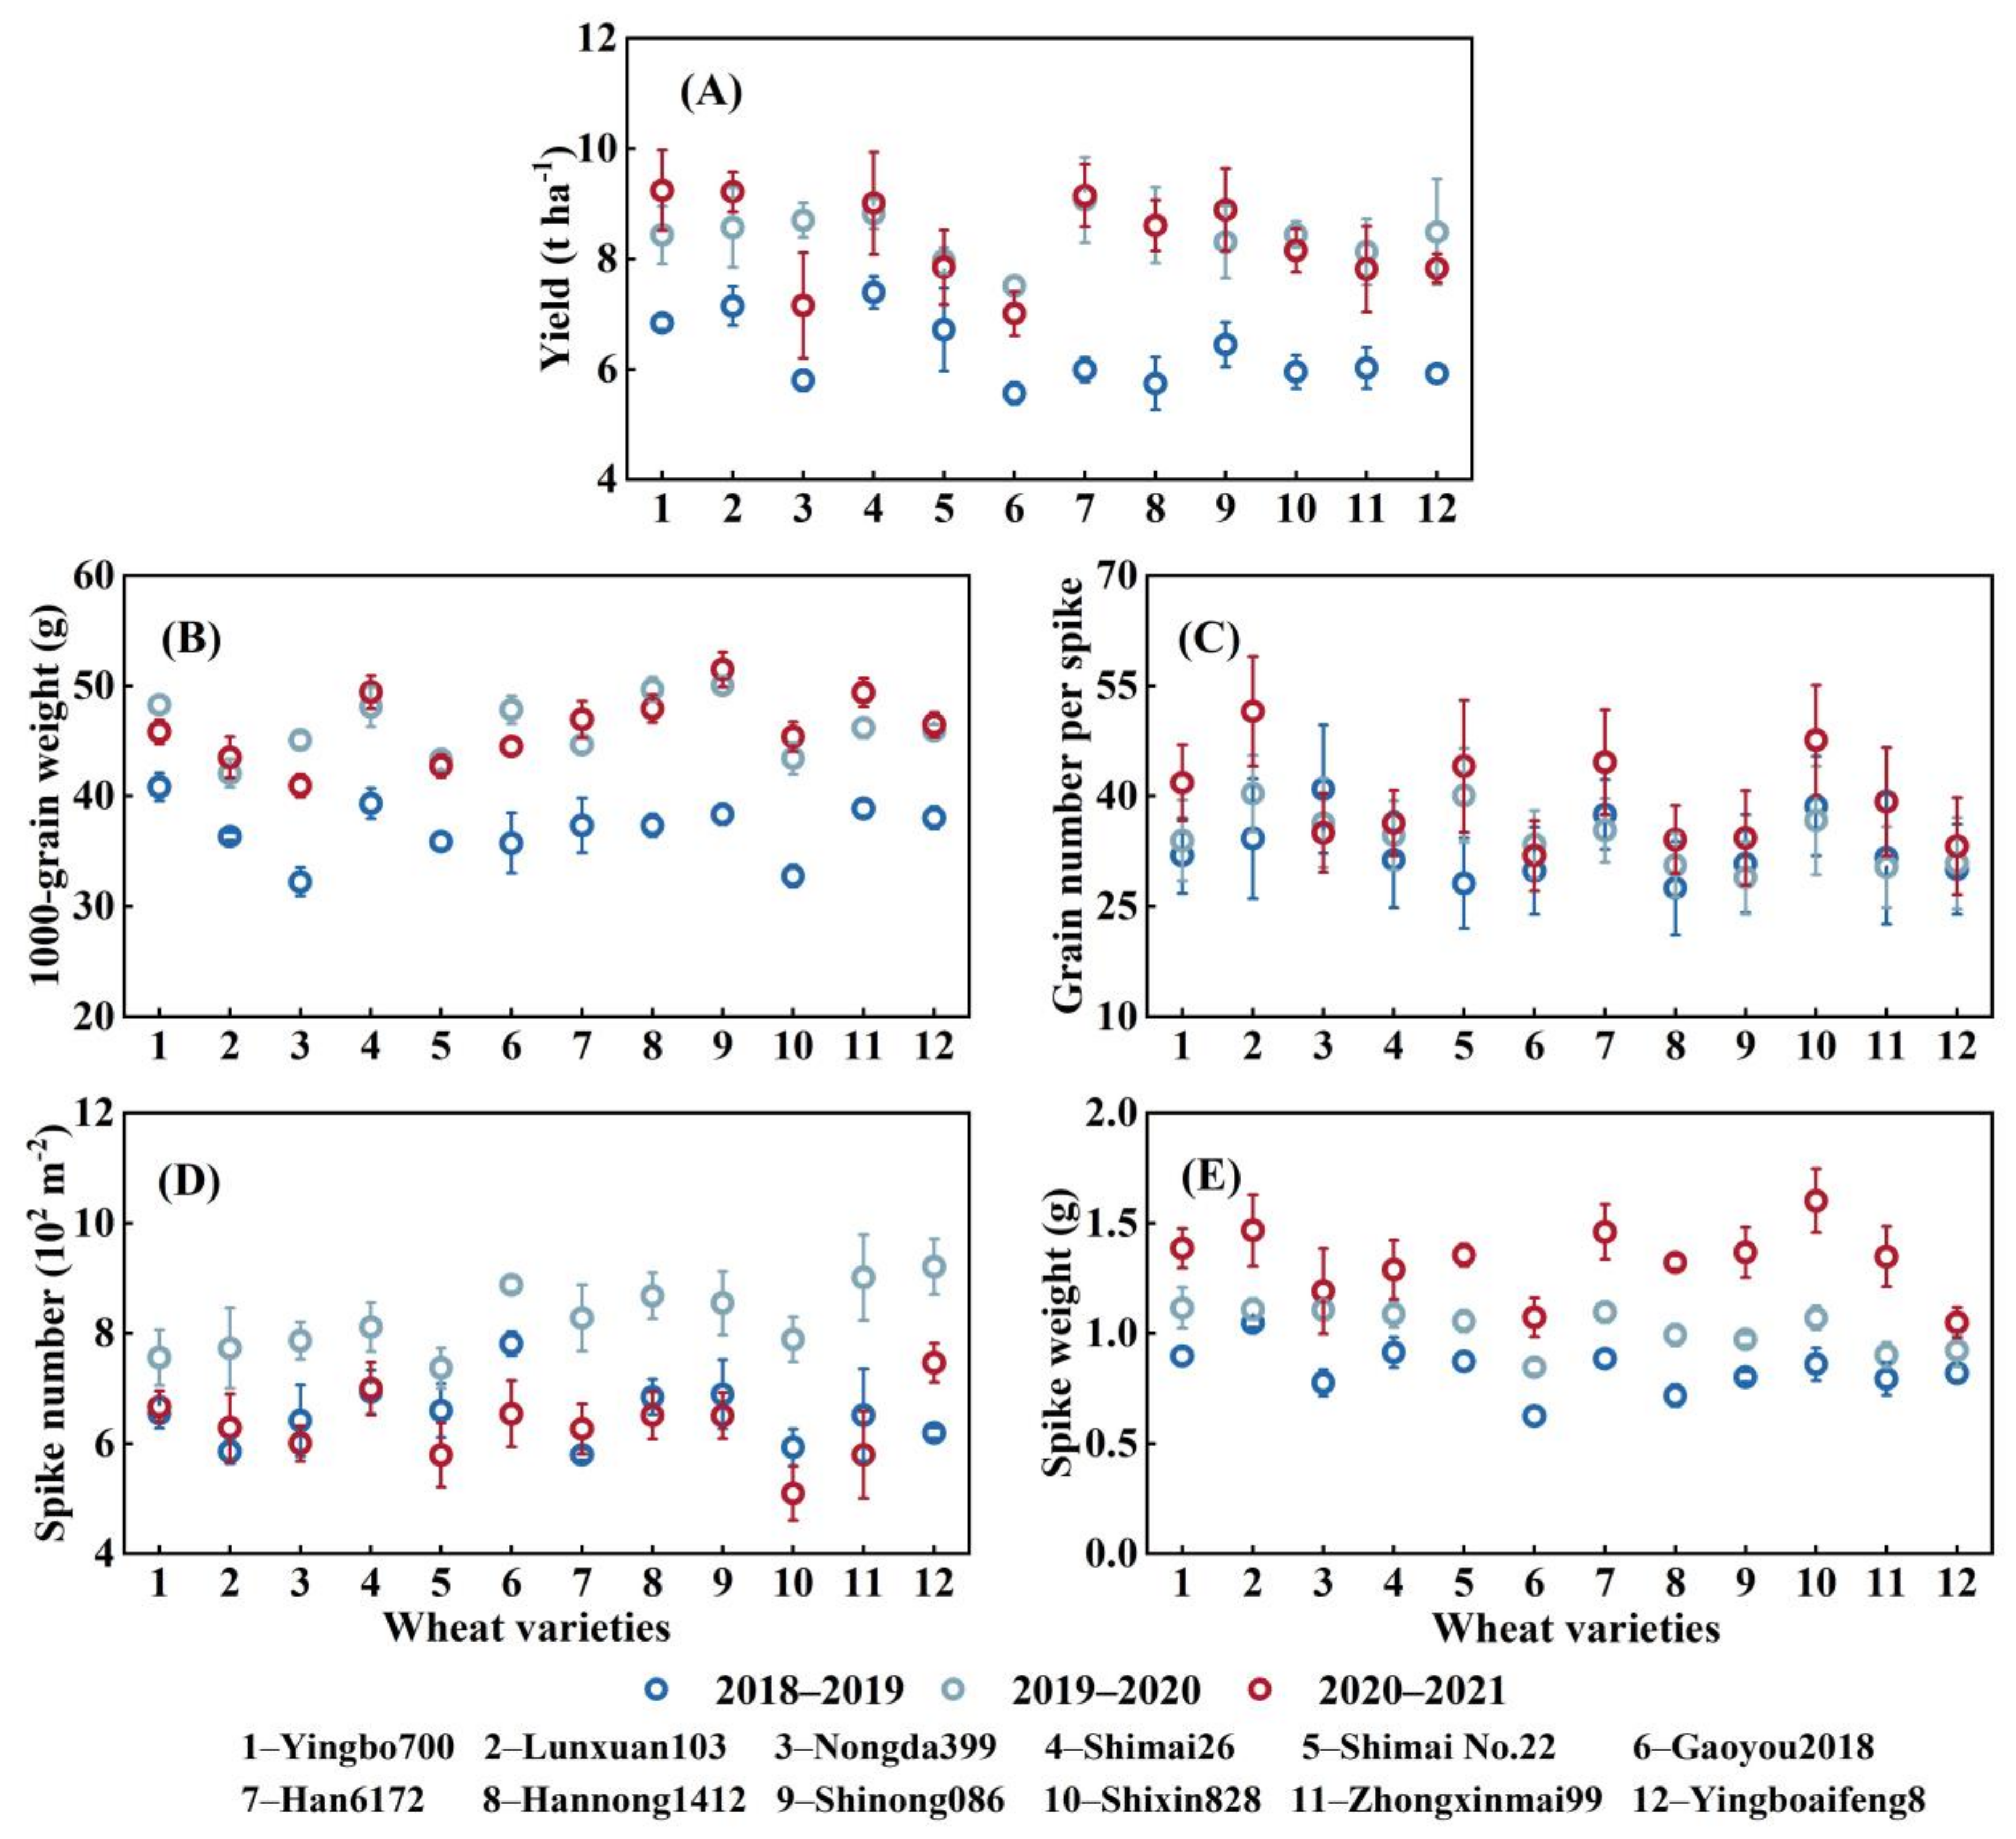
The wheat grain yield and the four yield factors of the 12 wheat varieties in three wheat seasons are shown in Figure 6. In the dry seasons (2018–2019 and 2020–2021), the mean yields of the 12 varieties were 6.3 and 8.3 t ha−1, respectively, which were 25% and 1% lower than that (8.4 t ha−1) of the normal season (2019–2020). Moreover, all yield factors in the 2018–2019 wheat season were lower than those in the normal season (2019–2020). The 1000-grain weight, grain number per spike, spike number per m2, and spike weight in the 2018–2019 seasons were 32.2–40.8 g, 27.5–41.0 grains, 580–804 spikes, and 0.6–1.1 g, respectively, which were 14–28%, −13–30%, 9–33%, and 6–30% lower than those (42.1–50.0 g, 28.9–40.1 grains, 737–921 spikes, and 0.9–1.2 g) in the 2019–2020 season. The 1000-grain weight, grain number per spike and spike weight in the 2020–2021 season were similar to those in the 2019–2020 season; however, the spike numbers per m2 (510–746 spikes m−2) in the 2020–2021 season were 12–36% lower than those in the 2019–2020 wheat season.
During the three wheat seasons, Yingbo700, Lunxuan103, and Shimai26 had the three highest wheat grain yields, Yingbo700, Shimai26, and Shinong086 had the three highest 1000-grain weights, Lunxuan103, Han6172, and Shixin828 had the highest grain numbers per spike Shimai26, Gaoyou2018, and Hannong1412 had the three highest spike numbers per m2, and Yingbo700, Lunxuan103, and Han6172 had the highest spike weights. The analysis of variance showed that wheat variety, cropping year, and their interactions affected grain yield and its components at the level of 0.01 (Table 3).
The seasonal crop evapotranspiration and water productivity of the 12 wheat varieties in the wheat seasons of 2018–2019, 2019–2020, and 2020–2021 are presented in Figure 7. In the dry seasons (2018–2019 and 2020–2021), ETas were 369–408 and 383–424 mm, respectively, and the corresponding WPs were 1.41–1.94 and 1.72–2.32 kg m−3, respectively. However, in the normal precipitation season (2019–2020), ETa and WP were 397–439 mm and 1.79–2.12 kg m−3, respectively. Compared with the 2019–2020 season, the mean ETa over the 12 varieties was 7% lower in the 2018–2019 season and 3% lower in the 2020–2021 season, while the mean WPs were 19% lower in the 2018–2019 season and 2% higher in the 2020–2021 season than those in the 2019–2020 season. In the 2018–2019 wheat season (with the lowest rainfall), the ETas of Lunxuan103, Shinong086, and Shixin828 were higher, and the WPs of Yingbo700, Lunxuan103, and Shimai26 were higher among the 12 wheat varieties. In the 2019–2020 wheat season (with the highest precipitation), the ETas of Shimai26, Shimai No. 22, and Shixin828 were higher, while the WPs of Han6172, Hannong1412, and Shinong086 were higher in the 12 varieties.

3.5. Relationships between Wheat Yield and Growth and Physiological Indicators

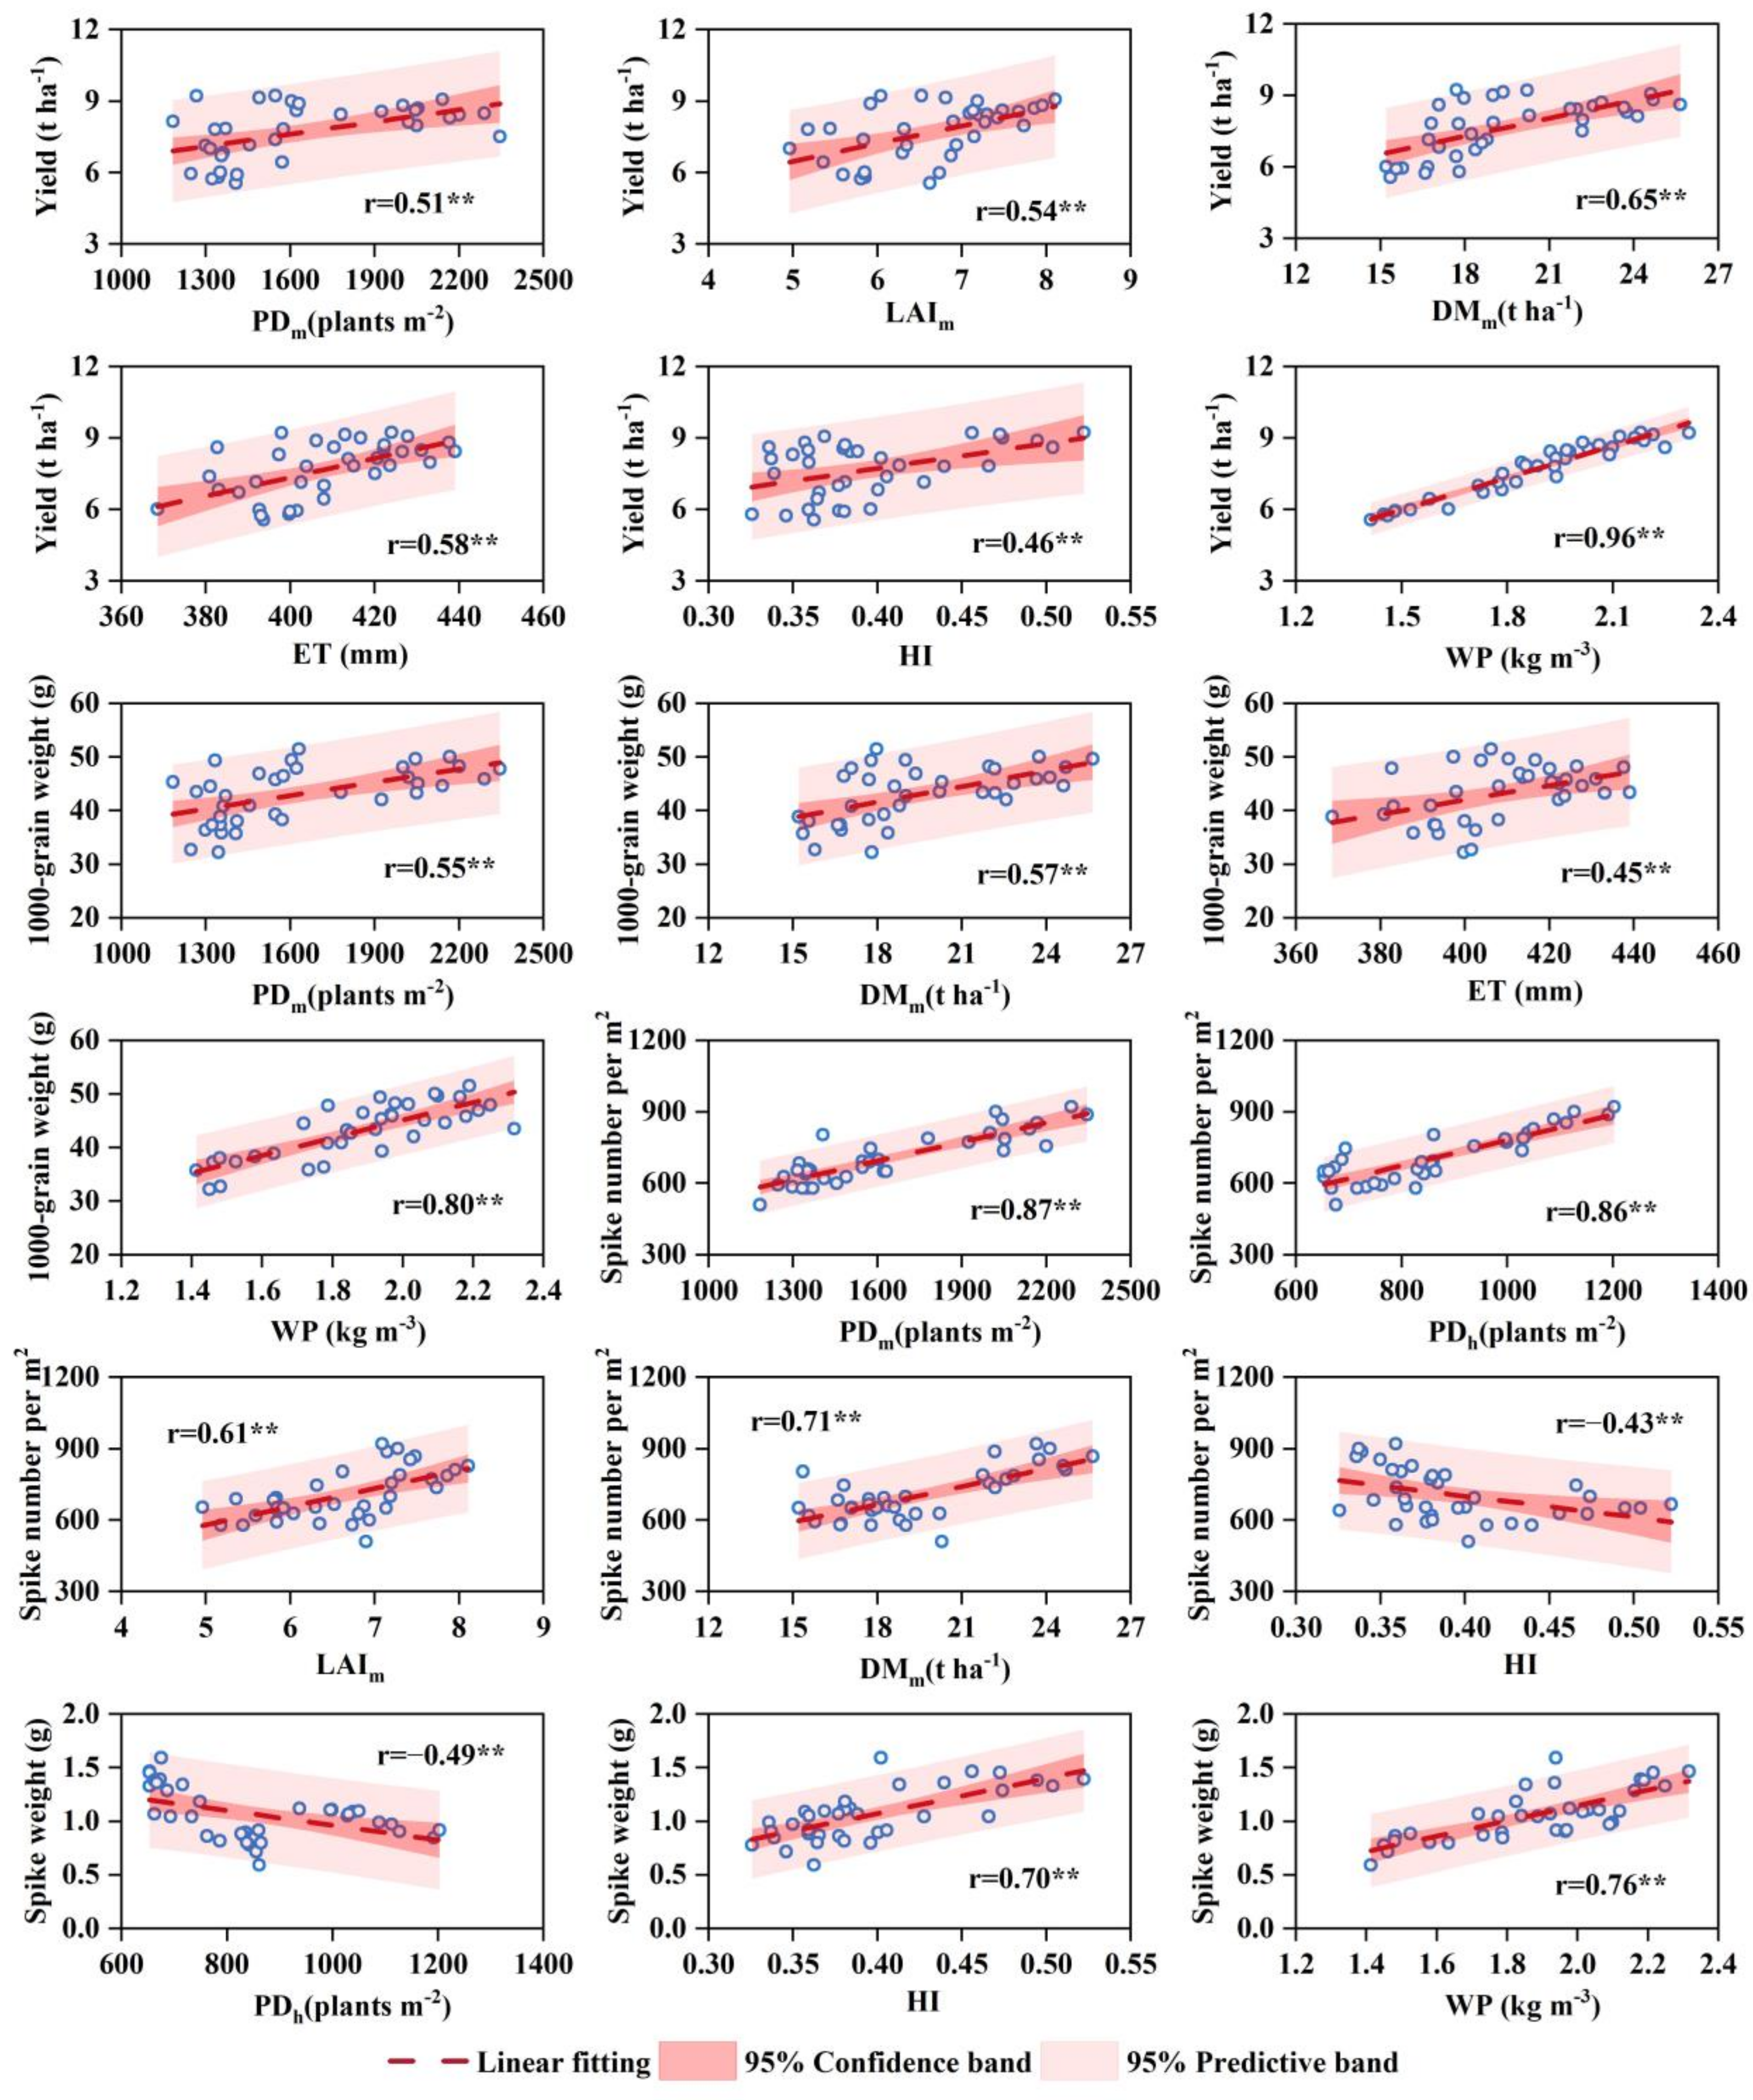
The correlation coefficients between grain yield and growth indicators of the 12 wheat varieties in the three wheat seasons are shown in Table 4, and Figure 8 shows the relationship between them at the significance level of 0.01. The yield grain was significantly positively correlated with PDm, LAIm, DMm, ETa, HI, and WP at the level of 0.01, with correlation coefficients of 0.51, 0.54, 0.65, 0.58, 0.46, and 0.96, respectively. The high-yield wheat varieties generally had a greater PDm, LAIm, DMm, ETa, HI, and WP. At the significance level of 0.01, the 1000-grain weight of different varieties showed a positive correlation with PDm, DMm, ETa, and WP, the spike number per m2 showed a positive correlation with PDm, PDh, LAIm, and DMm and a negative correlation with HI, and the spike weight was negatively correlated with PDh and positively correlated with HI and WP.
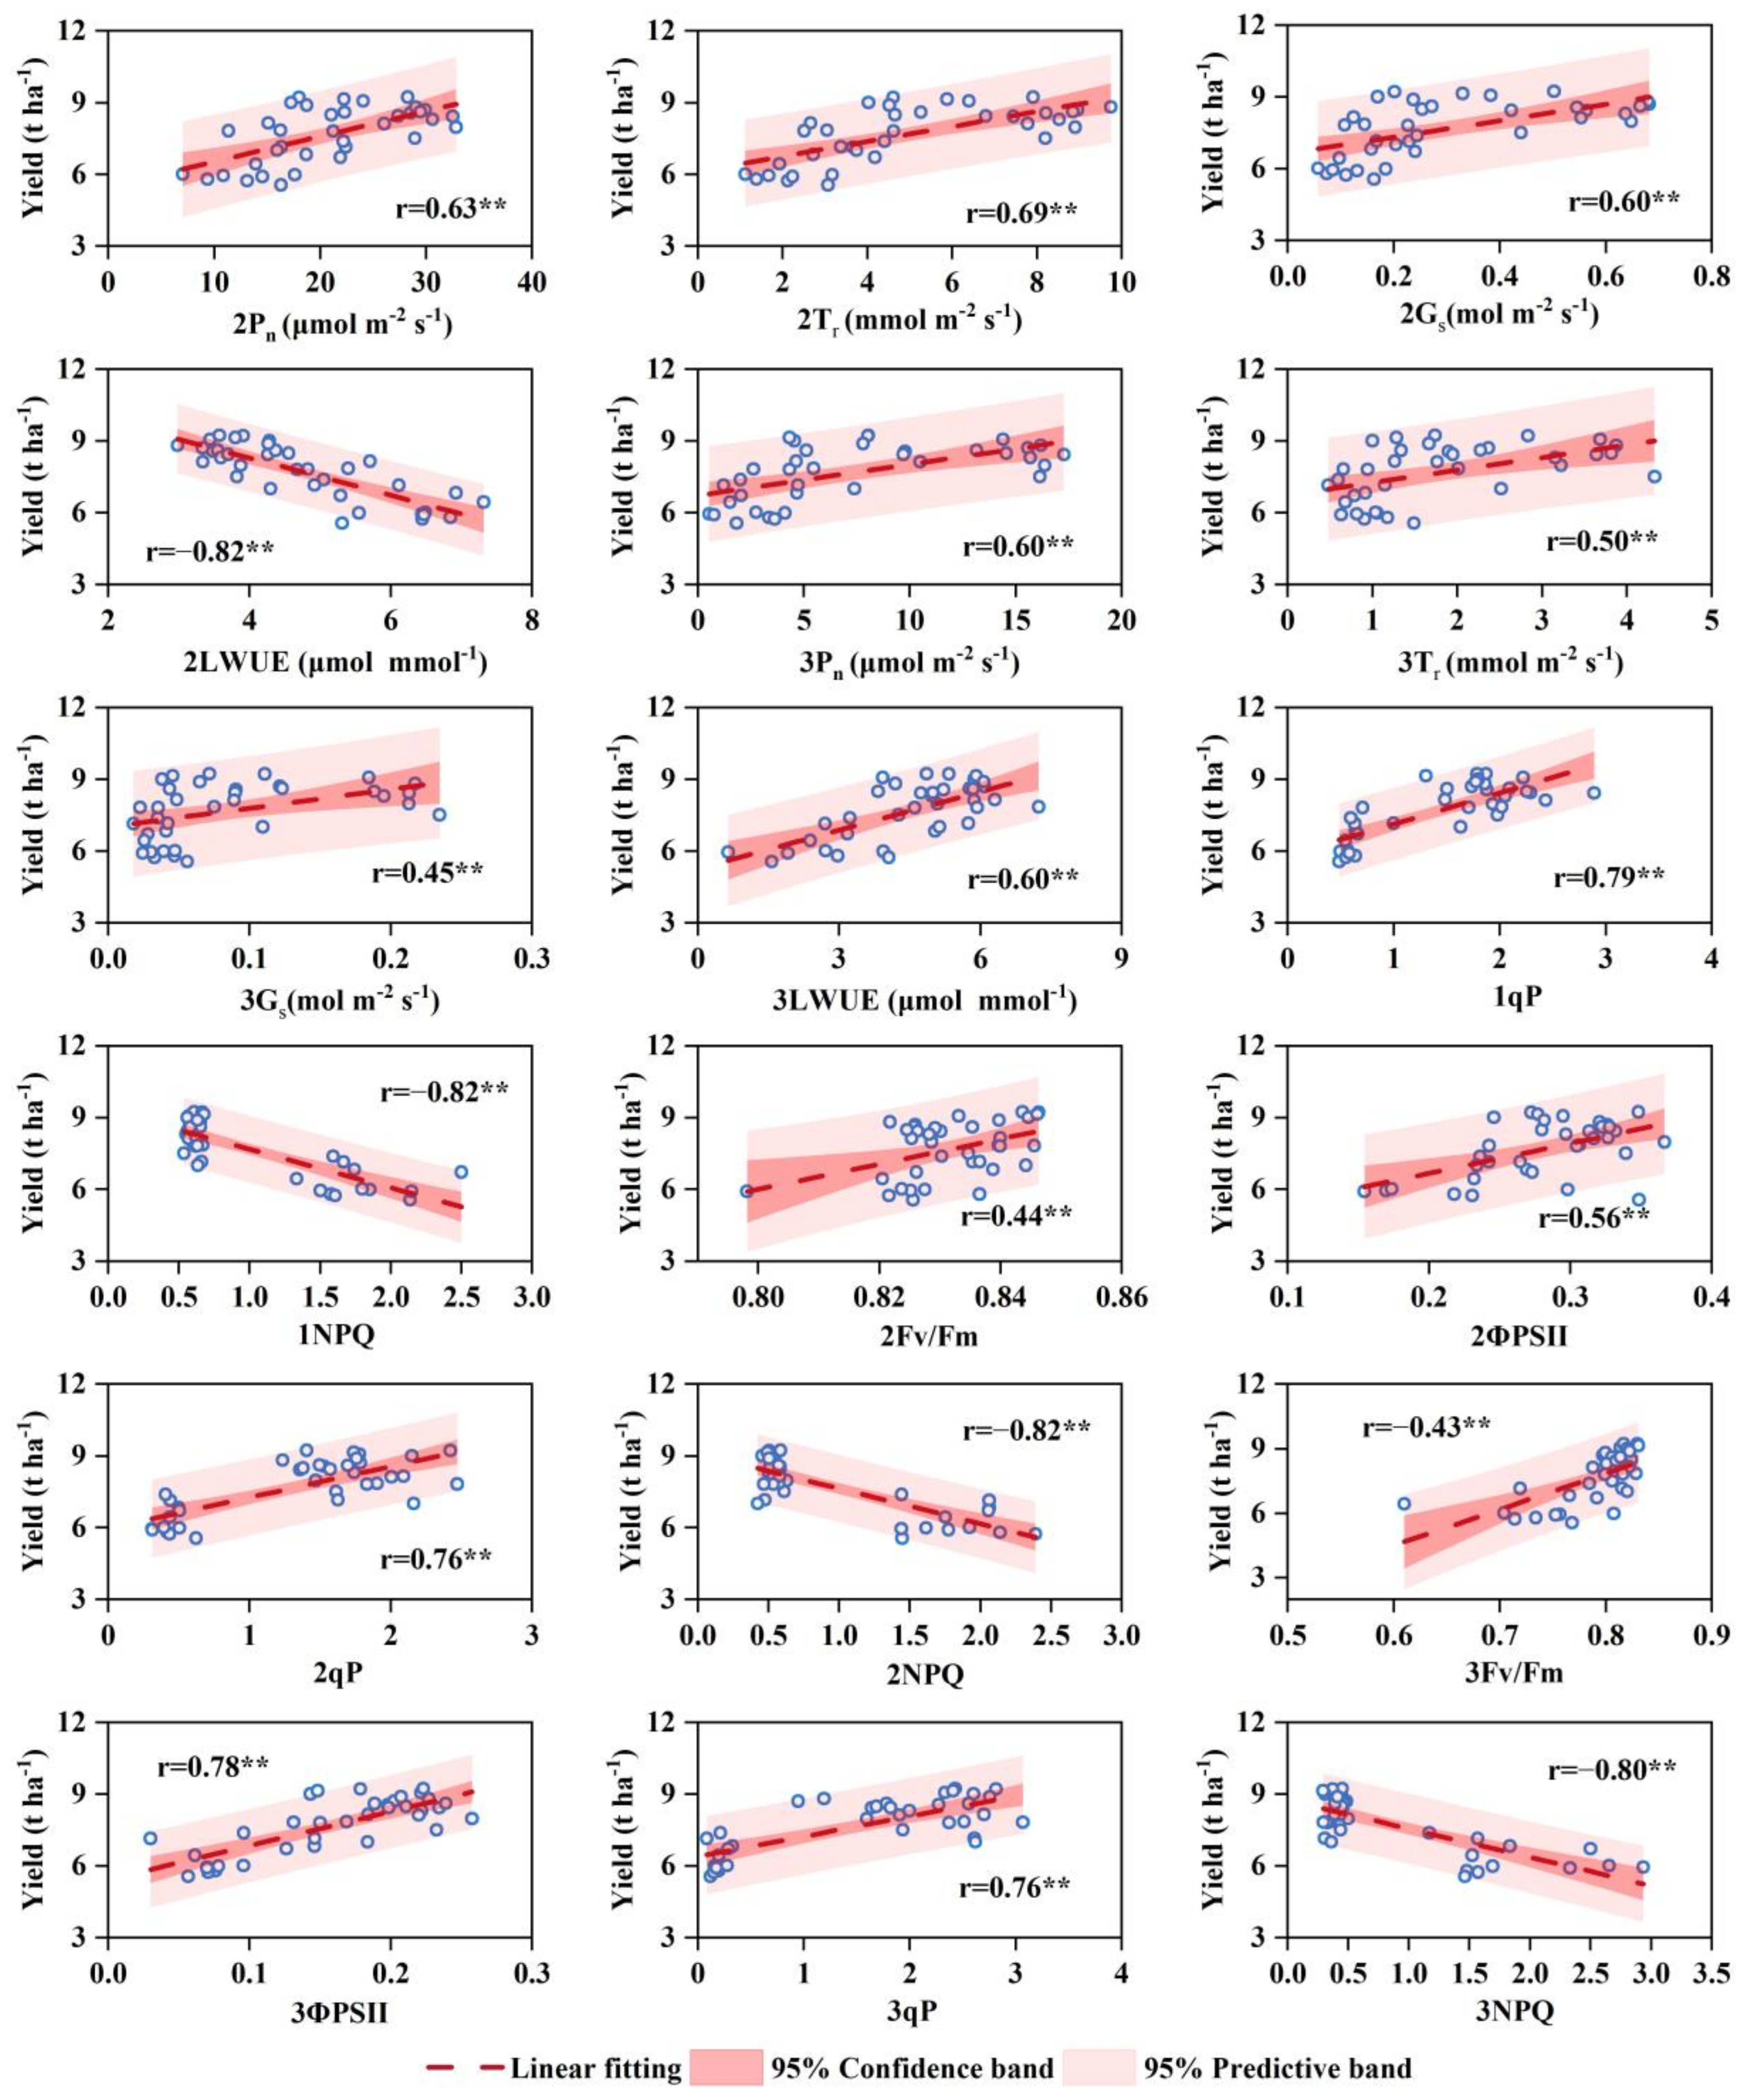
Table 5 shows the correlation coefficients between grain yield factors and gas exchange parameters of flag leaves at different growth stages for the 12 wheat varieties in 2019–2021, and Figure 9 shows the relationship between grain yield and physiological parameters at the significance level of 0.01. The grain yield and 1000-grain weight were significantly related to all the gas exchange parameters in the middle and late milking stages, with a significance level of 0.01. This result indicates that the wheat varieties with a high grain yield and 1000-grain weight exhibited stronger photosynthesis in the middle and late milking stages. Furthermore, the spike number per m2 had a relationship with all the gas exchange parameters of the three periods at the significance level of 0.05.
Table 6 presents the correlation coefficients between grain yield factors and chlorophyll fluorescence parameters of flag leaves at different growth stages for the 12 wheat varieties in 2018–2021. The grain yield, 1000-grain weight, and spike weight were positively correlated with qP in the heading stage and with Fv/Fm, ΦPSII, and qP in the middle and late milking stages at a significance level of 0.05. These parameters were also negatively correlated with NPQ in the three periods at a significance level of 0.01. At the significance level of 0.01, the grain number per spike had a positive correlation with Fv/Fm in the middle milking stage and with qP in the late milking stage, and the spike number per m2 showed a significant positive correlation with qP in the heading stage and with Φ PSII in the late milking stage.

4. Discussion

4.1. Relationship between Physiological Indicators and Soil Water Content

In this study, the gas exchange parameters Pn, Tr, and Gs, and chlorophyll fluorescence parameters ΦPSII and qP of the 12 varieties tended to change with growth, as follows (from high to low): heading stage > middle grain-filling stage > late grain-filling stage in the dry seasons (2018–2019 and 2020–2021 seasons). In the normal season (2019–2020), the order was as follows: middle milking stage > heading stage > late milking stage (Figure 4 and Figure 5). The changes in these photosynthetic parameters were consistent with the changes in SWC in the field. Generally, when crops are subjected to mild and moderate water stress, stomatal conductance decreases, which limits the availability of CO2 in leaves, resulting in a drop in the photosynthetic rate [38,39]. When crops are subjected to severe water stress, photosynthesis-related enzyme activity is inhibited, chlorophyll content is reduced, protein synthesis is inhibited, and oxidative stress reactions are induced, which obviously reduces the photosynthetic rate and accelerates leaf senescence [40]. Zhao et al. [41] found that compared with the well-watered treatments, the mean Pn of the mild (50–60% FWC), moderate (40–50% FWC), and severe stress (30–40% FWC) treatments decreased by 2.8%, 21.5%, and 35.9%, respectively, during the wheat stages from elongation to maturity. Sharma and Kumar [42] observed that compared with the normal irrigated treatments, Pn, Gs, and Tr in flag leaves of four wheat varieties decreased by 36.4%, 33.0%, and 15.6% under two irrigation treatments and by 62.9%, 55.5%, and 49.6% under single irrigation treatments, respectively. In this study, in the 2018–2019 season, the wheat crop was under a well-watered environment at the heading stage, with a SWC of 0.34 cm3 cm−3 (approximately 94% FWC). The mean Pn of the 12 varieties was 24.26 μmol m−2 s−1, and, while the field SWC was reduced to 0.26 and 0.20 cm3 cm−3 (from 72% to 56% FWC) in the middle and late grain-filling stages, respectively, the corresponding mean Pn decreased to 15.66 and 2.58 μmol m−2 s−1 (Figure 4). A higher Pn indicates greater potential for the formation of dry matter, organs, and yield when crops are subjected to water stress [43]. Therefore, high-yield wheat varieties can be selected by the high Pn of crops under drought conditions. Among the 12 wheat varieties under the same water management conditions in the 2018–2019 season, the varieties Lunxuan103, Shimai26, and Yingbo700 had higher Pns under water stress in the middle and late grain-filling stages (Figure 4), and the yield data also showed that these three wheat varieties had higher yields in that season (Figure 6).

4.2. Relationship between Yield Factors and Physiological and Ecological Indicators

Crop yield has a close relationship with physiological and ecological characteristics. In this study, the wheat yield of the 12 wheat varieties was positively correlated with PDm, LAIm, DMm, ETa, HI, and WP at the significance level of 0.01 (Table 4). This result indicates that the high-yield wheat variety generally had a larger PDm, LAIm, DMm, ETa, HI, and WP. Meena et al. [44] found that the grain yield of 16 wheat varieties in India was positively correlated with HI and WP at the significance level of 0.01. Lu et al. [45] reported that the grain yield for 32 wheat varieties, including Nongda399, Shimai No. 22, and Gaoyou2018 in our study, under different water treatments in the NCP had a significant correlation with DMm at the 0.01 significance level. Beche et al. [46] observed that the correlation coefficients between grain yield and DMm and HI were 0.91 and 0.94 for 10 wheat varieties in Brazil, respectively. The results of these previous studies of different wheat varieties from other regions or the same wheat varieties in the NCP are consistent with our results.
Furthermore, the wheat grain yield of the 12 wheat varieties had a stronger correlation with gas exchange parameters and fluorescence parameters at the middle and late milking stages in this study (Table 5 and Table 6). This result fully demonstrates that the high photosynthetic rate in the middle and late stages is very important for a crop’s high yield. A higher photosynthetic rate at the middle and late stages not only provides more material basis for milking but also ensures a longer grain filling time, resulting in high yield [47,48]. Similar to our conclusion, Chang et al. [49] found that compared with the rice variety ‘SY63’, Pn at the late milking stage was 32–38% higher in the rice variety ‘YLY900’, and the corresponding grain yield was 14–19% higher. Liu et al. [9] found that compared with the wheat variety ‘Yanmai20’, the average values of Pn, Tr, and Gs in the late grain-filling stage were 28%, 22%, and 38% higher, respectively, in the wheat variety ‘Shijiazhuang8’ under mild water stress (65–70% field water capacity), and the corresponding grain yield was 14% higher.
Due to the different climates/environments in the three wheat growing seasons (Figure 2), the relationship between wheat yield and physiological and ecological characteristics revealed in this study can be used to address climate change in wheat production in the NCP as well as in other regions in the world. In this study, high grain yields were found for varieties Yingbo700, Lunxuan103, and Shimai26 in the three seasons, indicating that these varieties are highly resistant to water stress and cold/high temperatures. However, varieties Nongda399 and Yingboaifeng8 had high yields in the 2019–2020 season and low yields in the 2018–2019 and 2020–2021 seasons, showing a high sensitivity to climate change. Considering the high possibility of cold/high temperatures and drying trends under climate change worldwide, varieties with high resistance to temperature and water stress are preferentially recommended to address climate change. Based on the relationship between wheat yield and physiological and ecological characteristics, the growth characteristics. PDm, LAIm, DMm, ETa, HI, and WP, and the physiological characteristics Pn, Tr, Gs, LWUE, Fv/Fm, ΦPSII, qP, and NPQ, at the middle and late milking stages are reliable parameters that can be used to evaluate the yield potential of wheat varieties in the NCP [29] as well as other regions in the world.

4.3. Selecting High-Yield and Drought-Resistant Wheat Varieties

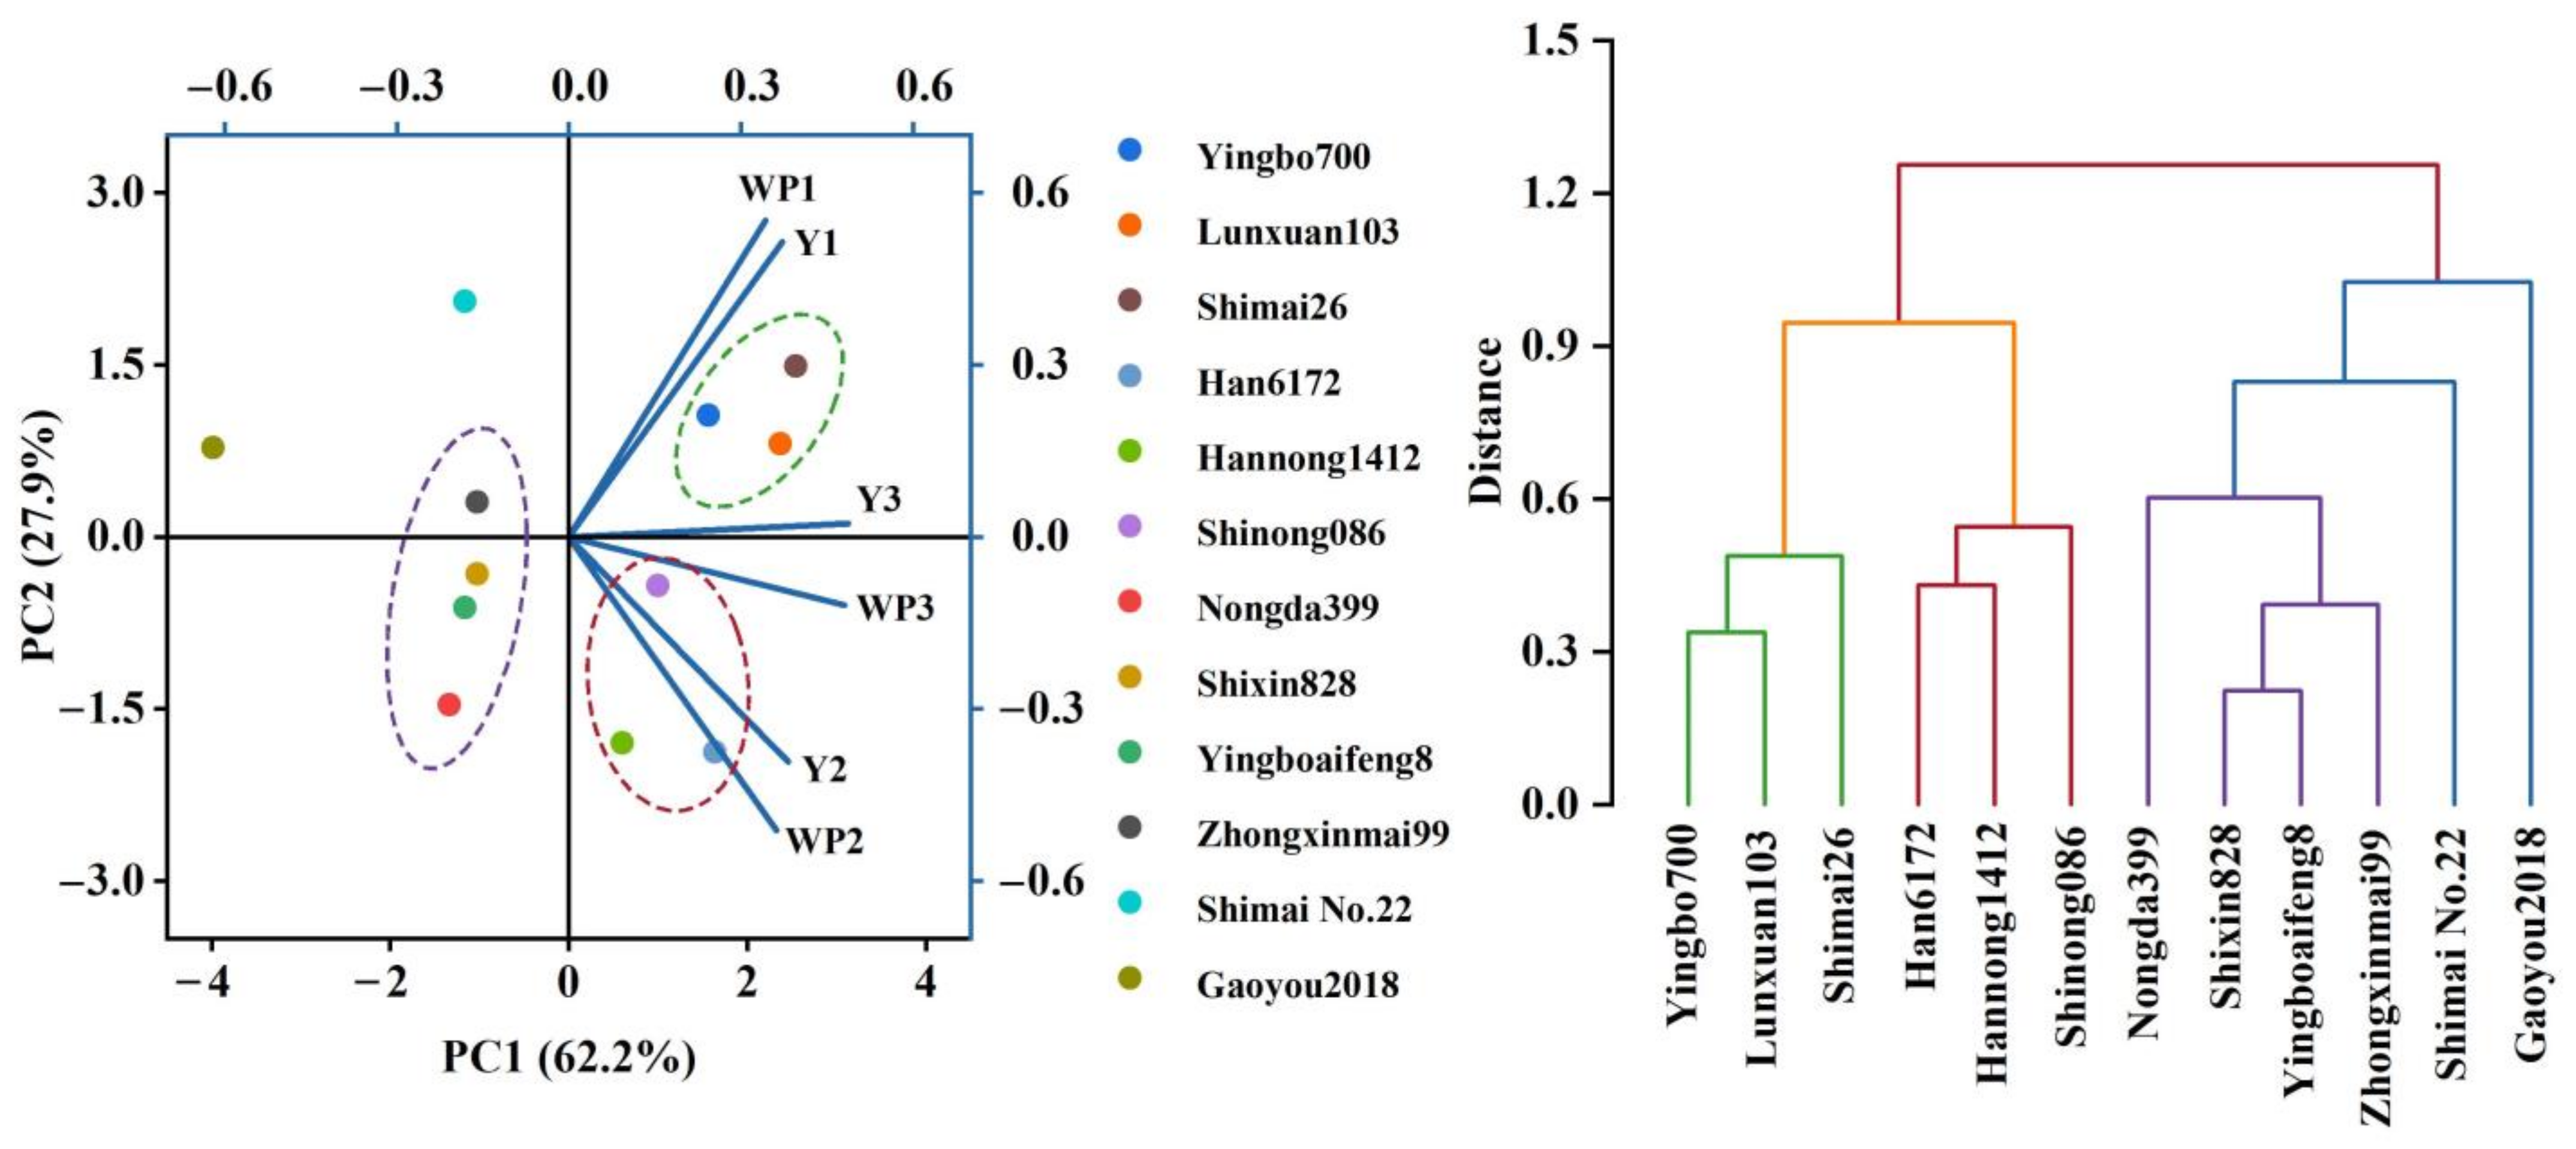
Based on the indicators related to yield and water productivity of the 12 wheat varieties in the three wheat growing seasons, principal component analysis and hierarchical cluster diagram methods were used for screening wheat varieties with high yield potential and drought-resistance characteristics. Based on the principal component analysis (Figure 10), the six indicators (three yields and three WPs in the three experimental seasons) of each wheat variety were reduced to two main components (Axis 1 and Axis 2), which accounted for a total of 90.1% of the explanations for these six indicators, indicating a high level of explanation. Considering the results of the principal component analysis and hierarchical clustering analysis comprehensively, the 12 wheat varieties were mainly divided into two categories: high-yield and drought-resistant varieties, and low-yield and less drought-resistant varieties. The high-yield and drought-resistant varieties included the varieties Yingbo700, Lunxuan103, Shimai26, Shinong086, Han6172, and Hanong1412, among which Yingbo700, Lunxuan103, and Shimai26 were much better, in agreement with those recommended by regional agricultural bureaus [50]. The low-yield and less drought-resistant varieties included Nongda399, Shixin828, Yingboaifeng8, Zhongxinmai99, Shimai No. 22, and Gaoyou2018, among which Shimai No. 22 and Gaoyou 2018 were more sensitive to water stress. Considering the high variation in precipitation in winter wheat seasons [20,51], these water-sensitive wheat varieties are not recommended in the NCP. In the three-year field experiment, compared with the six low-yield and less drought-resistant varieties, the average yield of the six better varieties was increased by 5–18% (428–1383 kg ha−1) and that of the three best varieties was increased by 5–20% (400–1520 kg ha−1) (Figure 6). Moreover, the average ETa of the six or three better varieties was approximately 1% lower than that of the six worse varieties. In this case, under the same field management conditions, farmers’ income can increase by 800–3040 yuan ha−1 because of the increased yield (the price of wheat was 2 yuan per kilogram) which would increase farmers’ interest in choosing better wheat varieties.

5. Conclusions

By analyzing the meteorological factors, soil water, growth indicators, physiological indicators, yield factors, and water productivity of the 12 widely cultivated wheat varieties in the North China Plain for three winter wheat growth seasons from 2018 to 2021, the main conclusions were as follows:
(1)
In the natural meteorological environments and under deficit irrigation, the PHm of each wheat variety was relatively stable over time, but there were obvious changes in PDm, LAIm, and DMm.
(2)
The gas exchange parameters and fluorescence parameters in wheat flag leaves were closely related to soil water content. Generally, Pn, Tr, Gs, ΦPSII, and SWC showed a clear change pattern with growth as follows (from high to low): heading stage > middle grain-filling stage > late grain-filling stage in the dry season, and middle grain-filling stage > heading stage > late grain-filling stage in the normal precipitation/climatic season.
(3)
Compared with the normal precipitation/climatic wheat season (2019–2020 season), the changes in yield, ETa, and WP of the 12 varieties were −25%, −7%, and −19% in the 2018–2019 season and −1%, −3%, and 2% in the 2020–2021 season, respectively. The much lower yield in the 2018–2019 season was due to the lower spike number, grain number per spike, and 1000-grain weight. The lower yield in the 2020–2021 season was due to the low spike number.
(4)
Wheat yield showed a positive correlation with PDm, LAIm, DMm, ETa, HI, and WP at a significance level of 0.01. High-yield wheat varieties had stronger photosynthetic rates in the middle and late grain-filling stages. These growth and physiological parameters can be used to address climate change in wheat production in the NCP as well as other regions in the world.
(5)
Based on yield and WP, the varieties Yingbo700, Lunxuan103, Shimai26, Shinong086, Han6172, and Hanong1412 are recommended for cultivation, as they possess high yield potential and drought resistance capacity in the North China Plain.

Author Contributions

Conception and design of experiments: H.L.; performance of experiments and analysis of data: X.T. and W.Z.; writing—review and editing: X.T. and H.L. All authors have read and agreed to the published version of the manuscript.

Funding

This work was supported by the National Nature Science Foundation of China (NO. 51939005) and the 111 Project (B18006).

Data Availability Statement

Data are contained within the article.

Acknowledgments

We greatly appreciate the field help of Li Yang, Lu Li, Zhuangzhuang Gao, Dongxue Feng and Jie Chang.

Conflicts of Interest

The authors declare no conflict of interest.

References

  1. Kumari, A.; Lakshmi, G.A.; Krishna, G.K.; Patni, B.; Prakash, S.; Bhattacharyya, M.; Singh, S.K.; Verma, K.K. Climate change and its impact on crops: A comprehensive investigation for sustainable agriculture. Agronomy 2022, 12, 3008. [Google Scholar] [CrossRef]
  2. Zhao, C.; Liu, B.; Piao, S.; Wang, X.; Lobell, D.B.; Huang, Y.; Huang, M.; Yao, Y.; Bassu, S.; Ciais, P.; et al. Temperature increase reduces global yields of major crops in four independent estimates. Proc. Natl. Acad. Sci. USA 2017, 114, 9326. [Google Scholar] [CrossRef] [PubMed]
  3. Lesk, C.; Rowhani, P.; Ramankutty, N. Influence of extreme weather disasters on global crop production. Nature 2016, 529, 84–87. [Google Scholar] [CrossRef] [PubMed]
  4. Islam, A.F.M.T.; Islam, A.K.M.S.; Islam, G.M.T.; Bala, S.K.; Salehin, M.; Choudhury, A.K.; Dey, N.C.; Hossain, A. Adaptation strategies to increase water productivity of wheat under changing climate. Agric. Water Manag. 2022, 264, 107499. [Google Scholar] [CrossRef]
  5. Wang, X.; Li, L.; Ding, Y.; Xu, J.; Wang, Y.; Zhu, Y.; Wang, X.; Cai, H. Adaptation of winter wheat varieties and irrigation patterns under future climate change conditions in Northern China. Agric. Water Manag. 2021, 243, 106409. [Google Scholar] [CrossRef]
  6. Rogger, J.; Hund, A.; Fossati, D.; Holzkämper, A. Can Swiss wheat varieties escape future heat stress? Eur. J. Agron. 2021, 131, 126394. [Google Scholar] [CrossRef]
  7. Yuan, Y.; Liu, L.; Gao, Y.; Yang, Q.; Dong, K.; Liu, T.; Feng, B. Comparative analysis of drought-responsive physiological and transcriptome in broomcorn millet (Panicum miliaceum L.) genotypes with contrasting drought tolerance. Ind. Crop. Prod. 2022, 177, 114498. [Google Scholar] [CrossRef]
  8. Urban, O.; Hlaváová, M.; Klem, K.; Novotná, K.; Rapantová, B.; Smutná, P.; Horáková, V.; Hlavinka, P.; Karpa, P.; Trnka, M. Combined effects of drought and high temperature on photosynthetic characteristics in four winter wheat genotypes. Field Crops Res. 2018, 223, 137–149. [Google Scholar] [CrossRef]
  9. Liu, E.K.; Mei, X.R.; Yan, C.R.; Gong, D.Z.; Zhang, Y.Q. Effects of water stress on photosynthetic characteristics, dry matter translocation and WUE in two winter wheat genotypes. Agric. Water Manag. 2016, 167, 75–85. [Google Scholar] [CrossRef]
  10. Bergkamp, B.; Impa, S.M.; Asebedo, A.R.; Fritz, A.K.; Jagadish, S.V.K. Prominent winter wheat varieties response to post-flowering heat stress under controlled chambers and field based heat tents. Field Crops Res. 2018, 222, 143–152. [Google Scholar] [CrossRef]
  11. Tesfaye, K.; Kruseman, G.; Cairns, J.E.; Zaman-Allah, M.; Wegary, D.; Zaidi, P.H.; Boote, K.J.; Rahut, D.; Erenstein, O. Potential benefits of drought and heat tolerance for adapting maize to climate change in tropical environments. Clim. Risk Manag. 2018, 19, 106–119. [Google Scholar] [CrossRef]
  12. Liu, L.; Xia, Y.; Liu, B.; Chang, C.; Xiao, L.; Shen, J.; Tang, L.; Cao, W.; Zhu, Y. Individual and combined effects of jointing and booting low-temperature stress on wheat yield. Eur. J. Agron. 2020, 113, 125989. [Google Scholar] [CrossRef]
  13. National Bureau of Statistics of the People’s Republic of China. China Statistical Yearbook; China Statistics Press: Beijing, China, 2022.
  14. Sun, H.; Zhang, X.; Liu, X.; Liu, X.; Shao, L.; Chen, S.; Wang, J.; Dong, X. Impact of different cropping systems and irrigation schedules on evapotranspiration, grain yield and groundwater level in the North China Plain. Agric. Water Manag. 2019, 211, 202–209. [Google Scholar] [CrossRef]
  15. Ti, J.; Yang, Y.; Yin, X.; Liang, J.; Pu, L.; Jiang, Y.; Wen, X. Spatio-temporal analysis of meteorological elements in the North China District of China during 1960–2015. Water 2018, 10, 789. [Google Scholar] [CrossRef]
  16. Li, X.; Cai, J.; Liu, F.; Zhou, Q.; Dai, T.; Cao, W.; Jiang, D. Wheat plants exposed to winter warming are more susceptible to low temperature stress in the spring. Plant Growth Regul. 2015, 77, 11–19. [Google Scholar] [CrossRef]
  17. Xiao, L.; Liu, L.; Asseng, S.; Xia, Y.; Tang, L.; Liu, B.; Cao, W.; Zhu, Y. Estimating spring frost and its impact on yield across winter wheat in China. Agric. For. Meteorol. 2018, 260–261, 154–164. [Google Scholar] [CrossRef]
  18. Wang, S.; Chen, J.; Rao, Y.; Liu, L.; Wang, W.; Dong, Q. Response of winter wheat to spring frost from a remote sensing perspective: Damage estimation and influential factors. ISPRS J. Photogramm. 2020, 168, 221–235. [Google Scholar] [CrossRef]
  19. Li, S.; Zhang, L.; Huang, B.; He, L.; Zhao, J.; Guo, A. A comprehensive index for assessing regional dry-hot wind events in Huang-Huai-Hai Region, China. Phys. Chem. Earth, Parts A/B/C 2020, 116, 102860. [Google Scholar] [CrossRef]
  20. Zhang, L.; Chu, Q.-Q.; Jiang, Y.-L.; Chen, F.; Lei, Y.-D. Impacts of climate change on drought risk of winter wheat in the North China Plain. J. Integr. Agric. 2021, 20, 2601–2612. [Google Scholar] [CrossRef]
  21. Chen, Y.; Zhang, Z.; Tao, F.; Palosuo, T.; Rötter, R.P. Impacts of heat stress on leaf area index and growth duration of winter wheat in the North China Plain. Field Crops Res. 2018, 222, 230–237. [Google Scholar] [CrossRef]
  22. Sun, H.; Shen, Y.; Yu, Q.; Flerchinger, G.N.; Zhang, Y.; Liu, C.; Zhang, X. Effect of precipitation change on water balance and WUE of the winter wheat–summer maize rotation in the North China Plain. Agric. Water Manag. 2010, 97, 1139–1145. [Google Scholar] [CrossRef]
  23. Tang, X.; Liu, H.; Yang, L.; Li, L.; Chang, J. Energy balance, microclimate, and crop evapotranspiration of winter wheat (Triticum aestivum L.) under sprinkler irrigation. Agriculture 2022, 12, 953. [Google Scholar] [CrossRef]
  24. Zhao, J.; Han, T.; Wang, C.; Jia, H.; Worqlul, A.W.; Norelli, N.; Zeng, Z.; Chu, Q. Optimizing irrigation strategies to synchronously improve the yield and water productivity of winter wheat under interannual precipitation variability in the North China Plain. Agric. Water Manag. 2020, 240, 106298. [Google Scholar] [CrossRef]
  25. Feng, W.; Shum, C.K.; Zhong, M.; Pan, Y. Groundwater storage changes in China from satellite gravity: An overview. Remote Sens. 2018, 10, 674. [Google Scholar] [CrossRef]
  26. Umair, M.; Hussain, T.; Jiang, H.; Ahmad, A.; Shen, Y. Water-saving potential of subsurface drip irrigation for winter wheat. Sustainability 2019, 11, 2978. [Google Scholar] [CrossRef]
  27. Tang, X.; Liu, H.; Feng, D.; Zhang, W.; Chang, J.; Li, L.; Yang, L. Prediction of field winter wheat yield using fewer parameters at middle growth stage by linear regression and the BP neural network method. Eur. J. Agron. 2022, 141, 126621. [Google Scholar] [CrossRef]
  28. Liu, X.; Pan, Y.; Zhu, X.; Yang, T.; Bai, J.; Sun, Z. Drought evolution and its impact on the crop yield in the North China Plain. J. Hydrol. 2018, 564, 984–996. [Google Scholar] [CrossRef]
  29. Feng, B.; Li, S.; Li, H.; Wang, Z.; Zhang, B.; Wang, F.; Kong, L. Effect of high temperature stress at early grain-filling stage on plant morphology and grain yield of different heat-resistant varieties of wheat. Chin. J. Eco-Agric. 2019, 27, 451–461. [Google Scholar]
  30. DB 37/T 4366; The Classification Standard of Winter Wheat Seedling Condition in Shandong Province. Shandong Provincial Department of Agriculture: Jinan, China, 2021.
  31. Guan, X.K.; Song, L.; Wang, T.C.; Turner, N.C.; Li, F.M. Effect of drought on the gas exchange, chlorophyll fluorescence and yield of six different-era spring wheat cultivars. J. Agron. Crop Sci. 2015, 201, 253–266. [Google Scholar] [CrossRef]
  32. Liu, H.; Yu, L.; Luo, Y.; Wang, X.; Huang, G. Responses of winter wheat (Triticum aestivum L.) evapotranspiration and yield to sprinkler irrigation regimes. Agric. Water Manag. 2011, 98, 483–492. [Google Scholar] [CrossRef]
  33. Feng, X.; Liu, H.; Feng, D.; Tang, X.; Li, L.; Chang, J.; Tanny, J.; Liu, R. Quantifying winter wheat evapotranspiration and crop coefficients under sprinkler irrigation using eddy covariance technology in the North China Plain. Agric. Water Manag. 2023, 277, 108131. [Google Scholar] [CrossRef]
  34. Liu, H.; Chang, J.; Tang, X.; Zhang, J. In Situ Measurement of Stemflow, Throughfall and Canopy Interception of Sprinkler Irrigation Water in a Wheat Field. Agriculture 2022, 12, 1265. [Google Scholar] [CrossRef]
  35. Liu, H.; Kang, Y.; Yao, S.M.; Sun, Z.Q.; Liu, S.P.; Wang, Q.G. Field evaluation on water productivity of winter wheat under sprinkler or surface irrigation in the north China plain. Irrig. Drain. 2013, 62, 37–49. [Google Scholar] [CrossRef]
  36. Li, L.; Zhao, J.; Wang, C.; Yan, C. Comprehensive evaluation of robotic global performance based on modified principal component analysis. Int. J. Adv. Robot. Syst. 2020, 17, 1729881419896881. [Google Scholar] [CrossRef]
  37. Jafarzadegan, M.; Safi-Esfahani, F.; Beheshti, Z. Combining hierarchical clustering approaches using the PCA method. Expert Syst. Appl. 2019, 137, 1–10. [Google Scholar] [CrossRef]
  38. Pinheiro, C.; Chaves, M.M. Photosynthesis and drought: Can we make metabolic connections from available data? J. Exp. Bot. 2011, 62, 869–882. [Google Scholar] [CrossRef] [PubMed]
  39. Tankari, M.; Wang, C.; Ma, H.; Li, X.; Li, L.; Soothar, R.K.; Cui, N.; Zaman-Allah, M.; Hao, W.; Liu, F.; et al. Drought priming improved water status, photosynthesis and water productivity of cowpea during post-anthesis drought stress. Agric. Water Manag. 2021, 245, 106565. [Google Scholar] [CrossRef]
  40. Farooq, M.; Wahid, A.; Kobayashi, N.; Fujita, D.; Basra, S.M.A. Plant drought stress: Effects, mechanisms and management. Agron. Sustain. Dev. 2009, 29, 185–212. [Google Scholar] [CrossRef]
  41. Zhao, W.; Liu, L.; Shen, Q.; Yang, J.; Han, X.; Tian, F.; Wu, J. Effects of water stress on photosynthesis, yield, and water use efficiency in winter wheat. Water 2020, 12, 2127. [Google Scholar] [CrossRef]
  42. Sharma, K.D.; Kumar, A. Identification of physiological and yield related traits of wheat (Triticum aestivum L.) under varying soil moisture stress. J. Agrometeorol. 2014, 16, 78–84. [Google Scholar] [CrossRef]
  43. Hlaváčová, M.; Klem, K.; Rapantová, B.; Novotná, K.; Urban, O.; Hlavinka, P.; Smutná, P.; Horáková, V.; Škarpa, P.; Pohanková, E.; et al. Interactive effects of high temperature and drought stress during stem elongation, anthesis and early grain filling on the yield formation and photosynthesis of winter wheat. Field Crops Res. 2018, 221, 182–195. [Google Scholar] [CrossRef]
  44. Meena, R.P.; Karnam, V.; Sendhil, R.; Sharma, R.K.; Tripathi, S.C.; Singh, G.P. Identification of water use efficient wheat genotypes with high yield for regions of depleting water resources in India. Agric. Water Manag. 2019, 223, 105709. [Google Scholar] [CrossRef]
  45. Lu, Y.; Yan, Z.; Li, L.; Gao, C.; Shao, L. Selecting traits to improve the yield and water use efficiency of winter wheat under limited water supply. Agric. Water Manag. 2020, 242, 106410. [Google Scholar] [CrossRef]
  46. Beche, E.; Benin, G.; da Silva, C.L.; Munaro, L.B.; Marchese, J.A. Genetic gain in yield and changes associated with physiological traits in Brazilian wheat during the 20th century. Eur. J. Agron. 2014, 61, 49–59. [Google Scholar] [CrossRef]
  47. Liu, K.; Shi, Y.; Yu, Z.; Zhang, Z.; Zhang, Y. Improving photosynthesis and grain yield in wheat through ridge-furrow ratio optimization. Agronomy 2023, 13, 2413. [Google Scholar] [CrossRef]
  48. Noor, H.; Yan, Z.; Sun, P.; Zhang, L.; Ding, P.; Li, L.; Ren, A.; Sun, M.; Gao, Z. Effects of nitrogen on photosynthetic productivity and yield quality of wheat (Triticum aestivum L.). Agronomy 2023, 13, 1448. [Google Scholar] [CrossRef]
  49. Chang, S.; Chang, T.; Song, Q.; Zhu, X.-G.; Deng, Q. Photosynthetic and agronomic traits of an elite hybrid rice Y-Liang-You 900 with a record-high yield. Field Crops Res. 2016, 187, 49–57. [Google Scholar] [CrossRef]
  50. Hebei Provincial Department of Agriculture. Recommended Water-Saving Wheat Varieties and Related Supporting Technology; Hebei Provincial Department of Agriculture: Shijiazhuang, China, 2020. [Google Scholar]
  51. Fan, L.; Lu, C.; Yang, B.; Chen, Z. Long-term trends of precipitation in the North China Plain. J. Geogr. Sci. 2012, 22, 989–1001. [Google Scholar] [CrossRef]
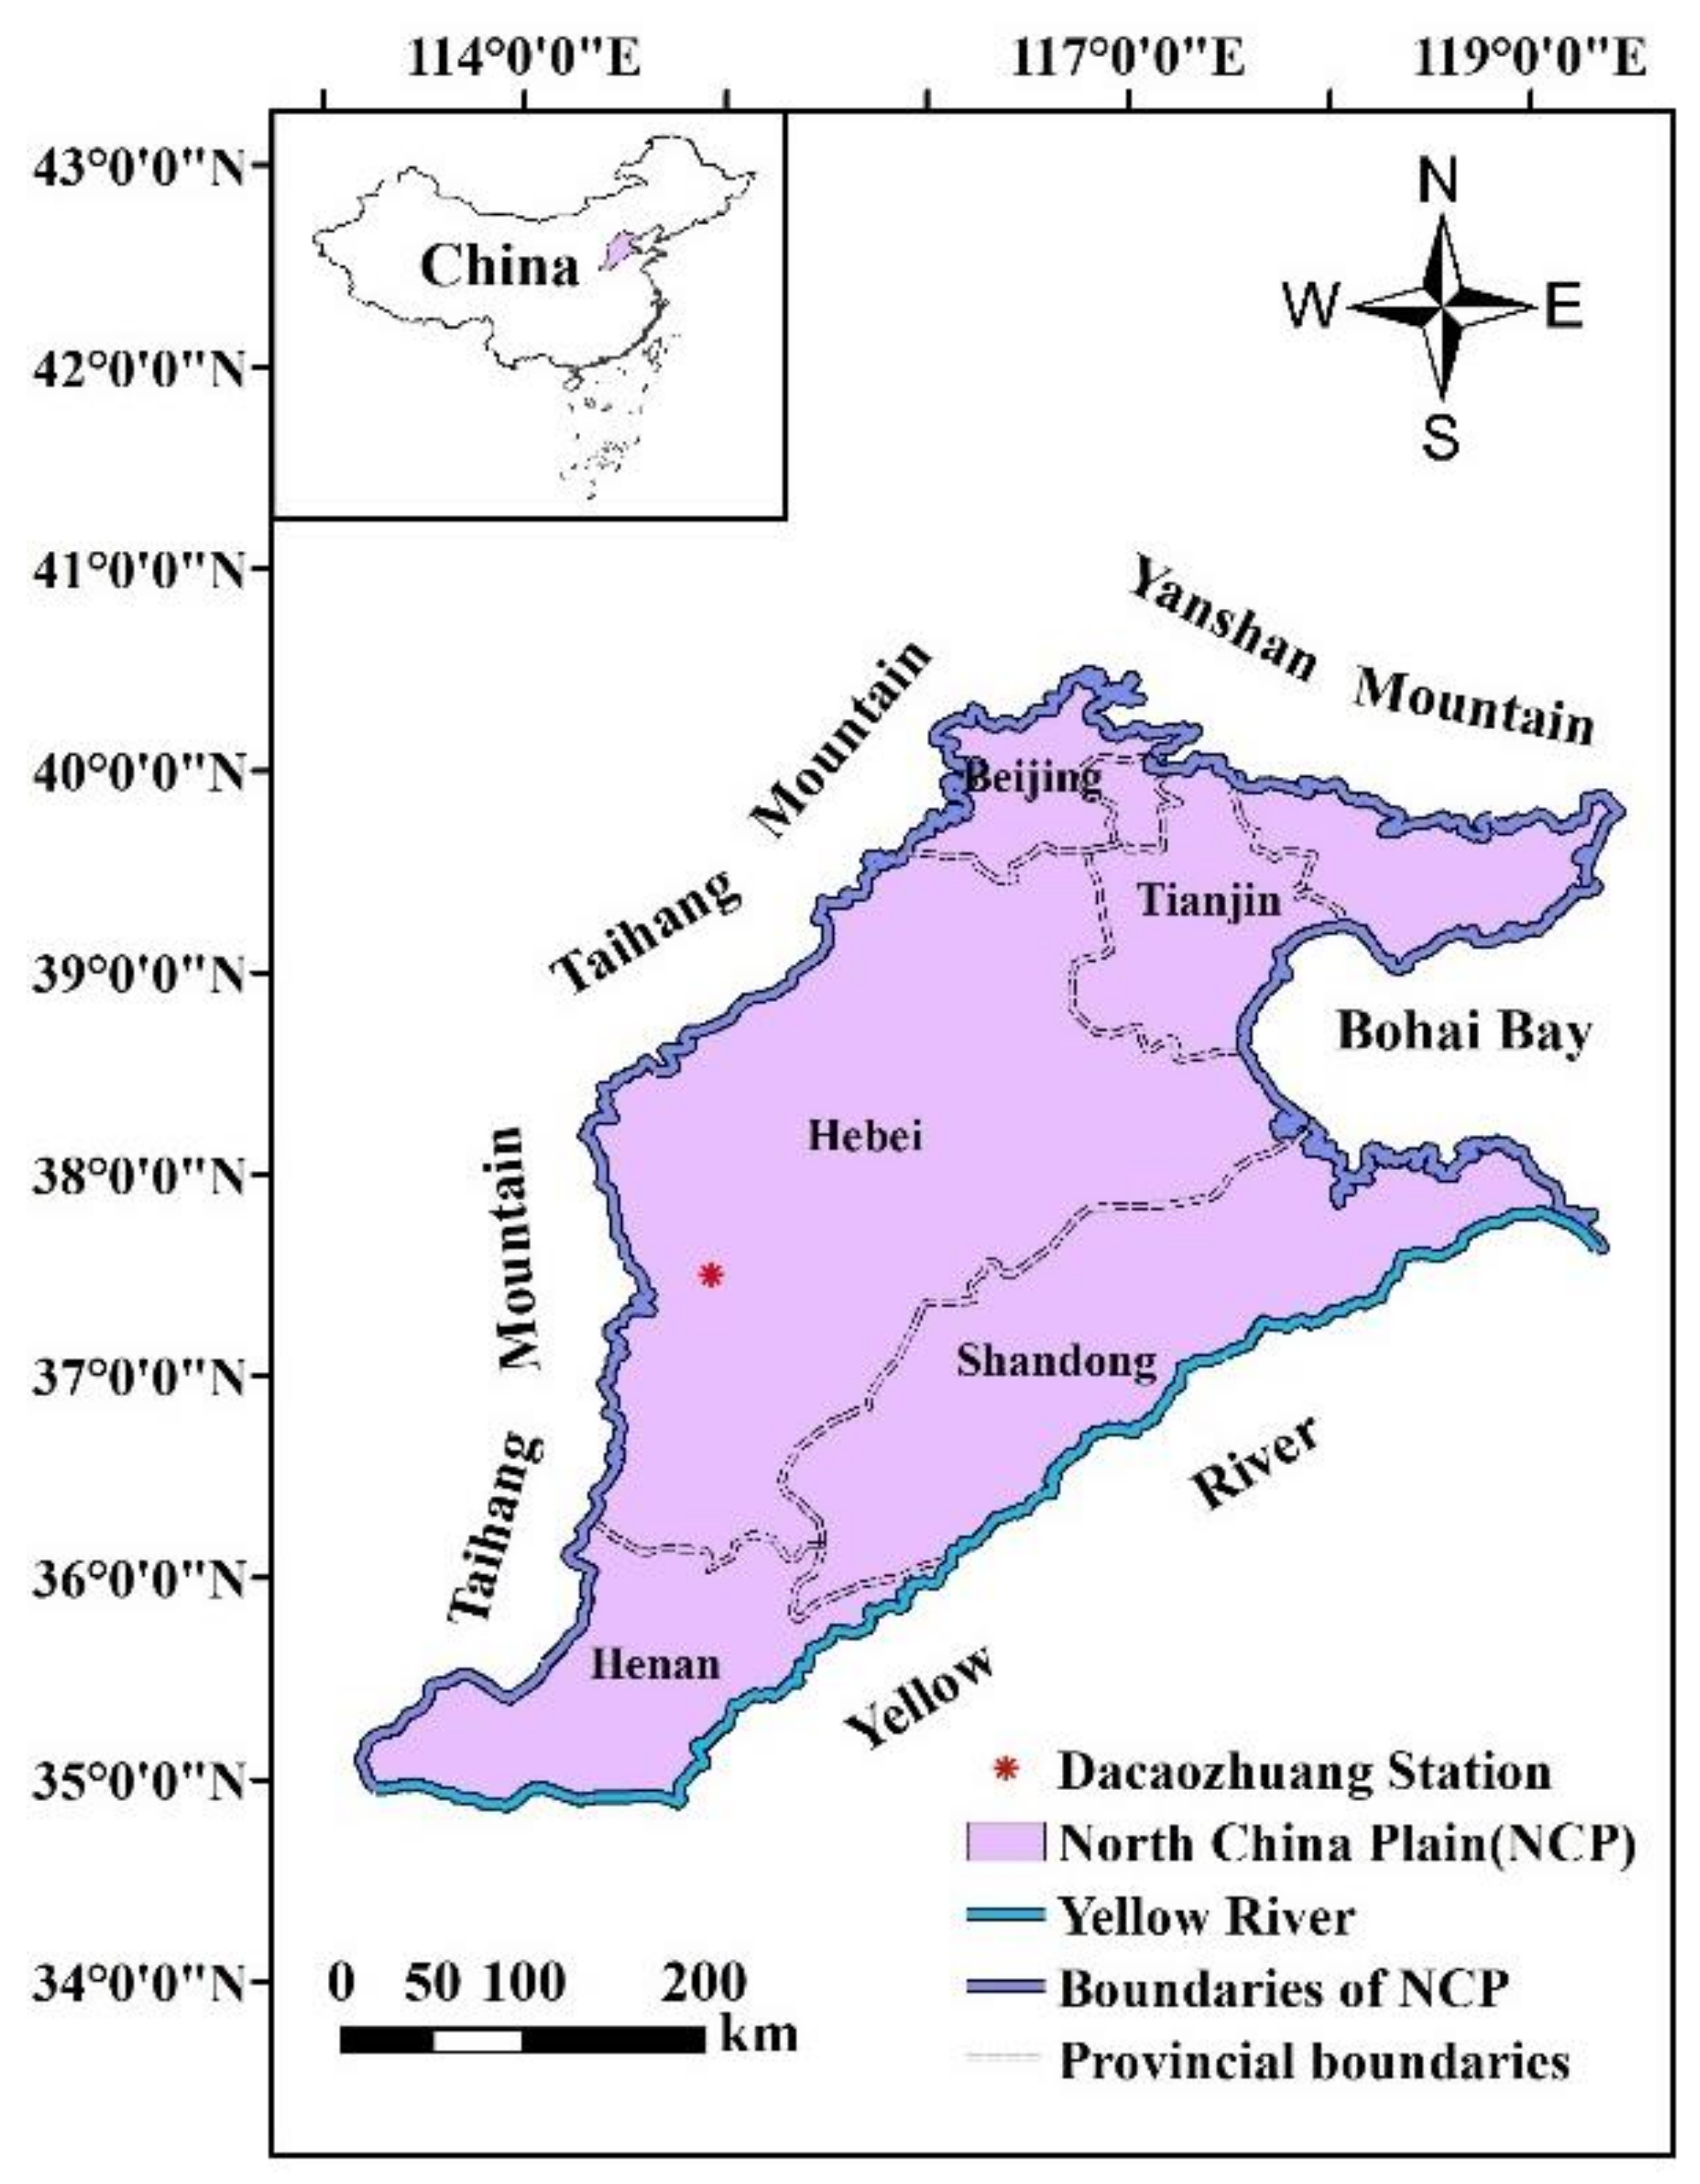
Figure 1. Location of the field experimental site (Dacaozhaung Station) in the North China Plain.
Agronomy 13 03041 g001
Figure 2. Daily mean temperature (Tmean), solar radiation (Rs), relative humidity (RH), and rainfall in the 2018–2019, 2019–2020 and 2020–2021 wheat seasons and the corresponding average data over 1981–2018. Subfigures (AD) represent the Tmean, Rs, RH, and rainfall, respectively.
Agronomy 13 03041 g002
Figure 3. Variation in soil water content (SWC) in the 0–180 cm soil layer in the wheat seasons of 2018–2019 (A), 2019–2020 (B), and 2020–2021 (C). FWC represents the mean field water capacity.
Agronomy 13 03041 g003
Figure 4. Gas exchange parameters of flag leaves for the 12 wheat varieties in the heading and middle and late grain-filling stages in the 2018–2021 wheat seasons. Subfigures (AD) represent the net photosynthesis rate (Pn), transpiration rate (Tr), stomatal conductivity (Gs) and water productivity at the leaf level (LWUE), respectively, in the three seasons. Different letters indicate significant differences at the 0.05 level between wheat varieties at the same growth stage.
Agronomy 13 03041 g004
Figure 5. Fluorescence parameters of flag leaves for 12 wheat varieties in the heading and middle and late milking stages in the 2018–2021 wheat seasons. Subfigures (AD) represent the maximum quantum yield of PSII (Fv/Fm), the effective quantum yield of PSII (ΦPSII), photochemical quenching (qP), and nonphotochemical quenching (NPQ), respectively, in the three seasons. Different letters indicate significant differences at the 0.05 level between wheat varieties at the same growth stage.
Agronomy 13 03041 g005
Figure 6. The wheat grain yields (A) and the four yield factors of the 12 wheat varieties in the 2018–2019, 2019–2020, and 2020–2021 wheat seasons. Subfigures (BE) represent the variations in 1000-grain weight, grain number per spike, spike number in a square meter and spike weight, respectively.
Agronomy 13 03041 g006
Figure 7. Actual crop evapotranspiration ETa (A) and water productivity WP (B) of the 12 wheat varieties in the 2018–2019, 2019–2020 and 2020–2021 wheat seasons.
Agronomy 13 03041 g007
Figure 8. Relationship between grain yield factors and growth indices of the 12 wheat varieties in 2018−2021 at the significance level of 0.01. Note: ** indicates a significance level of 0.01.
Agronomy 13 03041 g008
Figure 9. Relationship between yield and physiological parameters at different growth stages for the 12 wheat varieties in the 2018−2021 seasons at the significance level of 0.01. Note: ** indicates a significance level of 0.01. The numbers 1, 2, and 3 before the photosynthetic parameters represent the parameters measured in the heading and the middle and later grain-filling stages, respectively.
Agronomy 13 03041 g009
Figure 10. Principal component analysis and hierarchical cluster diagram of grain yield and water productivity of the 12 wheat varieties in the 2018−2021 wheat seasons. Y1, Y2, and Y3 represent the yields in the seasons of 2018−2019, 2019−2020, and 2020−2021, respectively; WP1, WP2, and WP3 represent the water productivity in the seasons of 2018−2019, 2019−2020, and 2020−2021, respectively.
Agronomy 13 03041 g010
Table 1. Basic information on the 12 wheat varieties selected in this study. High and medium tillering ability indicates that the number of tillers per wheat plant before overwintering is more than 3 and between 2 and 3, respectively; more panicles per unit area indicates that there are more than 67.5 million panicles ha−1 at harvest [30].
VarietyBreeding YearVarietal CharacteristicGrowth
Characteristics
Suitable Planting Area in the North China Plain
Lunxuan1032010Winterness
Medium maturity
High tillering ability
More panicles per unit area
Moderate and high water and fertile plots in central and southern, central and northern Hebei Province
Shinong0862009Semiwinterness
Medium maturity
Medium tillering ability
More panicles per unit area
Moderate and high water and fertile plots in central and southern, central and northern Hebei Province
Nongda3992007Semiwinterness
Medium maturity
High tillering ability
More panicles per unit area
Moderate and high water and fertile plots in central and southern Hebei Province
Shimai No. 222006Semiwinterness
Early maturity
Medium tillering ability
More panicles per unit area
Moderate and high water and fertile plots in Henan Province (except for wheat following rice)
Yingbo7002006Semiwinterness
Medium maturity
High tillering ability
More panicles per unit area
Moderate and high water and fertile plots in central and southern, central and northern Hebei Province
Han61721995Semiwinterness
Medium maturity
High tillering ability
More panicles per unit area
Moderate and high water and fertile plots in central and northern Hebei Province
Hannong14122011Semiwinterness
Medium maturity
High tillering ability
More panicles per unit area
Moderate and high water and fertile plots in central and southern, central and northern Hebei Province
Shimai262010Semiwinterness
Medium maturity
High tillering ability
More panicles per unit area
The southern part of Baoding and Cangzhou in Hebei Province and its southern part
Gaoyou20182005Semiwinterness
Medium maturity
High tillering ability
More panicles per unit area
Moderate and high water and fertile plots in Henan Province (except for wheat following rice)
Yingboaifeng82015Semiwinterness
Medium maturity
High tillering ability
More panicles per unit area
Moderate and high water and fertile plots in central and southern Hebei Province
Shixin8282002Semiwinterness
Medium maturity
Medium tillering ability
More panicles per unit area
Moderate and high water and fertile plots in central and southern Hebei Province
Zhongxinmai992011Semiwinterness Medium maturityHigh tillering ability
More panicles per unit area
The southern part of Baoding and Cangzhou in Hebei Province and its southern part
Moderate and high water and fertile plots in central and southern Hebei Province
Winter wheat area of Shandong Province
Table 2. Maximum plant height (PHm), maximum plant density (PDm), maximum leaf area index (LAIm), and aboveground dry matter accumulation at harvest (DMm) for 12 wheat varieties in the wheat seasons of 2018–2019, 2019–2020, and 2020–2021.
VarietyPHm (cm)PDm (Plants m−2)LAIm (m2 m−2)DMm (t ha−1)
2018–20192019–20202020–20212018–20192019–20202020–20212018–20192019–20202020–20212018–20192019–20202020–2021
Yingbo70074.9 c *73.5 cd75.5 d1362 abc2200 abc1547 ab6.4 ab7.2 ab6.5 ab17.1 abc22.0 ef17.7 e
Lunxuan10375.3 c75.6 bc75.7 d1298 bc1924 e1267 bc6.2 abc7.7 ab6.0 abc16.7 bcd22.6 de20.2 a
Nongda39979.4 b75.8 b76.4 cd1344 abc2053 cde1456 abc5.9 bcd7.9 ab6.9 a17.8 ab22.9 d18.8 bc
Shimai2674.9 c77.1 b81.6 bc1547 ab2000 de1604 a5.8 bcd8.0 ab7.2 a18.2 a24.7 b19.0 b
Shimai No. 2283.5 a82.7 a86.3 a1356 abc2049 cde1370 abc6.9 a7.7 ab5.4 bc18.4 a22.2 def19.0 b
Gaoyou201875.7 c71.8 d74.9 d1407 abc2344 a1316 abc6.6 a7.2 b5.0 c15.4 de22.2 def18.6 bcd
Han617278.6 b77.5 b76.5 cd1351 abc2140 bcd1489 abc6.7 a8.1 a6.8 a16.7 bcd24.6 b19.4 b
Hannong141278.5 b76.9 b80.9 b1322 abc2044 cde1622 a5.7 cd7.5 ab7.1 a16.6 bcde25.7 a17.1 ef
Shinong08679.0 b76.0 b80.1 bc1571 a2167 bcd1631 a5.4 d7.4 ab5.9 abc17.7 ab23.7 c18.0 cde
Shixin82871.9 d75.2 bc74.5 de1247 c1747 f1183 c5.8 bcd7.3 ab6.9 a15.8 cde21.7 f20.3 a
Zhongxinmai9975.5 c75.3 bc75.5 d1351 abc2020 cde1333 abc5.9 bcd7.3 ab4.9 c15.2 e24.1 bc17.8 de
Yingboaifeng867.7 e67.7 e71.1 e1411 abc2289 ab1576 ab5.6 cd7.1 b6.3 ab15.6 de23.6 c16.8 f
Mean value76.475.477.31381208114496.17.56.316.823.318.6
CV (%)5.34.75.16.87.810.584.512.96.75.46
Note: * Different lowercase letters indicate significant differences at the 0.05 level.
Table 3. Effect of wheat varieties, cropping years, and their interaction on wheat yield and yield components.
IndexGrain Yield1000-grain WeightGrain Number Per SpikeSpike Number Per Square MeterSpike Weight
Variety8.19 **62.54 **5.23 **10.94 **16.41 **
Year178.67 **895.23 **148.91 **263.75 **379.90 **
Variety×Year2.43 **13.28 **10.10 **4.17 **3.77 **
Note: data in the table are the F value, and ** indicates a significance level of 0.01.
Table 4. Correlation coefficients between grain yield factors and growth indices of the 12 wheat varieties in 2018–2021. Note: * and ** indicate the significance level of 0.05 and 0.01, respectively.
Correlation CoefficientsPHmPDmPDhLAImDMmETaHIWP
Grain yield0.060.51 **0.100.54 **0.65 **0.58 **0.46 **0.96 **
1000-grain weight−0.040.55 **0.130.38 *0.57 **0.45 **0.36 *0.80 **
Grain number per spike0.17−0.27−0.41 *−0.020.030.300.40 *0.35 *
Spike number per m2−0.250.87 **0.86 **0.61 **0.71 **0.41 *−0.43 **0.22
Spike weight0.20−0.10−0.49 **0.090.170.320.70 **0.76 **
Table 5. Correlation coefficients between grain yield factors and gas exchange parameters of flag leaves at different growth stages for the 12 wheat varieties in 2018–2021. Note: * and ** indicate the significance level of 0.05 and 0.01, respectively.
Correlation CoefficientsHeading StageMiddle Milking StageLate Milking Stage
PnTrGsLWUEPnTrGsLWUEPnTrGsLWUE
Grain yield0.01−0.14−0.320.140.63 **0.69 **0.60 **−0.82 **0.60 **0.50 **0.45 **0.60 **
1000-grain weight−0.08−0.23−0.400.190.54 **0.62 **0.54 **−0.73 **0.61 **0.51 **0.49 **0.66 **
Grain number per spike0.200.280.12−0.23−0.020.02−0.05−0.15−0.020.06−0.02−0.05
Spike number per m2−0.41 *−0.53 **−0.51 **0.52 **0.56 **0.64 **0.64 **−0.56 **0.72 **0.65 **0.68 **0.45 **
Spike weight0.240.20−0.02−0.200.190.220.12−0.43 **0.110.090.010.28
Table 6. Correlation coefficients between grain yield factors and chlorophyll fluorescence parameters of flag leaves at different growth stages for the 12 wheat varieties in 2018–2021. Note: * and ** indicate the significance level of 0.05 and 0.01, respectively.
Correlation CoefficientHeading StageMiddle Milking StageLate Milking Stage
Fv/FmΦPSIIqPNPQFv/FmΦPSIIqPNPQFv/FmΦPSIIqPNPQ
Grain yield0.310.250.79 **−0.82 **0.44 **0.56 **0.76 **−0.82 **0.66 **0.78 **0.76 **−0.80 **
1000-grain weight0.34 *0.110.74 **−0.82 **0.36 *0.51 **0.78 **−0.83 **0.59 **0.7 **0.77 **−0.80 **
Grain number per spike0.050.310.16−0.37 *0.55 **0.220.41 *−0.35 *0.39 *0.170.44 **−0.33
Spike number per m20.14−0.310.58 **−0.33 *−0.280.40 *0.20−0.33 *0.130.52 **0.08−0.33
Spike weight0.270.42 *0.41 *−0.64 **0.65 **0.34 *0.70 **−0.65 **0.60 **0.45 **0.78 **−0.64 **
Disclaimer/Publisher’s Note: The statements, opinions and data contained in all publications are solely those of the individual author(s) and contributor(s) and not of MDPI and/or the editor(s). MDPI and/or the editor(s) disclaim responsibility for any injury to people or property resulting from any ideas, methods, instructions or products referred to in the content.