Abstract
Soil structure and its change are good indicators for soil quality and environmental stability, and land-use change is known to be an important factor that affects soil structure. We investigated the seasonal and temporal variability in the soil structure and evaluated soil erodibility under different land-use and land-management practices in the Mollisols region of Northeast China. We considered five land-use and land-management modes in the sloping land (5°), i.e., bare land (BL), natural vegetation restoration (NVR), artificial forest (AF), no-tillage (NT), and conventional tillage (CT). The bulk density (BD), aggregate size distribution, and aggregate stability (AS) were determined for each mode. Meanwhile, we estimated the runoff depth (RD) and sediment yield (SY) to assess the soil erodibility. The lowest BD in CT occurred in May, but no seasonal change in BD was observed in other treatments. After 15 years, the NVR and CT had increased BD values, while the BD of NT declined significantly over time. The >2 mm size fractions and the AS of NVR, NT, and CT were the largest in August, while those of BL decreased during the growing season. Furthermore, the >2 mm size fractions and the AS of BL, NT, and CT decreased over the long-term study period, but NVR and AF exhibited no significant inter-annual changes in the AS. The BD and AS in NVR and AF were greater than those in BL. After 15 years, the BD of NT and CT were not significantly different, but NT had a greater AS. The AS was greater in the subsurface soil than in the topsoil of NT and CT. Moreover, the NVR and NT had significantly reduced RD and SY compared with BL and CT. These results provide a scientific basis for choosing sustainable agriculture and land development modes to control soil erosion in Northeast China.
1. Introduction
The soil structure can affect the soil porosity, water permeability, water-holding capacity, and soil erosion resistance, and it is an essential factor when evaluating soil quality, as it has been linked to the success of many ecosystem services worldwide [1,2]. Previous studies reported that different land-use and land-management practices can significantly affect the soil structure by providing different quantities and qualities of biomass input [3,4,5,6]. It is generally accepted that the conversion of agricultural land to grassland has a positive effect on soil structure. Conversely, the conversion of grass or forest land to arable cropland will result in a loss of soil nutrients and soil degradation, and can hence be expected to deteriorate the soil structure [7,8]. Meanwhile, different land-use and land-management practices can generate seasonal and inter-annual fluctuations in the bulk density and soil aggregate stability, which are commonly utilized indices of the soil structure status [9,10,11]. Furthermore, differences in land-use patterns can also make the soil more susceptible to degradation. Many studies found that forests and grasslands can reduce soil erosion and improve soil quality compared with agricultural land [8,12,13,14]. For arable land, conventional tillage (CT) was shown to negatively affect soil productively by destroying the original soil physio-chemical properties, resulting in severe soil degradation [15,16]. Compared with CT, no-tillage (NT) strategies have been recognized as effective agricultural measures for improving soil structure and reducing soil and nutrient loss, resulting in better soil quality [15,17].
The Mollisols region of Northeast China is one of the most important commercial grain production areas in China. Presently, ongoing soil degradation threatens sustainable crop production and even national food security in China [18,19]. In the efforts to control land degradation, some conservation measures have been gradually adopted [14,20]. Therefore, understanding the impact of land-use patterns on the soil structure and soil loss is central to determining which land-use and land-management practices can effectively curb the risk of soil erosion from the sloping lands in Northeast China. Long-term changes in different land-use patterns lead to a significant variation in soil structure. Meanwhile, soil structure stability is likely to change significantly during a growing season, and thus, induce the corresponding variation in soil erodibility. However, little or no empirical research was conducted to assess both the seasonal and inter-annual variability among different land-use strategies, which limits our ability to select the optimal and most rational land-use and land-management practices.
Given the abovementioned issues, we monitored the soil bulk density and soil aggregate distribution and stability in sloping lands during the crop-growing season. The monitored lands were selected to be representative of five different land-use and land-management practices, including bare land (BL), artificial forest (AF), natural vegetation restoration (NVR), NT, and CT. Meanwhile, this study also quantified the effects of land-use and land-management practices on runoff and soil erosion during the rainy season. The specific objectives were to (1) explore the seasonal and inter-annual fluctuations in the soil bulk density and aggregate stability, and (2) evaluate the differences in soil structure and soil erosion among different land-use and land-management practices. The results will serve as a valuable reference to help policymakers and land managers to select appropriate measures to maintain soil structural stability and control soil erosion in the Mollisols region of Northeast China.
2. Material and Methods
2.1. Study Area
This study was conducted during 2011–2020 at the Hailun Monitoring and Research Station of Soil and Water Conservation, Chinese Academy of Sciences (47°21′ N, 126°50′ E). The study area was in an area typical of the Mollisols region with rolling-hilly landforms and an average altitude of 239 m. The study area was located in the north temperature zone, which has cold and arid winters and hot and rainy summers. The climate of this region is characterized as continental monsoon and sub-humid, with an average annual precipitation of 530 mm, 65% of which occurs from June to August. The annual average temperature is 1.5 °C, the annual average available accumulated temperature (≥10 °C) is 2450 °C, and the annual sunshine is approximately 2600 to 2800 h. The frost-free period is approximately 120 days. The soils are classified as Mollisols according to the US Soil Taxonomy (USST) [21] and as black soil according to the Chinese Soil Taxonomy (CST) [22]. The soils have a silty clay loamy texture, high clay content, high SOM content, high water-holding capacity, high shrink-swell, and poor drainage [23,24]. Being an important grain-producing area, Northeast China plays an important role in ensuring food security for China. More than 70% of the land has been reclaimed as sloped agricultural land, and the soil erosion is severe within the Mollisols layer, which is approximately 30 cm deep [18,25,26].
2.2. Experimental Design
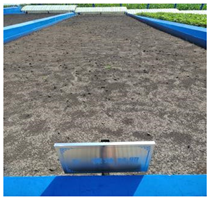
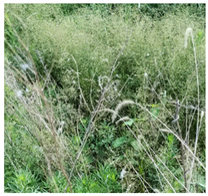
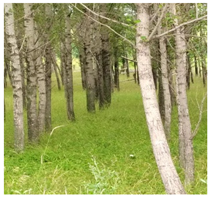
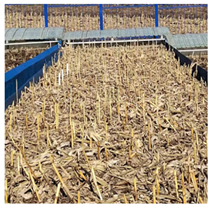
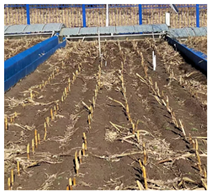
The experimental plots were assigned using a randomized complete block design with three replicates and the plots included five land-use and land-management practices: artificial forest (AF), natural vegetation cover (NVR), bare land (BL), and two tillage treatments: no tillage (NT) and conventional tillage (CT). Among these treatments, the NVR, BL, NT, and CT plots were in the Hailun Monitoring and Research Station of Soil and Water Conservation, CAS; these four experimental plots were built in 2006 and were 20 m long and 4.5 m wide. Since their establishment, the NT and CT plots have been planted with a soybean and maize rotation. The slope of these plots was 5% in the east–west direction. The soybean and maize rotation was applied in three tillage treatments and fertilizer was applied at 20.25 kg N·hm−2, 51.75 kg P·hm−2, and 15 kg K·hm−2 for soybean, and 138 kg N·hm−2, 51.75 kg P·hm−2, and 15 kg K·hm−2 for maize. Weeds were controlled using the herbicides Acetochlor (1500 mL hm−2) and Thifensulfuron-methyl (120 g hm−2) one day after planting. The AF plots were 100 m away from the monitoring station and had an afforested area of approximately 1.2 hm−2. The specific operational parameters of the five land-use and land-management practices are provided in Table 1.

Table 1.
Characteristics of the experimental plots using five land-use and land-management practices.
2.3. Experimental Processes
2.3.1. Soil Sampling and Measurement
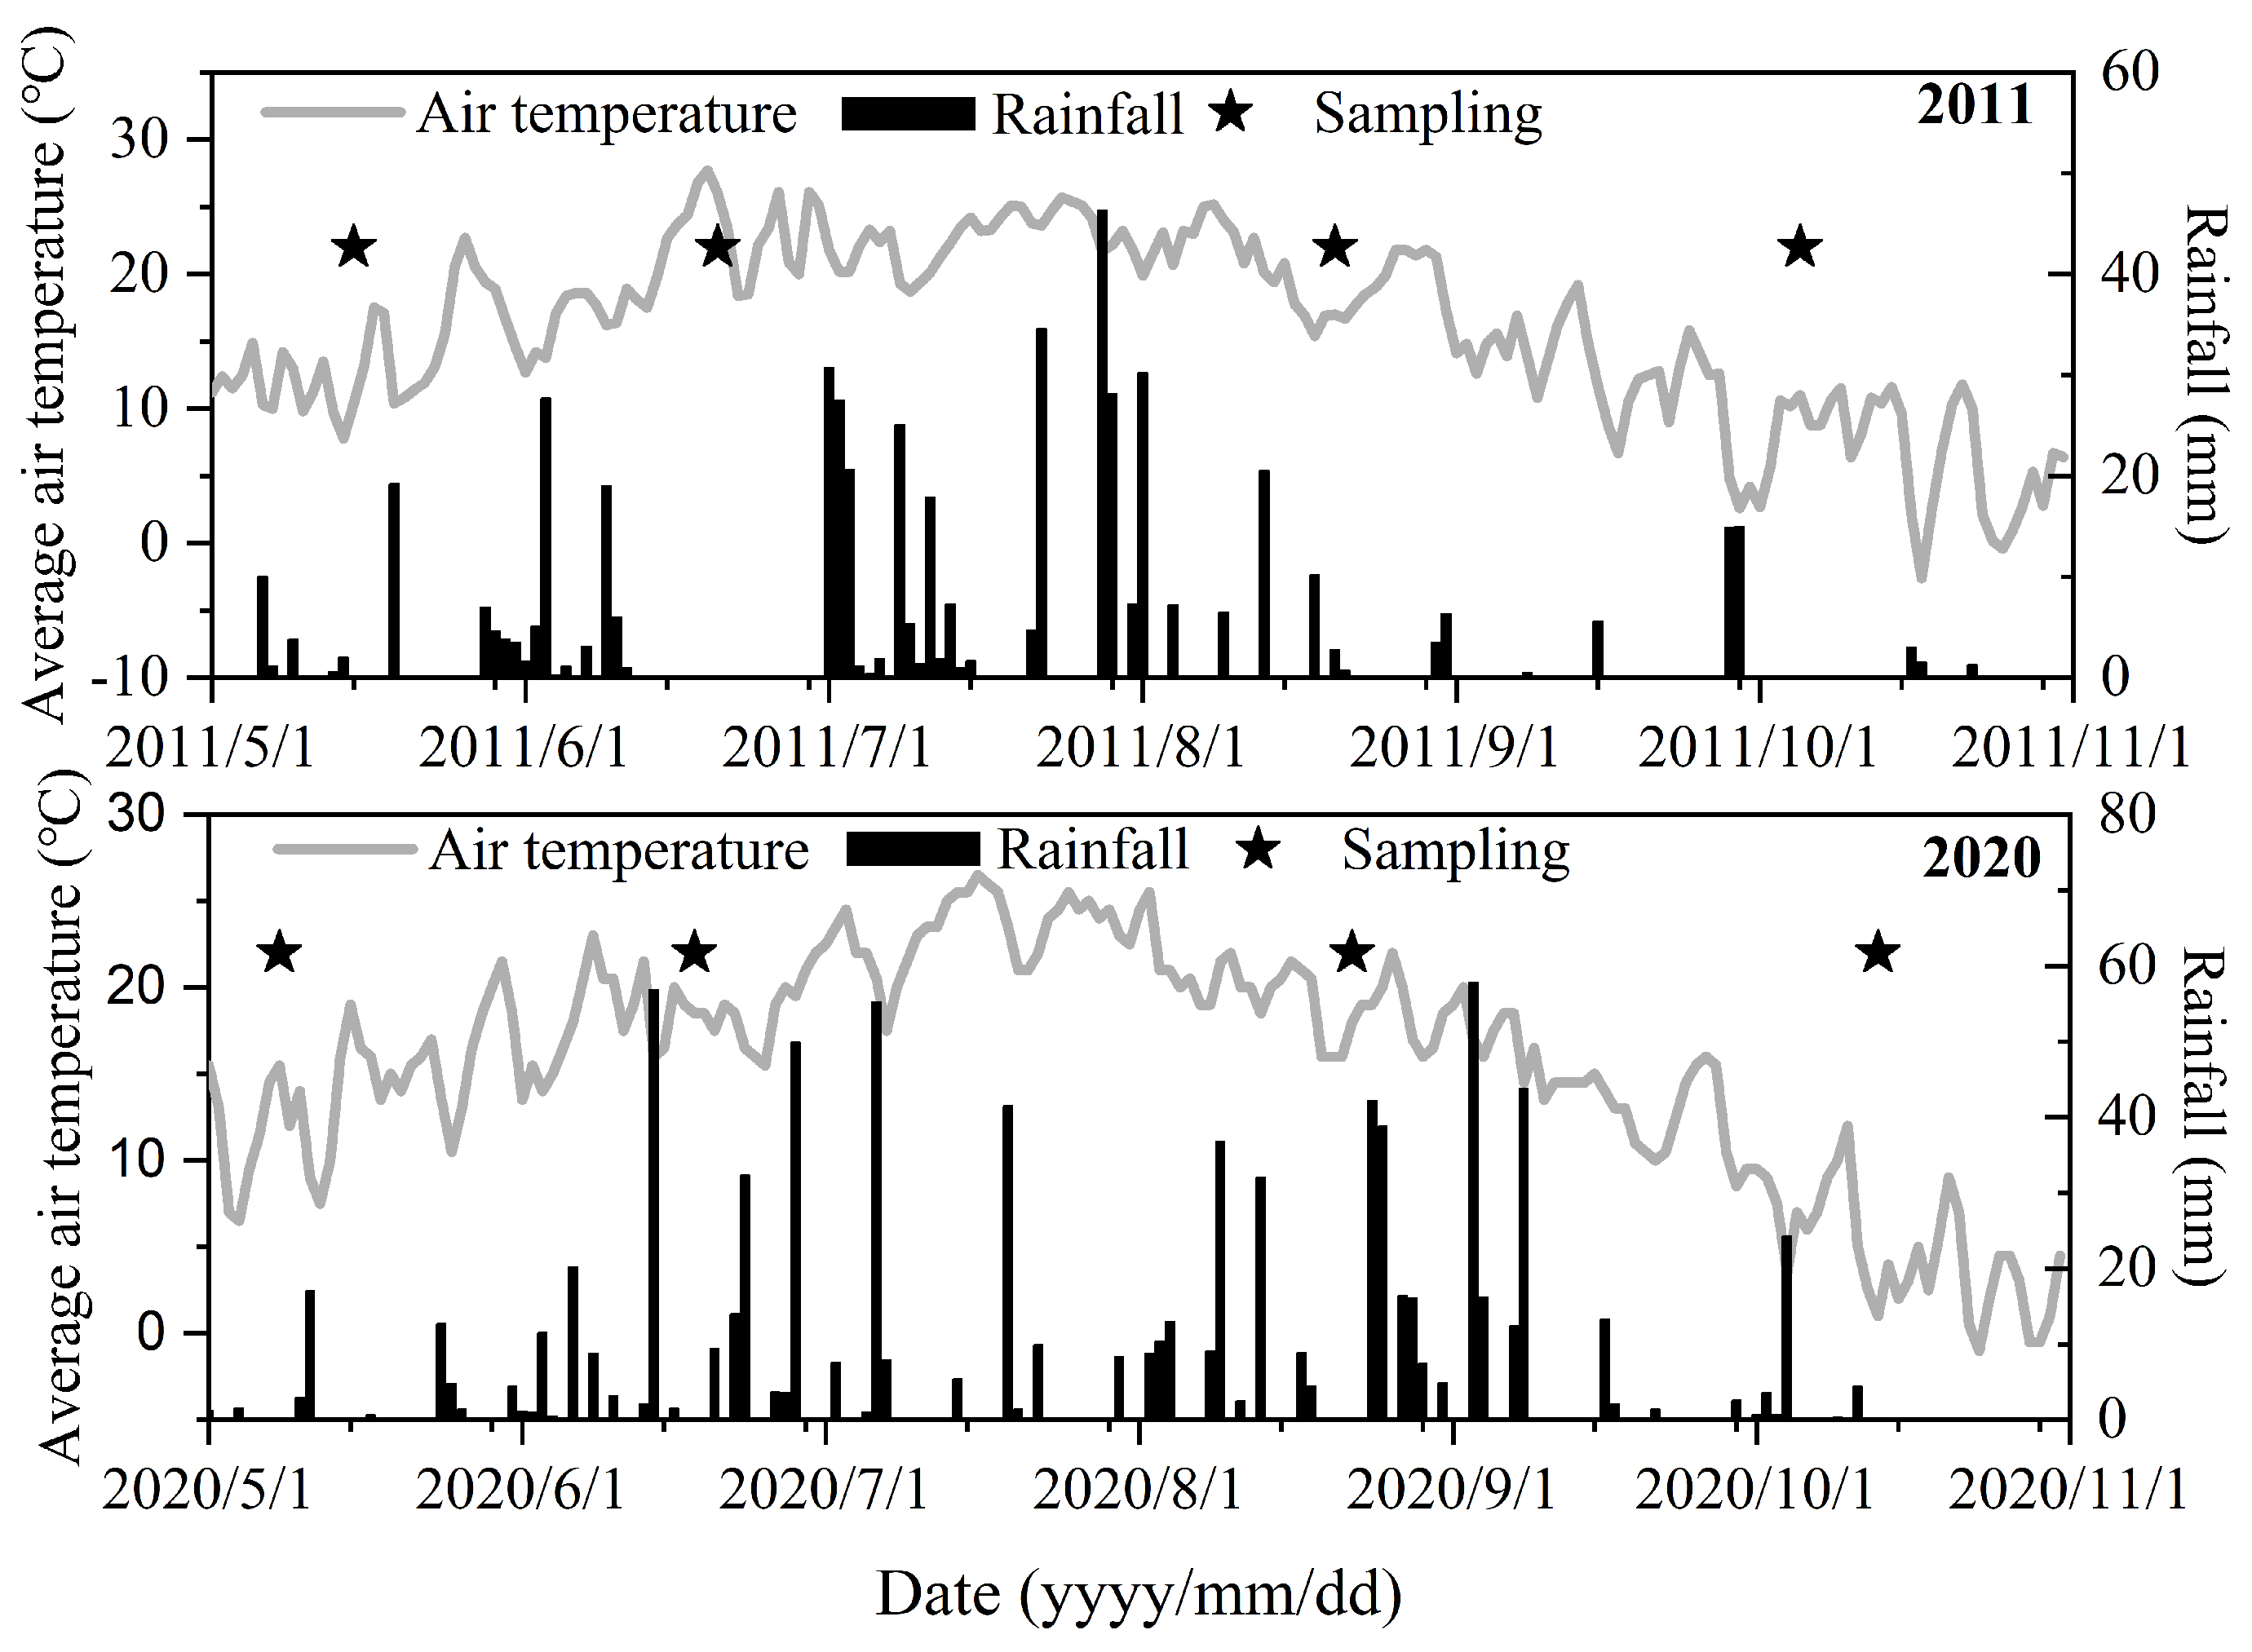
Soil samples were collected from the surface layer (0–10 cm and 10–20 cm soil depth) in May, June, August, and October in 2011 and 2020 (Figure 1). The average values of the bulk density (BD) and aggregate stability (AS) during the crop-growing period were used to analyze the interannual differences in soil structure under different land-use patterns. The BD for each plot was measured using a steel cylinder 5 cm in diameter and 5 cm high and repeated for the up-slope, mid-slope, and down-slope areas of each plot. Soil samples were dried at 105 °C for at least 48 h and weighed. The BD results from the 3–7 cm and 13–18 cm cylinders were used to represent the 10–20 cm and 20–30 cm layers, respectively.

Figure 1.
Rainfall, air temperature, and sampling time during the experimental period in 2011 and 2020.
For each treatment, undisturbed soil samples were collected from the up-slope, mid-slope, and down-slope areas and then mixed and placed in a polyethylene bag. The stones, roots, and residues were removed and the samples were air-dried before some were passed through a 10 cm sieve for the water stable aggregate distribution measurement, and some were passed through a 2.0 mm sieve for the soil particle size distribution measurement. The aggregate size distribution was measured using various aggregate sizes, which depended on the high-vacuum slow-wetting method that was applied [27]; here, three aggregate size classes (2 mm, 1 mm, and 0.25 mm) were used in order to test the influence of the initial aggregate size on the size distribution of breakdown fragments. The mean weight diameter (MWD) was calculated as an index of aggregate stability (Equation (1)) [28]:
where wi is the proportion of the weight made up by the aggregate size fraction and xi is the mean particle diameter (mm) of the ith size class. The mean particle diameter was taken as the arithmetic mean of the upper and lower sieve sizes.
2.3.2. Runoff and Soil Loss
For each rainfall and runoff generation event, the water and soil loss of all the experimental plots (except for AF) were measured using an inexpensive portable runoff and sediment monitoring device requiring no external electric power (XYZ-III) [29]. Due to great soil disturbance and the destruction of trees, the monitoring device was not installed in the AF plots. After each rainfall event, the collected runoff and sediment samples were weighed and then left to rest for 24 h, after which the settled water was separated from the original runoff and sediment samples.
2.4. Statistical Analysis
Graphical works were created in Origin 2022. The analysis of variance (ANOVA), which is appropriate for a randomized complete block design, was the procedure used to analyze the obtained data. Significant differences between treatments were calculated using Duncan’s test. Statistical analyses were performed using SPSS 22.0 for Windows (SPSS Inc., Chicago, IL, USA, 2007).
3. Results
3.1. Seasonal Variation in Soil Structure
3.1.1. Bulk Density
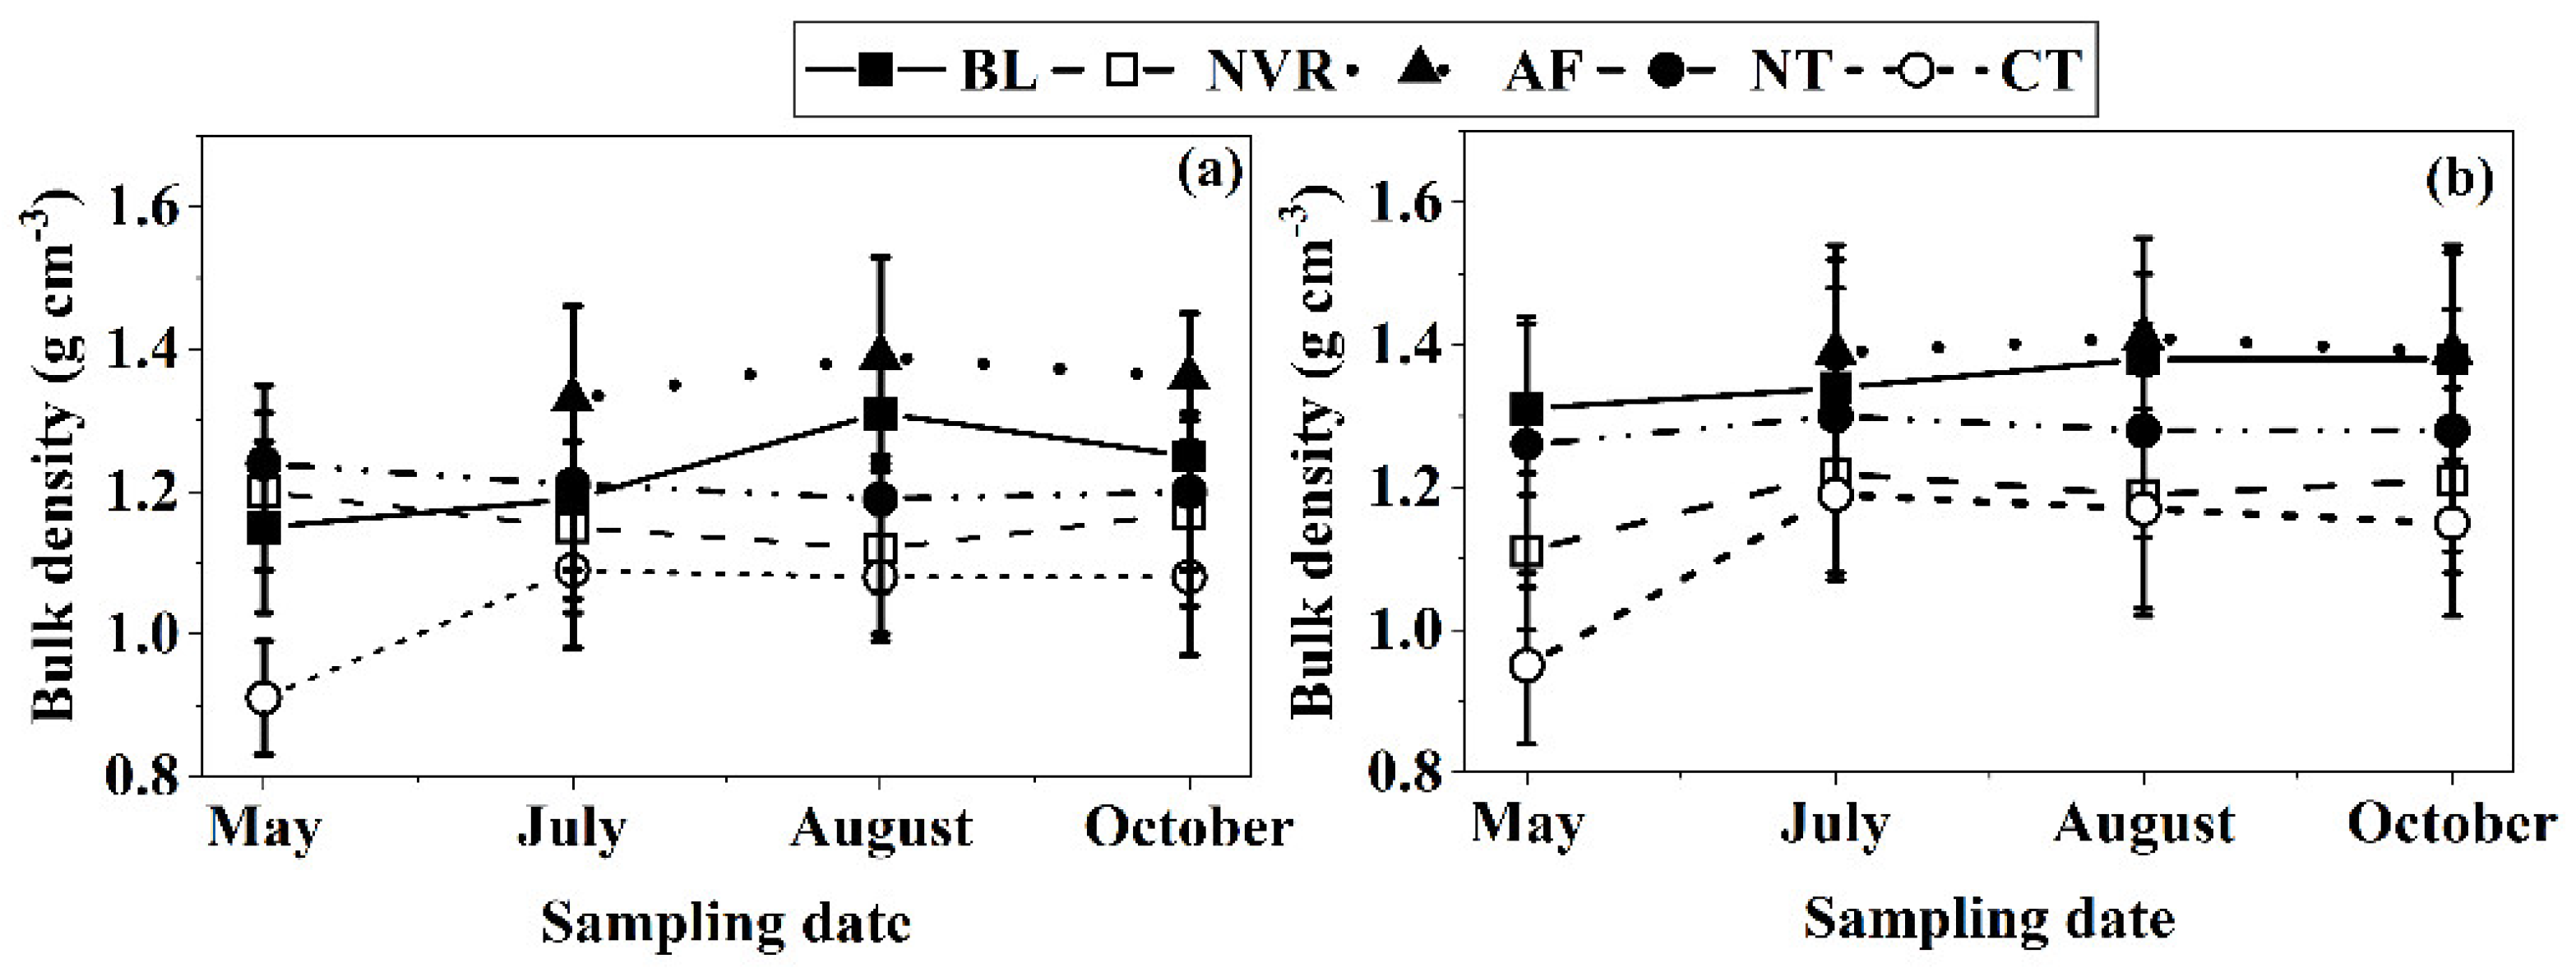
In this study, we mainly explored the seasonal variation of the BD, aggregate size distribution, and aggregate stability during the growing period. As shown in Figure 2, there were significant seasonal differences in the BD of the BL and CT land-use types, but not in the others in the 0–20 cm depth. The BD in the BL and CT land-use types increased with time and the lowest BD occurred in May. The BD ranged within 1.19–1.24 g cm−3 for NT, 1.12–1.20 g cm−3 for NVR, and 1.33–1.39 g cm−3 for AF.

Figure 2.
Seasonal differences in the bulk density of different land-use types ((a) 0−10 cm; (b) 10−20 cm). Notes: BL, bare land; NVR: natural vegetation restoration; AF, artificial forest; NT, no tillage; CT, conventional tillage.
3.1.2. Aggregate Size Distribution
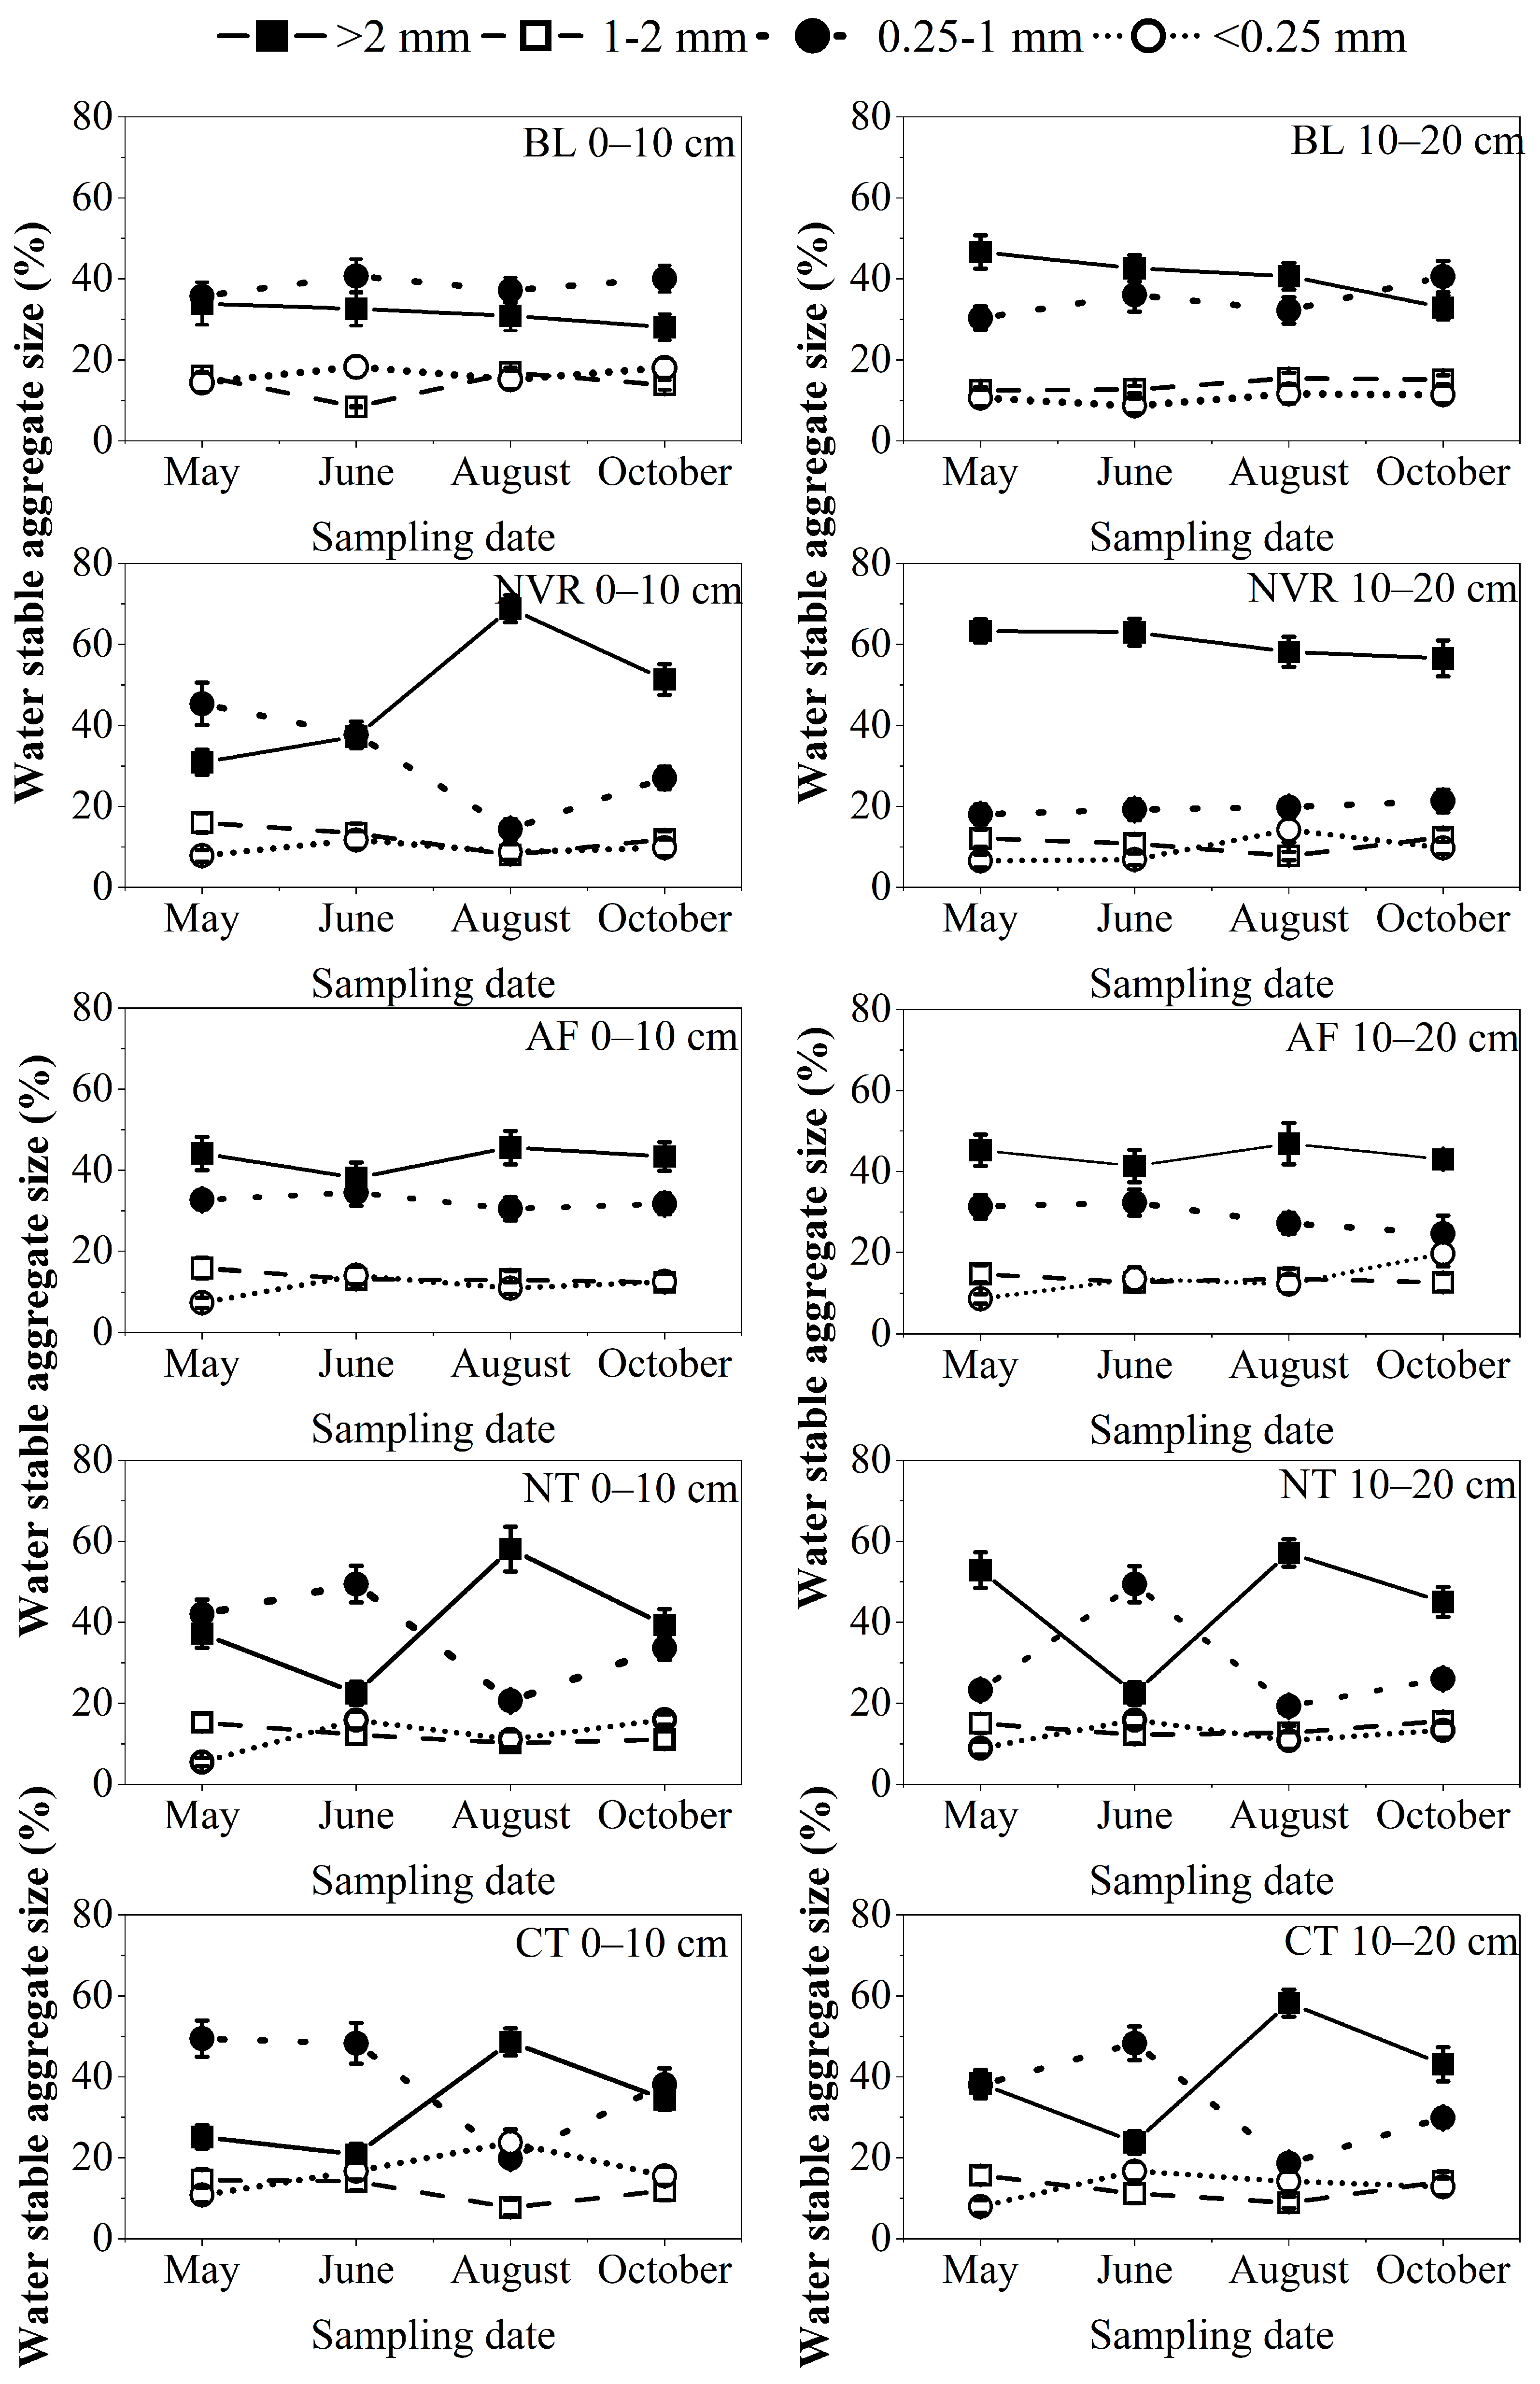
Seasonal differences in the four aggregate size fractions were observed in all land-use types (Figure 3). For BL, the >2 mm size fraction decreased with time, while the 0.25–1 mm size fraction increased with time. The >2 mm size fractions were significantly greater in May than in October in the 10–20 cm depth.

Figure 3.
Seasonal differences in the aggregate size distributions of different land–use types. Notes: BL, bare land; NVR: natural vegetation restoration; AF, artificial forest; NT, no tillage; CT, conventional tillage.
For NVR, the >2 mm size fraction increased and then decreased with the growing season in the 0–10 cm depth, and the greatest values occurred in August. However, the opposite trend was observed in the 0.25–1 mm size fraction. In the 10–20 cm soil depth, no significant differences were found in any treatment. Meanwhile, there were no significant seasonal differences in aggregate size fractions in AF.
Similar seasonal trends were found in the NT and CT land-use types. The >2 mm size fraction first decreased in the seeding stage and increased in the filling stage, then decreased in the maturation stage during the maize-growing season. The opposite trend was observed in the <0.25 mm size fraction in NT and CT. The >2 mm size fraction was the largest in August for NT and CT. There were no significant seasonal differences in the 1–2 mm and <0.25 mm size fractions in any treatment.
3.1.3. Aggregate Stability
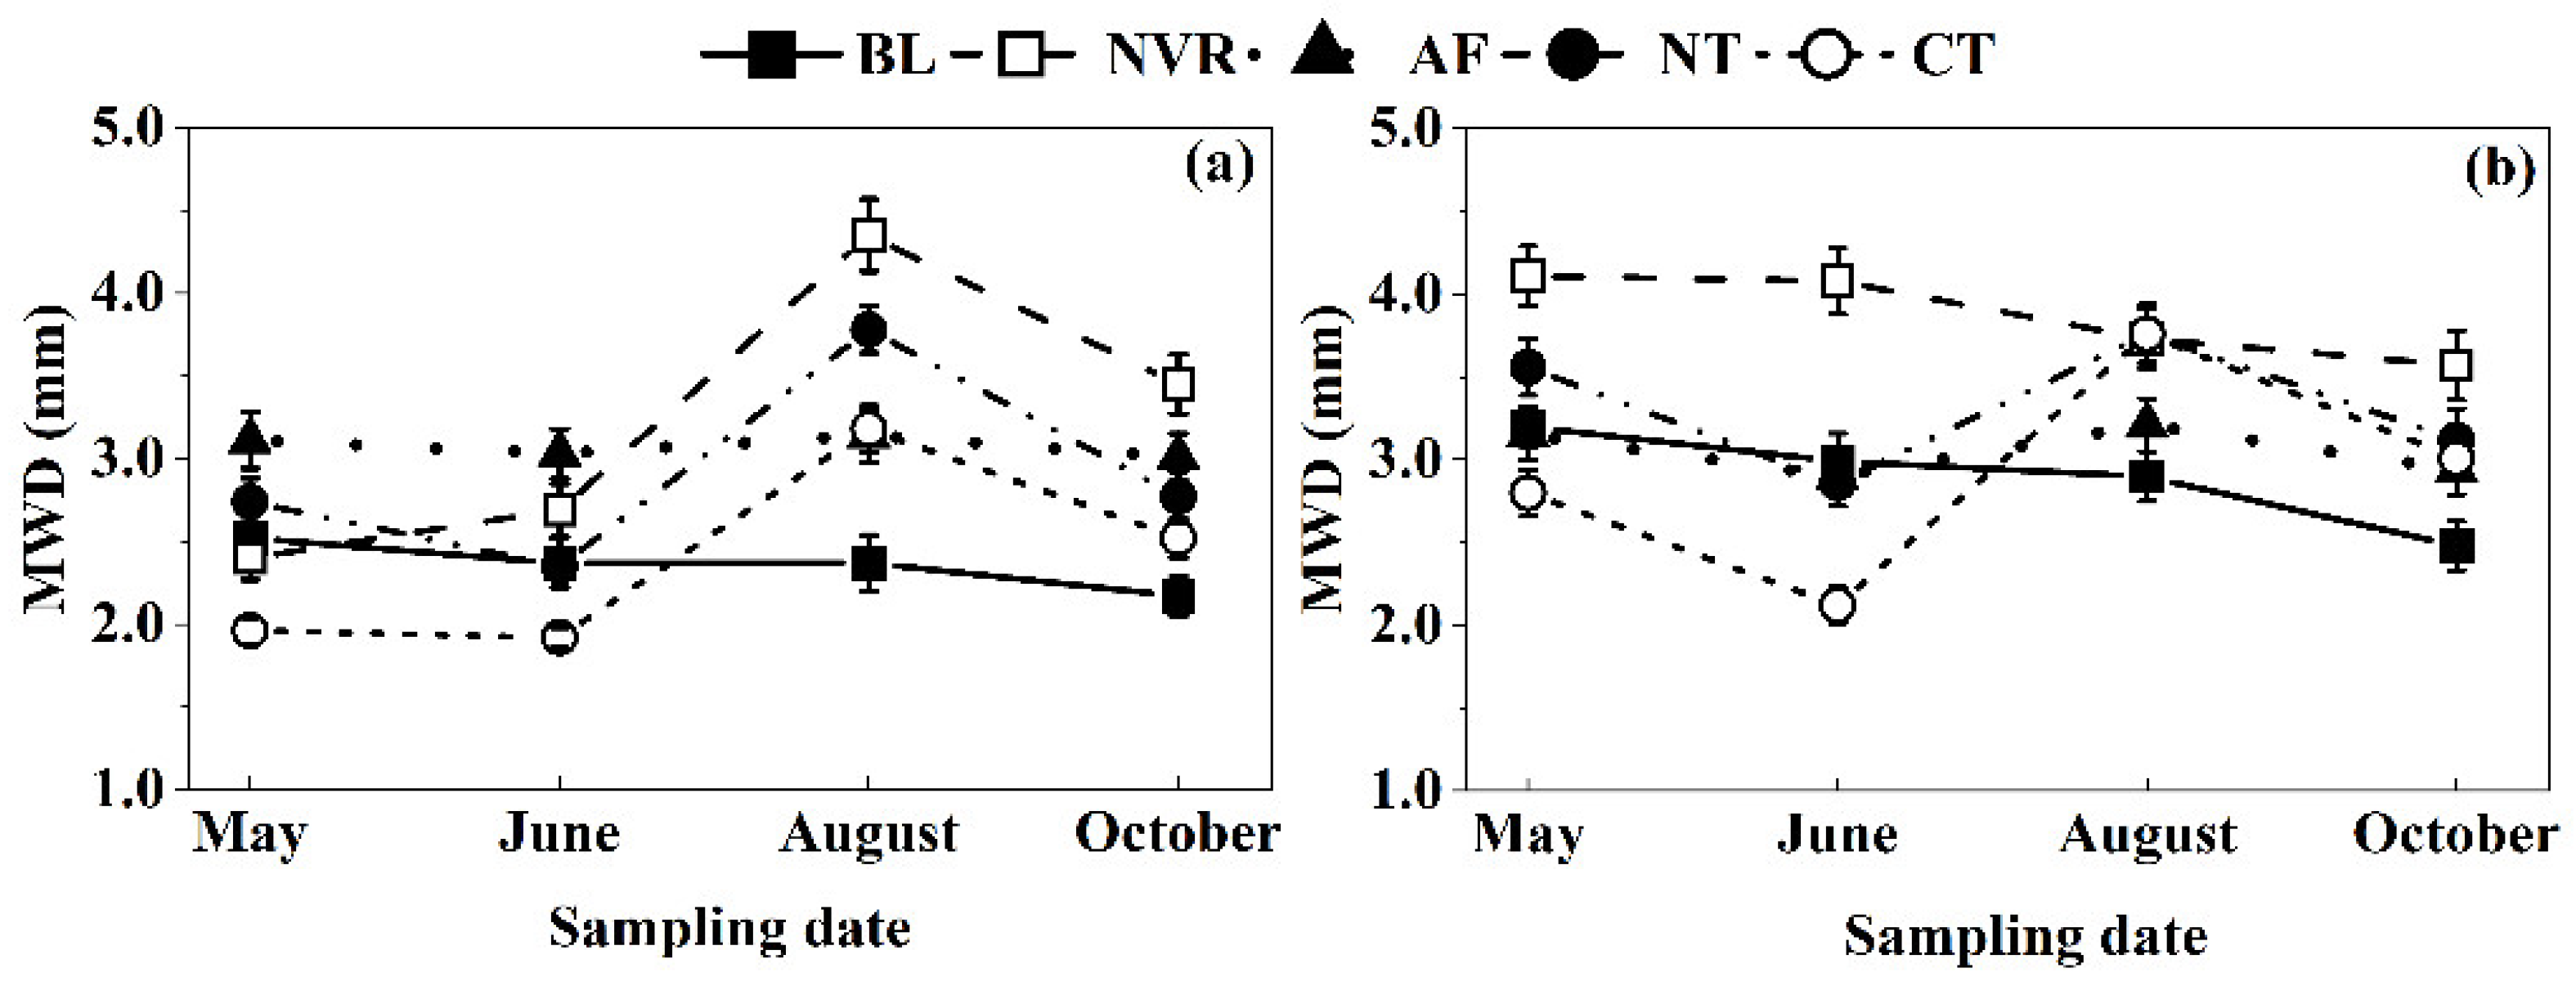
Differences in seasonal aggregate stability were apparent in all five land-use types (Figure 4). In the 0–10 cm depth, there was a significant decline in the MWD with time in the BL treatment, while the MWD in NVR, NT, and CT significantly increased and then decreased from spring to autumn; the highest MWD values occurred in August. In the 10–20 cm depth, the MWD in BL and NVR decreased with time, and the MWD of the BL treatment in October was significantly lower than in May. The MWD of the NT and CT treatments were the highest in August and the lowest in June. No significant seasonal differences in the MWD were observed in the AF treatment.

Figure 4.
Seasonal change in the mean weight diameter (MWD) of different land–use types ((a) 0–10 cm; (b) 10–20 cm). Notes: BL, bare land; NVR: natural vegetation restoration; AF, artificial forest; NT, no tillage; CT, conventional tillage.
3.2. Inter-Annual Variability in the Soil Structure
3.2.1. Bulk Density
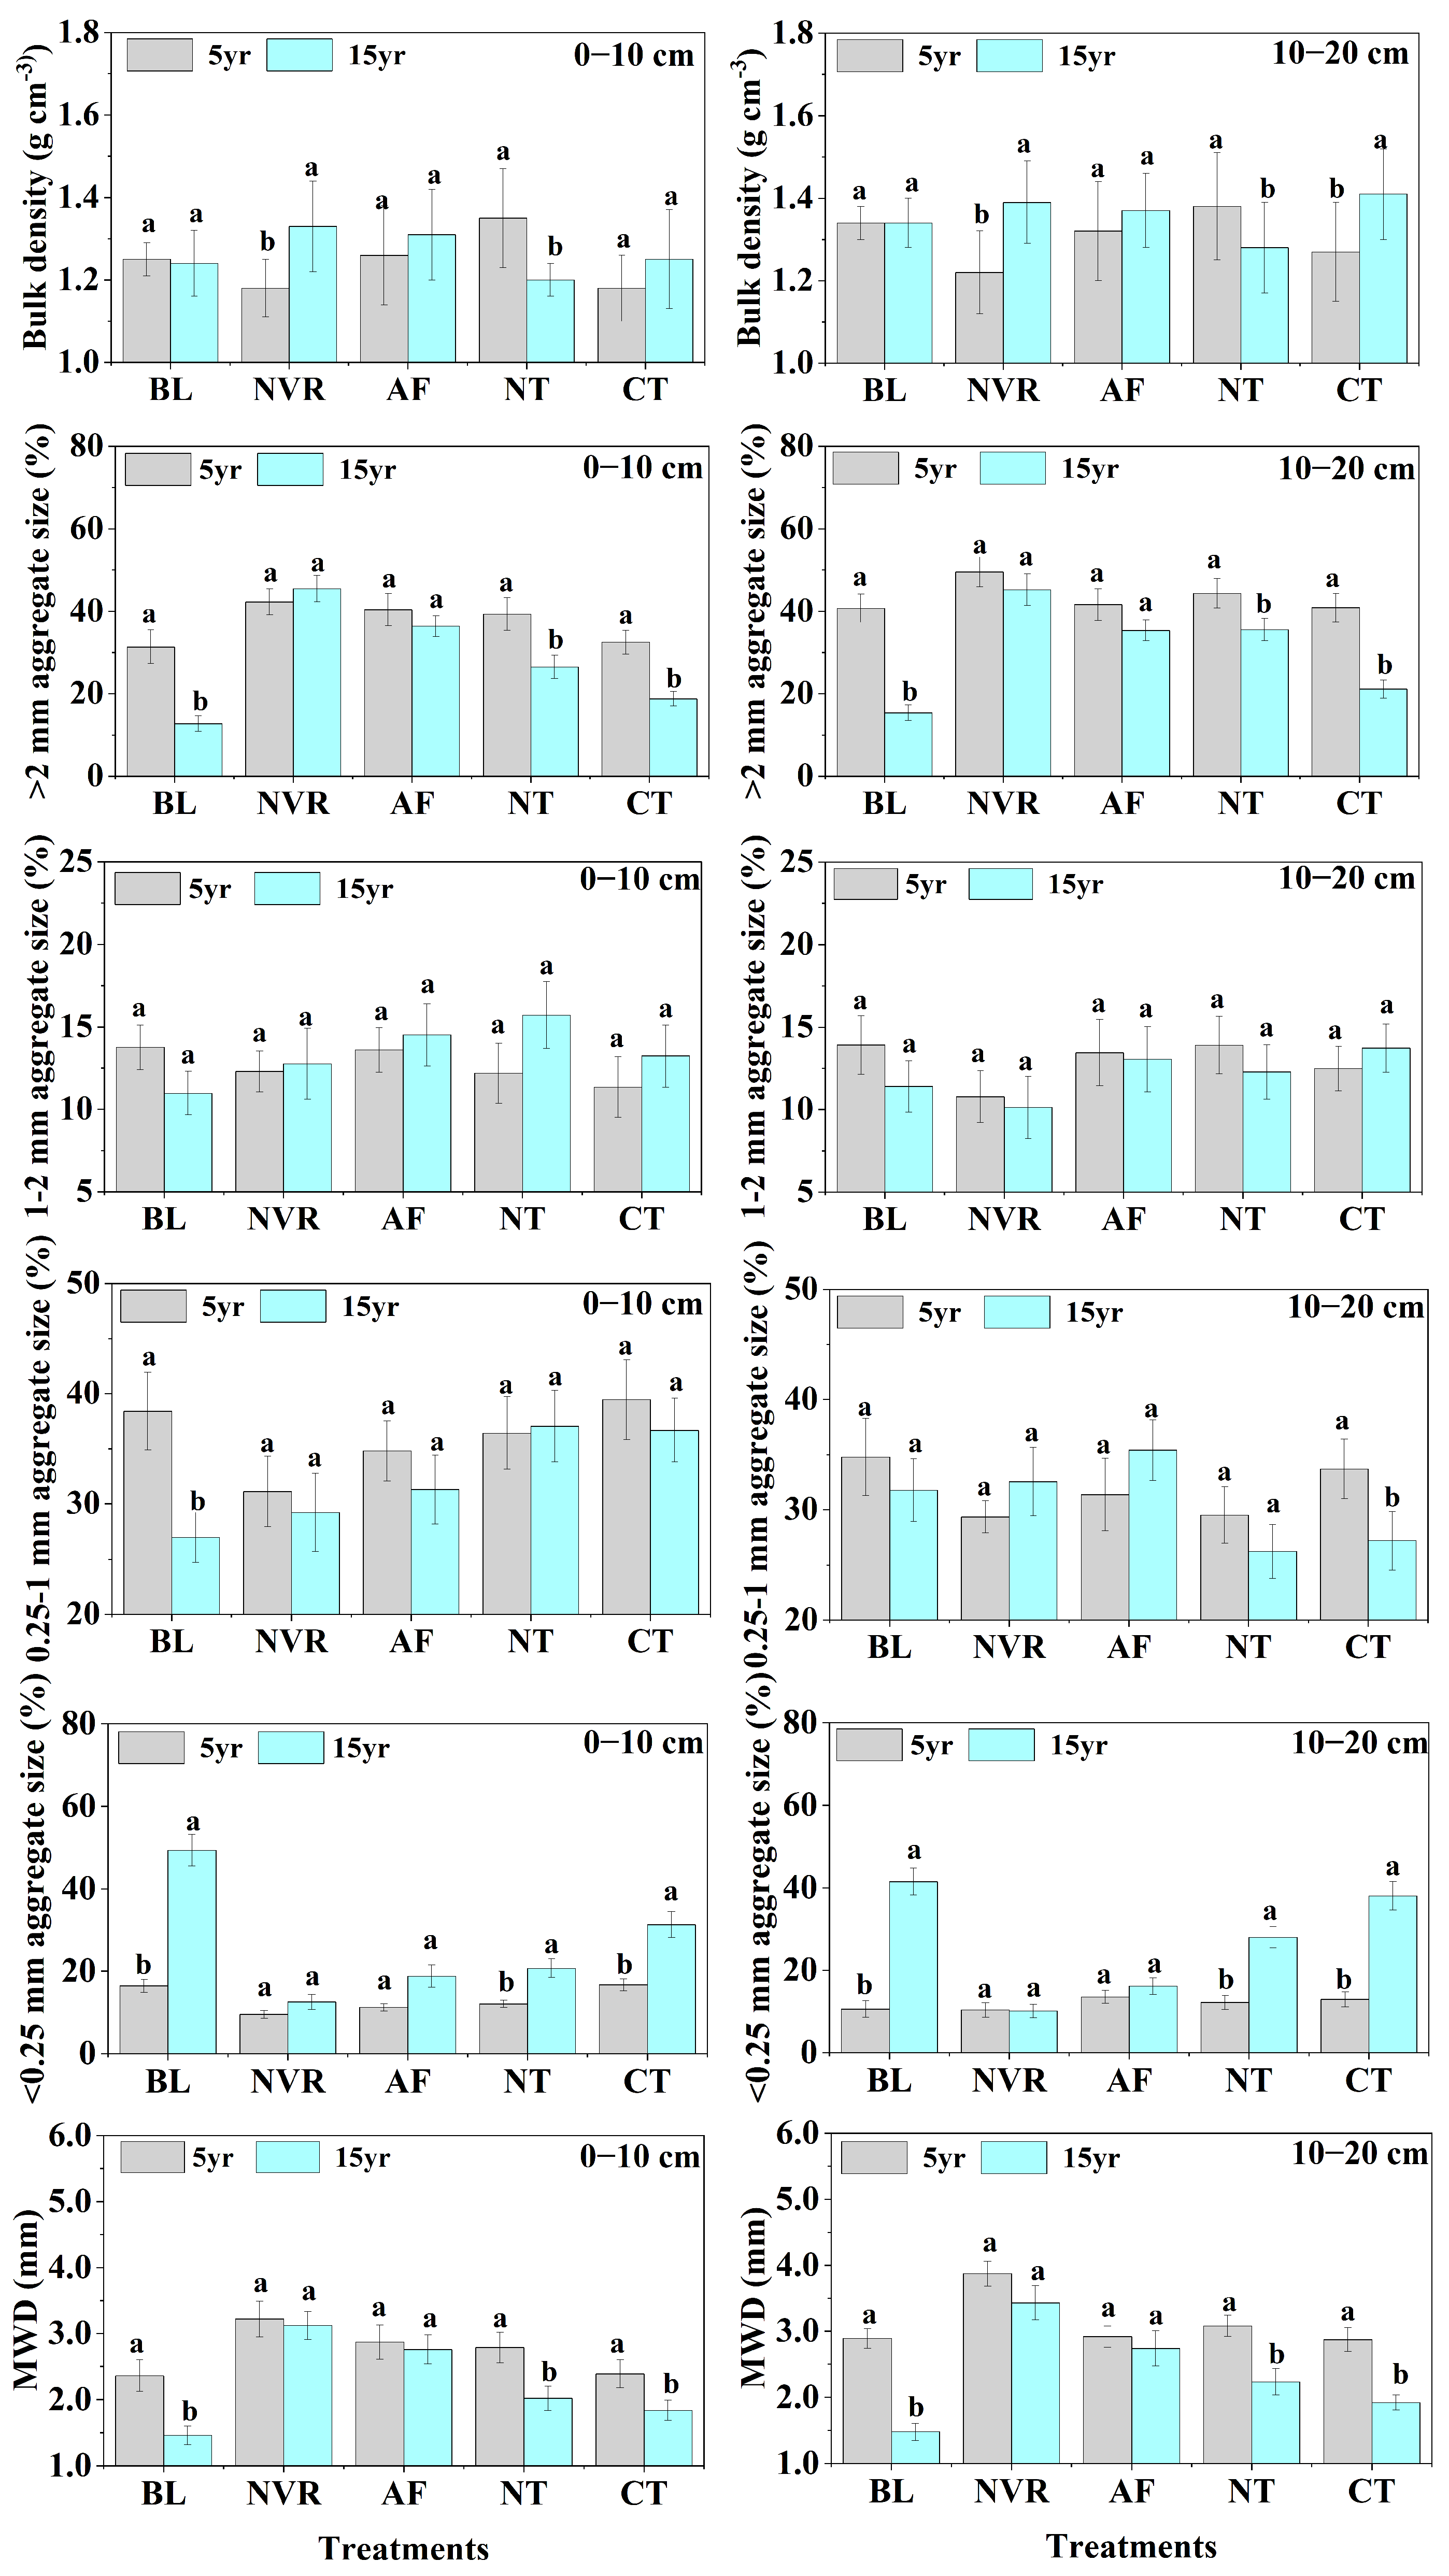
This study revealed various significant inter-annual differences in the soil physical properties in the five land-use types (Figure 5). The NVR15yr treatment had a significantly elevated BD compared with NVR5yr, and in the 0–10 cm and 10–20 cm depth layers, the BD values of NVR15yr were 0.15 g cm−3 and 0.17 g cm−3 higher than those of NVR5yr, respectively. The NT15yr had a significantly lower BD than NT5yr, and the BD values of NT15yr were 0.15 g cm−3 and 0.10 g cm−3 lower than those of NT5yr in the 0–10 cm and 10–20 cm depths, respectively. However, the BD of CT15yr was significantly greater than that of CT5yr, especially in the 10–20 cm depth. The BL and AF treatments had no significant inter-annual differences in BD.

Figure 5.
Inter−annual differences in the soil physical properties of different land−use types in the 0−10 cm and 10−20 cm depths. Notes: Values followed by different lowercase letters in the same land-use type had significant differences at the 0.05 level. BL, bare land; NVR: natural vegetation restoration; AF, artificial forest; NT, no tillage; CT, conventional tillage; MWD, mean weight diameter.
The BD of NT5yr was significantly higher than all other short-term (5 years) treatments in the 0–10 cm depth but only significantly greater than NVR5yr and CT5yr in the 10–20 cm depth. Interestingly, the BD in NT15yr was the lowest among all the land-use types, especially in the 10–20 cm depth. The BD values of NT15yr were 0.06 g cm−3, 0.11 g cm−3, 0.09 g cm−3, and 0.13 g cm−3 lower than those of BL, NVR, AF, and CT, respectively.
3.2.2. Aggregate Size Distribution and Stability
As shown in Figure 4, the long-term application of different land-use types influenced the aggregate size distribution and stability. The >2 mm size fractions of the BL, NT, and CT treatments after 15 years were significantly lower than those at 5 years, while the opposite was true for the <0.25 mm size fraction. Meanwhile, the BL and CT treatments exhibited decreases in the 0.25–1 mm size fraction over time, and there was little inter-annual variability in the 1–2 mm aggregate size fraction in these three land-use types. Furthermore, the MWD values of the BL5yr, NT5yr, and CT5yr treatments were significantly greater than those of the BL15yr, NT15yr, and CT15yr treatments. The NVR and AF treatments exhibited no significant inter-annual changes in aggregate size fraction distribution or stability. In addition, the aggregate stability of NT and CT in the subsoil (10–20 cm) was greater than in the topsoil (0–10 cm) throughout the study period.
No significant differences in aggregate size distribution were observed in any of the treatments within 5 years. However, after 15 years, the >2 mm size fractions in the NVR, NT, and AF treatments were significantly greater than those in the BL and CT treatments, but the <0.25 mm size fractions in the BL and CT treatments were significantly higher than those in other treatments. The MWD in NVR was greater than in other treatments, and the BL treatment had the lowest MWD.
3.3. Soil and Water Loss
As shown in Table 2, the runoff and sediment generated in the BL treatment were both higher than in land using NVR and tillage measures. The highest runoff depth was observed in BL, which was 95.6%, 91.2%, and 63.1% greater than those in NVR, NT, and CT, respectively. Meanwhile, compared with CT, the NVR and NT treatments had significantly lower RDs by 88.2% and 76.1%, respectively. Furthermore, compared with BL, CT had less soil loss by 33.4%, and the NVR and NT treatments had significantly reduced sediment yields by more than 99%. In addition, during the monitoring period, NT reduced the runoff depth and sediment yields by 76.1% and 99.9%, respectively, compared with CT.
Table 2.
Average runoff and soil losses in different land−use types during the monitoring period.
4. Discussion
4.1. Seasonal Dynamics of the Soil Structure
The land-use patterns and season had separate significant influences on the soil structure (Figure 2, Figure 3 and Figure 4). Generally, these influences were attributed to (1) the morphological characteristics of different plant roots, litter, and the plant communities associated with various land-use patterns; (2) differences among the physical, chemical, and biological processes within plots with different land-use types; and (3) differences in land-management practices (e.g., NT and CT) directly caused differences in soil surface roughness and volume, leading to changes in the soil structure [30,31,32,33,34]. In this study, the lowest BD in the CT treatment occurred in May due to the mechanical loosening of the soil, which temporarily formed more macropores during the seeding period. After the seeding period, the BD increased with time under the influence of rainfall and soil compaction caused by continued machinery traffic [35,36]. However, no seasonal differences in BD were observed in other treatments due to the lower soil disturbance levels [1,34,37,38].
Soil aggregates are an important component of soil that, among other things, determine the porosity of soil structures, furthermore, they are a good indicator of susceptibility to erosion [1,9,38,39]. In the present study, soil aggregate distribution and stability showed significant seasonal changes in plots with different land-use and land-management practices. Soil aggregate stability is greatly affected by the growth of plant root systems [40]. This was consistent with the lack of seasonal change in soil aggregate stability and size distribution in the AF treatments, whose root systems were relatively unchanging. Similar results were reported by other studies [5,41]. However, the >2 mm size fractions and MWD in BL decreased over the growing season because there was no vegetation cover or rain [40,42,43]. Furthermore, the greatest >2 mm size fractions and MWD were observed in August in the NVR, NT, and CT treatments, which was likely because the soil temperature and humidity in August facilitated elevated microbial activity and increased root mucilage and mass density, thereby promoting the stabilization of soil water stable macro-aggregates [44,45,46,47]. In the flat farmland, our previous studies also found that the MWD was greatest in August for NT and CT, but the >1 mm size fraction in CT decreased gradually with the growing season [23].
4.2. Inter-Annual Differences in the Soil Structure
In this study, different land-use and land-management practices resulted in progressive changes in soil structure over time. Some studies reported that soil bulk density initially increased gradually after converting arable land to grassland/forest land and then tended to plateau due to increased soil compaction [48,49]. Other studies observed that, with the increasing vegetation cover (especially for artificial forests and grasslands established on previous croplands), the soil became much drier due to decreasing water content in the soil profile, which might lead to increased BD [50,51]. Zhang et al. (2020) [52] found that afforestation resulted in BD decreases of 0.45% per year in the 0–10 cm depth and 0.29% per year in the subsurface soil (10–20 cm). This was not consistent with our results in which the BD in NVR15yr was significantly greater than that in NVR5yr. These differences were mainly caused by differences in climate zones and soil texture types. No significant differences in BD were observed between NVR5yr and BL5yr, which was similar to the findings of Keller et al. (2021) [53]. The inter-annual differences in BD were small in natural forests and grassland, that is, in areas where the eco-environmental factors were relatively stable [6,30].
For the tillage measures, while long-term CT increased the BD due to mechanical compaction [54,55], long-term NT reduced the BD, which agreed with many previous studies [48,55,56]. Indeed, Reichert et al. (2016) [55] observed a decline in the BD over 14 years of NT and concluded that NT reduced soil compaction. However, many authors reported higher BD in NT plot surface soils in the short term compared with other tillage measures, particularly in soils with fine textures [48,57,58]. Similarly, our study also found that NT5yr had a significantly greater BD than CT5yr, but no difference in BD in the surface soil was observed between NT and CT after 15 years. Meanwhile, the multi-year application of tillage measures did not affect the BD in the 10–20 cm depth. This was similar to the findings of other studies [59,60].
The >2 mm size fraction and MWD of BL5yr were significantly greater than those in BL15yr. However, no significant temporal differences in soil aggregate stability were found in the NVR and AF treatments (Figure 5). Furthermore, we found that long-term NVR and AF had significantly greater >2 mm size fractions and MWD than long-term BL. These results confirmed that the restoration of vegetation was an effective measure for improving soil structure and sustainably developing the ecological function of soil. Compared with BL, soil organic carbon was higher in the vegetation restoration plots, along with total nitrogen and underground biomass, due to the formation of macroaggregates and the increased stability of soil aggregates [5,47]. Furthermore, the plant root systems interweave into soil masses and strengthen soil cohesion, and the mucilage secretion of plant roots promotes the formation of soil aggregates [61,62]. These observations clearly demonstrated that 5 years of natural recovery can effectively improve soil structure stability, as was observed in previous studies [40,63,64].
Aggregate stability and distribution parameters varied significantly across different tillage treatments, which also changed over time (Figure 5). In this study, long-term NT and CT had lower >2 mm size fractions and aggregate stability, possibly due to the comprehensive effect of topographic factors and soil loss. Additionally, our study showed that long-term NT could improve the soil aggregate stability more than CT. Similar trends were observed in previous studies [24,60,65,66], which may have been best explained by Daraghmeh et al. (2009) [67], who observed that conservation tillage improved soil structure through a combination of increased soil organic matter from straw mulch, reduced soil bulk density, and an increased proportion of larger aggregates, compared with CT (conventional tillage).
4.3. Effects of Land-Use and Land-Management Practices on Soil Losses
Our study clearly showed that land-use and land-management practices exerted a great influence on water and soil loss (Table 2), which agreed with previous studies [14,68,69,70]. Furthermore, the BL plots had the greatest runoff and sediment yields during the experimental period, while NVR reduced the runoff depth and sediment yields by 95.6% and 88.2% compared with BL, respectively. This was mainly because of the bonding and binding effect of the vegetation, whose roots strengthened and improved the soil structure and infiltration capacity. On the other hand, plants can also intercept raindrops and weaken rainfall kinetic energy with their stems and leaves, which can reduce the runoff flow velocity and compaction due to rainfall [71,72,73]. Moreover, NVR controlled soil erosion better than the tillage measures. We observed that NT and CT increased the runoff depths by 50.8% and 88.2% and sediment yields by 90.6% and 99.9%, respectively, compared with NVR. These results were consistent with previous studies [8,14,74]. Furthermore, it was reported that the conversion of natural grassland/forest to arable land can result in rapid declines in soil quality and marked increases in soil erosion due to more frequent soil disturbances and a sparser canopy [75,76,77]. Vegetation restoration has been widely recognized as an effective measure for controlling soil erosion [8,14,78].
Additionally, our study found that NT generated smaller amounts of runoff and sediment and reduced the runoff depth and sediment yields by 76.1% and 99.9%, respectively, compared with CT. Meanwhile, the sediment concentrations in runoff under CT were greater than under NT at the same rainfall intensity (data not shown). In fact, the dense straw mulch and reduced soil disturbance in the NT plot greatly controlled soil losses compared with CT in the sloping farmland. This occurred by promoting soil structure stability, accelerating the soil infiltration speed, altering the soil surface roughness, reducing the raindrop splash erosion, and delaying runoff initiation [16,24,48,79,80]. These results indicated that re-vegetation and the three tillage management strategies can greatly reduce soil erodibility and the sensitivity of soil to runoff, especially for NVR and NT.
In this region, the abundant farmland in the sloping land commonly shows decreasing trends in soil quality and increasing trends in soil erosion. These problems have affected grain production and are worthy of attention so that land use and management can be optimized to control soil loss and improve soil health. Our study suggested that vegetation restoration is an efficient measure for maintaining soil structural stability and reducing soil erosion compared with bare land. Meanwhile, compared with CT, NT effectively improved soil aggregate stability and ability to resist erosion in the sloping farmland and, as such, it should be popularized and applied in Northeast China.
5. Conclusions
Land use and management deferentially affected soil structure on both seasonal and inter-annual scales in this study. In terms of seasonal changes, the AF, NVR, and NT maintained a more stable soil structure than BL and CT during the growing season. The >2 mm size fraction and AS were reduced in BL, and their highest values in the NVR, NT, and CT plots occurred in August. Over the long term, BD in NVR and CT increased, but the opposite result was found in NT, and BL exhibited no temporal changes in BD. Furthermore, in the long term, BL, NT, and CT had reduced soil aggregate stability, while NVR and AF had increased soil structure stability relative to the other treatments. For the tillage measures, NT had a significantly greater BD than CT after 5 years, but there was no significant difference after 15 years. Meanwhile, NT promoted the formation of the >2 mm size fraction and improved the aggregate stability compared with CT. Moreover, the soil structural stabilities of NT and CT were higher in the subsurface soil than in the topsoil. Additionally, NVR and both tillage measures showed significant reductions in soil erosion compared with BL, and the runoff depth and sediment yields in NT were lower than CT by 76.1% and 99.9%, respectively. In conclusion, re-vegetation restoration should be adopted to control soil erosion in abandoned bare land, while the NT strategy is a sustainable agricultural measure for use in the black soil region of Northeast China.
Author Contributions
Conceptualization, Q.C. and X.Z.; methodology, Q.C., J.L. and J.T.; validation, Q.C. and J.T.; formal analysis, Q.C. and J.T.; investigation, Q.C., J.T. and X.W.; resources, X.Z.; data curation, Q.C. and J.T.; writing—original draft preparation, J.T.; writing—review and editing, Q.C., M.G. and X.Z.; supervision, Q.C. and X.Z.; project administration, Q.C. and X.Z.; funding acquisition, Q.C., M.G. and X.Z. All authors have read and agreed to the published version of the manuscript.
Funding
This study was funded by the National Key Research and Development Program of China (2021YFD1500800) and the National Natural Science Foundation of China (42101281; 42107356).
Data Availability Statement
Not applicable.
Conflicts of Interest
The authors declare no conflict of interest.
References
- Bronick, C.J.; Lal, R. Soil structure and management: A review. Geoderma 2005, 124, 3–22. [Google Scholar] [CrossRef]
- Adhikari, K.; Hartemink, A.E. Linking soils to ecosystem services—A global review. Geoderma 2016, 262, 101–111. [Google Scholar] [CrossRef]
- Bossio, D.; Girvan, M.; Verchot, L.; Bullimore, J.; Borelli, T.; Albrecht, A.; Scow, K.; Ball, A.; Pretty, J.; Osborn, A. Soil microbial community response to land use change in an agricultural landscape of western Kenya. Microb. Ecol. 2005, 49, 50–62. [Google Scholar] [CrossRef]
- Foley, J.A.; DeFries, R.; Asner, G.P.; Barford, C.; Bonan, G.; Carpenter, S.R.; Chapin, F.S.; Coe, M.T.; Daily, G.C.; Gibbs, H.K.; et al. Global consequences of land use. Science 2005, 309, 570–574. [Google Scholar] [CrossRef] [PubMed]
- Valle, S.R.; Dörner, J.; Zúñiga, F.; Dec, D. Seasonal dynamics of the physical quality of volcanic ash soils under different land uses in southern Chile. Soil Tillage Res. 2018, 182, 25–34. [Google Scholar] [CrossRef]
- Zaher, H.; Sabir, M.; Benjelloun, H.; Paul-Igor, H. Effect of forest land use change on carbohydrates, physical soil quality and carbon stocks in Moroccan cedar area. J. Environ. Manag. 2020, 254, 109544. [Google Scholar] [CrossRef]
- Poulton, P.; Johnston, J.; Macdonald, A.; White, R.; Powlson, D. Major limitations to achieving “4 per 1000” increases in soil organic carbon stock in temperate regions: Evidence from long-term experiments at Rothamsted Research, United Kingdom. Glob. Chang. Biol. 2018, 24, 2563–2584. [Google Scholar] [CrossRef]
- Arunrat, N.; Sereenonchai, S.; Kongsurakan, P.; Hatano, R. Soil organic carbon and soil erodibility response to various land-use changes in northern Thailand. Catena 2022, 219, 106595. [Google Scholar] [CrossRef]
- Barthès, B.; Roose, E. Aggregate stability as an indicator of soil susceptibility to runoff and erosion; validation at several levels. Catena 2002, 47, 133–149. [Google Scholar] [CrossRef]
- Czyz, E.A.; Dexter, A.R. Soil physical properties as affected by traditional, reduced and no-tillage for winter wheat. Int. Agrophys. 2009, 23, 319–326. [Google Scholar]
- Josa, R.; Ginovart, M.; Solé, A. Effects of two tillage techniques on soil macroporosity in sub-humid environment. Int. Agrophys. 2010, 24, 139–148. [Google Scholar]
- Lipiec, J.; Kuœ, J.; Nosalewicz, A.; Turski, M. Tillage system effects on stability and sorptivity of soil aggregates. Int. Agrophys. 2006, 20, 189–193. [Google Scholar]
- Shein, E.V.; Umarova, A.B.; Milanovskiy, E.Y.; Sokolova, I.V. Preferential water flow, local soil biota and structure deg-radation in chernozem 20 years after land-reclamation. Int. Agrophys. 2010, 24, 75–80. [Google Scholar]
- Yan, Y.; Zhen, H.; Zhai, X.; Li, J.; Hu, W.; Ding, C.; Qi, Z.; Qiao, B.; Li, H.; Liu, X.; et al. The role of vegetation on earth bunds in mitigating soil erosion in Mollisols region of Northeast China. Catena 2021, 196, 104927. [Google Scholar] [CrossRef]
- Gonzalez, J.M. Runoff and losses of nutrients and herbicides under long-term conservation practices (no-till and crop rotation) in the U.S. Midwest: A variable intensity simulated rainfall approach. Int. Soil Water Conserv. Res. 2018, 6, 265–274. [Google Scholar] [CrossRef]
- Carretta, L.; Tarolli, P.; Cardinali, A.; Nasta, P.; Romano, N.; Masin, R. Evaluation of runoff and soil erosion under conventional tillage and no-till management: A case study in northeast Italy. Catena 2021, 197, 104972. [Google Scholar] [CrossRef]
- Raczkowski, C.W.; Reyes, M.R.; Reddy, G.B.; Busscher, W.J.; Bauer, P.J. Comparison of conventional and no-tillage corn and soybean production on runoff and erosion in the southeastern US Piedmont. J. Soil Water Conserv. 2009, 64, 53–60. [Google Scholar] [CrossRef]
- Liu, X.; Zhang, X.; Herbert, S.J. Feeding China’s growing needs for grain. Nature 2010, 465, 420. [Google Scholar] [CrossRef]
- Zhang, S.; Han, X.; Cruse, R.M.; Zhang, X.; Hu, W.; Yan, Y.; Guo, M. Morphological characteristics and influencing factors of permanent gully and its contribution to regional soil loss based on a field investigation of 393 km2 in Mollisols region of northeast China. Catena 2022, 217, 106467. [Google Scholar] [CrossRef]
- Liu, X.; Zhang, S.; Zhang, X.; Ding, G.; Cruse, R. Soil erosion control practices in Northeast China: A mini-review. Soil Tillage Res. 2011, 117, 44–48. [Google Scholar] [CrossRef]
- Soil Survey Staff. Keys to Soil Taxonomy, 11th ed.; United States Department of Agriculture, Natural Resources Conservation Service: Washington, DC, USA, 2010.
- Xiong, Y. Chinese Soils, 2nd ed.; Science Press: Beijing, China, 1987; pp. 20–38. (In Chinese) [Google Scholar]
- Chen, Q.; Kravchenko, Y.S.; Li, H.; Chen, S.; Zhang, X.Y. Seasonal variation of physical and chemical properties in a black soil under No-till and conventional tillage in Northeast China. Philipp. Agric. Sci. 2016, 99, 277–282. [Google Scholar]
- Chen, Q.; Zhang, X.; Sun, L.; Ren, J.; Yuan, Y.; Zang, S. Influence of Tillage on the Mollisols Physicochemical Properties, Seed Emergence and Yield of Maize in Northeast China. Agriculture 2021, 11, 939. [Google Scholar] [CrossRef]
- Cheng, Y.; Zhang, P.; Zhang, H. Variation character of grain yield per unit area in main grain-producing area of Northeast China. Chin. Geogr. Sci. 2007, 17, 110–116. [Google Scholar] [CrossRef]
- Song, G.; Zhang, H. Cultivated land use layout adjustment based on crop planting suitability: A case study of typical counties in Northeast China. Land 2021, 10, 107. [Google Scholar] [CrossRef]
- Sun, T.; Chen, Q.; Chen, Y.; Cruse, R.; Li, X.; Song, C.; Kravchenko, Y.; Zhang, X. A novel soil wetting technique for measuring wet stable aggregates. Soil Tillage Res. 2014, 141, 19–24. [Google Scholar] [CrossRef]
- van Bavel, C.H.M. Mean Weight-Diameter of Soil Aggregates as a Statistical Index of Aggregation. Soil Sci. Soc. Am. J. 1950, 14, 20–23. [Google Scholar] [CrossRef]
- Sun, T.; Cruse, R.M.; Chen, Q.; Li, H.; Song, C.; Zhang, X. Design and initial evaluation of a portable in situ runoff and sediment monitoring device. J. Hydrol. 2014, 519, 1141–1148. [Google Scholar] [CrossRef]
- Hu, W.; Shao, M.A.; Si, B.C. Seasonal changes in surface bulk density and saturated hydraulic conductivity of natural landscapes. Eur. J. Soil Sci. 2012, 63, 820–830. [Google Scholar] [CrossRef]
- Mora, J.; Lázaro, R. Seasonal changes in bulk density under semiarid patchy vegetation: The soil beats. Geoderma 2014, 235–236, 30–38. [Google Scholar] [CrossRef]
- Hao, M.; Zhang, J.; Meng, M.; Chen, H.Y.H.; Guo, X.; Liu, S.; Ye, L. Impacts of changes in vegetation on saturated hydraulic conductivity of soil in subtropical forests. Sci. Rep. 2019, 9, 8372. [Google Scholar] [CrossRef]
- Zumr, D.; Jeřábek, J.; Klípa, V.; Dohnal, M.; Sněhota, M. Estimates of tillage and rainfall effects on unsaturated hydraulic conductivity in a small central European agricultural catchment. Water 2019, 11, 740. [Google Scholar] [CrossRef]
- Zhao, Y.; Wang, Y.; Zhang, X. Spatial and temporal variation in soil bulk density and saturated hydraulic conductivity and its influencing factors along a 500 km transect. Catena 2021, 207, 105592. [Google Scholar] [CrossRef]
- Karunatilake, U.P.; Van Es, H.M. Rainfall and tillage effects on soil structure after alfalfa conversion to maize on a clay loam soil in New York. Soil Tillage Res. 2002, 67, 135–146. [Google Scholar] [CrossRef]
- Keller, T.; Sandin, M.; Colombi, T.; Horn, R.; Or, D. Historical increase in agricultural machinery weights enhanced soil stress levels and adversely affected soil functioning. Soil Tillage Res. 2019, 194, 104293. [Google Scholar] [CrossRef]
- Osunbitan, J.; Oyedele, D.; Adekalu, K. Tillage effects on bulk density, hydraulic conductivity and strength of a loamy sand soil in southwestern Nigeria. Soil Tillage Res. 2005, 82, 57–64. [Google Scholar] [CrossRef]
- Topa, D.; Cara, I.G.; Jităreanu, G. Long term impact of different tillage systems on carbon pools and stocks, soil bulk density, aggregation and nutrients: A field meta-analysis. Catena 2021, 199, 105102. [Google Scholar] [CrossRef]
- De Ploey, J.; Poesen, J. Aggregate Stability, Runoff Generation and Interrill Erosion. In Geomorphology and Soils; Routledge: Abingdon-on-Thames, UK, 2020; pp. 99–120. [Google Scholar] [CrossRef]
- Zeng, Q.; Darboux, F.; Man, C.; Zhu, Z.; An, S. Soil aggregate stability under different rain conditions for three vegetation types on the Loess Plateau (China). Catena 2018, 167, 276–283. [Google Scholar] [CrossRef]
- An, S.; Mentler, A.; Mayer, H.; Blum, W.E. Soil aggregation, aggregate stability, organic carbon and nitrogen in different soil aggregate fractions under forest and shrub vegetation on the Loess Plateau, China. Catena 2010, 81, 226–233. [Google Scholar] [CrossRef]
- Ramos, M.; Nacci, S.; Pla, I. Effect of raindrop impact and its relationship with aggregate stability to different disaggregation forces. Catena 2003, 53, 365–376. [Google Scholar] [CrossRef]
- Korenkova, L.N.; Matúš, P. Role of water repellency in aggregate stability of cultivated soils under simulated raindrop impact. Eurasian Soil Sci. 2015, 48, 754–758. [Google Scholar] [CrossRef]
- Morel, J.L.; Habib, L.; Plantureux, S.; Guckert, A. Influence of maize root mucilage on soil aggregate stability. Plant Soil 1991, 136, 111–119. [Google Scholar] [CrossRef]
- le Bissonnais, Y.; Prieto, I.; Roumet, C.; Nespoulous, J.; Metayer, J.; Huon, S.; Villatoro, M.; Stokes, A. Soil aggregate stability in Mediterranean and tropical agro-ecosystems: Effect of plant roots and soil characteristics. Plant Soil 2017, 424, 303–317. [Google Scholar] [CrossRef]
- Demenois, J.; Carriconde, F.; Bonaventure, P.; Maeght, J.-L.; Stokes, A.; Rey, F. Impact of plant root functional traits and associated mycorrhizas on the aggregate stability of a tropical Ferralsol. Geoderma 2018, 312, 6–16. [Google Scholar] [CrossRef]
- Dou, Y.; Yang, Y.; An, S.; Zhu, Z. Effects of different vegetation restoration measures on soil aggregate stability and erodibility on the Loess Plateau, China. Catena 2020, 185, 104294. [Google Scholar] [CrossRef]
- Blanco-Canqui, H.; Ruis, S.J. No-tillage and soil physical environment. Geoderma 2018, 326, 164–200. [Google Scholar] [CrossRef]
- Hargreaves, P.; Baker, K.; Graceson, A.; Bonnett, S.; Ball, B.; Cloy, J. Soil compaction effects on grassland silage yields and soil structure under different levels of compaction over three years. Eur. J. Agron. 2019, 109, 125916. [Google Scholar] [CrossRef]
- Jia, X.; Wang, Y.; Shao, M.; Luo, Y.; Zhang, C. Estimating regional losses of soil water due to the conversion of agricultural land to forest in China’s Loess Plateau. Ecohydrology 2017, 10, e1851. [Google Scholar] [CrossRef]
- Jia, X.; Shao, M.; Yu, D.; Zhang, Y.; Binley, A. Spatial variations in soil-water carrying capacity of three typical revegetation species on the Loess Plateau, China. Agric. Ecosyst. Environ. 2019, 273, 25–35. [Google Scholar] [CrossRef]
- Zhang, Y.; Liao, X.; Wang, Z.; Wei, X.; Jia, X.; Shao, M. Synchronous sequestration of organic carbon and nitrogen in mineral soils after conversion agricultural land to forest. Agric. Ecosyst. Environ. 2020, 295, 106866. [Google Scholar] [CrossRef]
- Keller, T.; Colombi, T.; Ruiz, S.; Schymanski, S.J.; Weisskopf, P.; Koestel, J.; Sommer, M.; Stadelmann, V.; Breitenstein, D.; Kirchgessner, N.; et al. Soil structure recovery following compaction: Short-term evolution of soil physical properties in a loamy soil. Soil Sci. Soc. Am. J. 2021, 85, 1002–1020. [Google Scholar] [CrossRef]
- Nawaz, M.F.; Bourrié, G.; Trolard, F. Soil compaction impact and modelling. A review. Agron. Sustain. Dev. 2013, 33, 291–309. [Google Scholar] [CrossRef]
- Reichert, J.M.; da Rosa, V.T.; Vogelmann, E.S.; da Rosa, D.P.; Horn, R.; Reinert, D.J.; Sattler, A.; Denardin, J.E. Conceptual framework for capacity and intensity physical soil properties affected by short and long-term (14 years) continuous no-tillage and controlled traffic. Soil Tillage Res. 2016, 158, 123–136. [Google Scholar] [CrossRef]
- Logsdon, S.D.; Karlen, D.L. Bulk density as a soil quality indicator during conversion to no-tillage. Soil Tillage Res. 2004, 78, 143–149. [Google Scholar] [CrossRef]
- Alvarez, R.; Steinbach, H. A review of the effects of tillage systems on some soil physical properties, water content, nitrate availability and crops yield in the Argentine Pampas. Soil Tillage Res. 2009, 104, 1–15. [Google Scholar] [CrossRef]
- Munkholm, L.J.; Heck, R.J.; Deen, B. Long-term rotation and tillage effects on soil structure and crop yield. Soil Tillage Res. 2013, 127, 85–91. [Google Scholar] [CrossRef]
- Nouri, A.; Lee, J.; Yin, X.; Tyler, D.D.; Saxton, A.M. Thirty-four years of no-tillage and cover crops improve soil quality and increase cotton yield in Alfisols, Southeastern USA. Geoderma 2019, 337, 998–1008. [Google Scholar] [CrossRef]
- Sokolowski, A.C.; McCormick, B.P.; De Grazia, J.; Wolski, J.E.; Rodríguez, H.A.; Rodríguez-Frers, E.P.; Gagey, M.C.; Debelis, S.P.; Paladino, I.R.; Barrios, M.B. Tillage and no-tillage effects on physical and chemical properties of an Argiaquoll soil under long-term crop rotation in Buenos Aires, Argentina. Int. Soil Water Conserv. Res. 2020, 8, 185–194. [Google Scholar] [CrossRef]
- Burylo, M.; Rey, F.; Mathys, N.; Dutoit, T. Plant root traits affecting the resistance of soils to concentrated flow erosion. Earth Surf. Process. Landf. 2012, 37, 1463–1470. [Google Scholar] [CrossRef]
- Wang, B.; Zhang, G.-H. Quantifying the binding and bonding effects of plant roots on soil detachment by overland flow in 10 typical grasslands on the loess plateau. Soil Sci. Soc. Am. J. 2017, 81, 1567–1576. [Google Scholar] [CrossRef]
- Zheng, F.-L. Effect of Vegetation Changes on Soil Erosion on the Loess Plateau. Pedosphere 2006, 16, 420–427. [Google Scholar] [CrossRef]
- Liu, Y.; Lü, Y.; Fu, B.; Harris, P.; Wu, L. Quantifying the spatio-temporal drivers of planned vegetation restoration on ecosystem services at a regional scale. Sci. Total Environ. 2019, 650, 1029–1040. [Google Scholar] [CrossRef] [PubMed]
- Bottinelli, N.; Angers, D.; Hallaire, V.; Michot, D.; Le Guillou, C.; Cluzeau, D.; Heddadj, D.; Menasseri-Aubry, S. Tillage and fertilization practices affect soil aggregate stability in a Humic Cambisol of Northwest France. Soil Tillage Res. 2017, 170, 14–17. [Google Scholar] [CrossRef]
- Chellappa, J.; Sagar, K.L.; Sekaran, U.; Kumar, S.; Sharma, P. Soil organic carbon, aggregate stability and biochemical activity under tilled and no-tilled agroecosystems. J. Agric. Food Res. 2021, 4, 100139. [Google Scholar] [CrossRef]
- Daraghmeh, O.; Jensen, J.; Petersen, C. Soil structure stability under conventional and reduced tillage in a sandy loam. Geoderma 2009, 150, 64–71. [Google Scholar] [CrossRef]
- Sharma, A.; Tiwari, K.N.; Bhadoria, P.B.S. Effect of land use land cover change on soil erosion potential in an agricultural watershed. Environ. Monit. Assess. 2011, 173, 789–801. [Google Scholar] [CrossRef] [PubMed]
- Borrelli, P.; Robinson, D.A.; Fleischer, L.R.; Lugato, E.; Ballabio, C.; Alewell, C.; Meusburger, K.; Modugno, S.; Schütt, B.; Ferro, V.; et al. An assessment of the global impact of 21st century land use change on soil erosion. Nat. Commun. 2017, 8, 2013. [Google Scholar] [CrossRef]
- Chen, Z.; Wang, L.; Wei, A.; Gao, J.; Lu, Y.; Zhou, J. Land-use change from arable lands to orchards reduced soil erosion and increased nutrient loss in a small catckment. Sci. Total Environ. 2019, 648, 1097–1104. [Google Scholar] [CrossRef]
- Dabney, S.M.; Meyer, L.D.; Harmon, W.C.; Alonso, C.V.; Foster, G.R. Depositional patterns of sediment trapped by grass hedges. Trans. ASAE 1995, 38, 1719–1729. [Google Scholar] [CrossRef]
- Gyssels, G.; Poesen, J.; Bochet, E.; Li, Y. Impact of plant roots on the resistance of soils to erosion by water: A review. Prog. Phys. Geogr. 2005, 29, 189–217. [Google Scholar] [CrossRef]
- Liu, J.; Gao, G.; Wang, S.; Jiao, L.; Wu, X.; Fu, B. The effects of vegetation on runoff and soil loss: Multidimensional structure analysis and scale characteristics. J. Geogr. Sci. 2018, 28, 59–78. [Google Scholar] [CrossRef]
- Zhang, W.; Zhou, L.; Zhang, Y.; Chen, Z.; Hu, F. Impacts of Ecological Migration on Land Use and Vegetation Restoration in Arid Zones. Land 2022, 11, 891. [Google Scholar] [CrossRef]
- Vityakon, P. Degradation and restoration of sandy soils under different agricultural land uses in northeast Thailand: A review. Land Degrad. Dev. 2007, 18, 567–577. [Google Scholar] [CrossRef]
- Mohammad, A.G.; Adam, M.A. The impact of vegetative cover type on runoff and soil erosion under different land uses. Catena 2010, 81, 97–103. [Google Scholar] [CrossRef]
- Fry, E.L.; Pilgrim, E.S.; Tallowin, J.R.; Smith, R.S.; Mortimer, S.R.; Beaumont, D.A.; Simkin, J.; Harris, S.J.; Shiel, R.S.; Quirk, H.; et al. Plant, soil and microbial controls on grassland diversity restoration: A long-term, multi-site mesocosm experiment. J. Appl. Ecol. 2017, 54, 1320–1330. [Google Scholar] [CrossRef]
- Wen, X.; Deng, X.; Zhang, F. Scale effects of vegetation restoration on soil and water conservation in a semi-arid region in China: Resources conservation and sustainable management. Resour. Conserv. Recycl. 2019, 151, 104474. [Google Scholar] [CrossRef]
- Maetens, W.; Poesen, J.; Vanmaercke, M. How effective are soil conservation techniques in reducing plot runoff and soil loss in Europe and the Mediterranean? Earth-Sci. Rev. 2012, 115, 21–36. [Google Scholar] [CrossRef]
- Salem, H.M.; Ali, A.M.; Wu, W.; Tu, Q. Initial effect of shifting from traditional to no-tillage on runoff retention and sediment reduction under rainfall simulation. Soil Res. 2021, 60, 547–560. [Google Scholar] [CrossRef]
Disclaimer/Publisher’s Note: The statements, opinions and data contained in all publications are solely those of the individual author(s) and contributor(s) and not of MDPI and/or the editor(s). MDPI and/or the editor(s) disclaim responsibility for any injury to people or property resulting from any ideas, methods, instructions or products referred to in the content. |
© 2023 by the authors. Licensee MDPI, Basel, Switzerland. This article is an open access article distributed under the terms and conditions of the Creative Commons Attribution (CC BY) license (https://creativecommons.org/licenses/by/4.0/).