Article

The Use of Plant Growth Promoting Rhizobacteria to Reduce Greenhouse Gases in Strawberry Cultivation under Different Soil Moisture Conditions

1
Department of Horticulture, Faculty of Environmental Management and Agriculture, West Pomeranian University of Technology in Szczecin, Słowackiego 17, 71-434 Szczecin, Poland
2
Department of Bioengineering, Faculty of Environmental Management and Agriculture, West Pomeranian University of Technology in Szczecin, Słowackiego 17, 71-434 Szczecin, Poland
3
Institute of Marine and Environmental Sciences, University of Szczecin, Wąska 13, 71-415 Szczecin, Poland
4
Polish Society of Bioinformatics and Data Science BIODATA, Popiełuszki 4c, 71-214 Szczecin, Poland
5
Department of Microbiology and Rhizosphere, The National Institute of Horticultural Research, Konstytucji 3 Maja 1/3, 96-100 Skierniewice, Poland
6
Institute of Technology and Life Sciences—National Research Institute Falenty, Hrabska Avenue 3, 05-090 Raszyn, Poland
*
Author to whom correspondence should be addressed.
Agronomy 2023, 13(3), 754; https://doi.org/10.3390/agronomy13030754
Submission received: 10 February 2023 / Revised: 1 March 2023 / Accepted: 2 March 2023 / Published: 4 March 2023

Abstract

:
One of the main causes of climate change is the emission of GHGs, and one of the sources for the generation of such gasses is agriculture via plant production. Considering the foregoing, a study was conducted to assess PGPRs in strawberry cultivation which were able to limit GHG emissions. The first experimental factor was the inoculation of plant roots with the Bacillus sp. strains DLGB3, DKB26, DKB58, and DKB 84; the Pantoea sp. strains DKB63, DKB64, DKB65, and DKB68; Azotobacter sp. AJ 1.2; and Pseudomonas sp. PJ 1.1. The second experimental factor constituted the different moisture levels of the growth substrate. In the experiment, emissions of NH3, CO2, N2O, and CH4 were measured. In light of the conducted research, five strains were selected (Azotobacter sp. AJ 1.2; Pantoea sp. DKB64, DKB63, and DKB68; and Pseudomonas sp. strain PJ 1.1) that showed the greatest potential for reducing GHG emissions depending on the prevailing environmental conditions. The application of the tested bacterial strains under different moisture conditions in the substrate either reduced or did not affect GWP. This research on PGPR, which was conducted to select strains of rhizosphere bacteria that would be able to reduce GHG emissions, may form the basis for creating an inoculum and can be employed as an effective strategy for mitigating certain abiotic stresses.

1. Introduction

Climate change is increasingly affecting the environment and constitutes one of the most important problems of the last decade. It also adversely affects food production [1], as agriculture is one of the spheres of the economy whose links with the climate are particularly strong. This is due to the biological nature of the production processes employed in agriculture [2,3]. One of the main causes of global climate change is the emission of greenhouse gases (GHGs), which include nitrous oxide (N2O), methane (CH4), ammonia (NH3), and carbon dioxide (CO2), among others. The main sources of these gases include the use of nitrogen fertilizers, CH4 emissions by animals and animal excrement, and deforestation carried out in order to obtain more land for plant cultivation [4,5]. A significant share of the GHGs stemming from agriculture is generated by plant production. Soils act as sources of and sinks for GHGs [6]. About 35% of CO2, 47% of CH4, 53% of N2O, and 21% of NO of the respective total annual emissions relate to soil degassing [7].
With the increase in the global temperature, the risk of abiotic stresses adversely affecting plant production increases. Water and nutrient deficiencies or increased soil salinity can significantly reduce the size and quality of crop yields [8,9]. Water deficits are among the most important factors limiting crop productivity [10]. In recent years, droughts and related phenomena have also become significant problems for agriculture in the European continent. Strawberries are among the most popular dessert fruits in the world, and their cultivation is economically important on a global scale [11]. The garden strawberry is sensitive to drought stress because it has a shallow root system, large leaf area, and produces juicy fruit [12]. Methods and means that could mitigate the impact of stresses on plants have long been sought. The adaptation of agricultural systems to climate change has required and will continue to require cross-disciplinary action; new knowledge bases, practices, and technologies that integrate agronomic, environmental, and molecular dimensions will be required [2]. Many authors have indicated that the use of rhizosphere microorganisms can be very helpful for mitigating unfavorable environmental conditions during plant cultivation [13]. It has also been shown that microorganisms stimulate plant growth through the production of phytohormones and protect plants against pathogens [14,15,16,17]. The most commonly used plant-growth-promoting rhizobacteria include Agrobacterium, Azotobacter, Bacillus, Burkholderia, Caulobacter, Chromobacterium, Flavobacterium, Micrococcous, Pseudomonas, Cellulomonas [18,19,20,21], Pantoea, Azoarcus, Paenibacillus, and Methylobacterium [22]. When searching for rhizosphere microorganisms that can alleviate stress conditions and thus improve the size and quality of crop yields, one should also pay attention to their impact on the ecosystem. Strains that can reduce GHG emissions from crop production should be sought. One should also look for an answer to the question of how the emission of the most important GHGs is influenced by the tested strains of soil microorganisms and their interactions with the soil and the plants grown in it.
The strains used in this study were assessed as PGPR based on their properties demonstrating the potential to promote plant growth and the ability of these bacterial strains to reduce the effects of water stress on strawberries [23]. With the above in mind, we conducted research to select those rhizosphere bacteria that are both capable of stimulating plant growth and potentially reducing greenhouse gas emissions; the results of this research can form the basis for the creation of an inoculum and can be employed as an effective strategy for mitigating certain abiotic stresses that can affect crop growth and production.

2. Materials and Methods

2.1. Location of the Experiment and Plant Material and Growth Conditions Employed

A two-factor experiment with a completely randomized design and consisting of four replications was performed at the West Pomeranian University of Technology in Szczecin, Poland (53°25′ N, 14°32′ E, 25). Each replication was represented by a single plant. The experiment began on 5 October 2021, when individual plantlets of the ‘Polka’ strawberry cultivar (from J.G. Mendyk Strawberry Plant Nursery, Koronowo, Poland) were planted in plastic 19 cm diameter containers with a 3 dm3 capacity. The strawberry plantlets were cultivated in a peat substrate (Substral Osmocote, Evergreen Garden Care Poland Sp. z o.o.) mixed with perlite (in a ratio 15:1). The peat substrate (pH 6.2) was fertilized with a 2 g·dm−3 mixture of Osmocote NPK 15-09-09 and Plant Starter NPK 10-52-10. Throughout the experiment, no additional fertilizers were added to the substrate. The plants were grown in a greenhouse until 20 April 2022 under natural (day/night) conditions at 17–20 °C.

2.2. Experimental Factors

The first experimental factor was the inoculation of strawberry roots with different rhizosphere bacteria. Promotional traits (IAA production, siderophore production, phosphate solubilization, and ACCD activity), which were characteristic of PGRP, of the bacterial strains used in experiment were confirmed under the conditions of water deficit in our earlier studies. The ability of these bacterial strains to reduce the effects of water stress in strawberry plants was also investigated on the basis of chlorophyll fluorescence parameters [23]. The following variants were used: C0—control plants, which were not inoculated; CMg— soil application of a 10 mM KMgSO4 solution without bacteria (40 cm3/plant); DLGB 2—inoculation with Bacillus sp. strain DLGB 2; DLGB 3—inoculation with Bacillus sp. strain DLGB 3; DKB 26—inoculation with Bacillus sp. strain DKB 26; DKB 58—inoculation with Bacillus sp. strain DKB 58; DKB 84—inoculation with Bacillus sp. strain DKB 84; DKB 63—inoculation with Pantoea sp. strain DKB 63; DKB 64—inoculation with Pantoea sp. strain DKB 64; DKB 65—inoculation with Pantoea sp. strain DKB 65; DKB 68—inoculation with Pantoea sp. strain DKB 68; DKB 70—inoculation with Pantoea sp. strain DKB 70; A.J 1.2—inoculation with Azotobacter sp. strain A.J 1.2; and P.J 1.1—inoculation with Pseudomonas sp. strain P.J 1.1.
The inoculum was applied to the substrate in the vicinity of the root system (40 cm3/plant minimum bacterial density of 107 CFU/g) seven weeks after the plants were planted. The inocula of Bacillus sp. and Pantoea sp. came from the Department of Microbiology and Rhizosphere of the Institute of Horticulture in Skierniewice (Poland); Azotobacter sp. and Pseudomonas sp. came from the Laboratory of Experimental Environmental Research of the Institute of Marine and Environmental Sciences of the University of Szczecin.
The second experimental factor was the varied level of moisture in the substrate. Different substrate moisture levels were introduced six weeks after inoculation of the root system. The water potential was maintained at a level of −10 to −15 kPa under the control conditions (optimal substrate moisture—variant OP) and from −40 to −45 kPa under the conditions of water deficit (variant DF). The substrate moisture content was determined using contact soil tensiometers.

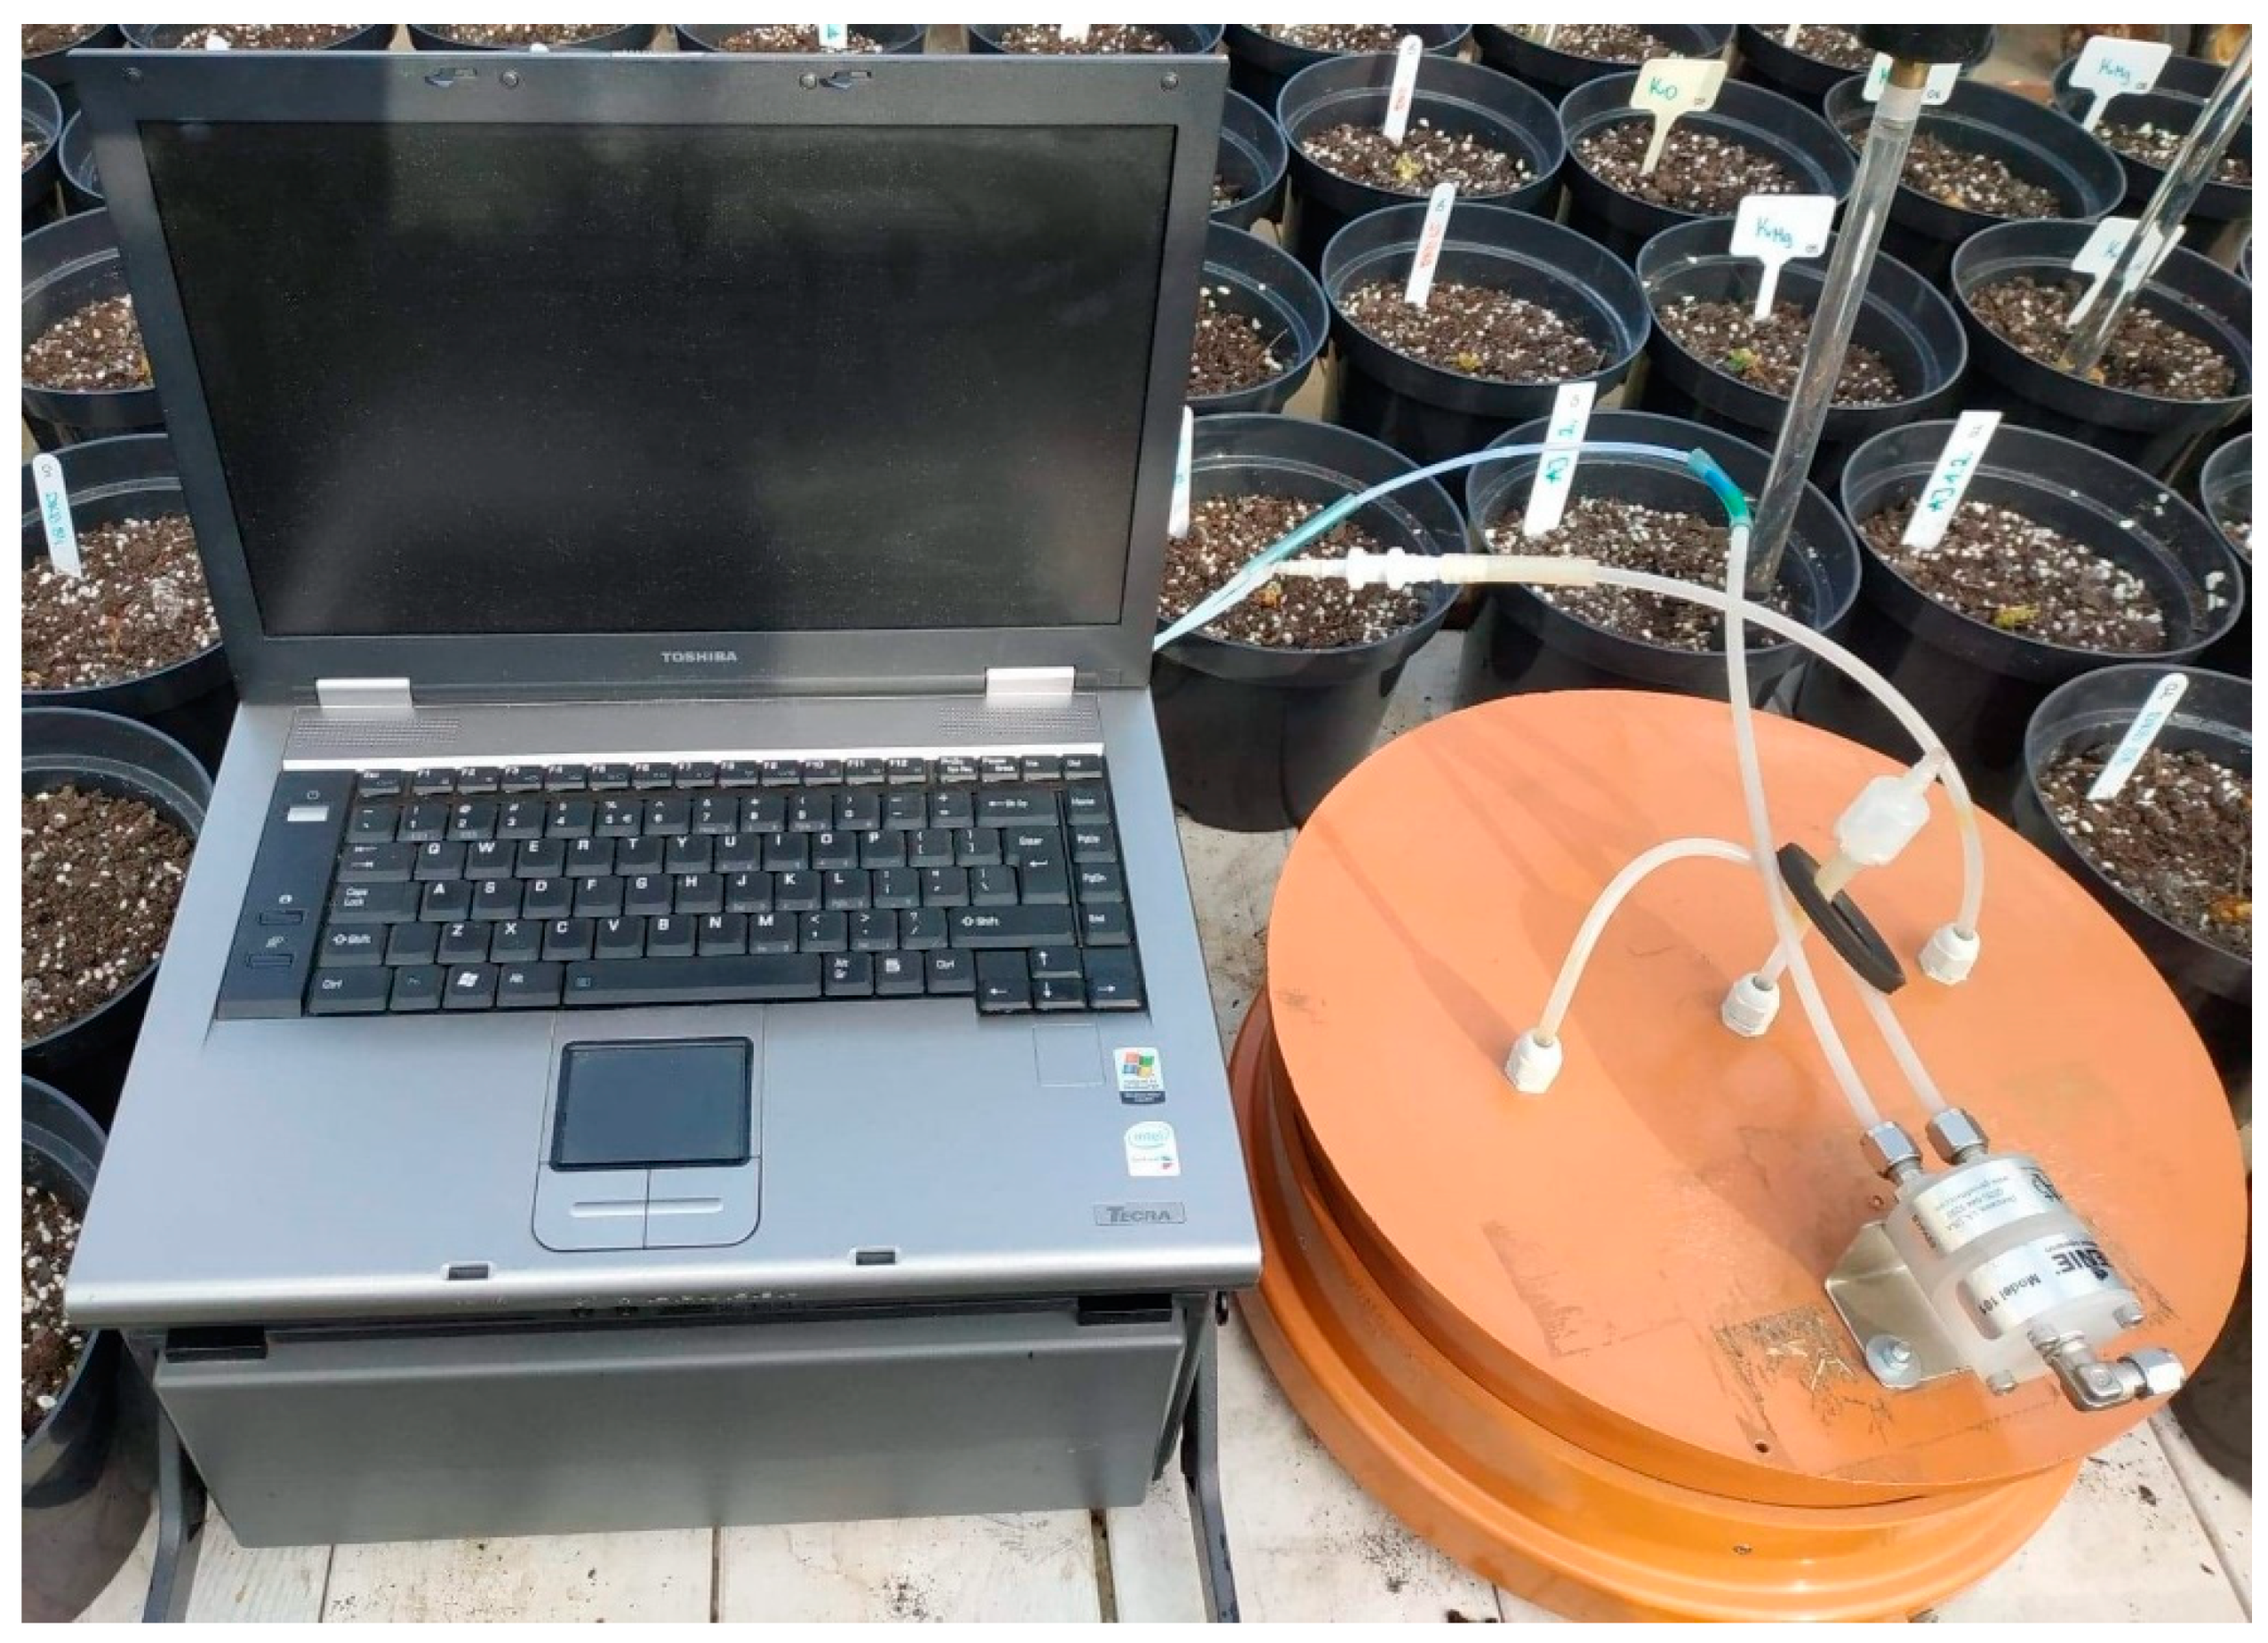
2.3. GHG Emission Measurement Methods

During the experiment, the emissions of NH3, CO2, N2O, and CH4 were measured. For this purpose, a field photoacoustic gas meter 1412 INNOVA Air Tech Instruments (Denmark) with application software (Gas Monitoring Software 7304 for Control of Photoacoustic Gas Monitors 1314 and 1412, Innova Air Tech Instruments A/S) enabling remote control was used; the meter was connected to a static chamber to measure the emission and immission of gases from the soil surface [24] (Figure 1). The concentration of gases in the chamber was recorded 10 min after placing a pot in the measurement chamber. Chamber air temperature was recorded with each set of emission measurements. GHG concentrations for NH3, N2O, and CH4 are given in mg·m−2·h−1, whereas those for CO2 are given in g·m−2·h−1 [25]. Measurements of gas emissions by the substrates with plants were conducted 26 weeks after planting the strawberry plants. Afterwards, the aboveground part of the plants was removed, and one week after the first measurement (27 weeks after planting), the second measurement was made, which concerned the emission of gases by the substrate.

2.4. Statistical Methods

The collected measurement results were statistically analyzed using the Statistica 13.1PL program. In order to detect changes between the experimental variants, an analysis of variance (ANOVA) and Tukey’s post hoc HSD test were performed. To determine whether there were statistically significant differences between the effects of each tested strain of bacteria on the emission of the tested gases, the Mann–Whitney U test was carried out. In order to determine the homogeneity of the variants, their variability, and their structures, a cluster analysis was performed using the Ward method and the square of the Euclidean distance. Cluster analysis is a type of statistical analysis that groups a set of objects such that objects in the same group (called a cluster) are more similar to each other than to objects in other groups (clusters). It is commonly used in machine learning, data mining, and other fields to identify patterns in data and make predictions or other decisions based on those patterns [26,27].
In addition, a frequency analysis was performed. It consisted of determining the percentage of statistically significant changes from all the analyses carried out in order to determine the significant strains from all the tests.
To clearly illustrate the results, the values presented in Figure 2, Figure 3, Figure 4, Figure 5, Figure 6 and Figure 7 are given as the mean value and the standard error (SE) defined as the standard deviation of the distribution of the sample mean. SE was calculated using Formula (1), where s2 denotes sample variance and n denotes sample size.
S E = s 2 n
The global warming potential (GWP) is an indicator that quantifies the CF (carbon footprint) and describes the radiation-forcing impact of one mass-based unit of a given greenhouse gas related to an equivalent unit of carbon dioxide over a 100-year period (GWP100) based on a relative scale that compares a specific GHG with an equivalent mass of CO2, whose GWP, by definition, is equal to 1 [28,29,30]. GWP was calculated using Formula (2).
G W P = H e a t   t r a p p e d   b y   t h e   g r e e n h o u s e   g a s   o v e r   t h e   t i m e   p e r i o d   b e i n g   c o n s i d e r e d H e a t   t r a p p e d   b y   t h e   s a m e   a m o u n t   o f   c a r b o n   d i o x i d e   o v e r   t h e   s a m e   t i m e   p e r i o d  

3. Results

The results of the statistical analyses are presented in Table 1 and Table 2 and Figure 2, Figure 3, Figure 4, Figure 5, Figure 6, Figure 7 and Figure 8. Table 1 provides descriptive statistics and Table 2 provides the results of the conducted ANOVA.

3.1. Emission of CO2

The average level of CO2 emission from the peat substrate including a plant under optimal moisture levels was 2096 g·m−2·h−1, while under water deficit it was 1921 g·m−2·h−1. The coefficients of variation (CV) were 9% and 10% (Table 1).The lowest CO2 emission level under drought stress (variant DF) was recorded after inoculation with Azotobacter sp. strain AJ 1.2 (1778 g·m−2·h−1) (Figure 2A). Under optimal moisture conditions (OP variant), the lowest CO2 emission level was recorded in the variant C0 (1747 g·m−2·h−1). The maximum values of CO2 emissions under water deficit were recorded in the control variant (2898 g·m−2·h−1) and after inoculation with Pantoea sp. strain DKB 65 (2619 g·m−2·h−1).
The average CO2 emission level from the peat substrate without a plant under optimal moisture levels reached 1953 g·m−2·h−1, whereas under drought it was 1885 g·m−2·h−1. The coefficients of variation (CV) were 6% and 6% (Table 1). The lowest CO2 emission level in the DF variant was recorded after inoculation with Azotobacter sp. strain AJ 1.2 (1723 g·m−2·h−1) (Figure 2B). Under optimal substrate moisture levels, the lowest emission was found in the CMg variant (1764 g·m−2·h−1). The maximum values of CO2 emissions under water deficit were recorded in the CMg variant (2210 g·m−2·h−1), whereas under optimal conditions they were observed after inoculation with Pantoea sp. strain DKB 63 (2426 g·m−2·h−1).

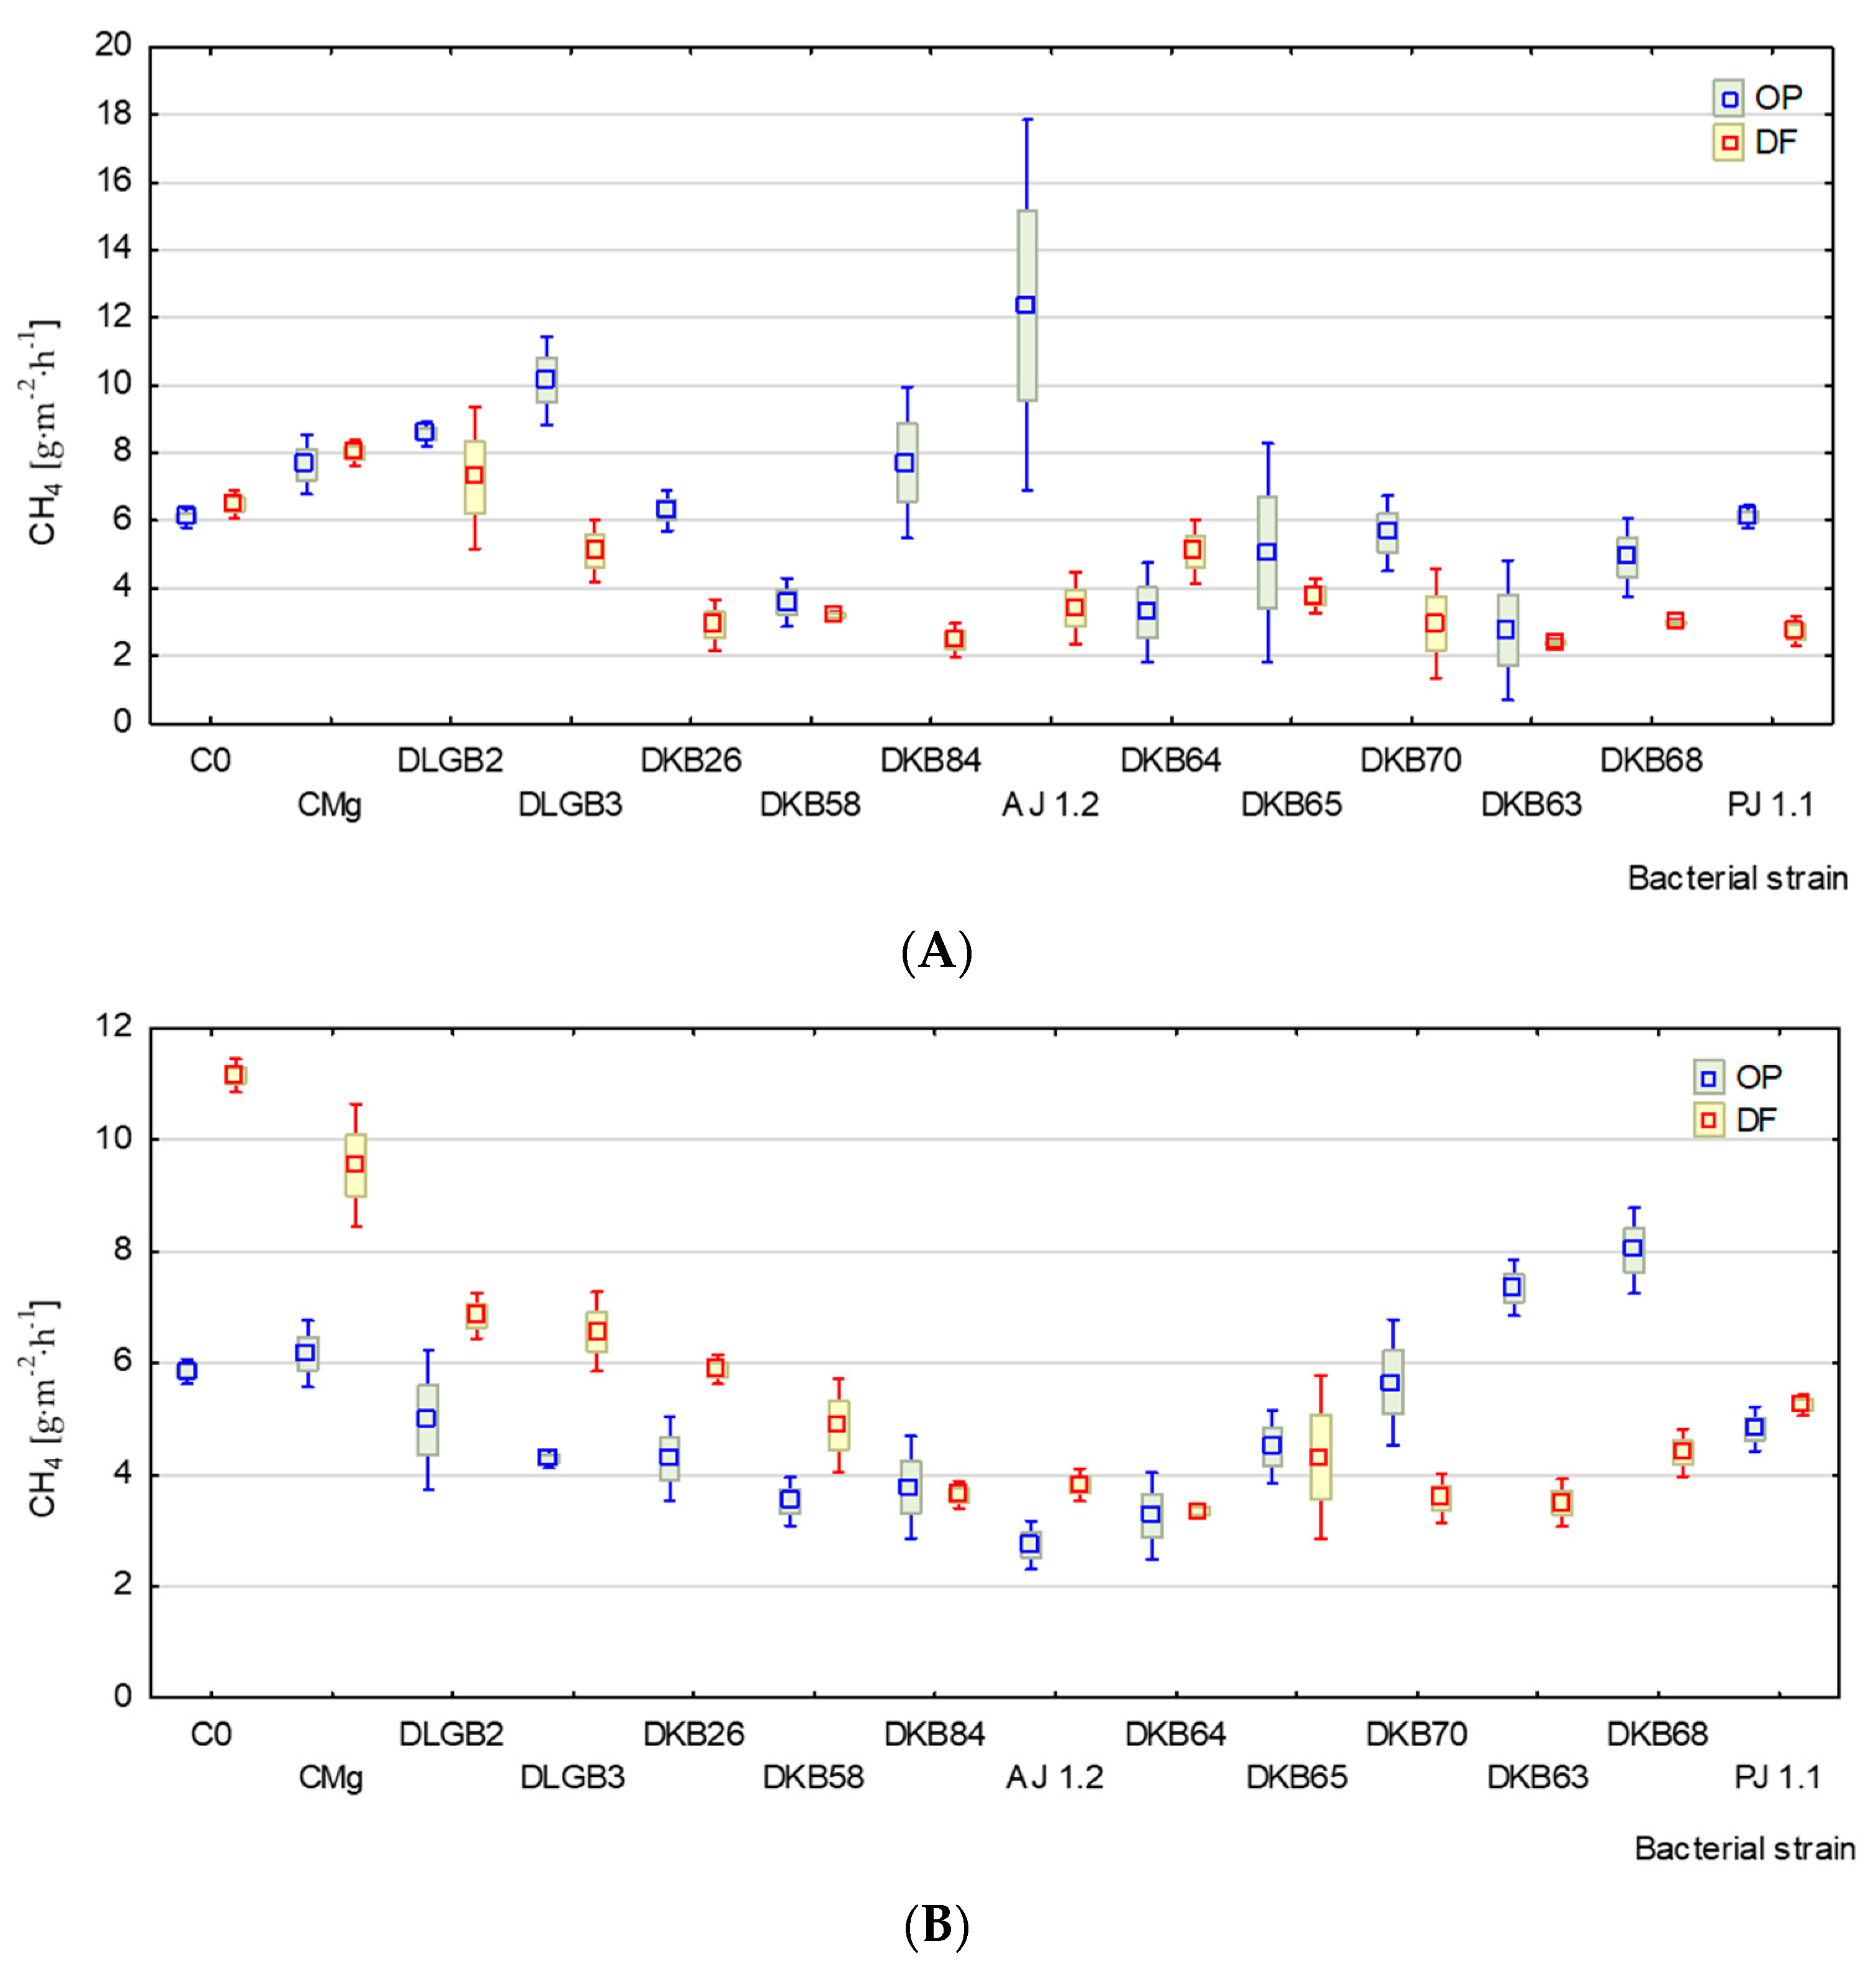
3.2. Emission of CH4

The average level of emission of CH4 from the peat substrate with a plant under optimal moisture conditions was 6.44 mg·m−2·h−1, whereas under drought stress it was 4.2 mg·m−2·h−1. The coefficients of variation (CV) were 54% and 50% (Table 1). The lowest CH4 emission in the DF variant was recorded after inoculation with Pantoea sp. strain DKB 70 (1.45 mg·m−2·h−1) (Figure 3A). Under optimal moisture levels, the lowest emission of this gas was found after inoculation with Pantoea sp. strain DKB 63 (0.80 mg·m−2·h−1). The highest CH4 emission in the DF variant was found after inoculation with Bacillus sp. strain DLGB 2 (10.64 mg·m−2·h−1), whereas in the OP variant it was observed after inoculation with Azotobacter sp. strain AJ 1.2 (19.68 mg·m−2·h−1).
The average CH4 emission level from the peat substrate without a plant in the OP variant reached 4.96 mg·m−2·h−1, whereas under water deficit this value was 5.48 mg·m−2·h−1. The coefficients of variation (CV) were 34% and 44% (Table 1). The lowest CH4 emission in the DF variant was recorded after inoculation with Pantoea sp. strain DKB65 (2.80 mg·m−2·h−1) (Figure 3B). Under optimal moisture conditions, the lowest emission of this GHG was measured from the substrate after inoculation with Azotobacter sp. strain AJ 1.2 (2.30 mg·m−2·h−1). The maximum emission of CH4 in drought conditions (DF) was recorded in variant C0 (11.53 mg·m−2·h−1), whereas under optimal substrate moisture levels it was observed after inoculation with Pantoea sp. strain DKB 68 (9.22 mg·m−2·h−1).

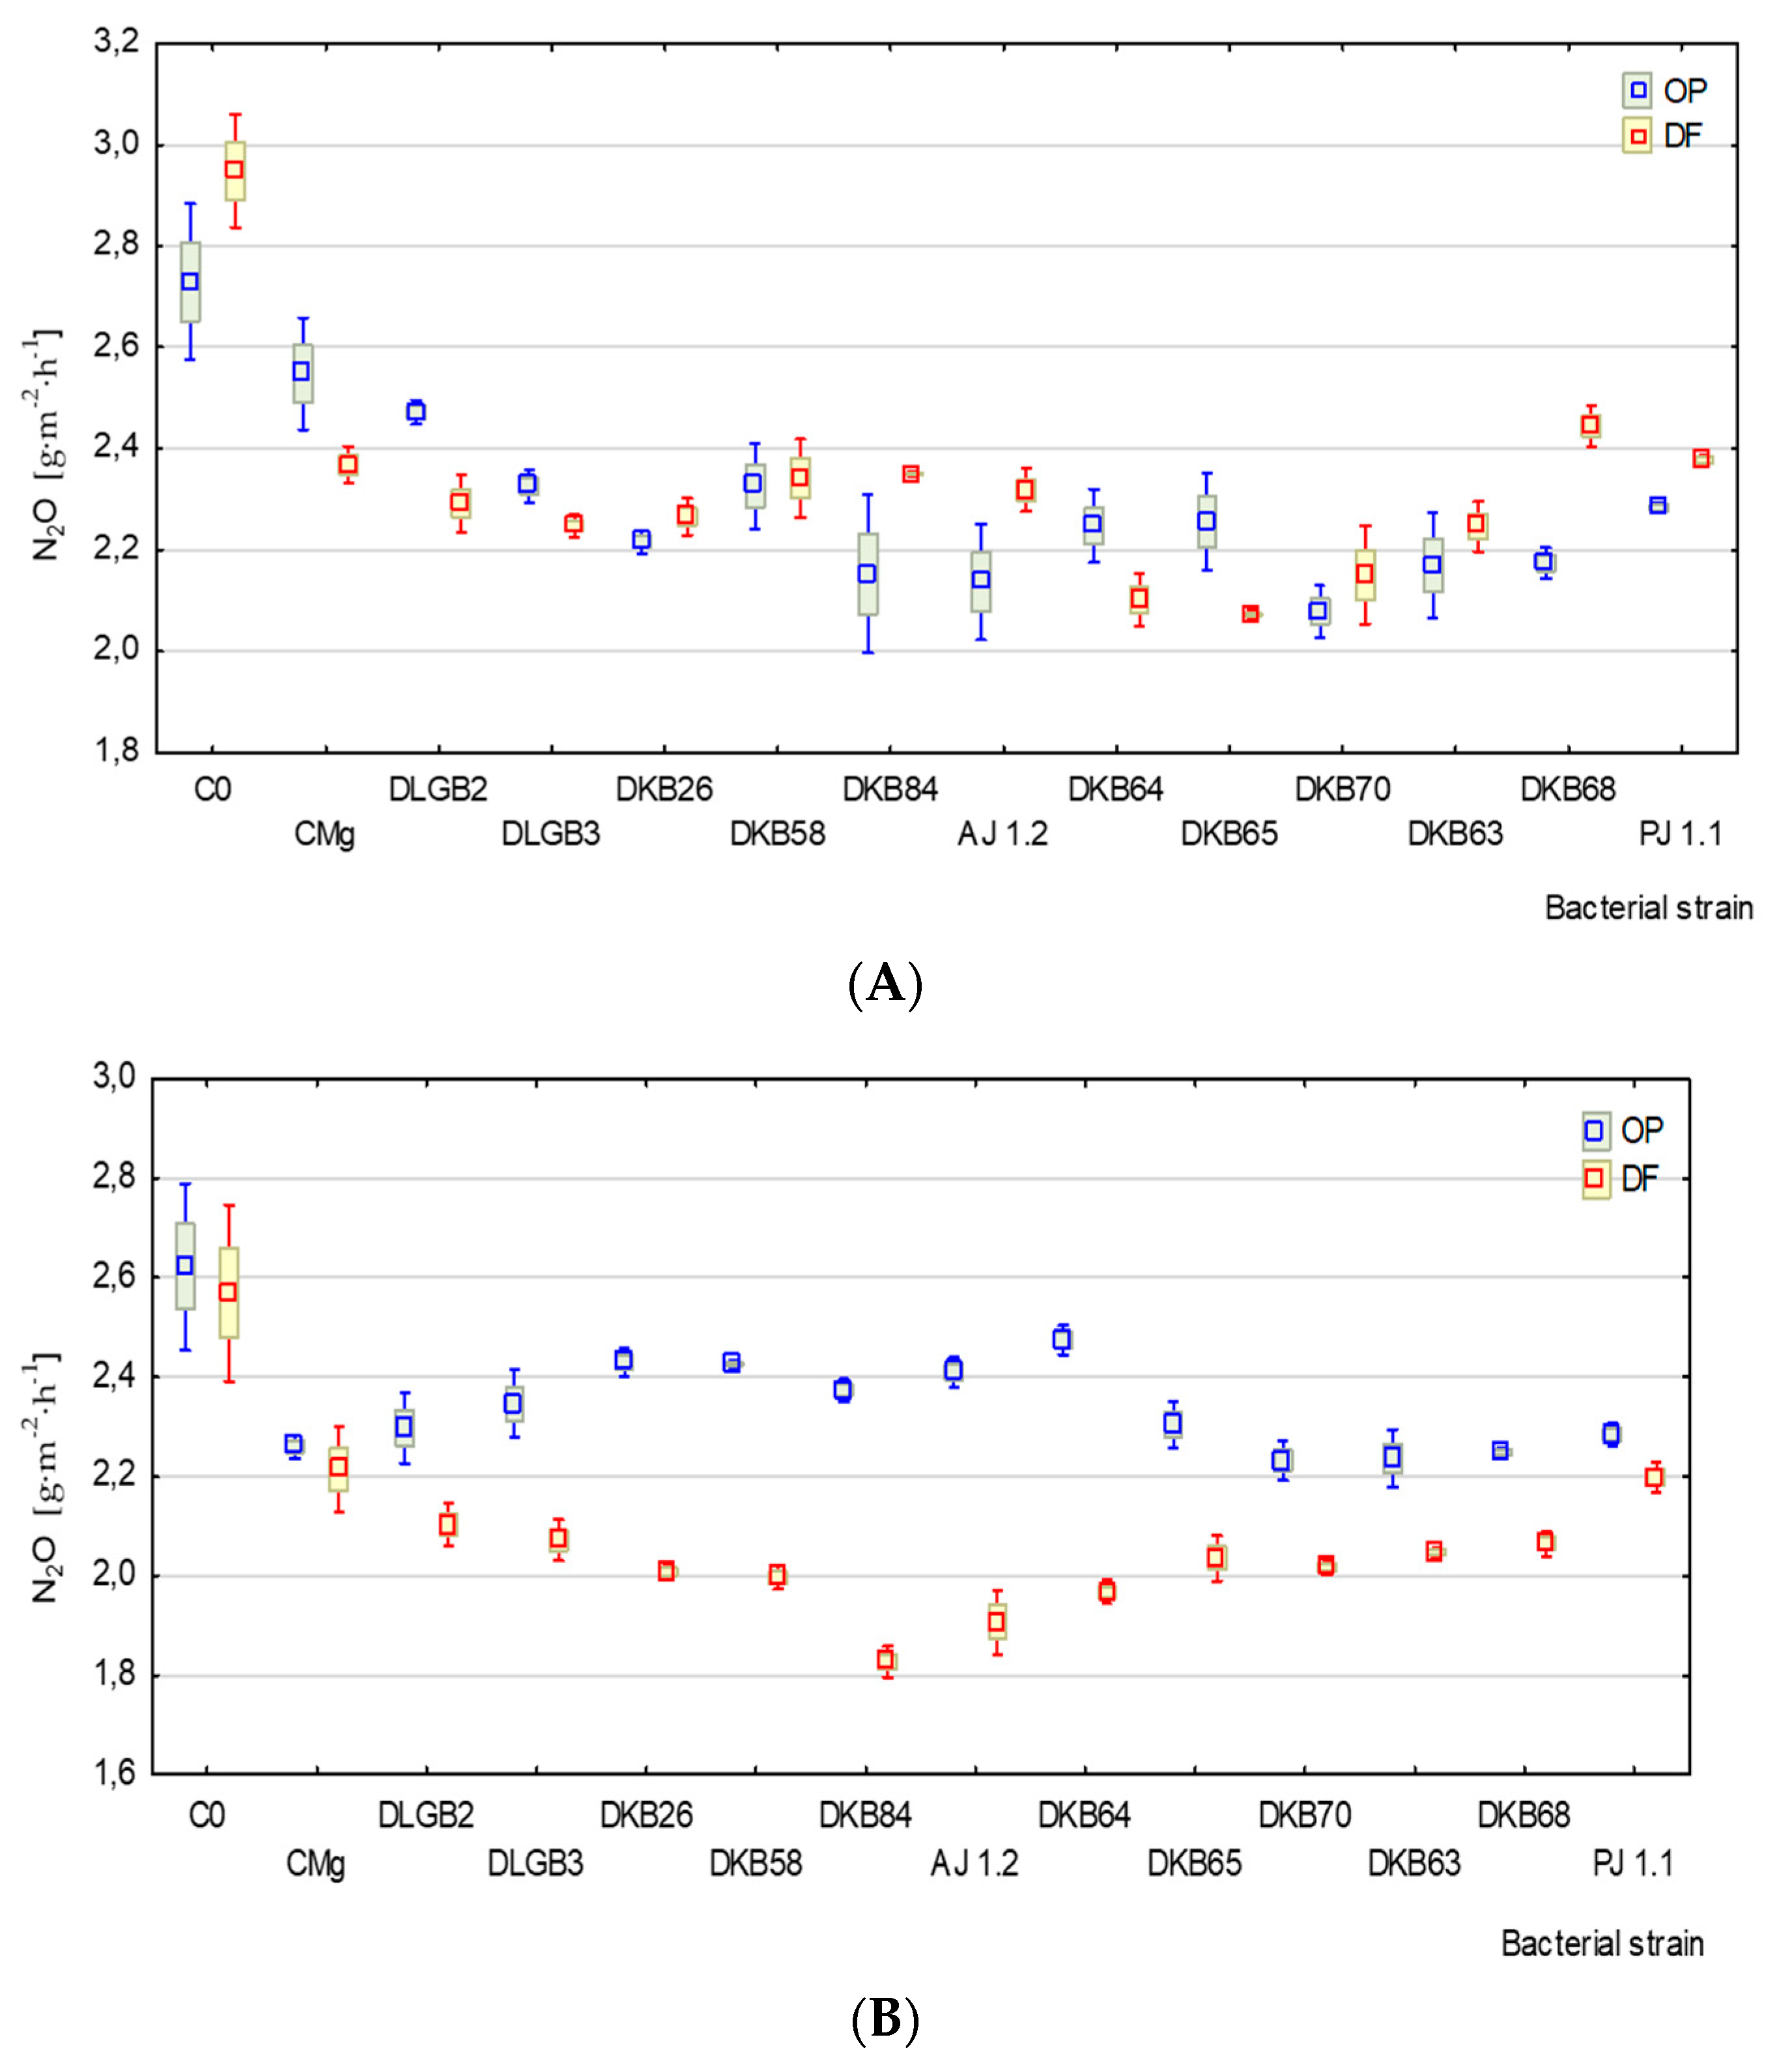
3.3. Emission of N2O

The average level of N2O emission from the peat substrate with a plant under optimal substrate moisture conditions was 2.29 mg·m−2·h−1, and under water deficit it was 2.32 mg·m−2·h−1. The coefficients of variation (CV) were 9% and 9% (Table 1). The lowest emission of this gas in the DF variant was recorded after inoculation with the Pantoea sp. strain DKB 70 (2.01 mg·m−2·h−1) (Figure 4A). In the OP variant, the lowest N2O emission was found in the substrate after inoculation with Bacillus sp. strain DKB 84 (1.94 mg·m−2·h−1). The highest emission levels of this gas were recorded in variant C0: 3.11 mg·m−2·h−1 (DF) and 2.97 mg·m−2·h−1 (OP).
The average N2O emission level from the peat substrate without a plant under optimal moisture and water deficit was, respectively, 2.35 and 2.07 mg·m−2·h−1. The coefficients of variation (CV) were 5% and 9% (Table 1). In the DF variant, the lowest emission of this gas was from the substrate after inoculation with Bacillus sp. strain DKB 84 (1.78 mg·m−2·h−1), whereas in the OP variant after inoculation with Pantoea sp. strain DKB 63 (2.14 mg·m−2·h−1) (Figure 4B). The maximum N2O emission values of 2.83 mg·m−2·h−1 (DF) and 2.85 mg·m−2·h−1 (OP) were found in the control variant.

3.4. Emission of NH3
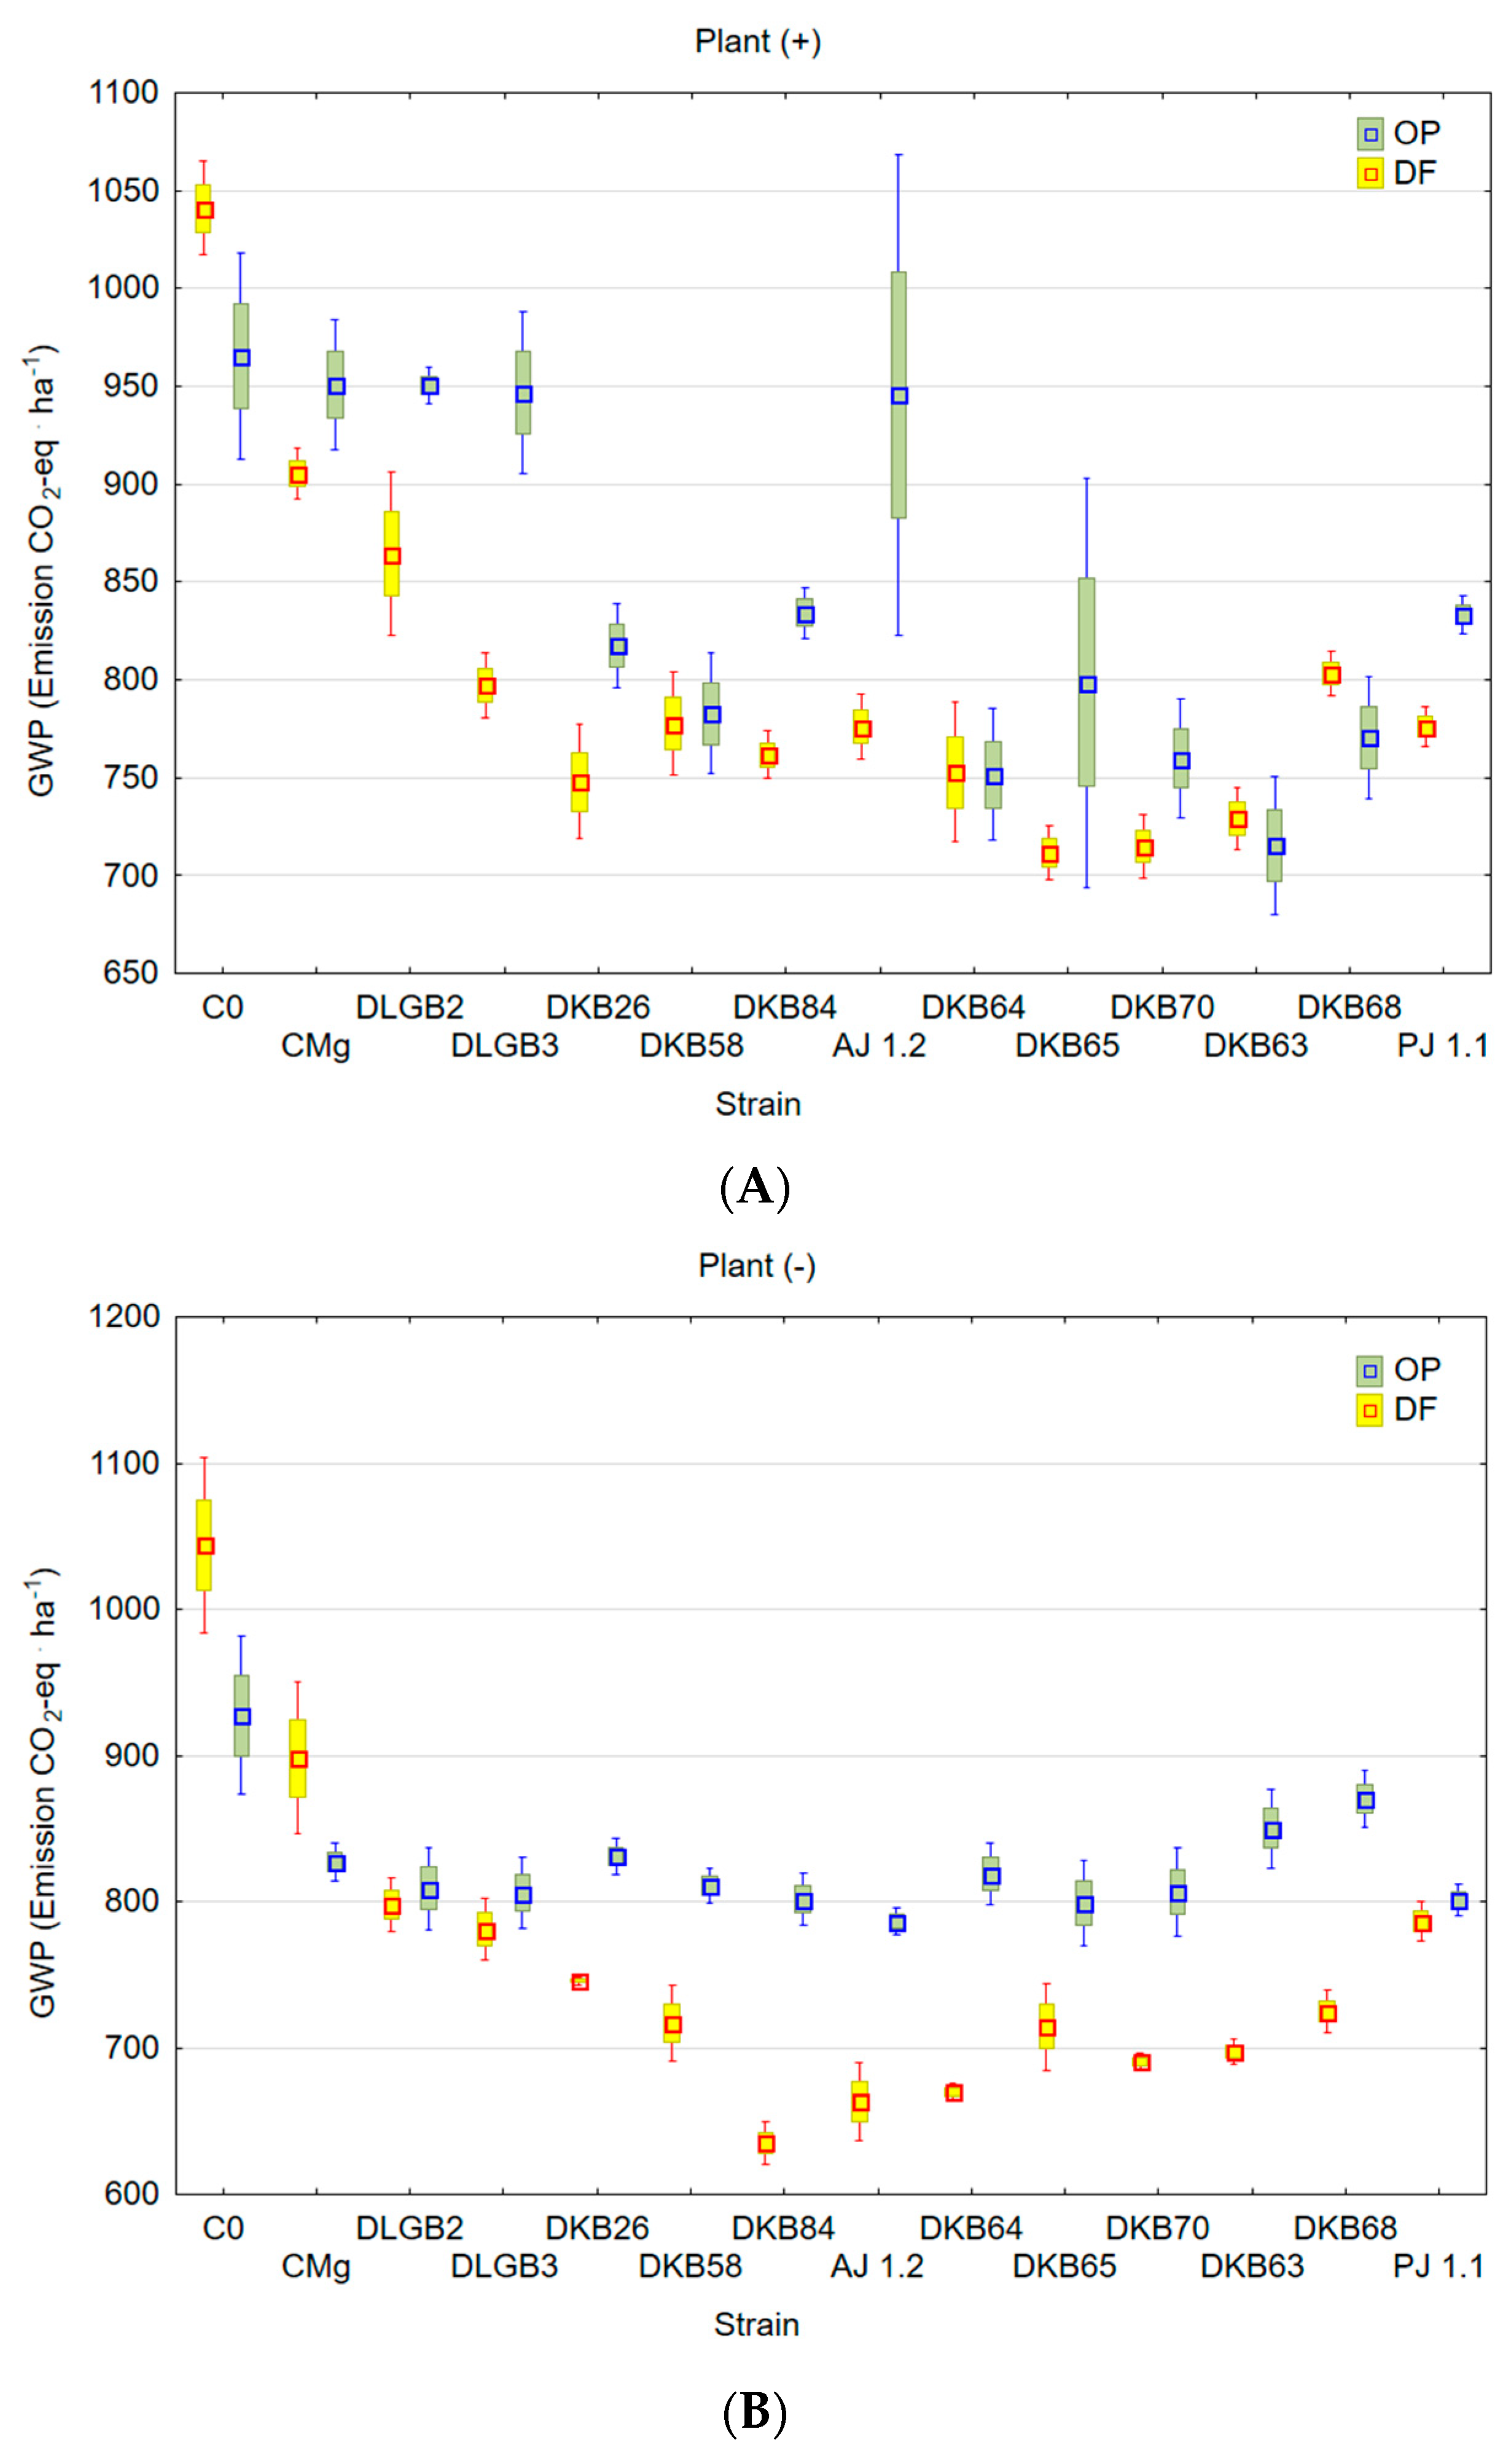
The average level of NH3 emission from the peat substrate with a plant in the OP variant was 0.54 mg·m−2·h−1, whereas in the DF variant it was 0.56 mg·m−2·h−1. The coefficients of variation (CV) reached 20% and 13% (Table 1). Under the conditions of water deficit in the substrate, the lowest emission of NH3 was recorded after inoculation with Pantoea sp. strain DKB 64 (0.43 mg·m−2·h−1), whereas in the OP variant it was recorded after inoculation with Azotobacter sp. strain AJ 1.2 (0.24 mg·m−2·h−1) (Figure 5A). The highest emission of this gas was recorded in variant C0—0.85 mg·m−2·h−1 (DF) and 0.85 mg·m−2·h−1 (OP).
The average NH3 emission level from the peat substrate without a plant under optimal moisture conditions was 0.56 mg·m−2·h−1, whereas in drought conditions it was 0.50 mg·m−2·h−1. The coefficients of variation (CV) reached 15% and 15% (Table 1). The lowest emission of NH3 under the conditions of water deficit in the substrate was recorded in variant C0 (0.37 mg·m−2·h−1), whereas under optimal conditions it was obtained after inoculation with Pantoea sp. strain DKB 63 (0.37 mg·m−2·h−1) (Figure 5B). The highest emission levels of this gas were recorded in variant C0: 0.77 mg·m−2·h−1 (DF) and 0.76 mg·m−2·h−1 (OP).

3.5. GWP

The average GWP from the peat substrate with a plant under optimal substrate moisture conditions was 1131 emission CO2 − eq·ha−1, and under water deficit it was 1073 emission CO2 − eq·ha−1. The coefficients of variation (CV) were 28% and 24% (Table 1). The highest GWP was recorded in variant C0 and after inoculation with Azotobacter sp. strain AJ 1.2 (OP) and Bacillus sp. strain DLGB2 (DF) (Figure 6A). Only under optimal conditions did Bacillus sp. strain DLGB3 and Bacillus sp. strain DLGB2 not cause a statistically significant increase in GWP.
The average GWP emission levels from the peat substrate without a plant under optimal moisture levels and water deficit were 997 and 1132 emission CO2 − eq·ha−1, respectively. The coefficients of variation (CV) were 15% and 19% (Table 1). In the DF variant, the lowest GWP level was from the substrate after inoculation with Pantoea sp. strain DKB84, whereas in the OP variant it was observed after inoculation with Bacillus sp. strain DLGB3 (Figure 6B). The maximum GWP values were found in the control variants.

3.6. Recommendations

The statistical analyses enabled the determination of the frequency at which the tested strains showed statistically significant changes compared to the control conditions (C0 and CMg). The frequency analysis results showed that the strains Azotobacter sp. AJ 1.2, Pantoea sp. DKB64, P. sp. DKB63, P. sp. DKB68, and Pseudomonas sp. PJ 1.1 were the ones that showed significant differences most frequently (Figure 7).

3.7. Cluster Analysis

In order to facilitate the interpretation of the cluster analysis, the results were presented in the form of an agglomeration tree. The analysis showed the isolation of two main agglomerations (clusters) in which the following conditions were present: in cluster 1, there were conditions of water deficit without a plant; in the first subgroup of cluster 2, 2a, there were optimal conditions and a plant was present; and in the second subgroup of cluster 2, 2b, there were optimal conditions without a plant and conditions of water deficit in the presence of a plant (Figure 8).

4. Discussion

An important source of CO2 in plant production is the emission of gases from the soil as a result of the mineralization of dead organic matter and humus compounds [31,32]. The activity of microorganisms involved in this process depends on the soil moisture content. In many studies, a higher emission rate of this gas was attributed to increased soil aeration in the presence of an adequate amount of water [33]. According to Norberg et al. [34], CO2 emissions from drained peat soils occur when the aerated top layer of peat decomposes, whereas CH4, according Nie et al. [35], can be produced in the deeper, water-filled layer by methanogens and can potentially be oxidized in the aerated top layer by bacteria oxidizing methane. In our study, in the substrate with strawberry plants under water deficit, the inoculation with Bacillus sp. strain DKB26 and B. sp. strain DKB84 reduced CO2 emissions by 17% compared to the control. In the substrate with the optimal moisture content, the use of Pantoea sp. DKB70, P. sp. DKB65, and P. sp. DKB68 as well as Bacillus sp. DLGB3 and B. sp. DLGB2 increased CO2 emissions compared to the control. The application of Pseudomonas sp. strain PJ 1.1, Azotobacter sp. strain AJ 1.2, and Pantoea sp. strain DKB63 had a varied impact on CO2 emission. Under drought, it caused a reduction in CO2 emission, whereas under optimal substrate moisture it precipitated an increase. In the case of a substrate without plant, under drought conditions, CO2 emissions were 9.2% lower compared to the control after the application of Pseudomonas sp. strain PJ 1.1. However, as in the case of the substrate with a plant, this strain had no effect on the CO2 concentration under optimal moisture.
The rational use of water in agricultural production, with a reduced amount and frequency of irrigation, reduces the emission of CH4. Changes in CH4 emissions upon shifts in water regimes have been explained through changes in redox potential and microbial activity within the soil matrix [33]. In our study, in the substrate with strawberry plants under drought conditions, we found no effect of inoculation on CH4 emissions. In the case of optimal substrate moisture, CH4 emission increased by 103% after inoculation with Azotobacter sp. strain AJ 1.2 compared to the control combination. In the case of the substrate without a plant under drought conditions, each of the strains used reduced the level of CH4 emission from the substrate in relation to the control combination. The emission of this gas was reduced to the greatest extent by Pantoea sp. strain DKB64 (by 70.0%) and to the smallest extent by Bacillus sp. strain DLGB2 (by 38.6%). Jhala et al. [36] showed that Bacillus aerius AAU M8, Bacillus amyloliquefaciens AAU M14, Bacillus subtilis AAU M17, Bacillus megaterium AAU M29, and Paenibacillus illinoisensis AAU M17 present in the rhizosphere of rice reduced CH4 emissions. The cited authors also proved that in addition to reducing CH4 emissions, these microorganisms also have the ability to positively stimulate plant growth through various mechanisms, such as the production of phytohormones.
It is estimated that approx. 69% of anthropogenic N2O emissions originate from agricultural soils [37,38,39,40]. N2O can be produced in the soil during the first stage of nitrification, i.e., the oxidation of NH3 to nitrites (NO2) and heterotrophic denitrification under anaerobic conditions, which in turn are affected by different soil moisture content, texture and temperature [34,41,42,43,44,45,46,47]. The emission of harmful N2O can be reduced by microorganisms capable of denitrification with N2O reductase. Hence, these microorganisms are currently of particular interest [48,49]. It is assumed that the impact of climate change on the natural nitrogen cycle and N2O emissions is particularly important in arid areas [50], as these ecosystems are very sensitive due to deficiencies of water and nitrogen in the soil [51,52]. In our study, in the substrates with strawberry plants, inoculation with each of the tested strains of bacteria reduced N2O emissions; we found this relationship both under conditions of water deficit and optimal substrate moisture. Under drought conditions, the emission of this gas decreased to 70.2% (Pantoea sp. strain DKB65). Under optimal moisture conditions, the level of N2O emission was reduced to the greatest extent by Pantoea sp. strain DKB70 (by 23.8%). In the case of the substrates without plants, as in the case of the substrates with plants, regardless of the substrate moisture content, the application of each of the tested strains reduced N2O emissions. Under drought conditions, the greatest reduction in the emission of this gas was found after the application of Bacillus sp. strain DKB84 (29.0%) under conditions of optimal substrate moisture after the application of Pantoea sp. DKB70 (14.8%).
NH3 has no effect on climate warming, but it significantly contributes to soil acidification and the eutrophication of ecosystems [3]. In our study, in the case of the substrates with plants, we showed that, under water deficit, inoculation with Bacillus sp. strain DLGB2 and B. sp. DLGB3; Pantoea sp. DKB64, P. sp. DKB63, P. sp. DKB70, and P. sp. DKB68; and Pseudomonas sp. strain PJ 1.1 reduced NH3 emissions. In the case of optimal substrate moisture, we found such a relationship after using each of the different strains of bacteria. In the case of substrates without plants, under drought conditions, we obtained NH3 emissions that were 25.7% lower than those of the control after the application of Pantoea sp. strain DKB64. In the case of an optimally wetted substrate, similar decreases were observed after applying Pantoea sp. strain DKB63, P. sp. DKB68, P. sp. DKB70, and P. sp. DKB65; Bacillus sp. DKB26, B. sp. DLGB3, and B. sp. DLGB2; and Pseudomonas sp. strain PJ 1.1.
GWP is an important measure of how much energy the emissions of one ton of a specific GHG will absorb, and it includes different types of GHGs (CH4, N2O, NH3 etc.) [53]. Since each GHG has its own radiative potential [54], the calculation of net global warming potential (GWP) in a crop production system must include all three gases, namely, CO2, CH4, and N2O [55]. In the substrates with plants, as in substrates without plants, under water deficit, the application of the tested strains of bacteria reduced the GWP. Under optimal substrate moisture levels, the GWP after inoculation with PGPR was lower or similar to the GWP produced by the control. The use of PGPR, similar to organic agriculture, increases the biodiversity of the soil environment. According to Clark [56], organic agriculture increases the performance per unit area with regard to GHG emissions, but such a relationship is not so unfavorable when compared per unit product.
The analysis of the frequency of statistically significant changes identified five strains (Azotobacter sp. AJ 1.2, Pantoea sp. DKB64, P. sp. DKB63, P. sp. DKB68, and Pseudomonas sp. PJ 1.1) that were responsible for 65% of the variability between drought conditions and optimum substrate moisture in terms of GHG emissions. In light of the conducted research, these strains, of all the tested strains, show the greatest potential for reducing GHG emissions depending on the prevailing environmental conditions.
The cluster analysis enabled the illustration of the extent of the differences between the test conditions, while accounting for the variability of the emissions of the tested gases. Using the Sneath criterion, three clusters were distinguished. The first cluster consisted of drought conditions without a plant (S); the second consisted of optimal conditions and the presence of plant; and the third consisted of optimal conditions without a plant and drought with a plant. Each isolated cluster entails a specific level of variability in terms of gas emissions. Thus, the complete separateness of the first cluster was observed. First, this was mainly due to the following strains: Azotobacter sp. strain AJ 1.2 (NH3), Pseudomonas sp. strain PJ 1.1 (CO2), Pantoea sp. strain DKB 64, and Azotobacter sp. strain AJ 1.2 (N2O), and Pantoea sp. strain DKB 64 (CH4). The other clusters showed less variability, but by reducing NH3 emissions and increasing CO2 and CH4 emissions (via Azotobacter sp. strain AJ 1.2 and Pseudomonas sp. strain PJ 1.1), optimal moisture with the presence of a plant created a separate cluster. It should be noted that the last cluster showed a strong similarity with respect to the variability of gas emissions in the third cluster. In particular, the strains responsible for this were: Pantoea sp. strain DKB 63, Pantoea sp. strain DKB 65 (NH3), and Pantoea sp. strain DKB 70 (N2O).

5. Conclusions

Understanding the interactions between microorganisms, soil, plant and atmosphere is extremely important and offers opportunities to make use of their to develop strategies for mitigating the ongoing climate change, for improving the efficiency of agricultural and horticultural production, reduce its sensitivity to environmental stress factors and reduce GHG emissions. In light of the conducted research, five strains that showed the greatest potential for reducing GHG emissions depending on the prevailing environmental conditions were selected from among all the tested PGPR strains (Azotobacter sp. AJ 1.2, Pantoea sp. DKB64, P. sp. DKB63, P. sp. DKB68, and Pseudomonas sp. strain PJ 1.1). Importantly, the application of the tested bacterial strains under different moisture conditions in the substrate either reduced or did not affect GWP. To the best of our knowledge, there are no reports of this type of experiment in the literature. With the above in mind, the research we have conducted on PGPR, i.e., the selection of strains of rhizosphere bacteria capable of reducing greenhouse gas emissions, could form the basis for the creation of an inoculum and can be employed as an effective strategy for mitigating certain abiotic stresses. The conducted research falls within the concept of climate smart agriculture (CSA) that is developed to render agriculture more resilient to climate change, whose pillars are a sustainable increase in productivity, adaptation to changes, and the mitigation of such changes’ effects.

Author Contributions

Conceptualization, D.P., G.M. and M.M.; methodology, D.P., G.M., M.M., A.K. (Anna Kisiel), L.S.-P., T.M. and A.K. (Agnieszka Kozioł); validation, D.P., G.M., M.M., A.K. (Anna Kisiel) and T.M.; formal analysis, D.P., G.M., M.M., A.K. (Anna Kisiel) and T.M.; investigation, D.P., G.M., M.M., A.K. (Anna Kisiel) and A.K. (Agnieszka Kozioł); data curation, D.P., G.M., T.M., M.M., A.K. (Anna Kisiel), L.S.-P. and A.K. (Agnieszka Kozioł); writing—original draft preparation, D.P., G.M., T.M., M.M., A.K. (Anna Kisiel), L.S.-P. and A.K. (Agnieszka Kozioł); writing—review and editing, D.P., G.M., M.M., T.M., A.K. (Anna Kisiel), L.S.-P., A.K. (Agnieszka Kozioł) and A.B.; visualization, D.P. and T.M.; supervision, G.M. All authors have read and agreed to the published version of the manuscript.

Funding

This research received no external funding.

Data Availability Statement

Data stored on the PTBD BIODATA server and in the public repository: https://github.com/PTBDBIODATA/Databases/blob/main/emission.csv (accessed on 10 January 2023).

Conflicts of Interest

The authors declare no conflict of interest.

References

  1. Intergovernmental Panel on Climate Change (IPCC, 2019). Climate Change and Land. An IPCC Special Report on Climate Change, Desertification, Land Degradation, Sustainable Land Management, Food Security, and Greenhouse Gas Fluxes in Terrestrial Ecosystems; Shukla, P.R., Skea, J., Calvo Buendia, E., Masson-Delmotte, V., Pörtner, H.-O., Roberts, D.C., Zhai, P., Slade, R., Connors, S., van Diemen, R., et al., Eds.; Cambridge University Press: Cambridge, UK; New York, NY, USA, 2019. [Google Scholar] [CrossRef]
  2. Liu, K.; Harrison, M.T.; Yan, H.; Liu, D.L.; Meinke, H.; Hoogenboom, G.; Wang, B.; Peng, B.; Guan, K.; Jaegermeyr, J.; et al. Silver lining to a climate crisis in multiple prospects for alleviating crop waterlogging under future climates. Nat. Commun. 2023, 14, 765. [Google Scholar] [CrossRef]
  3. Witkowska-Dąbrowska, M. Changes in the volume of air emissions from gases and selected pollutants originating from agricultural production in Poland and in the EU—Analyses using sustainable development indicators (in Polish). Probl. World Agric. 2018, 18, 303–314. [Google Scholar] [CrossRef] [Green Version]
  4. Richards, M.B.; Wollenberg, E.; van Vuuren, D. National contributions to climate change mitigation from agriculture: Allocating a global target. Clim. Policy 2018, 18, 1271–1285. [Google Scholar] [CrossRef] [Green Version]
  5. Loboguerrero, A.M.; Campbell, B.M.; Cooper, P.J.M.; Hansen, J.W.; Rosenstock, T.; Wollenberg, E. Food and earth systems: Priorities for climate change adaptation and mitigation for agriculture and food systems. Sustainability 2019, 11, 1372. [Google Scholar] [CrossRef] [Green Version]
  6. Oertel, C.; Matschullat, J.; Zurba, K.; Zimmermann, F.; Erasmi, S. Greenhouse gas emissions from soils—A review. Chem. Erde 2016, 76, 327–352. [Google Scholar] [CrossRef] [Green Version]
  7. Intergovernmental Panel on Climate Change (IPCC, 2007). Climate Change 2007: The Physical Science Basis. In Contribution of Working Group I to the Fifth Assessment Report of the Intergovernmental Panel on Climate Change; Solomon, S., Qin, D., Manning, M., Chen, Z., Marquis, M., Averyt, K.B., Tignor, M., Miller, H.L., Eds.; Cambridge University Press: Cambridge, UK; New York, NY, USA, 2007; ISBN 978-0-521-88009-1. [Google Scholar]
  8. Ali, S.; Xie, L. Plant growth promoting and stress mitigating abilities of soil born microorganisms. Recent Pat. Food Nutr. Agric. 2020, 11, 96–104. [Google Scholar] [CrossRef]
  9. Dawson, T.P.; Perryman, A.H.; Osborne, T.M. Modelling impacts of climate change on global food security. Clim. Chang. 2016, 134, 429–440. [Google Scholar] [CrossRef]
  10. Begum, N.; Ahanger, M.A.; Su, Y.; Lei, Y.; Mustafa, N.S.A.; Ahmad, P.; Zhang, L. Improved drought tolerance by AMF inoculation in maize (Zea mays) involves physiological and biochemical implications. Plants 2019, 8, 579. [Google Scholar] [CrossRef] [Green Version]
  11. Bieniasz, M.; Konieczny, A.; Błaszczyk, J.; Nawrocki, J.; Kopeć, M.; Mierzwa-Hersztek, M.; Gondek, K.; Zaleski, T.; Knaga, J.; Pniak, M. Titanium organic complex improves pollination and fruit development of remontant strawberry cultivars under high-temperature conditions. Agriculture 2022, 12, 1795. [Google Scholar] [CrossRef]
  12. Zahedi, S.M.; Hosseini, M.S.; Fahadi Hoveizeh, N.; Kadkhodaei, S.; Vaculík, M. Physiological and biochemical responses of commercial strawberry cultivars under optimal and drought stress conditions. Plants 2023, 12, 496. [Google Scholar] [CrossRef]
  13. Mosa, W.F.A.E.G.; Paszt, L.S.; Frąc, M.; Trzciński, P.; Treder, W.; Klamkowski, K. The role of biofertilizers in improving vegetative growth, yield and fruit quality of apple. Hort. Sci. 2018, 45, 173–180. [Google Scholar] [CrossRef] [Green Version]
  14. Goel, R.; Suyal, D.C.; Kumar, V.; Jain, L.; Soni, R. Stress-tolerant beneficial microbes for sustainable agricultural production. In Microorganisms for Green Revolution. Microorganisms for Sustainability; Panpatte, D., Jhala, Y., Shelat, H., Vyas, R., Eds.; Springer: Singapore, 2018; Volume 7, pp. 141–159. [Google Scholar] [CrossRef]
  15. Lu, T.; Ke, M.J.; Peijnenburg, W.J.G.M.; Zhu, Y.C.; Zhang, M.; Sun, L.W.; Fu, Z.W.; Qian, H.F. Investigation of rhizospheric microbial communities in wheat, barley, and two rice varieties at the seedling stage. J. Agric. Food Chem. 2018, 66, 2645–2653. [Google Scholar] [CrossRef]
  16. Trzciński, P.; Frąc, M.; Lisek, A.; Przybył, M.; Frąc, M.; Sas-Paszt, L. Growth promotion of raspberry and strawberry plants by bacterial inoculants. Acta Sci. Pol. Hortorum Cultus 2021, 20, 71–82. [Google Scholar] [CrossRef]
  17. Drobek, M.; Cybulska, J.; Gałązka, A.; Feledyn-Szewczyk, B.; Marzec-Grządziel, A.; Sas-Paszt, L.; Gryta, A.; Trzciński, P.; Zdunek, A.; Frąc, M. The use of interactions between microorganisms in strawberry cultivation (Fragaria × ananassa Duch.). Front. Plant Sci. 2021, 12, 780099. [Google Scholar] [CrossRef]
  18. Disi, J.O.; Mohammad, H.K.; Lawrence, K.; Kloepper, J.; Fadamiro, H. A soil bacterium can shape belowground interactions between maize, herbivores and entomopathogenic nematodes. Plant Soil 2019, 437, 83–92. [Google Scholar] [CrossRef]
  19. Hassan, M.K.; McInroy, J.A.; Jones, J.; Shantharaj, D.; Liles, M.R.; Kloepper, J.W. Pectin-rich amendment enhances soybean growth promotion and nodulation mediated by Bacillus velezensis strains. Plants 2019, 8, 120. [Google Scholar] [CrossRef] [Green Version]
  20. Duy, M.; Hoi, N.; Ve, N.; Thuc, L.; Trang, N. Influence of Cellulomonas flavigena, Azospirillum sp. and Psudomonas sp. on rice growth and yield grown in submerged soil amended in rice straw. In Recent Trends in PGPR Research for Sustainable Crop Productivity; Sayyed, R.Z., Reddy, M.S., Al-Turki, A.I., Eds.; Scientific Publishers: Jodhpur, India, 2016; pp. 238–242. [Google Scholar]
  21. Hossain, M.; Ran, C.; Liu, K.; Ryu, C.-M.; Rasmussen-Ivey, C.; Williams, M.; Hassan, M.; Choi, S.-K.; Jeong, H.; Newman, M.; et al. Deciphering the conserved genetic loci implicated in plant disease control through comparative genomics of Bacillus amyloliquefaciens subsp. plantarum. Front. Plant Sci. 2015, 6, 631. [Google Scholar] [CrossRef] [Green Version]
  22. Chauhan, H.; Bagyaraj, D.; Selvakumar, G.; Sundaram, S. Novel plant growth promoting rhizobacteria—Prospects and potential. Appl. Soil Ecol. 2015, 95, 38–53. [Google Scholar] [CrossRef]
  23. Paliwoda, D.; Mikiciuk, G.; Mikiciuk, M.; Kisiel, A.; Sas-Paszt, L.; Miller, T. Effects of rhizosphere bacteria on strawberry plants (Fragaria × ananassa Duch.) under water deficit. Int. J. Mol. Sci. 2022, 23, 10449. [Google Scholar] [CrossRef]
  24. Burczyk, P.; Marciniak, A.M. Static Chamber for Measuring the Emission and Immission of Gases from the Soil Surface. Institute of Technology and Life Sciences—National Research Institute, Falenty (PL). Patent 224053, G01N 1/22 (2006.01), 8 December 2011. [Google Scholar]
  25. Burczyk, P.; Gamrat, R.; Gałczyńska, M. The use of the photoacoustic field gas monitor for measurement of the concentration of gases in measurements of dinitrogen oxide emission from grassland’s soils. Pol. J. Environ. Stud. 2008, 17, 105–108. [Google Scholar]
  26. Hewitt, C.N. Methods of Environmental Data Analysis; Springer: Dordrecht, The Netherlands, 1992. [Google Scholar] [CrossRef]
  27. Dorman, C. Environmental Data Analysis; Springer International Publishing: Cham, Switzerland, 2020. [Google Scholar] [CrossRef]
  28. Intergovernmental Panel on Climate Change (IPCC, 2013): Climate Change 2013: The Physical Science Basis. In Contribution of Working Group I to the Fifth Assessment Report of the Intergovernmental Panel on Climate Change; Stocker, T.F.; Qin, D.; Plattner, G.-K.; Tignor, M.; Allen, S.K.; Boschung, J.; Nauels, A.; Xia, Y.; Bex, V.; Midgley, P.M. (Eds.) Cambridge University Press: Cambridge, UK; New York, NY, USA, 2013. [Google Scholar] [CrossRef] [Green Version]
  29. EPA (U.S. Environmental Protection Agency). Inventory of US Greenhouse Gas Emissions and Sinks: 1990–2016. Available online: https://www.epa.gov/ghgemissions/inventory-us-greenhouse-gas-emissions-and-sinks-1990-2016 (accessed on 19 October 2022).
  30. Lynch, J.; Cain, M.; Pierrehumbert, R.; Allen, M. Demonstrating GWP*: A means of reporting warming-equivalent emissions that captures the contrasting impacts of short- and long-lived climate pollutants. Environ. Res. Lett. 2020, 15, 044023. [Google Scholar] [CrossRef]
  31. Szeląg-Sikora, A.; Niemiec, M.; Sikora, J.; Chowaniak, M. Possibilities of designating swards of grasses and small-seed legumes from selected organic farms in Poland for feed. In Proceedings of the IX International Scientific Symposium Farm Machinery and Processes Management in Sustainable Agriculture, Lublin, Poland, 22–24 November 2017. [Google Scholar] [CrossRef]
  32. Mohanty, S.; Swain, C.K. Role of microbes in climate smart agriculture. In Microorganisms for Green Revolution. Microorganisms for Sustainability; Panpatte, D., Jhala, Y., Shelat, H., Vyas, R., Eds.; Springer: Singapore, 2018; pp. 129–140. [Google Scholar] [CrossRef]
  33. Sapkota, A.; Haghverdi, A.; Avila, C.C.E.; Ying, S.C. Irrigation and greenhouse gas emissions: A review of field-based studies. Soil Syst. 2020, 4, 20. [Google Scholar] [CrossRef]
  34. Norberg, L.; Hellman, M.; Berglund, K.; Hallin, S.; Berglund, Ö. Methane and nitrous oxide production from agricultural peat soils in relation to drainage level and abiotic and biotic factors. Front. Environ. Sci. 2021, 9, 631112. [Google Scholar] [CrossRef]
  35. Nie, T.; Huang, J.; Zhang, Z.; Chen, P.; Li, T.; Dai, C. The inhibitory effect of a water-saving irrigation regime on CH4 emission in Mollisols under straw incorporation for 5 consecutive years. Agric. Water Manag. 2023, 278, 108163. [Google Scholar] [CrossRef]
  36. Jhala, Y.K.; Vyas, R.V.; Shelat, H.N.; Patel, H.K.; Patel, H.K.; Patel, K.T. Isolation and characterization of methane utilizing bacteria from wetland paddy ecosystem. World J. Microbiol. Biotechnol. 2014, 30, 1845–1860. [Google Scholar] [CrossRef]
  37. Shakoor, A.; Xu, Y.; Wang, Q.; Chen, N.; He, F.; Zuo, H.; Yin, H.; Yan, X.; Ma, Y.; Yang, S. Effects of fertilizer application schemes and soil environmental factors on nitrous oxide emission fluxes in a rice-wheat cropping system, east China. PLoS ONE 2018, 13, e0202016. [Google Scholar] [CrossRef]
  38. Cayuela, M.L.; Aguilera, E.; Sanz-Cobena, A.; Adams, D.C.; Abalos, D.; Barton, L.; Ryals, R.; Silver, W.L.; Alfaro, M.A.; Pappa, V.A.; et al. Direct nitrous oxide emissions in Mediterranean climate cropping systems: Emission factors based on a meta-analysis of available measurement data. Agric. Ecosyst. Environ. 2017, 238, 25–35. [Google Scholar] [CrossRef] [Green Version]
  39. Feng, J.; Li, F.; Deng, A.; Feng, X.; Fang, F.; Zhang, W. Integrated assessment of the impact of enhanced-efficiency nitrogen fertilizer on N2O emission and crop yield. Agric. Ecosyst. Environ. 2016, 231, 218–228. [Google Scholar] [CrossRef]
  40. Kroeze, C.; Mosier, A.; Bouwman, L. Closing the global N2O budget: A retrospective analysis 1500-1994. Glob. Biogeochem. Cycles 1999, 13, 1–8. [Google Scholar] [CrossRef]
  41. Hu, H.W.; Trivedi, P.; He, J.Z.; Singh, B.K. Microbial nitrous oxide emissions in dryland ecosystems: Mechanisms, microbiome and mitigation. Environ. Microbiol. 2017, 19, 4808–4828. [Google Scholar] [CrossRef] [Green Version]
  42. Bakken, L.R.; Frostegård, Å. Sources and sinks for N2O, can microbiologist help to mitigate N2O emissions? Environ. Microbiol. 2017, 19, 4801–4805. [Google Scholar] [CrossRef] [PubMed]
  43. Paustian, K.; Lehmann, J.; Ogle, S.; Reay, D.; Robertson, G.P.; Smith, P. Climate-smart soils. Nature 2016, 532, 49–57. [Google Scholar] [CrossRef] [PubMed] [Green Version]
  44. Zheng, X.; Wang, M.; Wang, Y.; Shen, R.; Gou, J.; Li, J.; Jin, J.; Li, L. Impacts of soil moisture on nitrous oxide emission from croplands: A case study on the rice-based agro-ecosystem in Southeast China. Chemosphere-Glob. Chang. Sci. 2000, 2, 207–224. [Google Scholar] [CrossRef]
  45. Schindlbacher, A.; Zechmeister-Boltenstern, S.; Butterbach-Bahl, K. Effects of soil moisture and temperature on NO, NO2, and N2O emissions from European forest soils. J. Geophys. Res. Atmos. 2004, 109, D17302. [Google Scholar] [CrossRef]
  46. Domeignoz-Horta, L.A.; Putz, M.; Spor, A.; Bru, D.; Breuil, M.C.; Hallin, S.; Philippot, L. Non-denitrifying nitrous oxide-reducing bacteria—An effective N2O sink in soil. Soil Biol. Biochem. 2016, 103, 376–379. [Google Scholar] [CrossRef]
  47. Jones, C.M.; Graf, D.R.H.; Bru, D.; Philippot, L.; Hallin, S. The unaccounted yet abundant nitrous oxide-reducing microbial community: A potential nitrous oxide sink. ISME J. 2013, 7, 417–426. [Google Scholar] [CrossRef] [Green Version]
  48. Kumar, A.; Medhi, K.; Fagodiya, R.K.; Subrahmanyam, G.; Mondal, R.; Raja, P.; Malyan, S.K.; Gupta, D.K.; Gupta, C.K.; Pathak, H. Molecular and ecological perspectives of nitrous oxide producing microbial communities in agro-ecosystems. Rev. Environ. Sci. Biotechnol. 2020, 19, 717–750. [Google Scholar] [CrossRef]
  49. Bueno, E.; Mania, D.; Mesa, S.; Bedmar, E.J.; Frostegård, Å.; Bakken, L.R.; Delgado, M.J. Regulation of the emissions of the greenhouse gas nitrous oxide by the soybean endosymbiont Bradyrhizobium diazoefficiens. Int. J. Mol. Sci. 2022, 23, 1486. [Google Scholar] [CrossRef] [PubMed]
  50. Maestre, F.T.; Quero, J.L.; Gotelli, N.J.; Escudero, A.; Ochoa, V.; Delgado-Baquerizo, M.; García-Gómez, M.; Bowker, M.A.; Soliveres, S.; Escolar, C.; et al. Plant species richness and ecosystem multifunctionality in global drylands. Science 2012, 335, 214–218. [Google Scholar] [CrossRef] [PubMed] [Green Version]
  51. Delgado-Baquerizo, M.; Maestre, F.T.; Gallardo, A.; Bowker, M.A.; Wallenstein, M.D.; Quero, J.L.; Ochoa, V.; Gozalo, B.; García-Gómez, M.; Soliveres, S.; et al. Decoupling of soil nutrient cycles as a function of aridity in global drylands. Nature 2013, 502, 672–676. [Google Scholar] [CrossRef]
  52. Delgado-Baquerizo, M.; Maestre, F.T.; Escolar, C.; Gallardo, A.; Ochoa, V.; Gozalo, B.; Prado-Comesaña, A. Direct and indirect impacts of climate change on microbial and biocrust communities alter the resistance of the N cycle in a semiarid grassland. J. Ecol. 2014, 102, 1592–1605. [Google Scholar] [CrossRef]
  53. Camposeo, S.; Vivaldi, G.A.; Russo, G.; Melucci, F.M. Intensification in olive growing reduces global warming potential under both integrated and organic farming. Sustainability 2022, 14, 6389. [Google Scholar] [CrossRef]
  54. Core Writing Team; Pachauri, R.K.; Meyer, L.A. (Eds.) Intergovernmental Panel on Climate Change (IPCC, 2014): Climate Change 2014: Synthesis Report. In Contribution of Working Groups I, II and III to the Fifth Assessment Report of the Intergovernmental Panel on Climate Change; IPCC: Geneva, Switzerland, 2015. [Google Scholar]
  55. Naser, H.M.; Nagata, O.; Sultana, S.; Hatano, R. Carbon sequestration and contribution of CO2, CH4 and N2O fluxes to global warming potential from paddy-fallow fields on mineral soil beneath peat in central Hokkaido, Japan. Agriculture 2020, 10, 6. [Google Scholar] [CrossRef] [Green Version]
  56. Clark, S. Organic farming and climate change: The need for innovation. Sustainability 2020, 12, 7012. [Google Scholar] [CrossRef]
Figure 1. Photoacoustic gas meter 1412 INNOVA Air Tech Instruments with a static chamber for measuring gas emissions and immissions.
Agronomy 13 00754 g001
Figure 2. Emission of CO2 from peat substrate with (A) and without (B) strawberry plant: OP—optimal moisture; DF—water deficit; C0—control plants, which were not inoculated with rhizosphere bacteria; and CMg—soil application of a 10 mM KMgSO4 solution without bacteria in the amount of 40 cm3/plant.
Agronomy 13 00754 g002
Figure 3. Emission of CH4 from peat substrate with (A) and without (B) strawberry plant: OP—optimal moisture; DF—water deficit; C0—control plants, which were not inoculated with rhizosphere bacteria; CMg—soil application of a 10 mM KMgSO4 solution without bacteria in the amount of 40 cm3/plant.
Agronomy 13 00754 g003
Figure 4. Emission of N2O from peat substrate with (A) and without (B) strawberry plant: OP—optimal moisture; DF—water deficit; C0—control plants, which were not inoculated with rhizosphere bacteria; CMg—soil application of a 10 mM KMgSO4 solution without bacteria in the amount of 40 cm3/plant.
Agronomy 13 00754 g004
Figure 5. Emission of NH3 from peat substrate with (A) and without (B) strawberry plant: OP—optimal moisture; DF—water deficit; C0—control plants, which were not inoculated with rhizosphere bacteria; CMg—soil application of a 10 mM KMgSO4 solution without bacteria in the amount of 40 cm3/plant.
Agronomy 13 00754 g005
Figure 6. GWP from peat substrate with (A) and without (B) strawberry plant: OP—optimal moisture; DF—water deficit; C0—control plants, which were not inoculated with rhizosphere bacteria; CMg—soil application of a 10 mM KMgSO4 solution without bacteria in the amount of 40 cm3/plant.
Agronomy 13 00754 g006
Figure 7. Frequency of statistically significant changes; green-the most important strains, blue-other strains.
Agronomy 13 00754 g007
Figure 8. Results of cluster analysis.
Agronomy 13 00754 g008
Table 1. Descriptive statistics.
GasStatisticDF Plant (+) *OP Plant (+)DF Plant (−)OP Plant (−)
CO2Mean ± SD1921 ± 1852096 ± 1891886 ± 1071953 ± 126
Range1777–28991748–26191724–22111765–2426
CV10%9%6%6%
N2OMean ± SD2.32 ± 0.212.29 ± 0.22.07 ± 0.182.35 ± 0.13
Range2.01–3.111.94–2.971.78–2.832.14–2.85
CV9%9%9%5%
CH4Mean ± SD4.2 ± 2.096.44 ± 3.495.48 ± 2.414.94 ± 1.69
Range1.45–10.640–19.682.8–11.532.3–9.22
CV50%54%44%34%
NH3Mean ± SD0.56 ± 0.070.54 ± 0.110.5 ± 0.080.56 ± 0.08
Range0.43–0.850.24–0.850.37–0.770.37–0.76
CV13%20%15%15%
GWPMean ± SD797.1 ± 89.4844.5 ± 104.7754.8 ± 108.3824.7 ± 45.7
Range691–1073645–1131615–1132758–997
CV24%28%19%15%
* DF—water deficit, OP—optimal moisture, plant (+)—peat substrate with plant, and plant (−)—peat substrate without plant.
Table 2. Two-way ANOVA results.
VariableSum of SquaresdfMean Square ErrorFp
CO22,146,9223715,640.629.43622>0.001
N2O431.440.02875>0.001
CH4224374.711.83576>0.001
NH3030.18.89481>0.001
C038.73.012.94.7920.003
CMg35.53.011.817.352>0.001
DLGB218.23.06.118.168>0.001
DLGB321.93.07.330.772>0.001
DKB264.83.01.65.4100.002
DKB5815.53.05.29.873>0.001
DKB843.53.01.22.3810.073
AJ 1.28.93.03.07.891>0.001
DKB643.83.01.34.1460.008
DKB658.43.02.83.7100.013
DKB7014.03.04.77.891>0.001
DKB6311.33.03.813.676>0.001
DKB680.63.00.20.5290.663
PJ 1.19.63.03.22.6380.053
Disclaimer/Publisher’s Note: The statements, opinions and data contained in all publications are solely those of the individual author(s) and contributor(s) and not of MDPI and/or the editor(s). MDPI and/or the editor(s) disclaim responsibility for any injury to people or property resulting from any ideas, methods, instructions or products referred to in the content.

