Article

Adverse Weather Impacts on Winter Wheat, Maize and Potato Yield Gaps in northern Belgium

1
Division of Soil and Water Management, Department of Earth- and Environmental Sciences, Katholieke Universiteit Leuven, 3000 Leuven, Belgium
2
Flemish Institute for Technological Research (VITO), 2400 Mol, Belgium
*
Author to whom correspondence should be addressed.
Agronomy 2023, 13(4), 1104; https://doi.org/10.3390/agronomy13041104
Submission received: 14 March 2023 / Revised: 6 April 2023 / Accepted: 11 April 2023 / Published: 12 April 2023
(This article belongs to the Section Soil and Plant Nutrition)

Abstract

:
Adverse weather conditions greatly reduce crop yields, leading to economic losses and lower food availability. The characterization of adverse weather and the quantification of their potential impact on arable farming is necessary to advise farmers on feasible and effective adaptation strategies and to support decision making in the agriculture sector. This research aims to analyze the impact of adverse weather on the yield of winter wheat, grain maize and late potato using a yield gap approach. A time-series analysis was performed to identify the relationship between (agro-)meteorological indicators and crop yields and yield gaps in Flanders (northern Belgium) based on 10 years of field trial and weather data. Indicators were calculated for different crop growth stages and multiple soils. Indicators related to high temperature, water deficit and water excess were analyzed, as the occurrence frequency and intensity of these weather events will most likely increase by 2030–2050. The concept of “yield gap” was used to analyze the effects of adverse weather in relation to other yield-reducing factors such as suboptimal management practices. Winter wheat preferred higher temperatures during grain filling and was negatively affected by wet conditions throughout the growing season. Maize was especially vulnerable to drought throughout the growing season. Potato was more affected by heat and drought stress during tuber bulking and by waterlogging during the early growth stages. The impact of adverse weather on crop yield was influenced by soil type, and optimal management practices mitigated the impact of adverse weather.

1. Introduction

The influence of climate change on crop production is manifested in several ways. Changes in seasonal temperature, water availability and radiation incidence can have direct effects on crop growth and biomass production through their influence on crop physiological processes [1]. The indirect effects of climate change encompass changes in nutrient availability (higher temperatures increase soil organic matter degradation), the emergence of new pests and diseases, or alterations in the phenological calendar [2]. In addition to changes in the mean value of meteorological variables, an increased variability includes a more frequent occurrence of adverse and extreme weather conditions [3]. Adverse weather conditions are meteorological conditions that may cause damage to crops, such as temperatures higher than optimal for plant growth. The definition of extreme weather relates to extremes in the historical distribution, for example, heat waves, droughts or floods [4]. Adverse and extreme weather might greatly reduce crop yields, leading to economic losses and lower food availability. One third of the global yield variability is attributed to climatic variability and the incidence of weather extremes [5], highlighting the importance of measures such as agricultural insurance schemes, emergency food supply strategies and adaptations at the farm level to reduce yield losses. The characterization of adverse and extreme weather and the quantification of their potential impacts on arable farming is necessary to develop feasible and effective adaptation strategies and to support decision making in the agriculture sector.
Approaches to studying the impact of weather extremes are based on empirical models or process-based models, which directly or indirectly relate weather conditions to final crop yield. Empirical models aim to relate crop yields to a set of explanatory variables, which are (agro-)meteorological indices in this context [2,6]. Meteorological indicators are directly calculated from weather variables, such as air temperature or rainfall. Agro-meteorological indicators are indirectly related to the prevailing weather conditions, as they are influenced by crop type, crop growth and soil properties. Process-based or dynamic crop growth models comprise multiple mathematical equations which relate crop development, biomass production and final yield to several location- and time-specific environmental characteristics [7,8]. Empirical models are typically based on the analysis of yield and weather time series, while dynamic crop growth models are most often constructed from greenhouse or field experiments.
The impact of adverse and extreme weather on crop production can be studied in terms of absolute yield or in terms of yield penalty (yield reduction or loss). Typically, yield loss is defined as a reduction from the long-term detrended average yield [2,9,10,11,12,13,14]. Another way of expressing yield reduction is via the concept of the yield gap [15], but it is less frequently used for adverse and extreme weather impact studies. The yield gap theory indicates that agricultural production is to a large extent determined by climate and weather [16]. Potential yield is location-specific, meaning that for a given crop genotype, it is determined by the prevailing climate, soil type and topography. Therefore, a shifted mean in the distribution of a climatic variable might affect the potential yield. The actual yield depends on several yield-reducing factors, including weather, whereby extreme weather events might significantly reduce the actual yield. Multiple methods exist to determine potential yields, ranging from simple proxies, such as the upper 5th or 1st percentile of the yield distribution, to more complex (crop) models [17].
Many studies using empirical or process-based crop models tend to overestimate yields in extreme years [18]. In addition to the simplicity of the data or the models used, climate impact studies often focus on large areas with coarse resolution weather data and make use of meteorological variables averaged over the whole growing season. Extreme weather events occur at a small spatial scale due to substantial regional differences in weather. In addition, such events may take place within short timeframes, ranging from a couple of hours to a few days. As a result of studying larger areas and longer timeframes, average yields are obtained, while interannual yield variability is underestimated. Weather extremes may be “hidden” and thus not accounted for. Moreover, the impact of an extreme weather event on crop production is crop-specific and highly depends on its timing within the crop growth cycle [2].
This research aims to analyze the impact of adverse weather on the crop yield of winter wheat (Triticum aestivum), maize (Zea mays) and potato (Solanum tuberosum) using a yield gap approach while taking into account critical crop stages, soil and management practices. The following research questions were addressed:
(1)
Which (agro-)meteorological indicators best explain yield and yield gap variability?
(2)
To what extent do soil and management practices play a role in mitigating the impact of adverse weather conditions?
A time-series analysis was performed to identify the relationship between (agro-)meteorological indicators and crop yields and yield gaps in Flanders (northern Belgium) based on 10 years of weather and yield data for 4 soil types and 2 different crop management systems. A literature review was carried out to gain insights on climate impact analysis methods and to decide on which (agro-)meteorological indices to use in this study.

2. Materials and Methods

2.1. Literature Review

A search was performed in Web of Science and Google Scholar. Only recent publications were selected, as this literature review builds on a review performed in 2018 [2]. The period was therefore 2017–2022. The following combinations of key words were used in the “advanced search function”: (winter wheat OR maize OR potato) AND yield AND (extreme weather indicator OR climatic indicator OR agro-meteorological indicator). Once the initial search was performed, only studies that included time series were selected.
Recent research has analyzed historic weather and yield time series to investigate the impact of adverse and extreme weather on winter wheat, maize and potato (Table 1, Table 2 and Table 3). The focus has been on identifying the most sensitive crop growth stages, thresholds of (agro-)meteorological indicators for substantial yield loss and best predictors of (low) yields. The impact of adverse and extreme weather was reported in terms of absolute (low/extreme) yield or in terms of yield reduction from the average yield. Different analysis methods were used. Models such as linear/logarithmic mixed models and probability density functions reported the impact as a percentage of the variability explained or as goodness-of-fit indicators. Correlation coefficients and tests or ANOVA statistics were used to report the impact of adverse and extreme weather as the size of the correlation/association between indicators and yield or yield penalty.
Threshold values for (agro-)meteorological indicators were defined from the literature or based on the upper/lower 1st to 5th percentile of the historic distribution. Low yields or extreme yield losses were defined by the lower 5th to 10th percentile of the distribution. For winter wheat and maize, the most sensitive stage was the reproductive stage (flowering and grain filling), while tuber set and tuber bulking were most sensitive for potatoes.
The impact of drought, heat and water excess was most often studied, indicating the relative importance of these weather extremes compared with others, such as frost or storms/hail/wind. The occurrence of extreme weather is expected to increase under climate change. Crop yields in Europe will be more and more affected by heat (Central and Eastern Europe), drought (Southern Europe) and water excess during planting and harvesting (Western and Northern Europe) [18]. In Belgium, the increased incidence of heatwaves and drought spells, and especially their combined occurrence, poses additional threats to current and future crop production [19]. Nevertheless, [20] remarks that weather extremes such as storms/flooding are under-researched in relation to their economic importance and that most research is performed on grain crops, especially winter wheat, maize and rice.
The majority of studies made use of simple indicators directly linked to weather conditions and were able to show a causal relationship with crop yield or yield penalty. More complex agro-meteorological indicators were not necessarily better predictors for yield loss [21]. National or regional yield statistics and (agro-)meteorological indicators averaged over larger timeframes performed well for the identification of overall impacts and trends, the results of which are valuable in policy decisions. The use of field- or farm-level yield data and shorter timeframes of (agro-)meteorological indicators enabled the formulation of site-specific risk management strategies, such as on-farm adaptation measures or insurance schemes.

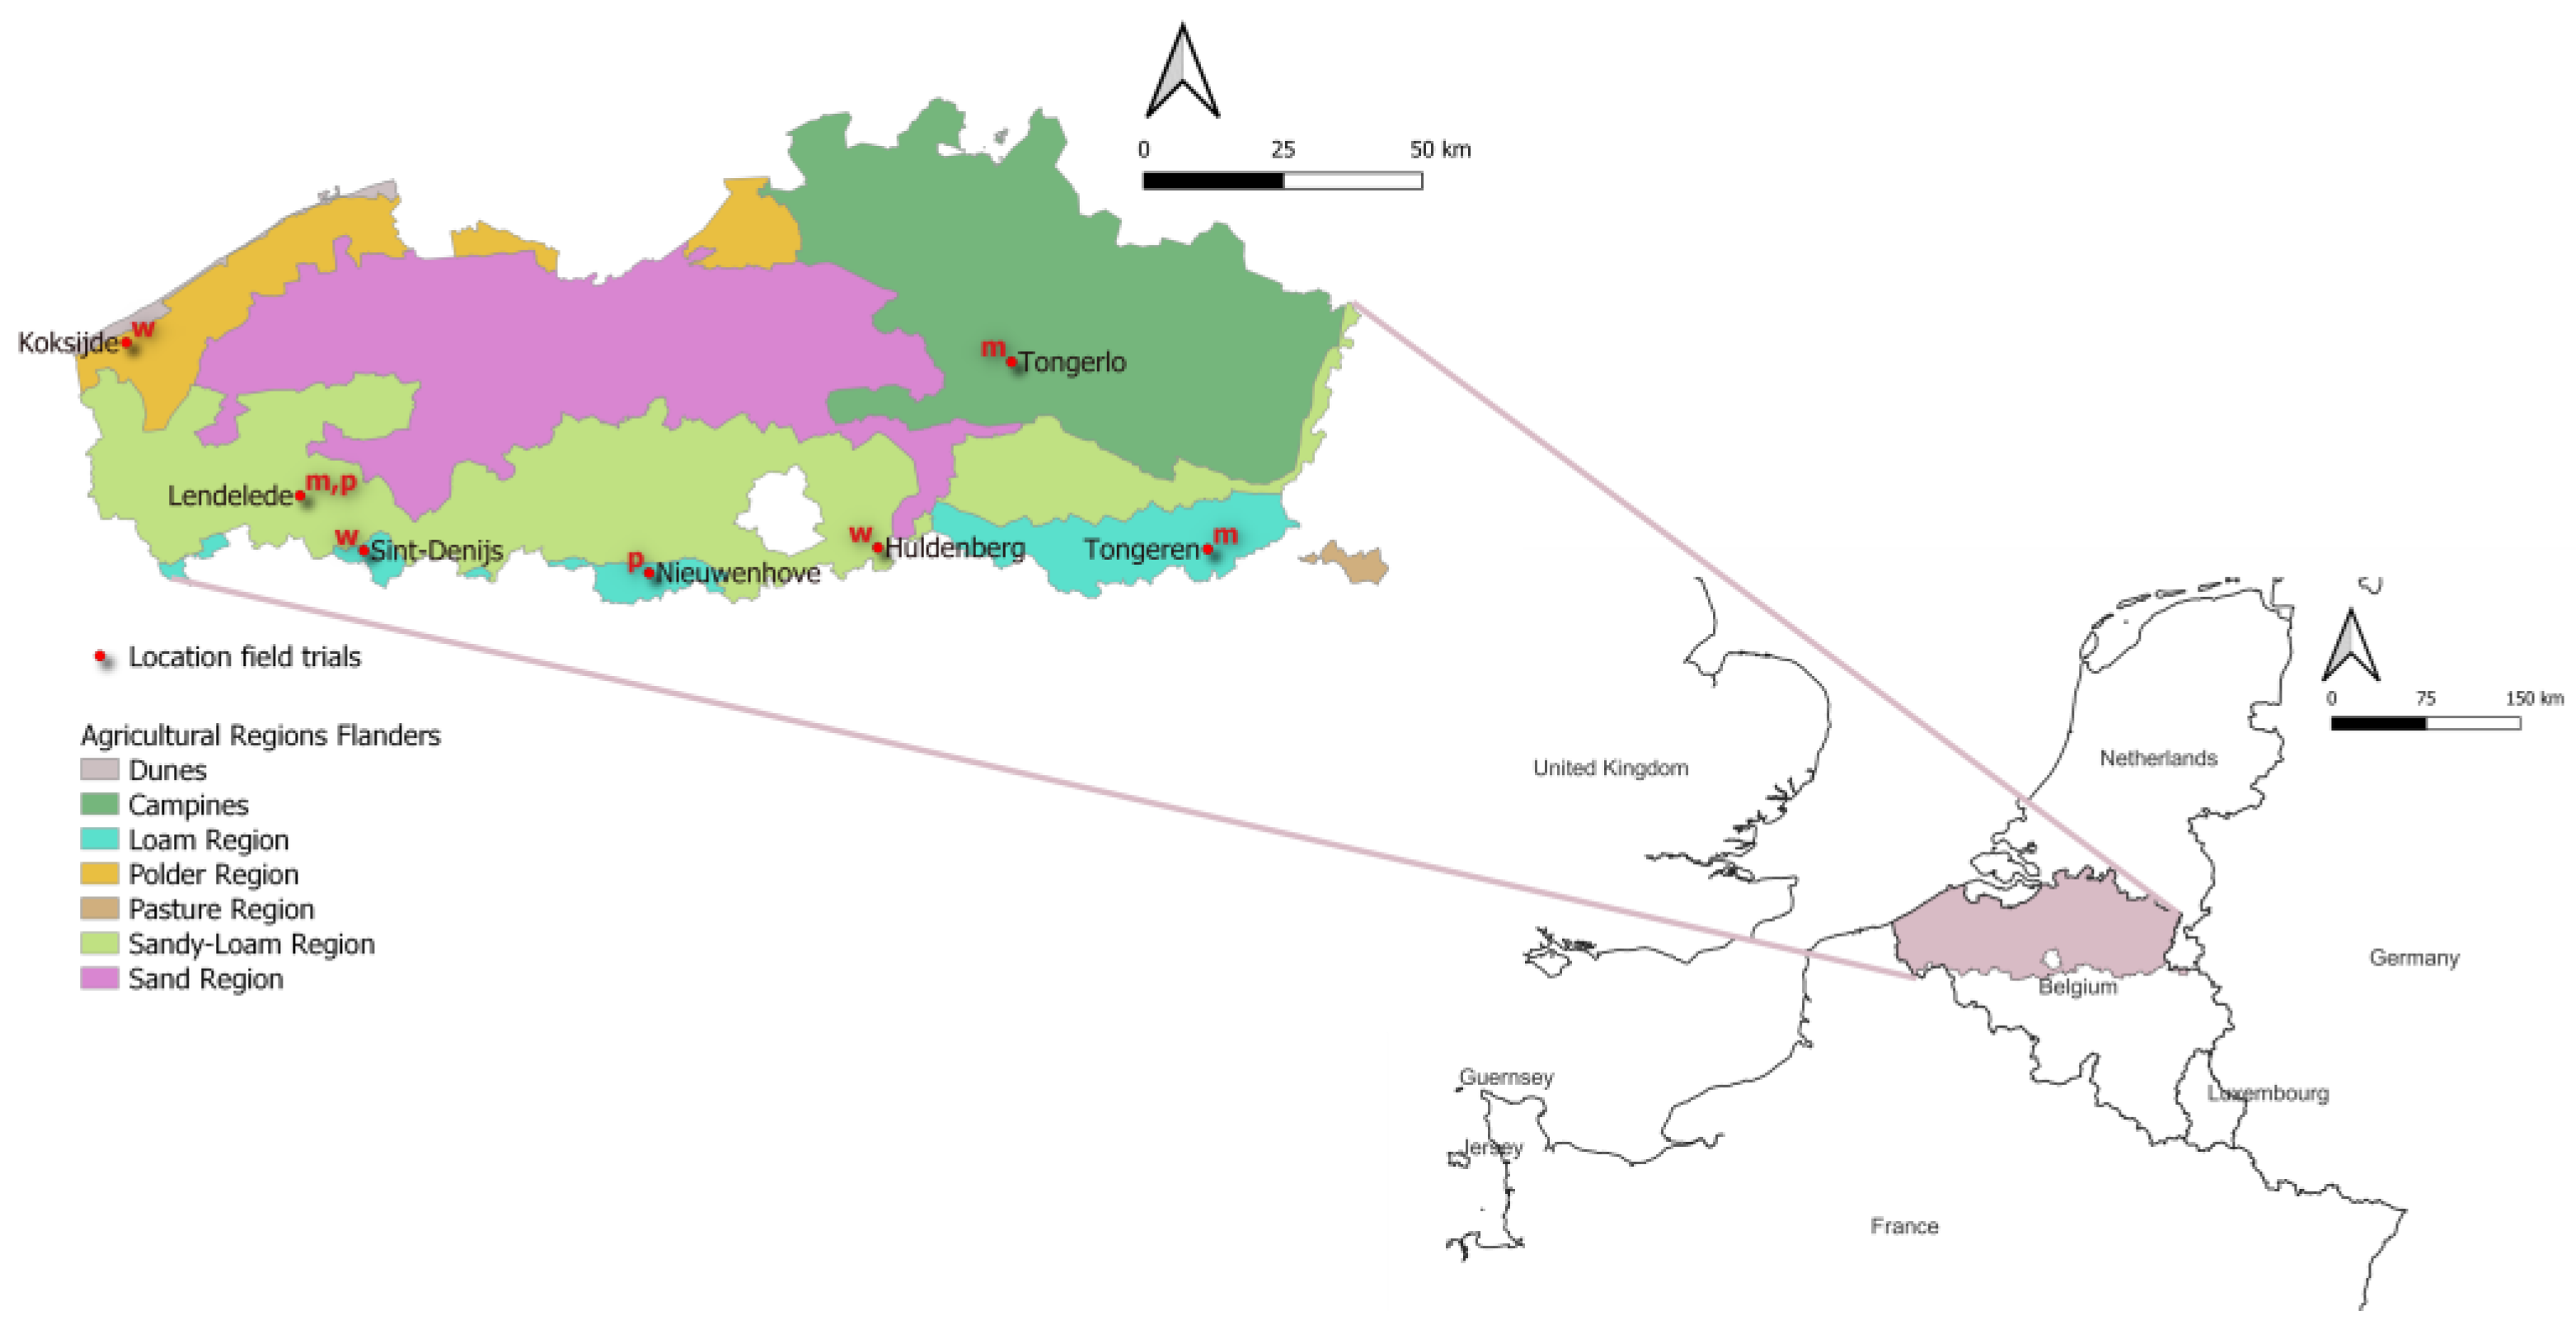
2.2. Case Study Area

The timeseries of crop yields and meteorological data were investigated for three main crop types in Flanders (northern Belgium): winter wheat, grain maize and late potato. In this way, winter and summer crops; grain and root crops; and C3 and C4 crops were included. In addition, the analysis was carried out for multiple soil types.
Belgium is located in the Northern hemisphere, at the western border of the European continent, and the climate is determined by (1) the interplay between cold air masses coming from the North Pole and warm air masses coming from the subtropics, which drives the alternation of seasons, and by (2) the presence of the North Sea and the Atlantic Ocean, which levels off temperature fluctuations and brings year-round precipitation [22]. According to the Köppen–Geiger climate classification, the climate in Belgium is Cfb: a warm temperate climate (C), fully humid (f) and with warm summers (b) [23]. During the 1991–2020 period, the mean annual temperature was 11 °C, ranging from 3.7 °C in January to 18.7 °C in July; the mean annual precipitation was 837.1 mm/year, ranging from 46.7 mm in April to 87.4 mm in December; and the mean daily solar radiation was 1037.6 kWh/m², ranging from 16.8 kWh/m² in December to 155.5 kWh/m² in June [22].
Flanders is divided into 7 agricultural zones depending on the major soil type and agricultural activities (Figure 1) [24]. Crop information was obtained from field trials located across Flanders. Determination of the soil textural class on the field trial locations was based on soil profiles, with soil information according to the Belgian soil classification system [25]. The soil textural classes were converted to the USDA textural classes using the conversion matrix given in Appendix A (Table A1). The soil textural classes are clay loam in Koksijde; silt loam in Poperinge and Huldenberg; silt in Sint-Denijs, Nieuwenhove and Tongeren; and sandy loam in Tongerlo.

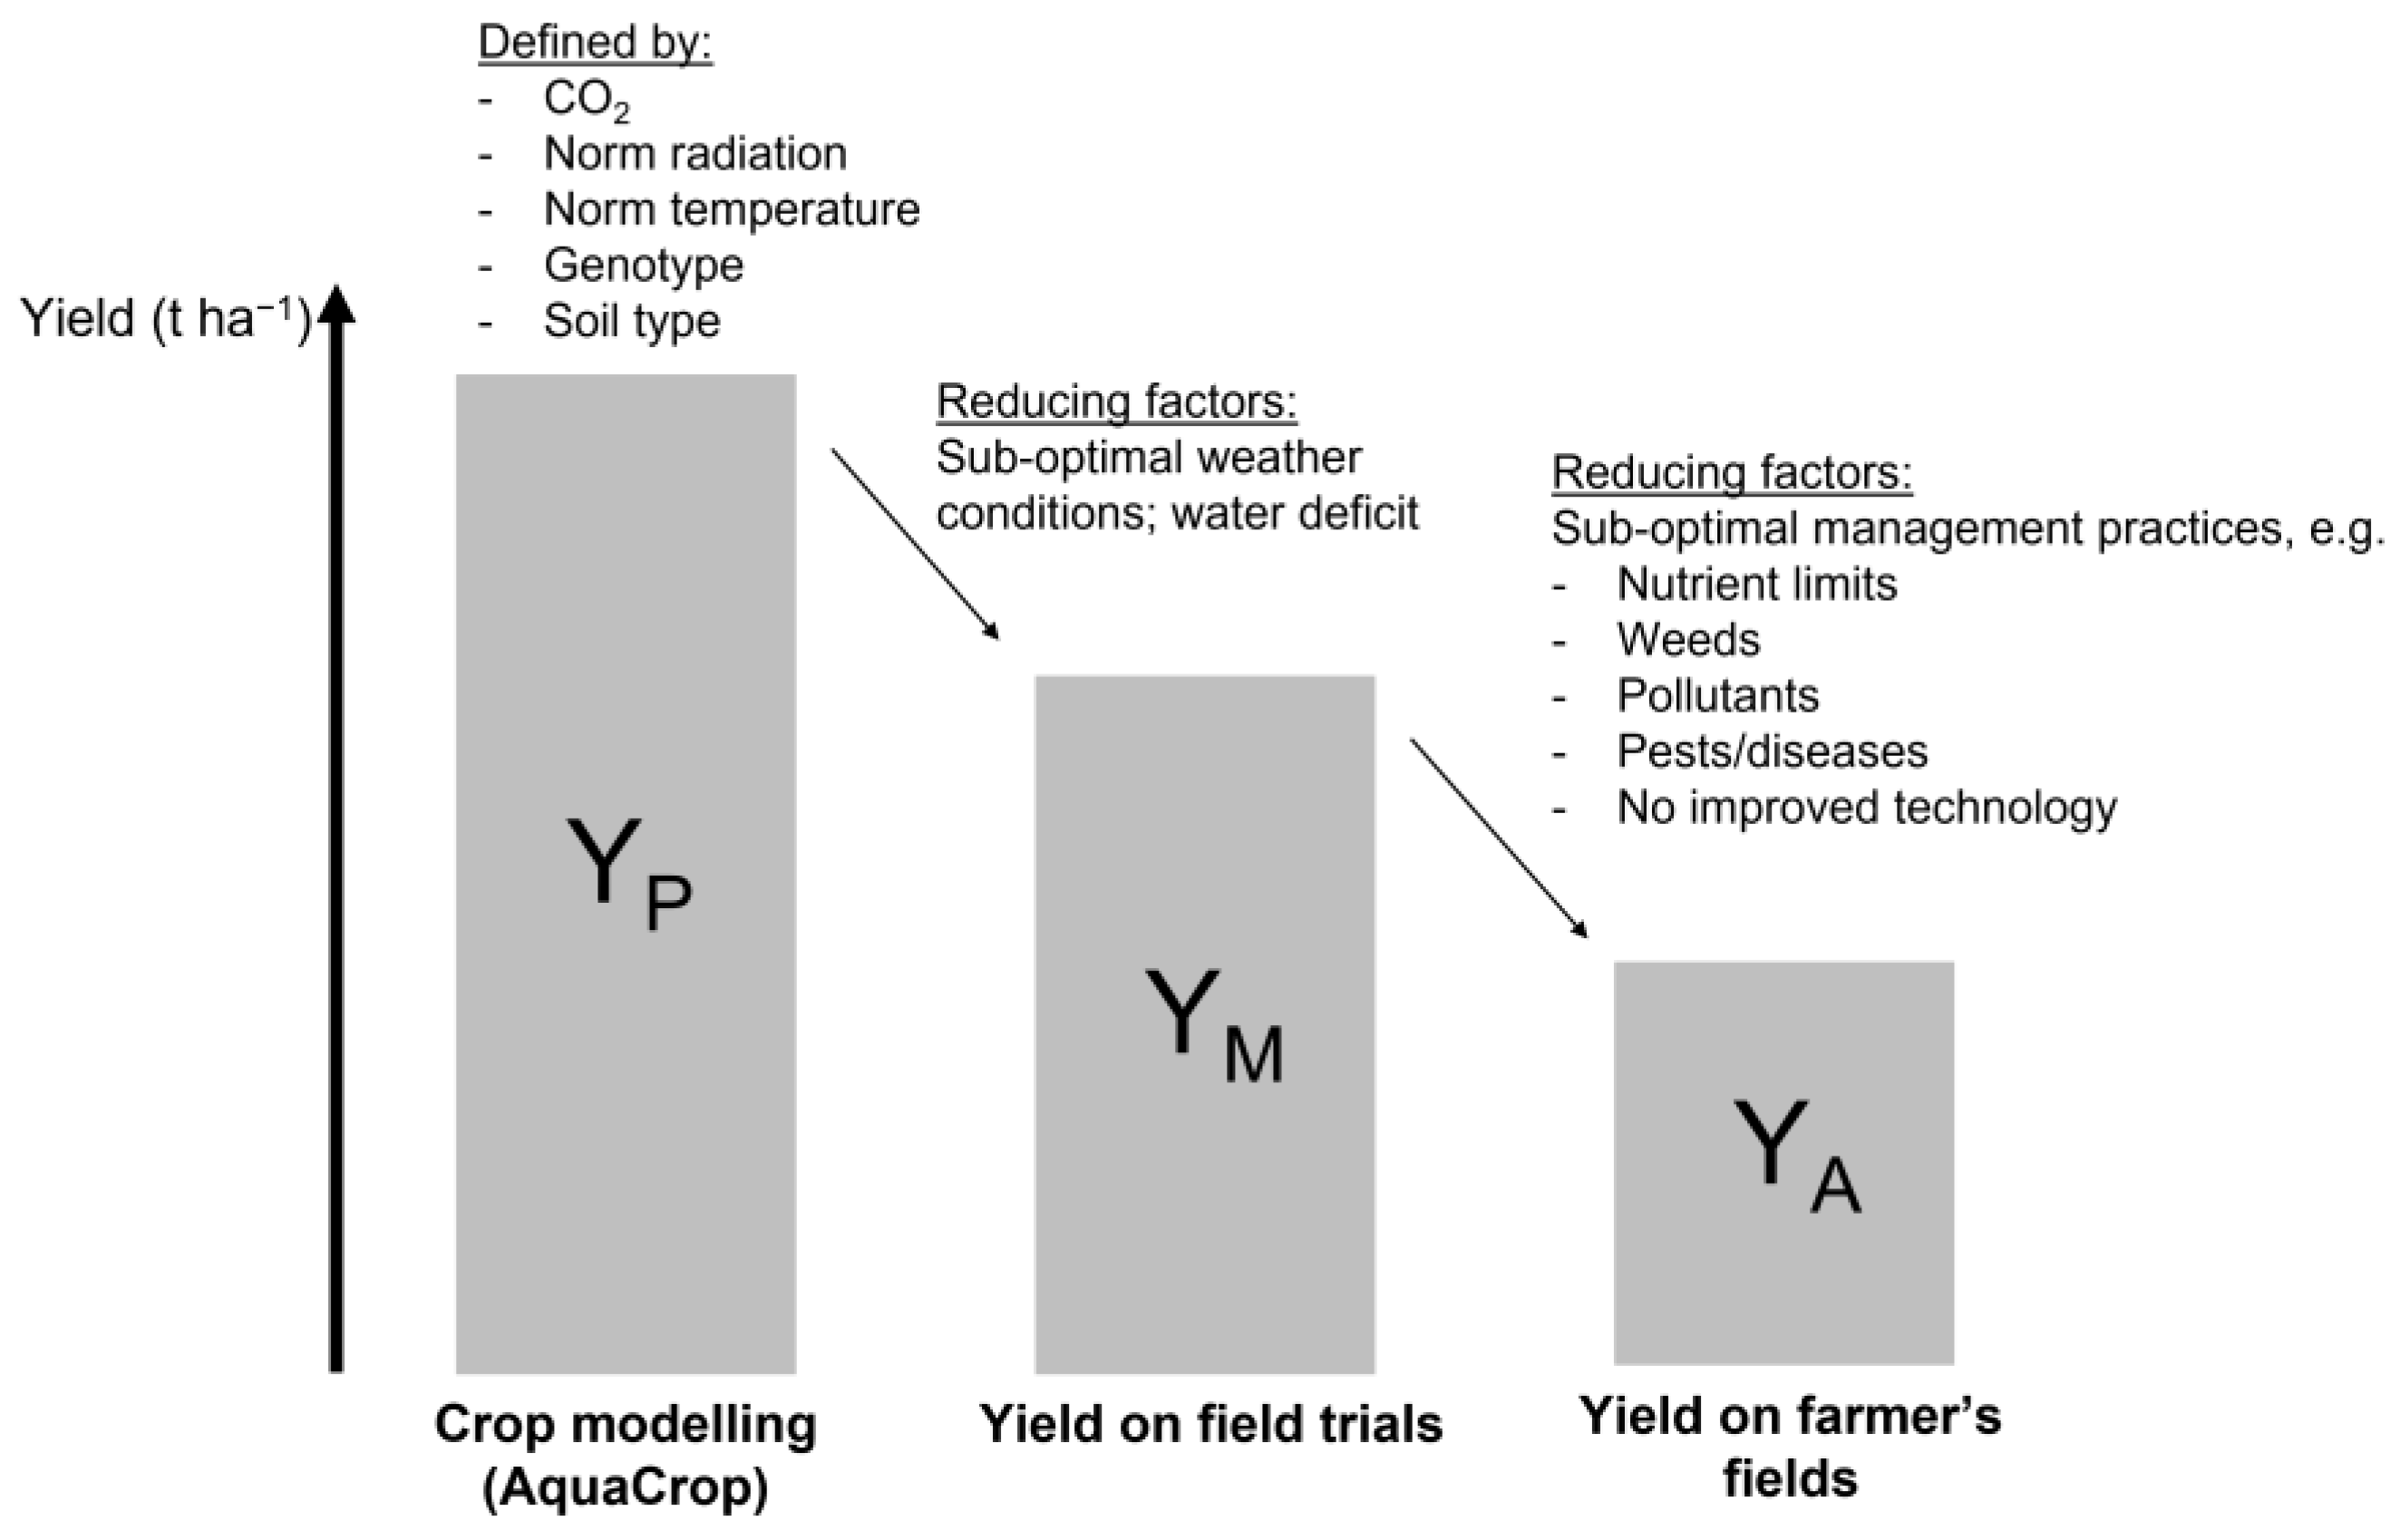
2.3. Yield Gap Analysis

The concept “yield gap” was used to analyze the effects of extreme weather in relation to other yield-reducing factors. The theory and possible approaches to yield gap analysis are explained profoundly by [17]. Yield gaps can be calculated by subtracting two yield levels (Equation (1)) and may also be expressed as a percentage of the highest yield level (Equation (2)). This is illustrated for the yield gap (YG) between water-limited (YW) and actual yield (YA):
YG1 = YWYA [t ha−1],
YG2 = [(YWYA)/YW] ∗ 100 [%]
Each yield gap is explained by one or more yield-reducing factors, such as weather conditions, nutrient availability, the prevalence of weeds, pests, diseases and pollutants, farmer’s skills or applied farming practices, such as irrigation and technology (Figure 2) [17]. Through the identification of these factors for a given situation, case-specific gap-closing measures can be formulated.
In this research, three yield levels were considered (Figure 2): (1) actual yield as observed on farms (YA), (2) yield as observed in experimental fields where optimal management practices are maintained (YM) and (3) simulated potential yield (YP).
The actual yields (YA) were obtained from Statbel, the Belgian statistical office, [26] and are averaged per agricultural zone.
The optimal management yields (YM) were obtained from variety trials performed across Flanders throughout the past 10 years (Figure 1). Data on variety trials were obtained from agricultural experimental stations for winter wheat, maize and potato [27,28,29]. The trials were held under optimal management practices. For example, pest and disease pressure was kept to a minimum. For winter wheat and maize, yields were averaged over all cultivars tested in the respective trials. For potato, only yields for the variety Fontane were used, since this is the most common late potato variety.
The potential yields (YP) were simulated using the crop growth model AquaCrop. One of the advantages of the AquaCrop model is its balance between simplicity, accuracy and robustness [30]. The model makes use of a small number of explicit and widely available input variables at daily time steps which are necessary to account for extreme weather impacts. AquaCrop considers water and temperature as the major drivers for crop growth, which suits the focus on water and temperature related extreme weather events. For each growing season, the model was calibrated using weather, soil and crop growth data:
(1)
Daily weather data (minimum temperature, maximum temperature, average temperature, precipitation, wind speed, solar radiation, sun duration and relative humidity) for each trial location were obtained from the 5 km interpolated weather grid for Belgium [31]. Daily reference evapotranspiration (ET0) was calculated by AquaCrop based on the latitude and altitude of the location, in addition to the available weather data.
(2)
Depending on the trial location, a soil file was created with either clay loam, silt, silt loam or sandy loam soil. Hydraulic characteristics were based on [32].
(3)
The default crop files of wheat, maize and potato were adjusted with information obtained from the field trials (Table 4): sow density, sowing, flowering and harvesting dates for winter wheat and maize and plant density, planting, haulm killing and harvesting dates for potato. The reference harvest index (HI0) was assimilated such that the simulated dry yield corresponded with the actual dry yield observed in the field trials.
After calibration, the model was run in calendar mode, and the potential yield was calculated by multiplying the potential biomass with the HI0. By running the model in calendar mode instead of growing degree day (GDD) mode, the model did not consider the effect of temperature on crop phenology (and thus on final yield) [30]. The potential biomass is the biomass obtained under water and optimal temperature conditions. The yield was calculated for each growing season, and the highest value was taken as the potential yield for the respective crop type on the corresponding soil. The most important AquaCrop parameters are listed in Appendix B (Table A2, Table A3 and Table A4).

2.4. (Agro-)Meteorological Indicators

Only indicators related to high temperature, water deficit and excess were analyzed, as the occurrence frequency and intensity of these weather events will most likely increase by 2030–2050 [6,33]. In line with previous research (Table 1, Table 2 and Table 3), four different indicators were defined. The indices were calculated for the main crop growth stages, since the impact of adverse weather depends on its timing within the crop growth cycle. Figure 3 shows the critical stages and the cropping calendar for winter wheat, maize and potato in Belgium.
The first meteorological indicator studied is the heat stress index (HSI) (Equation (3)):
H S I t = T t T o p t T m a x T o p t   f o r   T t > T o p t
where t is the time in days and T is the temperature. Topt is the optimum temperature at which crop physiological processes run optimally, and Tmax is the maximum temperature at which physiological processes are greatly reduced. Table 5 shows the BBCH code [34], Topt and Tmax [35,36,37] for the main phenological stages of winter wheat, maize and potato.
Secondly, the precipitation deficit index (PDI) is calculated as the difference between precipitation (P) and the Penman–Monteith reference evapotranspiration (ET0) (Equation (4)). The indicator provides information about the excess or shortage of rainfall as compared with the requirements for overall plant growth.
P D I t = P t E T 0 t
The water deficit index (WDI) and the waterlogging index (WLI) are indirectly related to the prevailing weather conditions, as they are based on the soil water balance. The soil water balance is influenced by crop type, crop growth and soil properties. The WDI (Equation (5)) and WLI (Equation (6)) indices are calculated as follows:
W D I t = W r , F C t W r t W r , F C ( t ) W r , P W P ( t ) ,   f o r   W r t < W r ,   F C t
W L I t = W r t W r , F C ( t ) W r , S A T t W r , F C ( t ) ,   f o r   W r t > W r ,   F C
where Wr(t) is the water content in the root zone at time t (days) and Wr,FC(t), Wr,PWP(t) and Wr,SAT(t) are the water content in the root zone at field capacity, permanent wilting point and saturation point, respectively.
The crop growth stages emergence (S1) and flowering and tuber setting (S3) have an average duration of 14 days. For these stages, the daily (agro-)meteorological indicators were averaged. For the stages of vegetative growth (S2), grain filling/ripening and tuber bulking (S4), the daily indicators were integrated over the whole duration of the growth stage.
For the calculation of stage-bound HSI, the daily temperature data were used together with the phenological information from the field trials. PDI is based on daily rainfall and ET0. The daily root zone water content was modeled using the calibrated AquaCrop crop files for each growing season, which was subsequently used to calculate WDI and WLI. The relationship between (agro-)meteorological variables was investigated using descriptive statistics and linear regression in Rstudio [38]. Correlation matrices were visualized using the package “corrplot”, and significance tests were performed using the “cor_test” function in the package “rstatix”. All variables significantly correlated, and a significance level of 10% (alpha = 0.1) was extracted. Subsequently, the goodness-of-fit indicators were calculated for multiple linear regression models, including all (agro-)meteorological indicators, with or without soil type as an additional explanatory variable. The package “modelsummary” was used to extract the goodness-of-fit indicators: Akaike’s Information Criterion (AIC), coefficient of determination (R2) and root mean square error (RMSE), as well as the package “hydroGOF” for mean absolute error (MAE) and index of agreement (d).

3. Results

3.1. Yield Gap Analysis
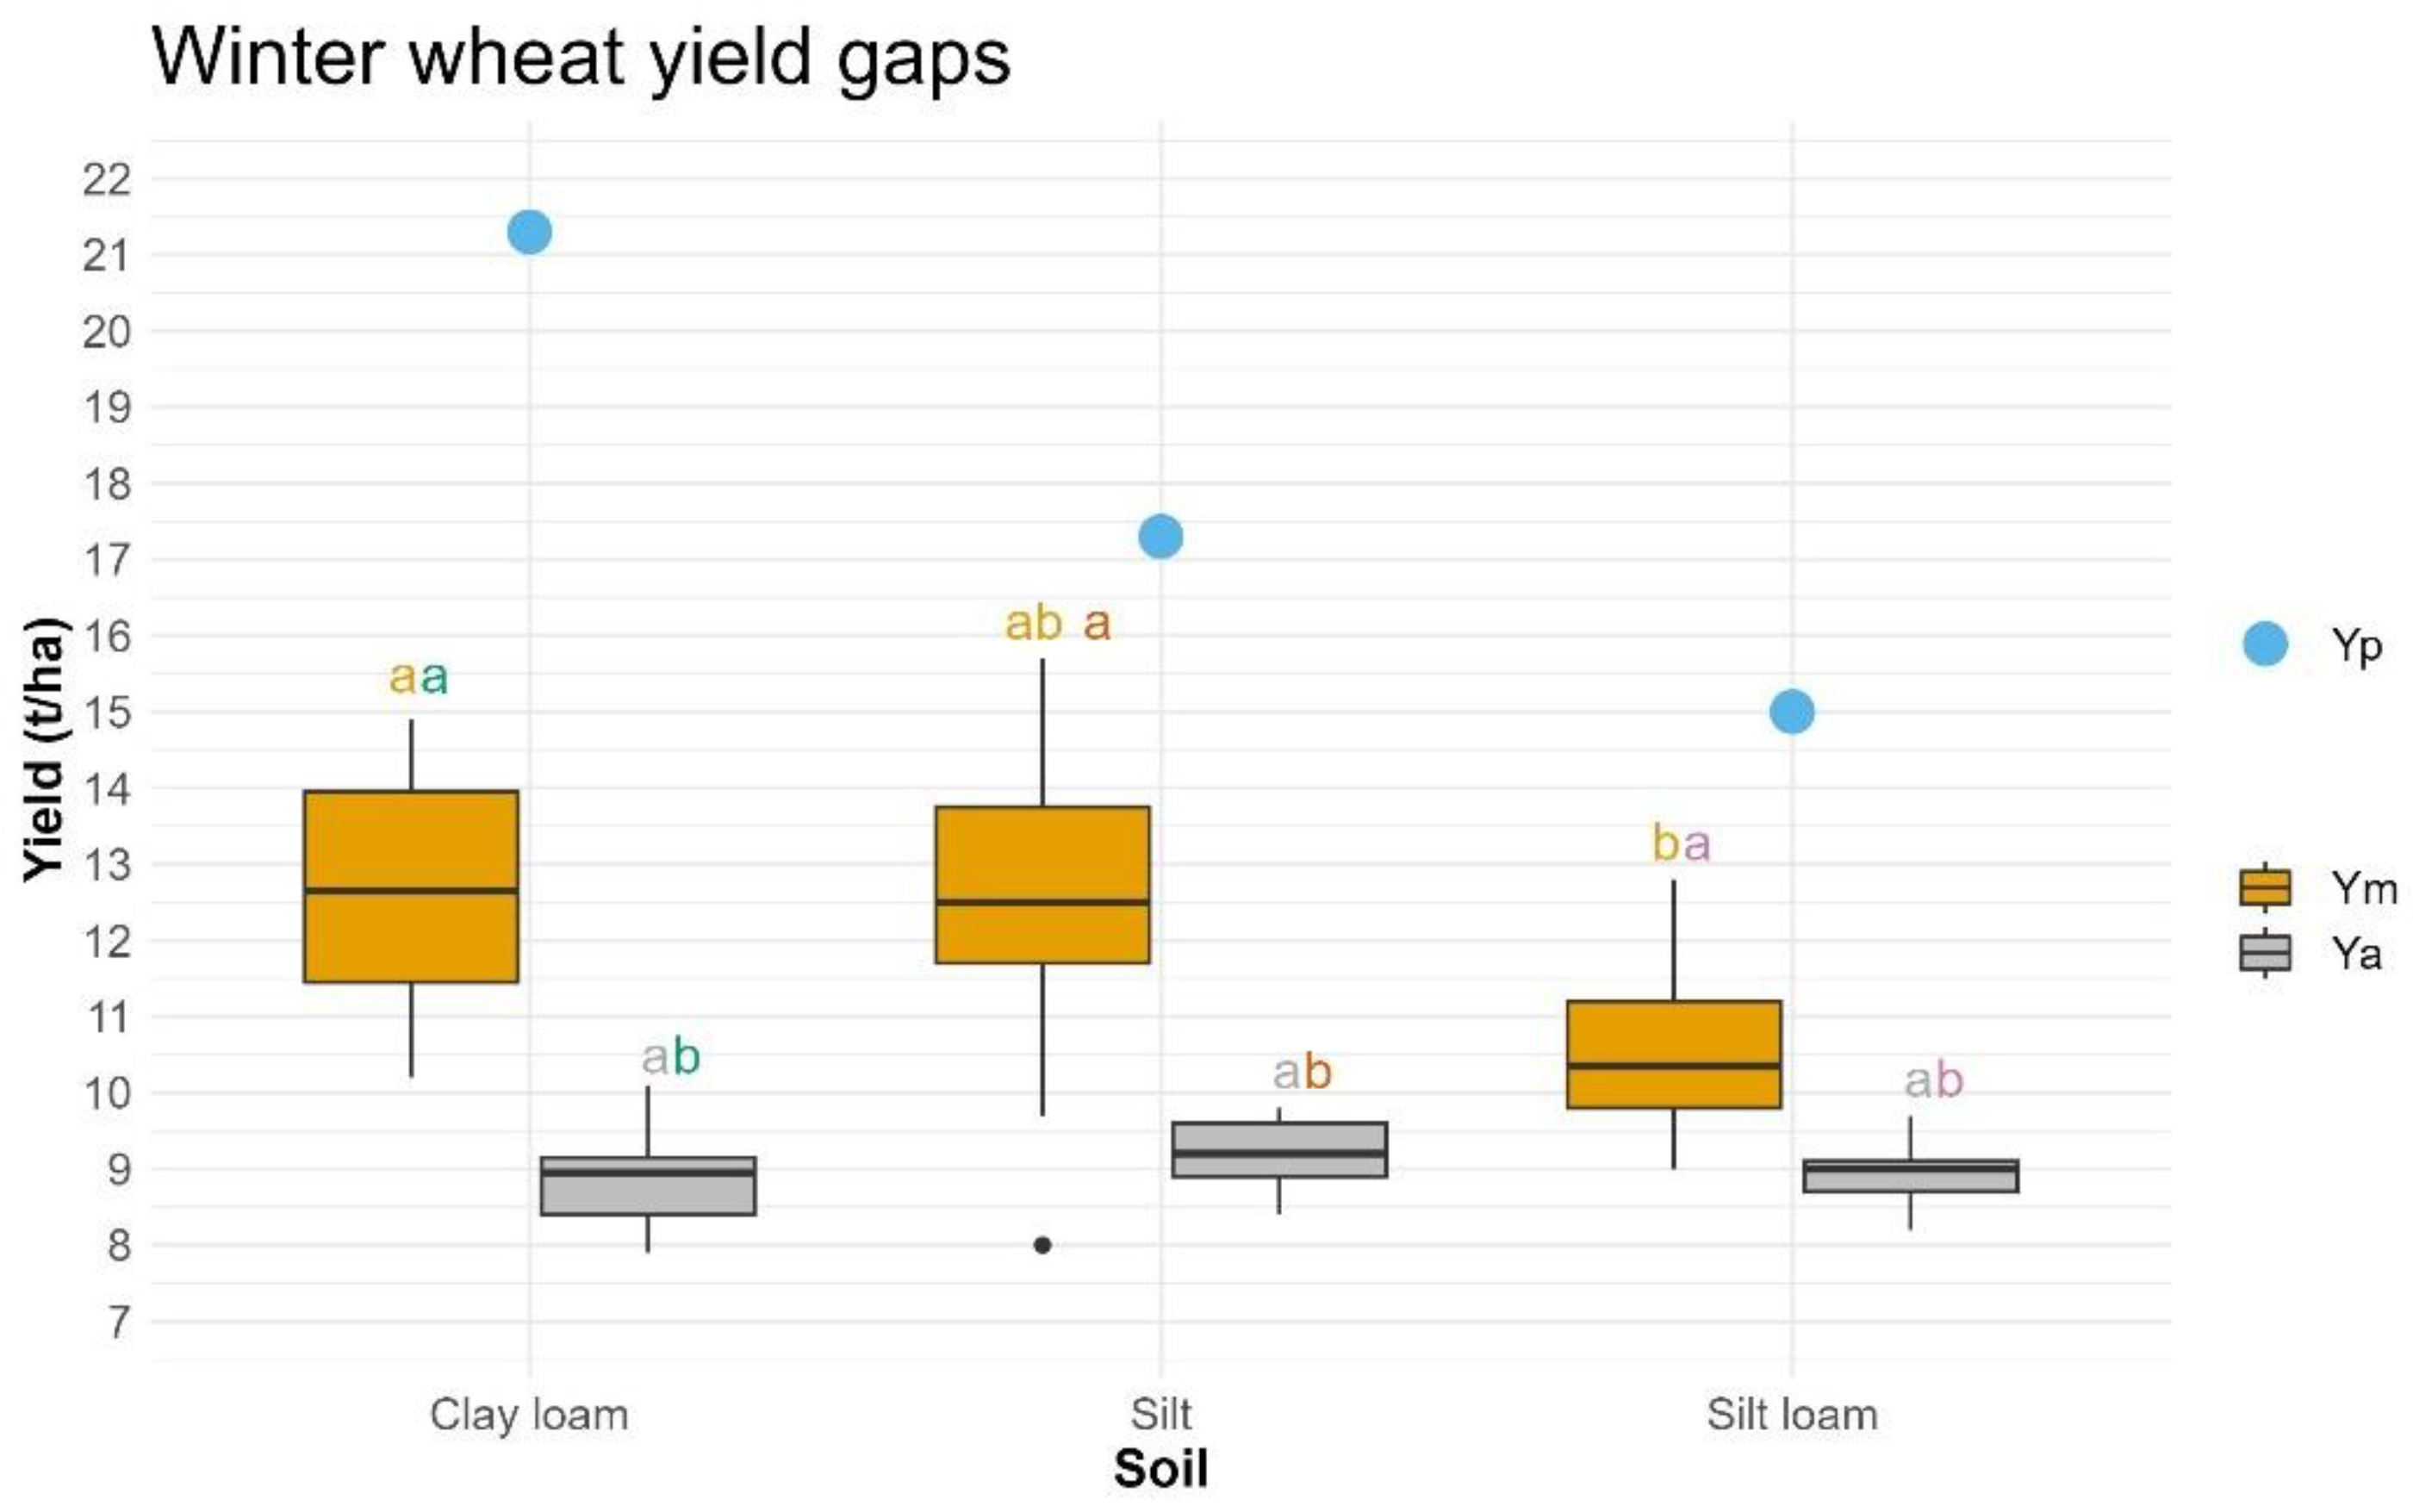
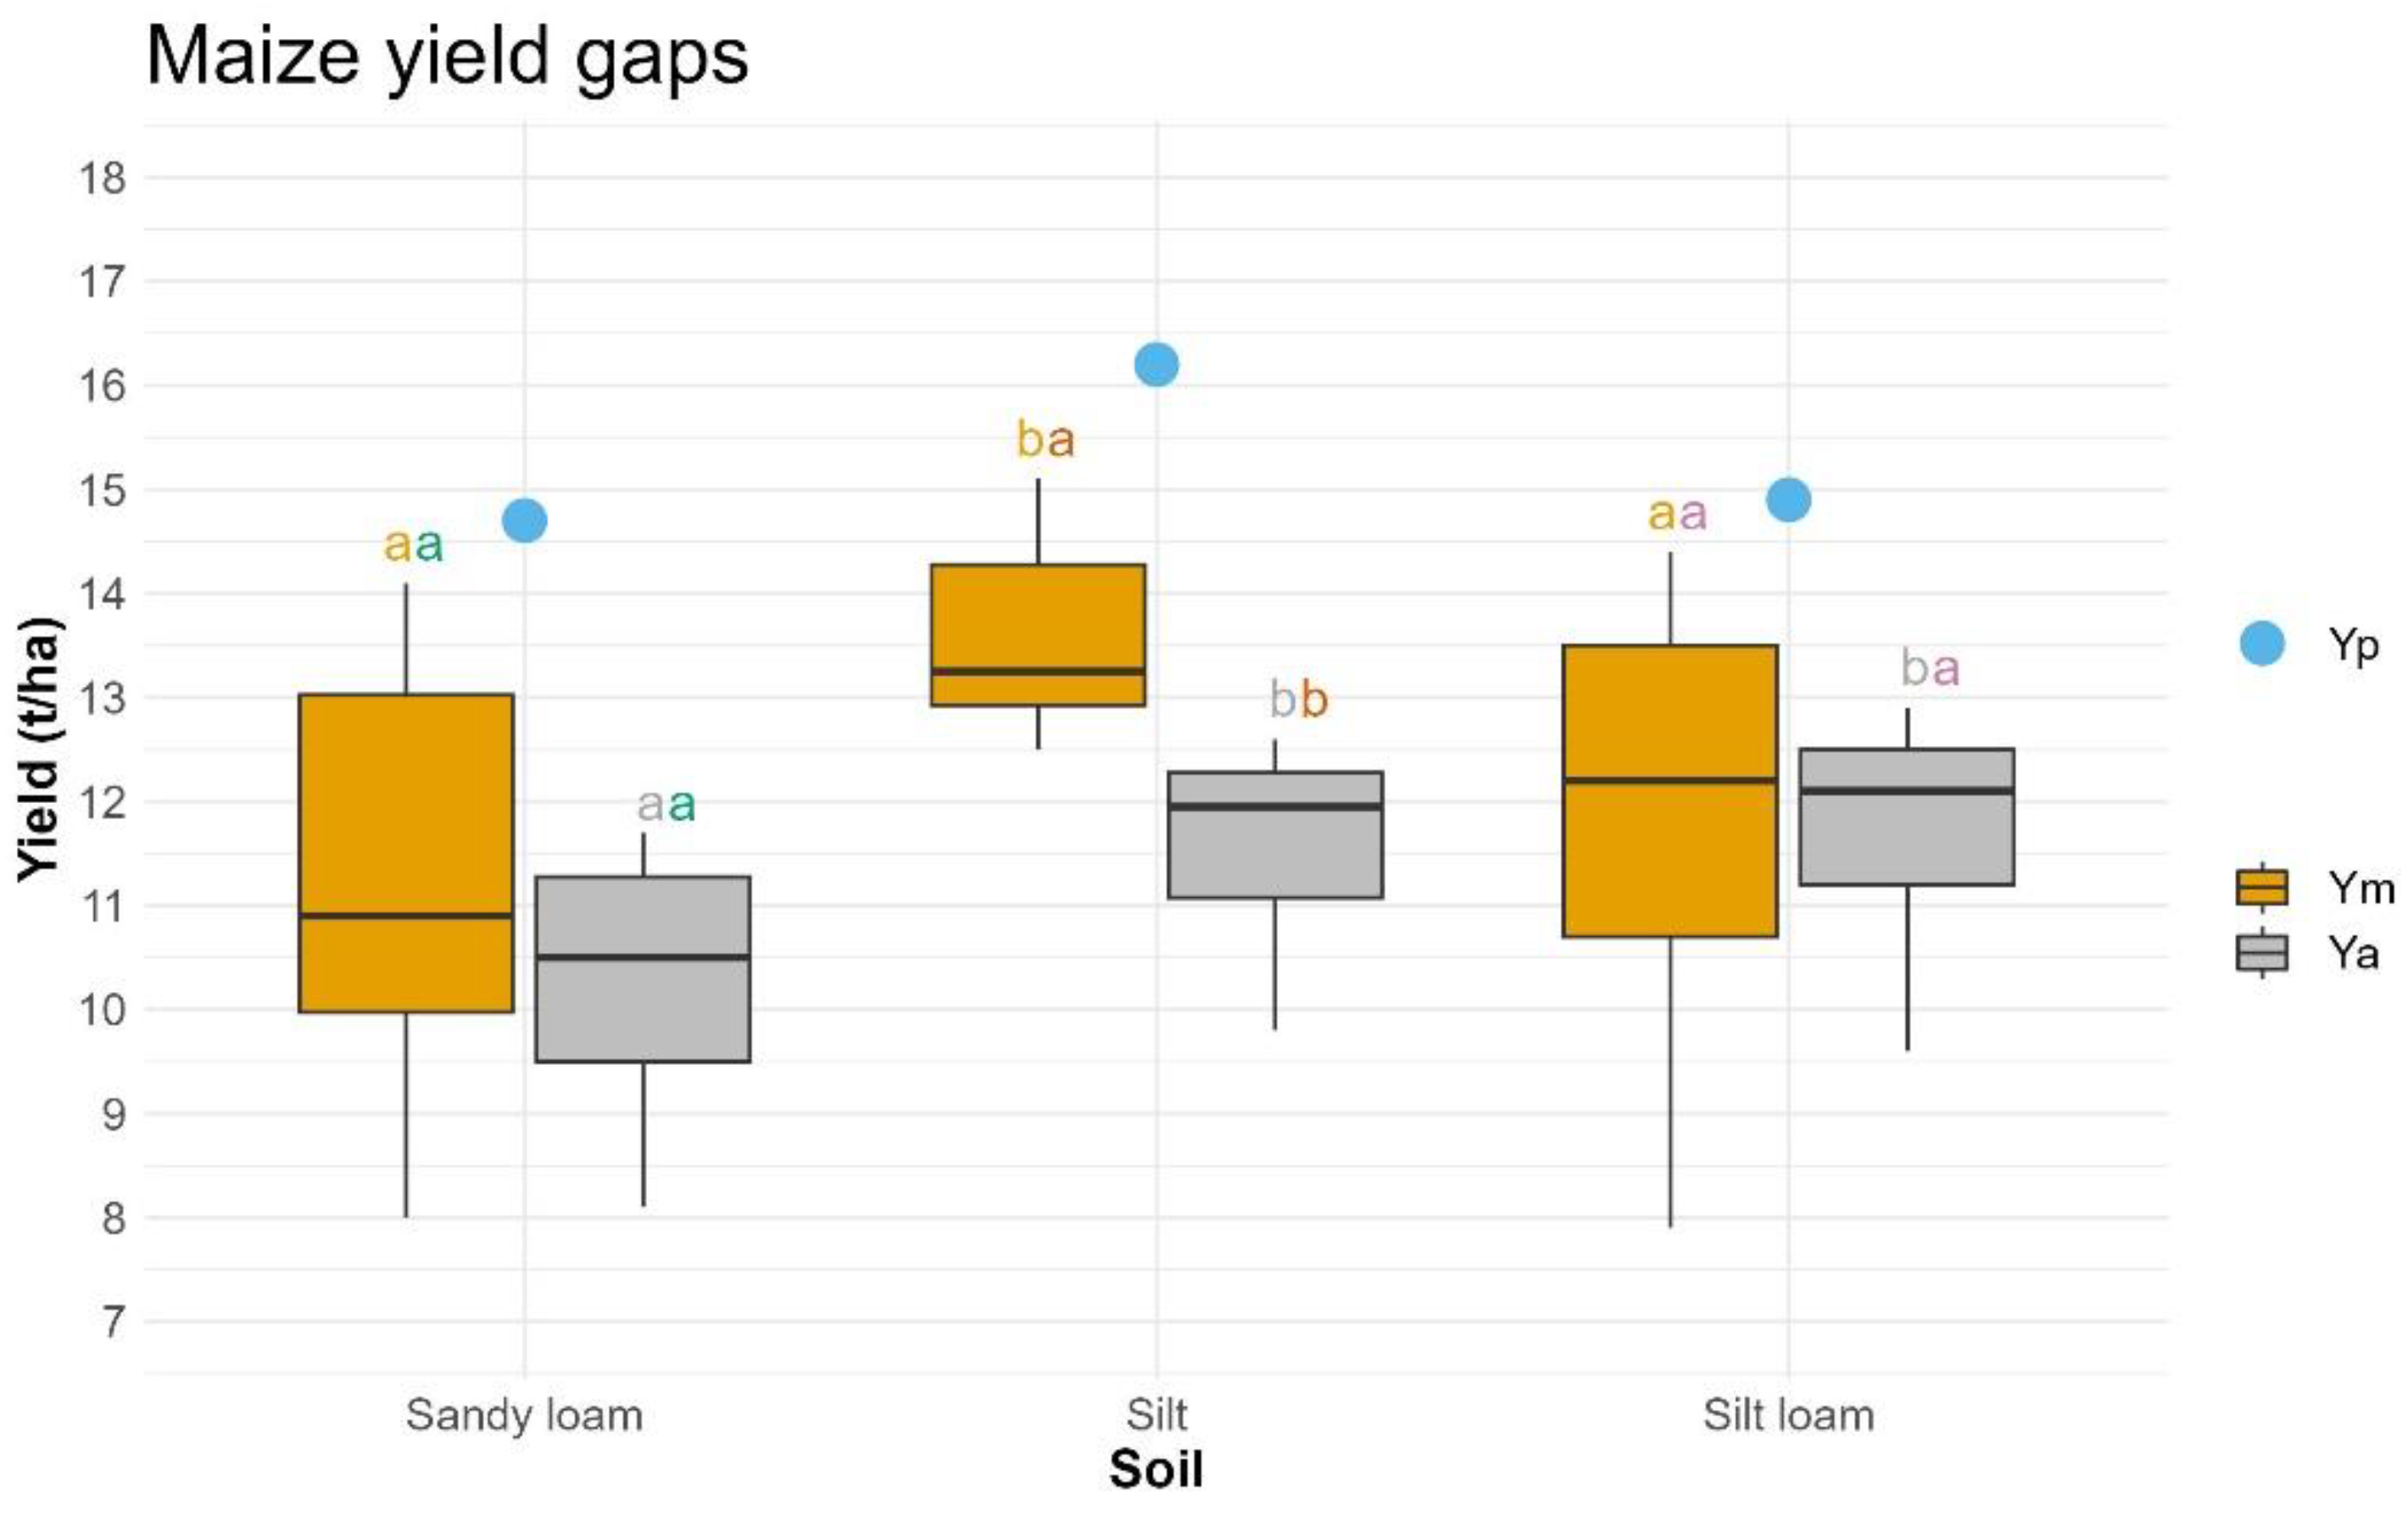
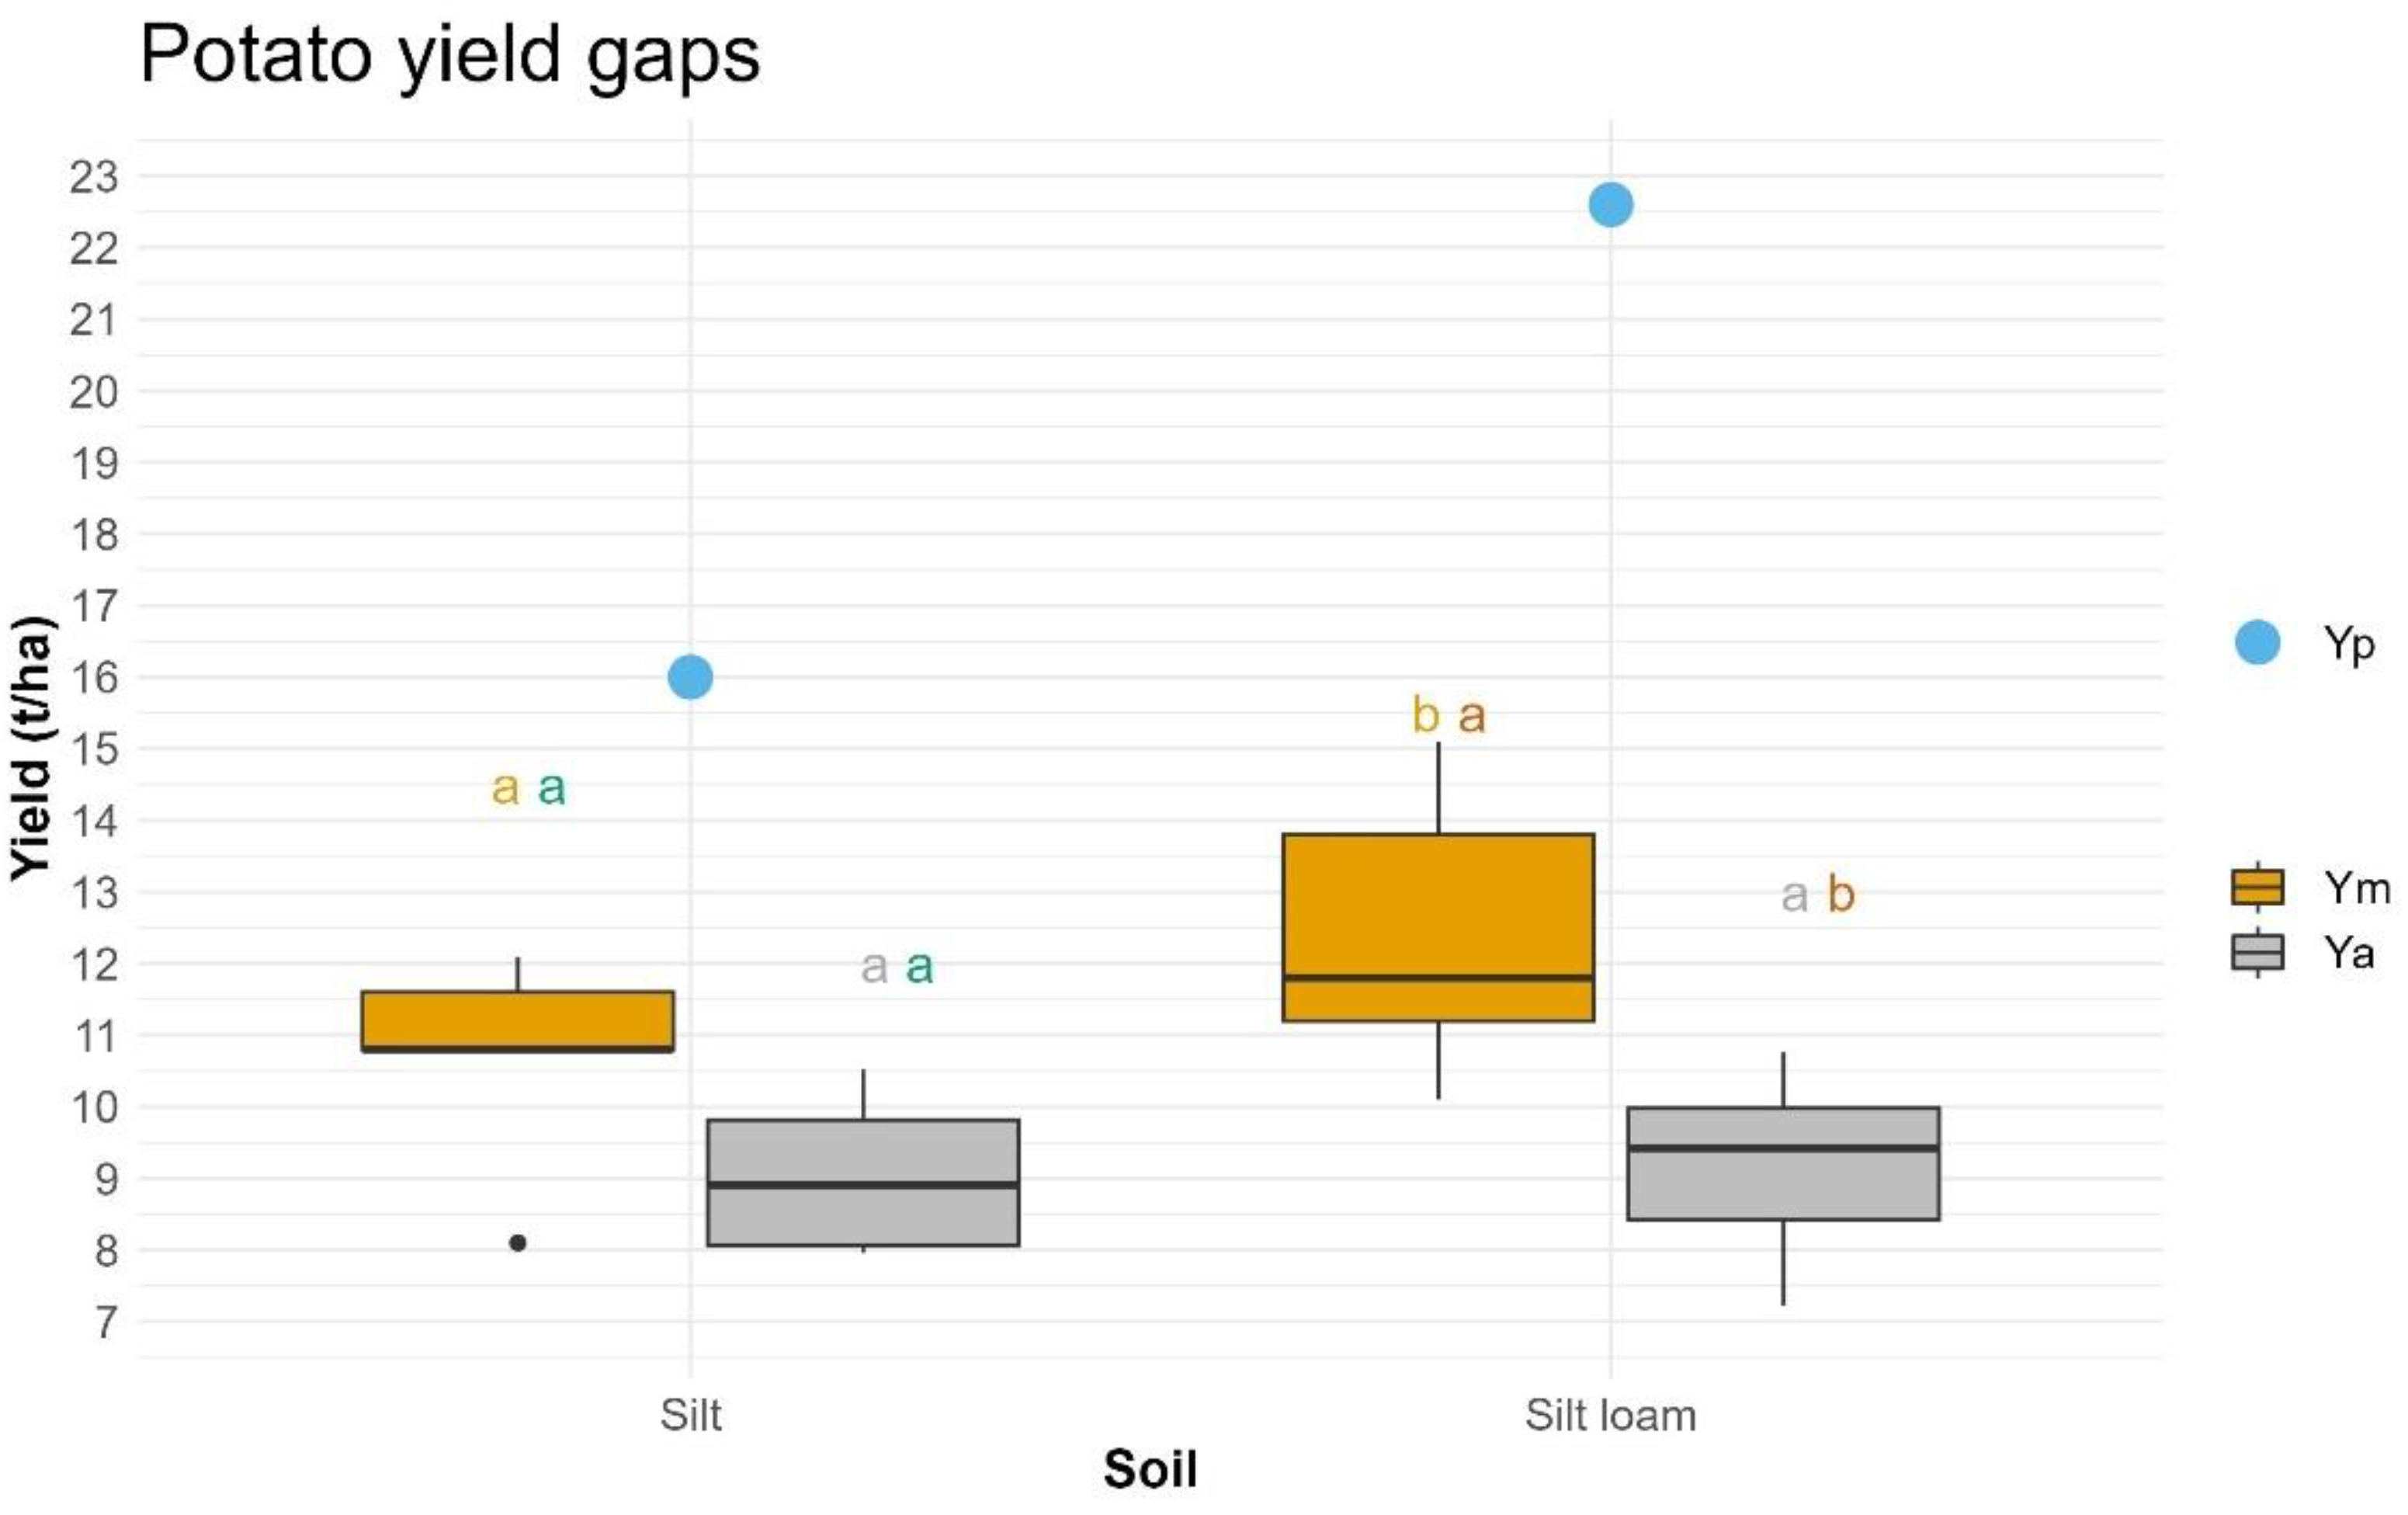
3.1.1. Yield Gaps

Figure 4, Figure 5 and Figure 6 show the yield gaps of winter wheat, maize and potato for the growing seasons of the 2011–2021 period.
Potential yields of winter wheat on clay loam (21.3 t.ha−1) were higher as compared with silt (17.3 t.ha−1) or silt loam (15 t.ha−1) (Figure 4). Averaged over the growing seasons, the optimal management yield was higher for clay loam (12.7 t.ha−1) as compared with silt (12.4 t.ha−1) and silt loam (10.6 t.ha−1). The difference was less pronounced for actual yield: 9 t.ha−1 for clay loam and silt compared with 8.6 t.ha−1 for silt loam. The highest yield gap for winter wheat was on clay loam. Under optimal management conditions, only 59% of the potential yield was obtained during the growing seasons of the 2011–2021 period, while on silt and silt loam it was 71%.
Potential yields for maize were the highest for silt (16.2 t.ha−1), followed by silt loam (14.9 t.ha−1) and sandy loam (14.7 t.ha−1) (Figure 5). Averaged over the growing seasons, the optimal management yield was higher for silt (13.6 t.ha−1) as compared with silt loam (11.8 t.ha−1) and sandy loam (11.3 t.ha−1). In contrast, the average actual yield on silt and silt loam were similar (11.6 resp. 11.8 t.ha−1), while on sandy loam the yield was significantly lower (9.1 t.ha−1). The lowest yield gap was obtained for maize on silt. Under optimal management conditions, 84% of the potential yield was obtained on silt, while this was only 79% and 77% for silt loam and sandy loam, respectively.
Potential dry yields for potato were higher on silt loam (22.6 t.ha−1) compared with silt (16.0 t.ha−1) (Figure 6). Averaged over the growing seasons, the optimal management yield was higher for silt loam (12.4 t.ha−1) as compared with silt (9.5 t.ha−1). The average actual yield was slightly higher on silt loam (9.1 t.ha−1) as compared with silt (8.7 t.ha−1). The yield gap, however, was higher for silt loam. Under optimal management conditions, 55% of the potential yield was obtained on silt loam as compared with 59% on silt.

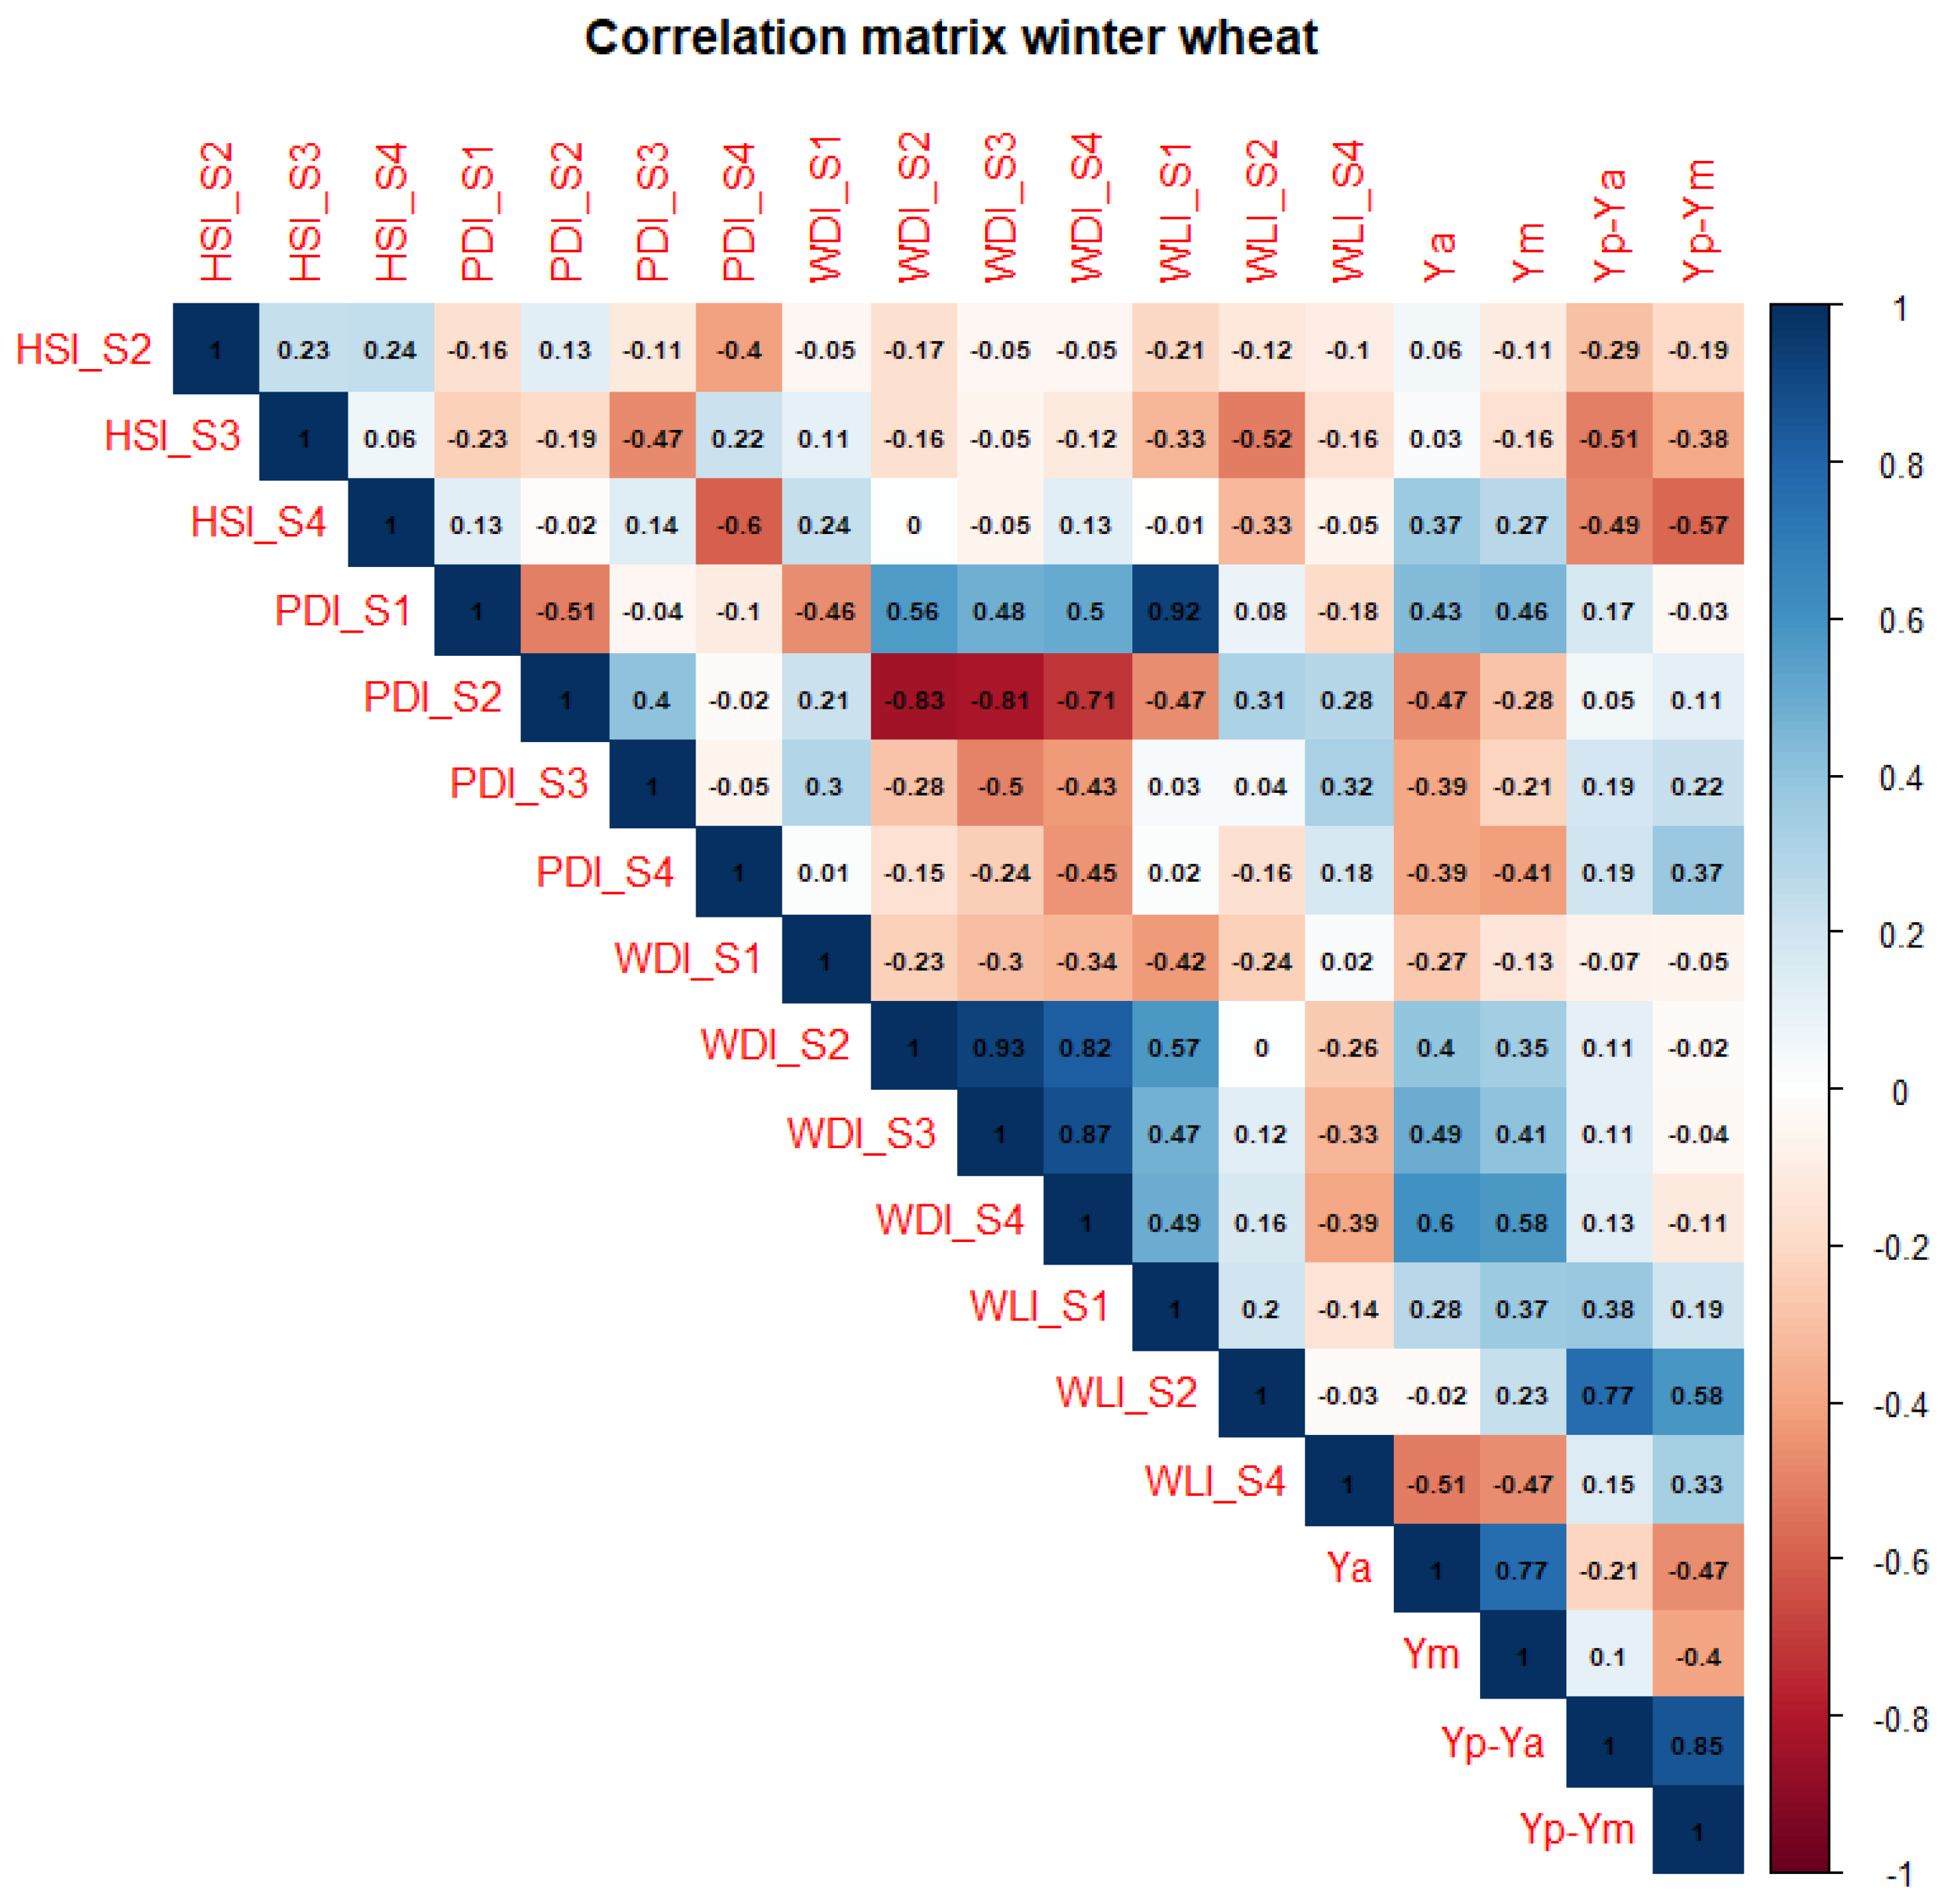
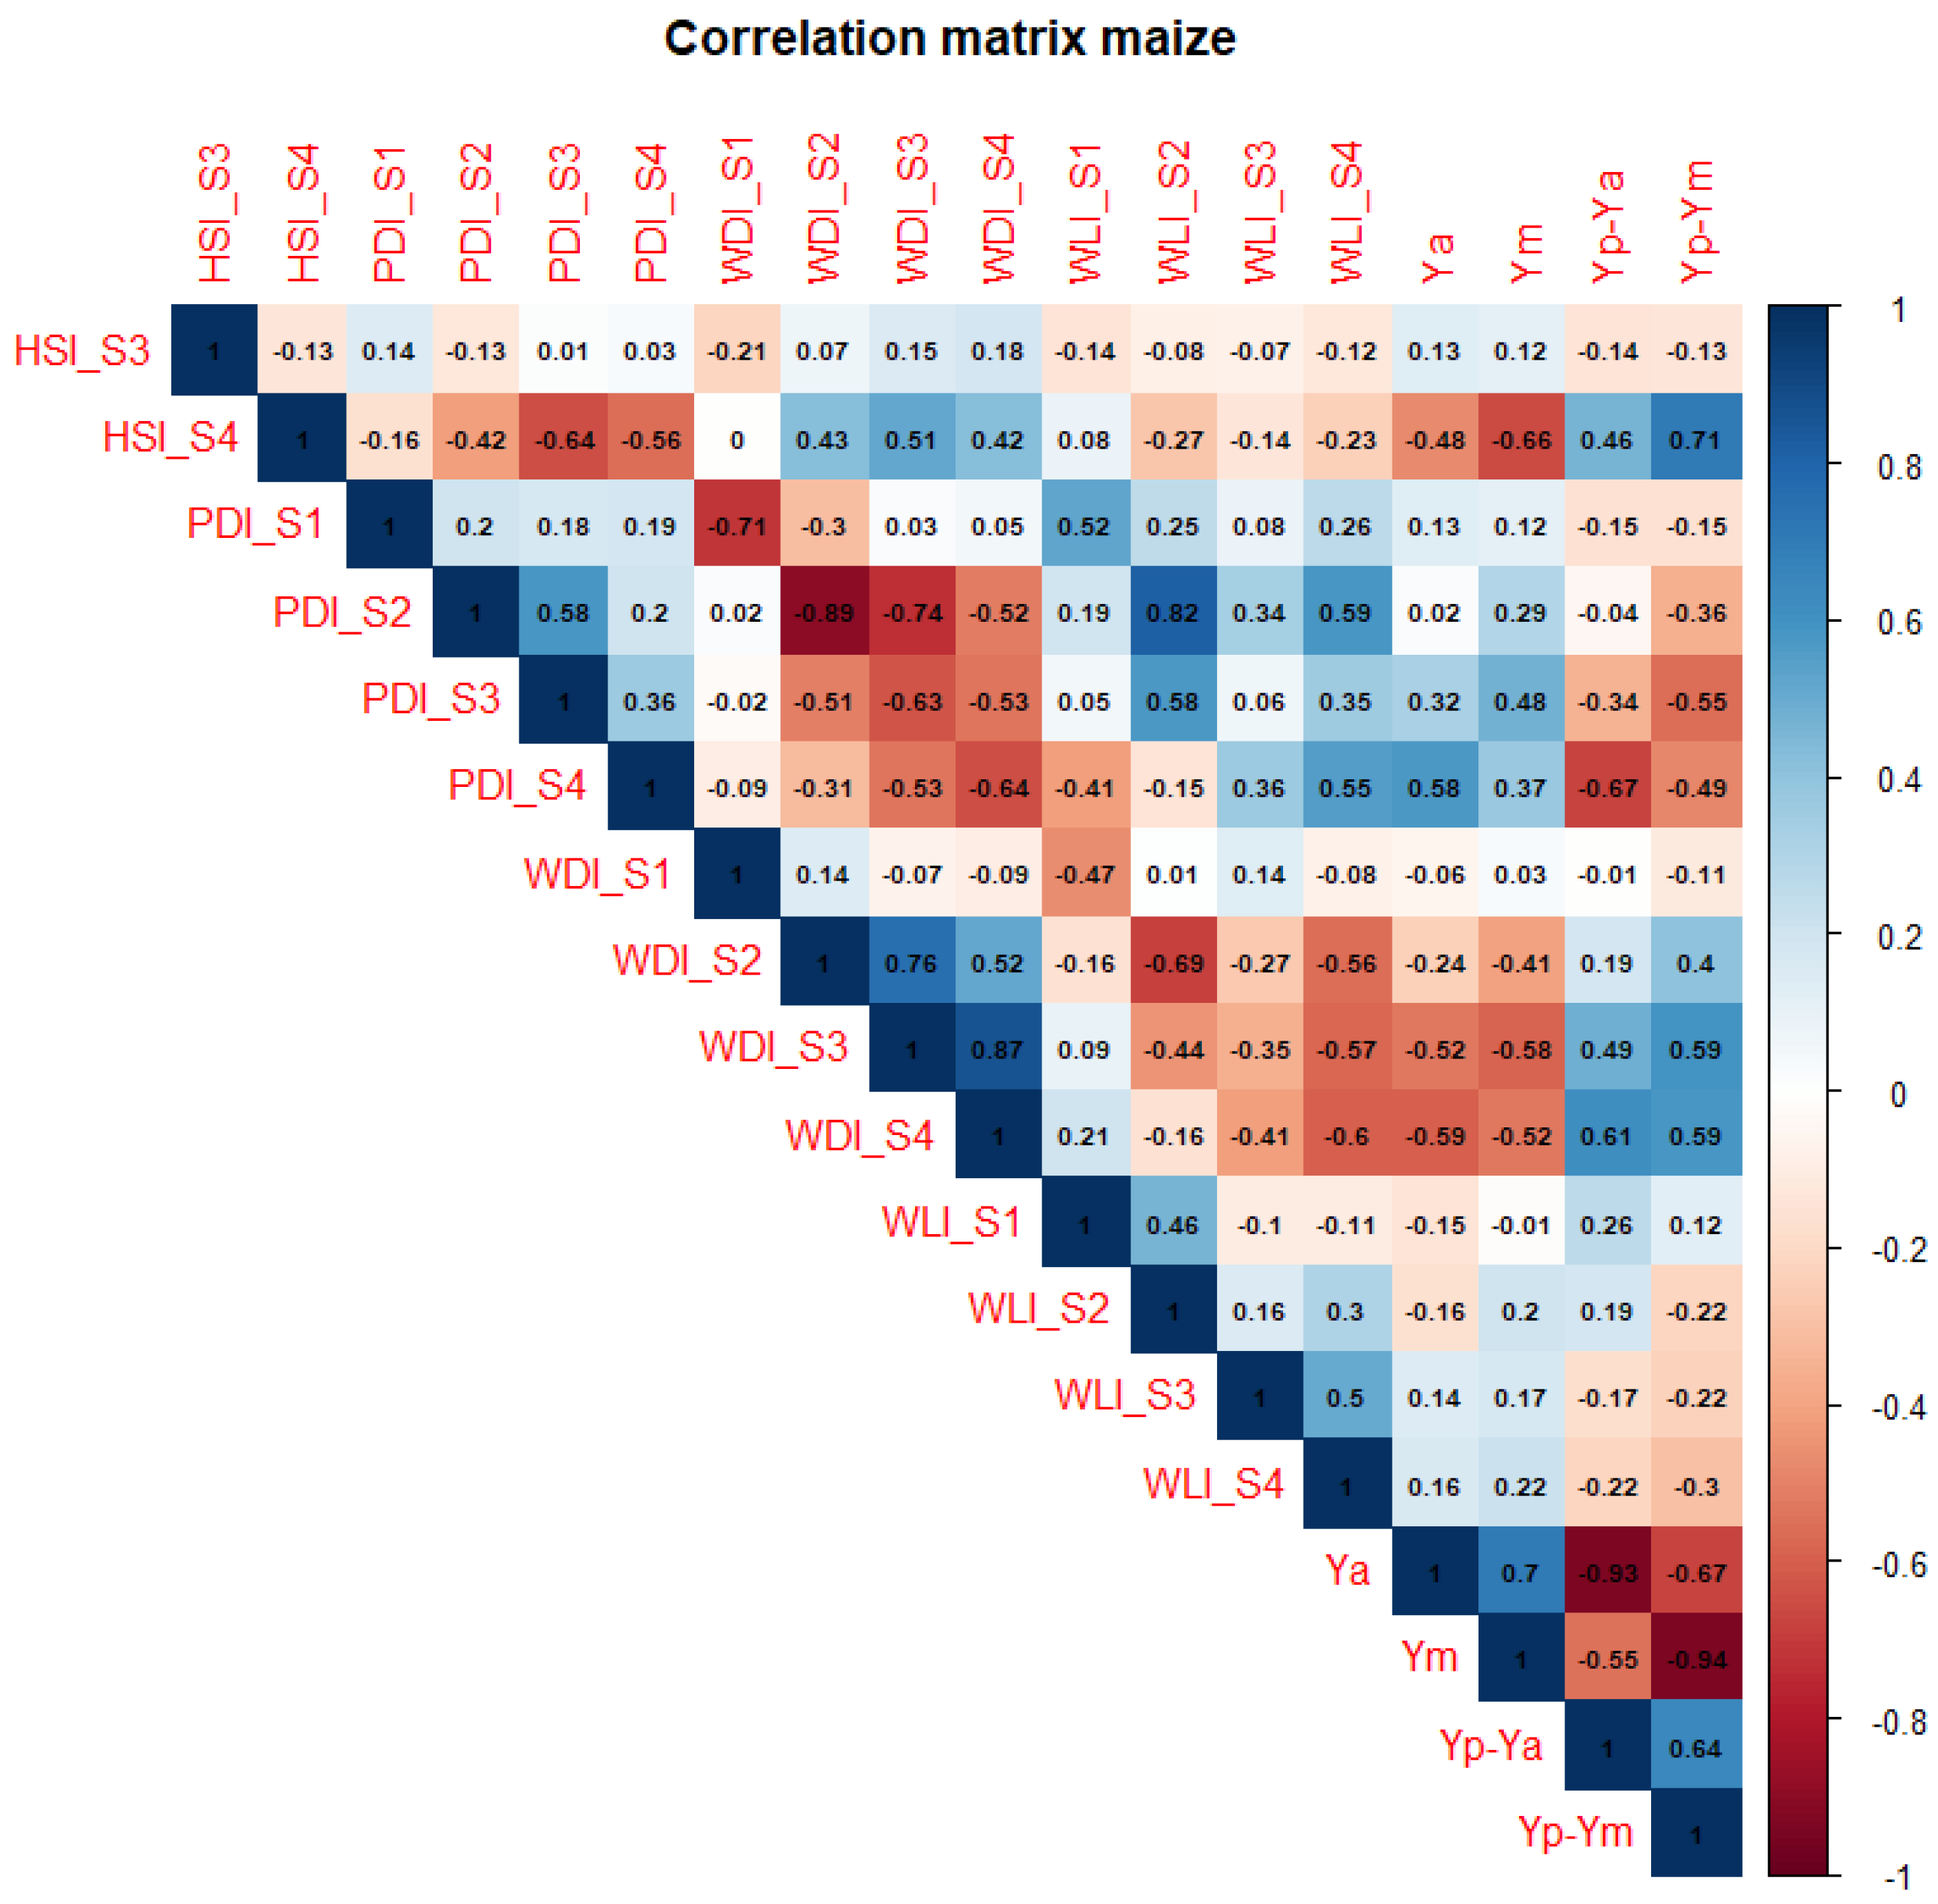
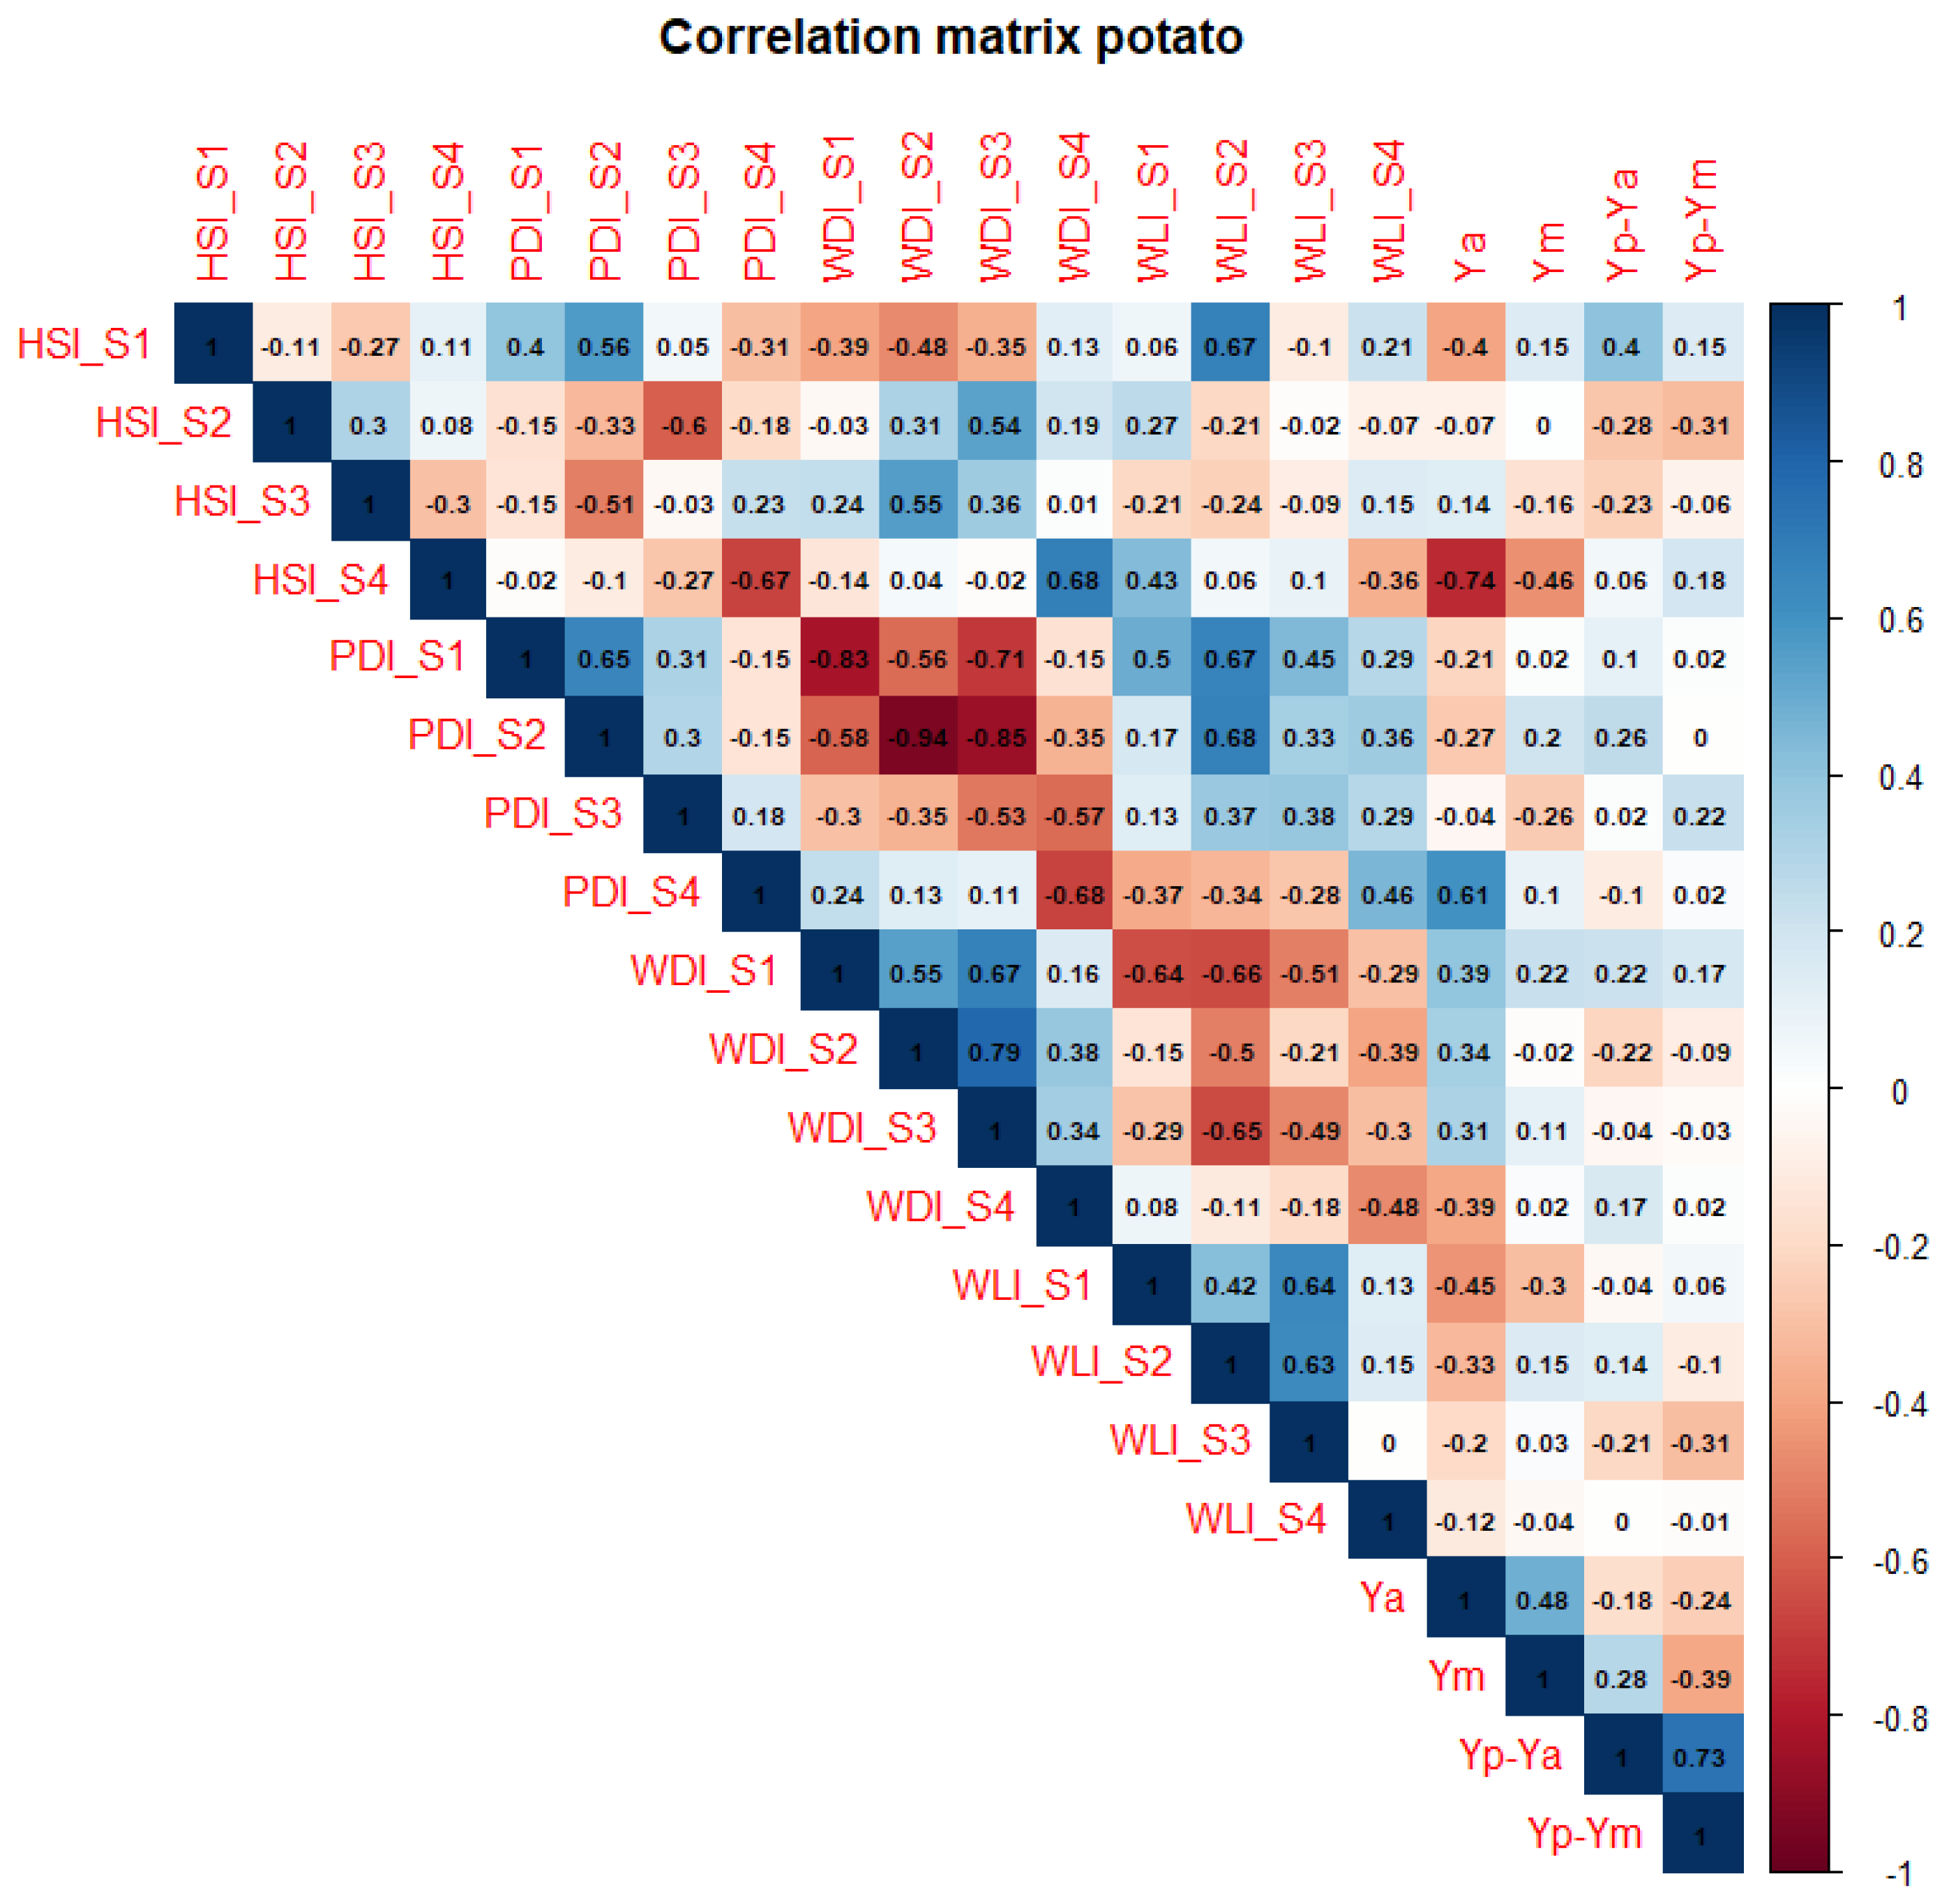
3.1.2. (Agro-)Meteorological Indicators

Figure 7, Figure 8 and Figure 9 show the correlation matrices for all variables: stage-bound (agro-)meteorological indicators, soil type, optimal management yield and yield gap and actual yield and yield gap. Table 6 shows the variables that have a significant correlation (alpha = 0.1) with the absolute yields and the yield gaps.
For winter wheat (Figure 7; Table 6), both optimal management and actual yields were highly correlated to water deficit and waterlogging during the grain filling and ripening stage. However, waterlogging during the grain filling and ripening stage only occurred in one season. Higher yields were observed at higher water deficit levels during vegetative growth, flowering, grain filling and ripening. This trend corresponded to the evolution in the precipitation deficit index, where higher yields were obtained at more negative values of the precipitation deficit index. Heat stress in winter wheat mainly occurred during flowering, grain filling and ripening, and the effect on yield was more pronounced during grain filling and ripening. Higher yields were obtained at temperatures higher than the optimum temperature. Both the optimal management and actual yield gaps were highly correlated with heat stress during flowering, grain filling and ripening and with waterlogging during the vegetative growth stage. Higher heat stress resulted in lower yield gaps and higher absolute yields, while higher waterlogging resulted in higher yield gaps and lower absolute yields.
For maize (Figure 8; Table 6), both optimal management and actual yields were highly correlated with heat stress during the grain filling and ripening stage and water deficit index during flowering and grain filling and ripening. The opposite trend for winter wheat was observed for the water deficit index. Yields dropped as the water deficit index increased during vegetative growth, flowering, grain filling and ripening. The trend in water deficit index corresponded to the trend in precipitation deficit index: higher yields were observed at higher values for the precipitation deficit index, closer to zero. Heat stress mainly occurred during grain filling and ripening. Lower yields were observed at higher heat stress. Throughout the growing season, maize was only marginally affected by waterlogging. Similar trends were observed for the optimal management and actual yield gaps, which were highly correlated with heat stress during grain filling and ripening, precipitation deficit during flowering and grain filling and ripening and water deficit during flowering and grain filling and ripening. Higher heat stress and higher water deficit resulted in higher yield gaps and lower yields, while higher precipitation deficit resulted in lower yield gaps and higher yields.
Potato optimal management yields (Figure 9; Table 6) were highly correlated with heat stress during the tuber bulking stage, while actual yields also showed a high correlation with precipitation deficit and water deficit during tuber bulking and waterlogging after planting. Actual yields were lower when the water deficit index decreased during tuber bulking. This corresponded with the trend in the precipitation deficit index, where yields increased with precipitation deficit. In contrast with the tuber bulking stage, a positive trend was observed for the water deficit index for actual yields during emergence, vegetative growth and tuber set. Heat stress in potato occurred in all crop growth stages, and the effect on both yield levels was most pronounced when heat stress occurred during tuber bulking. Lower yields were obtained at higher heat stress levels. Waterlogging occurred in all stages, but a slightly negative correlation was observed for actual yields and almost no correlation for optimally managed yields. In contrast to absolute yields, the optimal management had no significant correlation with any of the (agro-)meteorological variables, while the actual yield gap was only significantly correlated to heat stress during emergence.
Table 6 shows the variables that were significantly correlated (alpha = 0.1) with the yields and yield gaps of winter wheat, maize and potato. A small number of weather variables were significantly correlated with potato yield (gaps) as compared with winter wheat and maize yield (gaps).
Significant correlations were observed between explanatory variables, resulting in the muti-collinearity of regression and less reliable statistical inferences. However, the focus was on analyzing the explanatory value of all weather variables on yield. Figure 7, Figure 8 and Figure 9 show the goodness of fit of the multiple linear regression for winter wheat, maize and potato. Adding soil type as an explanatory variable improved the model goodness of fit, indicating that soil type is a key variable for explaining yield (gap) variability. For all three crops, the multiple linear regression models for actual yield (gap) had better goodness-of-fit indicators compared with the models for optimal management yield (gap). For actual yield (gap), a higher proportion of the variability (higher R2) was explained by the (agro-)meteorological variables as compared with the optimal management yield (gap).

4. Discussion

4.1. (Agro-)Meteorological Indicators, Yield and Yield Gap Variability

The reference harvest index (HI) was crop- and cultivar-specific and generally ranged between 45–50%, 48–52% and 70–85% for wheat, maize and potato, respectively [30]. The simulated harvest indices differed between the growing seasons of the 2011–2021 period. For winter wheat in 2016, HI was noticeably lower than its mean value. The 2016 spring was unusually wet [31] and disease pressure was high [39], resulting in large yield losses. AquaCrop, however, was not able to consider the disease pressure and simulated high yields due to ample water supply. This indicated that modeling of extreme weather is difficult, as multiple yield-reducing factors interact.
Simulated potential yields of winter wheat, maize and potato varied by region within Flanders due to differences in weather and soil type. Though the growing seasons varied largely in weather conditions and yields, the simulated potential yields were in line with previous research, thereby indicating a good performance of AquaCrop for crop yield simulation [30]. For winter wheat, the simulated potential yields were 15, 17.3 and 21.3 t.ha−1 for silt loam, silt and clay loam, respectively. The simulated genetic yield potential for rainfed winter wheat across Europe was 11 t.ha−1 to 13 t.ha−1, based on 13 sites [40]. In the study presented here, potential yield was simulated under optimal water supply and was therefore higher than the potential yield estimated by [40]. Simulated potential yields of maize were 14.7, 14.9 and 16.2 t.ha−1 on sandy loam, silt loam and silt, respectively. The simulated potential yields for rainfed maize ranged from 10.6 to 17.5 t.ha−1 across Europe and from 12–13 t.ha−1 for Belgium [41]. The differences with our study are explained by the water-limited potential yield and the country-averaged actual yields, as simulated by the crop growth model WOFOST calibrated for larger agro-ecological zones. Simulated potential yields for potato ranged from 89 t.ha−1 on silt to 113 t.ha−1 on silt loam, whereby fresh yields were corrected for wheel traffic lanes and headlands. Potential potato yields can be up to 128 t.ha−1, provided that irrigation is abundant, solar irradiation is high and the growing season is long [42]. In Belgium, solar radiation levels are relatively low and potential yields may reach around 88 t.ha−1 [42], which is similar to the lowest simulated potential yield in this study. On average, 65%, 80% and 57% of the potential yield was achieved for winter wheat, maize and potato, respectively, under optimal management conditions. Achieving potential yields may not be economically and environmentally desirable. Yields on farmers’ fields tend to reach a plateau at around 75–85% of the potential yield [16,17]. Achieving optimal crop and soil management is difficult, and the yield response to inputs follows the law of diminishing returns, so achieving potential yield may not be cost-effective for the farmer [16]. In addition, natural resource efficiency may decline as farm yields approach potential yields.
Winter wheat preferred high temperatures to wet conditions (Figure 7; Table 6). Higher yields were obtained with a higher water deficit index (lower soil water content relative to field capacity) and a lower precipitation deficit index (less rainfall relative to evaporative demand). Higher yields were observed at temperatures higher than optimal, suggesting that the winter wheat varieties cultivated in Flanders can tolerate high temperatures. Heat tolerance in winter wheat has also been reported by other studies. Winter wheat in Germany [9] was less sensitive to heat during flowering, grain filling and ripening than to drought and waterlogging. A greater percentage of low winter wheat yields in Belgium was explained by excessive rainfall during flowering than by combined heat and drought during the growing season [2]. A study of weather impacts on winter wheat cultivars in Europe indicated that several cultivars tolerated high temperatures, but it suggested that this may be partly explained by overall better weather conditions associated with higher temperatures [12]. For winter wheat in Japan, a negative correlation was found between yield gap and both air temperature and vapor pressure deficit at grain filling, but no significant correlation was found for rainfall [15]. Winter wheat yields and yield gaps were influenced by soil type, and (agro-)meteorological indicators better explained the variability in actual yield and yield gap as compared with optimal management yield and yield gap (Table 7).
Maize yields were the most vulnerable to heat stress during the grain filling and ripening stage and to water deficit index during flowering, grain filling and ripening (Figure 8; Table 6). For the studied growing seasons, heat stress mainly occurred during the grain filling and ripening stage, where lower yields were obtained at higher heat stress levels. Maize yields were negatively correlated with the water deficit index, while winter wheat yields were positively correlated. The opposite was true for the precipitation deficit index. Maize was more susceptible to drought in the 2011–2021 period compared with winter wheat. Although C4 crops have a higher water-use efficiency, the results of this study underline the importance of water availability and the absence of water deficit. Compared with winter wheat, the flowering date of maize occurs later in the year, when the frequency and intensity of (combined) heat and drought are higher [2]. The occurrence of (combined) heat and drought stress has affected cereal crops across Flanders and is projected to increase in the near future [19,33]. The sensitivity of maize to drought and heat stress was also reported in previous studies. In France, the predictive performance for extreme maize yield loss was high for both the temperature and precipitation indicators, but maize was found to be more vulnerable during the vegetative stage compared with the reproductive stage [10]. For a similar study in Germany, drought had a higher impact on maize yield than heat and waterlogging, and the impact was higher when the drought event occurred during flowering and grain filling [9]. Drought sensitivity in maize was also found in Belgium, where high rainfall was the indicator most associated with high yield [13]. However, another study on weather impacts on winter wheat in Belgium showed that yield variation was mainly explained by low temperatures and excessive rainfall and to a lesser extent by combined heat and drought [2]. Differences in results could be explained by a different analysis method, a different time window of the (agro-)meteorological variables studied or a difference in the frequency of occurrence of extreme weather conditions. Maize yields and yield gaps were influenced by soil type, and (agro-)meteorological indicators better explained the variability in actual yield (gap) as compared with optimal management yield (gap) (Table 8).
Both optimal management and actual potato yields were correlated with heat stress during tuber bulking, with higher heat stress resulting in lower yields (Figure 9; Table 6). The emergence stage was most susceptible to waterlogging. Potato yields in farmers’ fields were also highly correlated with the precipitation deficit index and the water deficit index during tuber bulking: yields increased when the ratio of rainfall to evaporative demand was more balanced and decreased when the soil water content dropped below field capacity. Optimal management and actual yield gaps showed overall less correlation with the (agro-)meteorological variables than absolute yields. In the Netherlands, drought during the growing season explained a large part of low potato yields, but most of the variability was explained by waterlogging at harvest [14]. In Belgium, combined heat and drought around tuber set explained most of the low yields, while waterlogging around planting also explained a large proportion of the variability [2]. Another study of weather impacts on potato in Belgium also indicated sensitivity to drought, and high rainfall was most associated with high yields [13]. Potato yield (gap) was also influenced by soil type, and (agro-)meteorological indicators better explained the variability in actual yield and yield gap compared with optimal management yield and yield gap (Table 9).
This study focuses on the effect of single adverse weather events. Compound events, such as the combined occurrence of heat and drought stress, can significantly affect yields [2]. The effect of a single event may not be significant, while the combined occurrence with another event may greatly reduce yields. Significant (alpha = 0.1) interaction effects were observed, but no multiple linear model was constructed due to lack of observations.

4.2. Effect of Soil and Management Practices

Especially for winter wheat and maize, soil type added to the explained variability. For optimal potato management and actual yields, the added value of soil type was not clear. Soil type is indirectly related to the agro-meteorological variables’ water deficit index and waterlogging index, as soil texture influences soil hydraulic characteristics. To further investigate the effect of soil type, separate correlation matrices per soil type were constructed (supplementary materials). Optimally managed maize yield on silt was significantly higher and had a lower yield variability compared with sandy loam and silt loam, indicating that crop yields on silt were less influenced by suboptimal weather conditions. Maize yields and yield gaps appear to be less correlated with weather variables on silt compared with silt loam and sandy loam (Figures S3–S6). For grain crops, the soil water holding capacity affected crop response to weather extremes due to its intrinsic relationship with soil texture [43].
The results of the multiple linear regression show that the prediction performance for actual yields and yield gaps is higher than for the optimal management yields and yield gaps for all three crops. The variation in actual yield and yield gap is better explained by weather variables, suggesting that optimal management practices mitigate the impact of adverse and extreme weather. Similarly, [44] advocated a decoupling of weather extremes and crop yield extremes due to irrigation, and [14] speculated a decoupling due to fungicide use.

4.3. Limitations and Future Perspectives

For the identification of weather–yield relationships using time-series analysis, long yield time series (≥10 y) are examined, as greater interannual weather and yield variability improve the validity of the results [12]. For Flanders, considerable weather and yield variability was observed during the 2011–2021 growing seasons. Weather conditions ranged from “normal” to “unusually” wet, dry or warm compared with the 30-year average [31], and both “extremely” high (90th percentile) and low (10th percentile) yields compared with the 30-year average were obtained [26]. The impact of certain weather extremes may be over- or underestimated if the frequency of occurrence during the period studied differs from that of other weather extremes [14], and therefore, not all adverse weather conditions were equally considered in this study. For instance, the occurrence of heat stress around early growth stages and waterlogging around late growth stages did not occur frequently during the 2011–2021 growing seasons.
The use of long yield time series most often requires detrending, as overall yields may increase due to technological improvements and climate change [7]. By detrending yield time series, the interannual yied variability is better captured, and as interannual yield variability is associated with weather variability, the impact of weather extremes can be more accurately analyzed. No detrending was performed, as a maximum of 10 consecutive growing seasons was examined. In addition, yield stagnation has been observed for several crop types in Europe [7,45].
Other improvements include the use of longer (detrended) time series. Variety trials are organized each growing season to test the performance of several cultivars. Information from future field trials could be added to the current database. Future investigations could also look at nonlinear yield responses to weather extremes and the impact of compound events.

5. Conclusions

A yield gap analysis was carried out on 10 years of field trial data, and (agro-)meteorological indicators were related to the size of the yield gap between potential and management yield and between potential and actual yield. Temperature- and water-related indices were calculated for the main crop growth stages of winter wheat, maize and potato: emergence, vegetative growth, flowering/tuber set and grain filling and ripening/tuber bulking.
The yield gap approach allowed weather-related risk assessment, which in turn enables the formulation of adaptation or mitigation strategies at the field to farm scale. Winter wheat preferred higher temperatures at grain filling and was negatively affected by wet conditions throughout the growing season. Additional efforts are needed to reduce drought stress, such as improved varieties or mulching, and to improve field drainage. Maize was particularly vulnerable to drought throughout the growing season. Although C4 crops have a higher water-use efficiency, the results underline the importance of water availability and the absence of water deficit. Adaptation and mitigation strategies for maize should focus on reducing drought stress through improved varieties, irrigation or mulching. Potato was especially susceptible to heat and drought stress during tuber bulking and to waterlogging during the early growth stages, hence the importance of heat-tolerant varieties, proper soil management and good drainage practices to close the potato yield gap.
The (agro-)meteorological indicators better explained the variability in the actual yield gap compared with the optimal management yield gap for all three crops. Optimal management practices could therefore mitigate the impact of adverse and extreme weather and should be considered in future climate impact studies.

Supplementary Materials

The following supporting information can be downloaded at: https://www.mdpi.com/article/10.3390/agronomy13041104/s1. Figure S1. Correlation matrix for winter wheat on silt with potential yield (YM), optimal management yield (YM) and actual yield (YA). Heat stress index (HSI), precipitation deficit index (PDI), water deficit index (WDI) and waterlogging index (WLI) for emergence (S1), vegetative growth (S2), flowering (S3) and grain filling and ripening (S4). Figure S2. Correlation matrix for winter wheat on silt loam with potential yield (YM), optimal management yield (YM) and actual yield (YA). Heat stress index (HSI), precipitation deficit index (PDI), water deficit index (WDI) and waterlogging index (WLI) for emergence (S1), vegetative growth (S2), flowering (S3) and grain filling and ripening (S4). Figure S3. Correlation matrix for winter wheat on clay loam with potential yield (YM), optimal management yield (YM) and actual yield (YA). Heat stress index (HSI), precipitation deficit index (PDI), water deficit index (WDI) and waterlogging index (WLI) for emergence (S1), vegetative growth (S2), flowering (S3) and grain filling and ripening (S4). Figure S4. Correlation matrix for maize on silt with potential yield (YM), optimal management yield (YM) and actual yield (YA). Heat stress index (HSI), precipitation deficit index (PDI), water deficit index (WDI) and waterlogging index (WLI) for emergence (S1), vegetative growth (S2), flowering (S3) and grain filling and ripening (S4). Figure S5. Correlation matrix for maize on silt loam with potential yield (YM), optimal management yield (YM) and actual yield (YA). Heat stress index (HSI), precipitation deficit index (PDI), water deficit index (WDI) and waterlogging index (WLI) for emergence (S1), vegetative growth (S2), flowering (S3) and grain filling and ripening (S4). Figure S6. Correlation matrix for winter wheat on sandy loam with potential yield (YM), optimal management yield (YM) and actual yield (YA). Heat stress index (HSI), precipitation deficit index (PDI), water deficit index (WDI) and waterlogging index (WLI) for emergence (S1), vegetative growth (S2), flowering (S3) and grain filling and ripening (S4). Figure S7. Correlation matrix for potato on silt with potential yield (YM), optimal management yield (YM) and actual yield (YA). Heat stress index (HSI), precipitation deficit index (PDI), water deficit index (WDI) and waterlogging index (WLI) for emergence (S1), vegetative growth (S2), flowering (S3) and grain filling and ripening (S4). Figure S8. Correlation matrix for maize on silt loam with potential yield (YM), optimal management yield (YM) and actual yield (YA). Heat stress index (HSI), precipitation deficit index (PDI), water deficit index (WDI) and waterlogging index (WLI) for emergence (S1), vegetative growth (S2), flowering (S3) and grain filling and ripening (S4).

Author Contributions

F.V.: data curation, formal analysis, investigation and writing (original draft). A.G.: conceptualization, writing (review and editing), supervision, project administration and funding acquisition. All authors have read and agreed to the published version of the manuscript.

Funding

The research received funding from KU Leuven internal research funding. The APC was funded by EC grant agreement 818187.

Data Availability Statement

The data presented in this study are available on request from the corresponding author.

Acknowledgments

The authors thank the agricultural research institutes that provided field trial data for maize (Landbouwcentrum Voedergewassen; LCV), winter wheat (Inagro) and potato (Proefcentrum voor de Aardappelteelt; PCA). Thanks are also extended to the Belgian Statistical Office for historic yield data and the Royal Meteorological Institute (RMI) for historic weather data.

Conflicts of Interest

The authors declare no conflict of interest.

Appendix A

Table A1. Conversion of textural classes from the Belgian soil classification to the USDA soil classification, adapted from [46,47].
Textural Class Belgium Mean Weight % of the Fractions for BelgiumCorresponding USDA Class
Sand (50 μm–2 mm) Silt (2 μm–50 μm) Clay (<2 μm)
Z9082Sand
S75205Loamy Sand
P60355Sandy Loam
L306010Silt Loam
A58510Silt
E353530Clay Loam
U155015Clay

Appendix B

Table A2. Relevant conservative and nonconservative crop parameters in AquaCrop for winter wheat.
Parameter Description Symbol (Units) Literature [30]Adjusted Files
Conservative parameters
Base temperature Tbase (°C) 00
Upper temperature Tupper (°C) 2626
Soil surface covered by an individual seedling at 90% emergence CC0 (cm²/plant) 1.51.5
Normalized water productivity WP* (g/m²) 1515
Allowable maximum increase of specified harvest index /(%) 1515
Upper threshold for canopy expansion pupper (-) 0.200.20
Lower threshold for canopy expansion plower (-) 0.650.65
Upper threshold for stomatal closure pupper (-) 0.650.65
Lower threshold for stomatal closure /(-) PWPPWP
Upper threshold for early canopy senescence pupper (-) 0.700.70
Lower threshold for early canopy senescence /(-) PWPPWP
Nonconservative parameters
Plant density /(plants/ha) 2,000,000–7,000,000 observed density
Maximum effective rooting depth Zx (m) up to 2.4 1.5
Reference harvest index HI0 (%) 45–50 simulated:
31–86
Maximum canopy cover CCx (%) 80–99 96
Sowing date /(date) / observed sowing date
Time from sowing to emergence /(date or GDD) 100–250 GDD 14 days from sowing
Date when maximum canopy cover is reached /(date) / 5 days before flowering
Date when maximum rooting depth is reached /(date) / 5 days before flowering
Date when senescence sets in /(date) / 14 days before harvest
Date when maturity is reached /(date) / observed harvest date
Date when flowering starts /(date) / observed flowering date
Duration of flowering /(date or GDD) 150–280 GDD 14 days from start flowering
Table A3. Relevant conservative and nonconservative crop parameters in AquaCrop for maize.
Parameter Description Symbol (Units) Literature [30]Adjusted Files
Conservative parameters
Base temperature Tbase (°C) 8 8
Upper temperature Tupper (°C) 30 30
Soil surface covered by an individual seedling at 90% emergence CC0 (cm²/plant) 6.50 6.50
Normalized water productivity WP* (g/m²) 33.7 33.7
Allowable maximum increase of specified harvest index /(%) 15 15
Upper threshold for canopy expansion pupper (-) 0.14 0.35
Lower threshold for canopy expansion plower (-) 0.72 0.70
Upper threshold for stomatal closure pupper (-) 0.69 0.75
Lower threshold for stomatal closure /(-) PWP PWP
Upper threshold for early canopy senescence pupper (-) 0.69 0.80
Lower threshold for early canopy senescence /(-) PWP PWP
Nonconservative parameters
Plant density /(plants/ha) 50,000–100,000 observed plant density
Maximum effective rooting depth Zx (m) up to 2.8 2
Reference harvest index HI0 (%) 48–52 simulated:
27–48
Maximum canopy cover CCx (%) 65–99 96
Sowing date /(date) / observed sowing date
Time from sowing to emergence /(date or GDD) 60–100 GDD 100 GDD from sowing converted to calendar days
Date when maximum canopy cover is reached /(date) / 5 days before flowering
Date when maximum rooting depth is reached /(date) / 5 days before flowering
Date when senescence sets in /(date) / 14 days before harvest
Date when maturity is reached /(date) / observed harvest date
Date when flowering starts /(date) / observed flowering date
Duration of flowering /(date or GDD) 150–200 GDD 14 days
Table A4. Relevant conservative and nonconservative crop parameters in AquaCrop for potato.
Parameter Description Symbol (Units) Literature [30]Adjusted Files
Conservative parameters
Base temperature Tbase ( °C) 2 2
Upper temperature Tupper ( °C) 26 26
Soil surface covered by an individual seedling at 90% emergence CC0 (cm²/plant) 10–20 20
Normalized water productivity WP* (g/m²) 18–20 20
Allowable maximum increase of specified harvest index /(%) 5 5
Upper threshold for canopy expansion pupper (-) 0.20 0.20
Lower threshold for canopy expansion plower (-) 0.60 0.60
Upper threshold for stomatal closure pupper (-) 0.60 0.60
Lower threshold for stomatal closure /(-) PWP PWP
Upper threshold for early canopy senescence pupper (-) 0.70 0.70
Lower threshold for early canopy senescence /(-) PWP PWP
Nonconservative parameters
Plant density /(plants/ha) 30,000–60,000 observed plant density
Maximum effective rooting depth Zx (m) 0.750.75
Reference harvest index HI0 (%) 70–85simulated:
33–77
Maximum canopy cover CCx (%) 90–9892
Planting date /(date) / observed planting date
Time from planting to recovery (emergence)/(date or GDD) 150–250200 GDD from planting converted to calendar days
Date when maximum canopy cover is reached /(date) / date of tuber set
Date when maximum rooting depth is reached /(date) / date of tuber set
Date when senescence sets in /(date) / observed date of haulm killing
Date when maturity is reached /(date) / observed harvest date
Date when yield formation starts /(date) / 21 June [2]

References

  1. Ceglar, A.; Toreti, A.; Lecerf, R.; Van der Velde, M.; Dentener, F. Impact of meteorological drivers on regional inter-annual crop yield variability in France. Agric. For. Meteorol. 2016, 216, 58–67. [Google Scholar] [CrossRef]
  2. Gobin, A. Weather related risks in Belgian arable agriculture. Agric. Syst. 2018, 159, 225–236. [Google Scholar] [CrossRef]
  3. IPCC. Climate Change 2014: Synthesis Report; Contribution of Working Groups I, II and III to the Fifth Assessment Report of the Intergovernmental Panel on Climate Change; Pachauri, R.K., Meyer, L.A., Eds.; IPCC: Geneva, Switzerland, 2014; 151p. [Google Scholar]
  4. World Meteorological Organisation. Weather Extremes in a Changing Climate: Hindsight on Foresight; Communications and Public Affairs Office: Geneva, Swizerland, 2011. [Google Scholar]
  5. Ray, D.K.; Gerber, J.S.; MacDonald, G.K.; West, P.C. Climate variation explains a third of global crop yield variability. Nat. Commun. 2015, 6, 5989. [Google Scholar] [CrossRef] [PubMed] [Green Version]
  6. Trnka, M.; Olesen, J.E.; Kersebaum, K.C.; Skjelvåg, A.O.; Eitzinger, J.; Seguin, B.; Peltonen-Sainio, P.; Rötter, R.; Iglesias, A.; Orlandini, S.; et al. Agroclimatic conditions in Europe under climate change. Glob. Change Biol. 2011, 17, 2298–2318. [Google Scholar] [CrossRef] [Green Version]
  7. Gobin, A. Modelling climate impacts on crop yields in Belgium. Clim. Res. 2010, 44, 55. [Google Scholar] [CrossRef] [Green Version]
  8. van der Velde, M.; Tubiello, F.N.; Vrieling, A.; Bouraoui, F. Impacts of extreme weather on wheat and maize in France: Evaluating regional crop simulations against observed data. Clim. Change 2012, 113, 751–765. [Google Scholar] [CrossRef] [Green Version]
  9. Schmitt, J.; Offermann, F.; Söder, M.; Frühauf, C.; Finger, R. Extreme weather events cause significant crop yield losses at the farm level in German agriculture. Food Policy 2022, 112, 102359. [Google Scholar] [CrossRef]
  10. Ben-Ari, T.; Adrian, J.; Klein, T.; Calanca, P.; Van der Velde, M.; Makowski, D. Identifying indicators for extreme wheat and maize yield losses. Agric. For. Meteorol. 2016, 220, 130–140. [Google Scholar] [CrossRef]
  11. Beillouin, D.; Schauberger, B.; Bastos, A.; Ciais, P.; Makowski, D. Impact of extreme weather conditions on European crop production in 2018. Philos. Trans. R. Soc. B Biol. Sci. 2020, 375, 20190510. [Google Scholar] [CrossRef] [PubMed]
  12. Mäkinen, H.; Kaseva, J.; Trnka, M.; Balek, J.; Kersebaum, K.C.; Nendel, C.; Gobin, A.; Olesen, J.E.; Bindi, M.; Ferrise, R.; et al. Sensitivity of European wheat to extreme weather. Field Crops Res. 2018, 222, 209–217. [Google Scholar] [CrossRef]
  13. Gobin, A.; Van de Vyver, H. Spatio-temporal variability of dry and wet spells and their influence on crop yields. Agric. For. Meteorol. 2021, 308–309, 108565. [Google Scholar] [CrossRef]
  14. van Oort, P.A.J.; Timmermans, B.G.H.; Schils, R.L.M.; van Eekeren, N. Recent weather extremes and their impact on crop yields of the Netherlands. Eur. J. Agron. 2023, 142, 126662. [Google Scholar] [CrossRef]
  15. Shimoda, S.; Terasawa, Y.; Nishio, Z. Improving wheat productivity reveals an emerging yield gap associated with short-term change in atmospheric humidity. Agric. For. Meteorol. 2022, 312, 108710. [Google Scholar] [CrossRef]
  16. van Ittersum, M.K.; Cassman, K.G.; Grassini, P.; Wolf, J.; Tittonell, P.; Hochman, Z. Yield gap analysis with local to global relevance—A review. Field Crops Res. 2013, 143, 4–17. [Google Scholar] [CrossRef] [Green Version]
  17. Sadras, V.O.; Cassman, K.G.G.; Grassini, P.; Hall, A.J.; Bastiaanssen, W.G.M.; Laborte, A.G.; Milne, A.E.; Sileshi, G.; Steduto, P. Yield gap analysis of field crops, methods and case studies. In FAO Water Reports; Food and Agriculture Organisation of the United Nations: Rome, Italy, 2015. [Google Scholar]
  18. Trnka, M.; Hlavinka, P.; Semenov, M.A. Adaptation options for wheat in Europe will be limited by increased adverse weather events under climate change. J. R. Soc. Interface 2015, 12, 20150721. [Google Scholar] [CrossRef] [Green Version]
  19. Gobin, A. Impact of heat and drought stress on arable crop production in Belgium. Nat. Hazards Earth Syst. Sci. 2012, 12, 1911–1922. [Google Scholar] [CrossRef] [Green Version]
  20. Rötter, R.P.; Appiah, M.; Fichtler, E.; Kersebaum, K.C.; Trnka, M.; Hoffmann, M.P. Linking modelling and experimentation to better capture crop impacts of agroclimatic extremes—A review. Field Crops Res. 2018, 221, 142–156. [Google Scholar] [CrossRef]
  21. Daryanto, S.; Wang, L.; Jacinthe, P.-A. Global synthesis of drought effects on maize and wheat production. PLoS ONE 2016, 11, e0156362. [Google Scholar] [CrossRef] [PubMed] [Green Version]
  22. KMI. Klimaatnormalen te Ukkel. Available online: https://www.meteo.be/nl/klimaat/klimaat-van-belgie/klimaatnormalen-te-ukkel/zonnestraling/globale-zonnestraling (accessed on 5 April 2023).
  23. Kottek, M.; Grieser, J.; Beck, C.; Rudolf, B.; Rubel, F. World map of the Köppen-Geiger climate classification updated. Meteorol. Z. 2006, 15, 259–263. [Google Scholar] [CrossRef] [PubMed]
  24. Departement Landbouw & Visserij. Landbouwstreken België. Available online: https://lv.vlaanderen.be/nl/voorlichting-info/feiten-cijfers/landbouwstreken-belgie/duinen (accessed on 7 December 2022).
  25. Databank Ondergrond Vlaanderen. Bodemprofielen Kartering Belgische Bodemkaart. Available online: https://www.vlaanderen.be/datavindplaats/catalogus/bodemprofielen-kartering-belgische-bodemkaart (accessed on 2 October 2022).
  26. Belgian Statistical Office. Land- en Tuinbouwbedrijven. Available online: https://statbel.fgov.be/nl/themas/landbouw-visserij/land-en-tuinbouwbedrijven#figures (accessed on 2 October 2022).
  27. Inagro Home Page. Available online: https://inagro.be/ (accessed on 3 October 2022).
  28. LCV Home Page. Available online: https://www.lcvvzw.be/ (accessed on 3 October 2022).
  29. PCA Home Page. Available online: https://www.pcainfo.be/ (accessed on 3 October 2022).
  30. Raes, D.; Steduto, P.; Hsiao, T.C.; Fereres, E. AquaCrop—The FAO crop model to simulate yield response to water: II. Main algorithms and software description. Agron. J. 2009, 101, 438–447. [Google Scholar] [CrossRef] [Green Version]
  31. Journée, M.; Ingels, R.; Bertrand, C. Overview and validation of observational gridded data products for Belgium. In EMS Annual Meeting Abstracts 2019; Lyngby Campus: Copenhagen, Denmark, 2019; pp. EMS2019–EMS2099. [Google Scholar]
  32. Saxton, K.E.; Rawls, W.J. Soil water characteristic estimates by texture and organic matter for hydrologic solutions. Soil Sci. Soc. Am. J. 2006, 70, 1569–1578. [Google Scholar] [CrossRef] [Green Version]
  33. Gobin, A.; Addimando, N.; Ramshorn, C.; Gutbrod, K. Climate risk services for cereal farming. Adv. Sci. Res. 2021, 18, 21–25. [Google Scholar] [CrossRef]
  34. Meier, U.; Bleiholder, H.; Weber, E.; Feller, C.; Hess, M.; Wicke Aventis, H.; van Den Boom, T.; Lancashire, P.D.; Buhr, L.; Hack, H.; et al. Growth stages of mono- and dicotyledonous plants. In BBCH Monograph; Federal Biological Research Centre for Agriculture and Forestry: Berlin, Germany, 2001. [Google Scholar]
  35. Struik, P.C. Chapter 18—Responses of the potato plant to temperature. In Potato Biology and Biotechnology; Vreugdenhil, D., Bradshaw, J., Gebhardt, C., Govers, F., Mackerron, D.K.L., Taylor, M.A., Ross, H.A., Eds.; Elsevier Science B.V.: Amsterdam, The Netherlands, 2007; pp. 367–393. ISBN 978-0-444-51018-1. [Google Scholar]
  36. Sánchez, B.; Rasmussen, A.; Porter, J.R. Temperatures and the growth and development of maize and rice: A review. Glob. Chang. Biol. 2014, 20, 408–417. [Google Scholar] [CrossRef]
  37. Porter, J.R.; Gawith, M. Temperatures and the growth and development of wheat: A review. Eur. J. Agron. 1999, 10, 23–36. [Google Scholar] [CrossRef]
  38. RStudio Team. RStudio: Integrated Development for R. RStudio: Boston, MA, USA, 2020. Available online: http://www.rstudio.com/ (accessed on 3 October 2022).
  39. Wittouck, D.; Boone, K.; Debosschere, S.; Demeester, C.; Vandaele, A.; Vandenbulcke, J.; Berten, M.; Hosten, K.; Ghekiere, G. Verslag Graan; Inagro: Rumbeke-Beitem, Belgium, 2020. [Google Scholar]
  40. Senapati, N.; Semenov, M.A. Large genetic yield potential and genetic yield gap estimated for wheat in Europe. Glob. Food Secur. 2020, 24, 100340. [Google Scholar] [CrossRef] [PubMed]
  41. Schils, R.; Olesen, J.E.; Kersebaum, K.-C.; Rijk, B.; Oberforster, M.; Kalyada, V.; Khitrykau, M.; Gobin, A.; Kirchev, H.; Manolova, V.; et al. Cereal yield gaps across Europe. Eur. J. Agron. 2018, 101, 109–120. [Google Scholar] [CrossRef]
  42. Haverkort, A.J.; Struik, P.C. Yield levels of potato crops: Recent achievements and future prospects. Field Crops Res. 2015, 182, 76–85. [Google Scholar] [CrossRef]
  43. Rezaei, E.E.; Siebert, S.; Manderscheid, R.; Müller, J.; Mahrookashani, A.; Ehrenpfordt, B.; Haensch, J.; Weigel, H.-J.; Ewert, F. Quantifying the response of wheat yields to heat stress: The role of the experimental setup. Field Crops Res. 2018, 217, 93–103. [Google Scholar] [CrossRef]
  44. Troy, T.J.; Kipgen, C.; Pal, I. The impact of climate extremes and irrigation on US crop yields. Environ. Res. Lett. 2015, 10, 054013. [Google Scholar] [CrossRef] [Green Version]
  45. Brisson, N.; Gate, P.; Gouache, D.; Charmet, G.; Oury, F.-X.; Huard, F. Why are wheat yields stagnating in Europe? A comprehensive data analysis for France. Field Crops Res. 2010, 119, 201–212. [Google Scholar] [CrossRef]
  46. Dondeyne, S.; Vanierschot, L.; Langohr, R.; Van Ranst, E.; Deckers, J. The Soil Map of the Flemish Region Converted to the 3rd Edition of the World Reference Base for Soil Resources; Vlaamse Overheid; Dep. Leefmilieu, Natuur en Energie, Universiteit Gent; KU Leuven: Gent, Belgium, 2014. [Google Scholar]
  47. Ameryckx, J.B.; Verheye, W.; Vermeire, R. Bodemkunde: Bodemvorming, Bodemeigenschappen, de Bodems van België, Bodembehoud en -Degradatie, Bodembeleid en Bodempolitiek; Willy Ameryckx: Gent, Belgium, 1995. [Google Scholar]
Figure 1. Locations of field trials within the agricultural zones of Flanders. Labels w, m and p stand for winter wheat, maize and potato. The major soil textural classes (USDA) are sandy loam in the Campines, silt in the Loam Region, clay loam in the Polder Region and silt loam in the Sandy–Loam Region.
Agronomy 13 01104 g001
Figure 2. Definitions of yield levels and yield gap approach used in this study, with potential yield (YP), optimal management yield (YM) and actual yield (YA).
Agronomy 13 01104 g002
Figure 3. Cropping calendar for winter wheat, maize and late potato in Belgium.
Agronomy 13 01104 g003
Figure 4. Winter wheat yield gaps during the 2011–2021 period: potential yield (YP), optimal management yield (YM) and actual yield (YA). Significant differences (Wilcoxon test; p < 0.05 or p < 0.001) YM on the three soils (yellow), for YA on the three soils (gray) and for the difference between YM and YA for each soil type separately (green, orange and purple) are indicated by a different letter.
Agronomy 13 01104 g004
Figure 5. Maize yield gaps during the 2011–2021 period: potential yield (YP), optimal management yield (YM) and actual yield (YA). Significant differences (Wilcoxon test; p < 0.05 or p < 0.001) YM on the three soils (yellow), for YA on the three soils (gray) and for the difference between YM and YA for each soil type separately (green, orange and purple) are indicated by a different letter.
Agronomy 13 01104 g005
Figure 6. Potato yield gaps during the 2011–2021 period: potential yield (YP), optimal management yield (YM) and actual yield (YA). Significant differences (Wilcoxon test; p < 0.05 or p < 0.001) YM on the two soils (yellow), for YA on the two soils (gray) and for the difference between YM and YA for each soil type separately (green and orange) are indicated by a different letter.
Agronomy 13 01104 g006
Figure 7. Correlation matrix (Pearson’s) for winter wheat with potential yield (YM), optimal management yield (YM) and actual yield (YA). Heat stress index (HSI), precipitation deficit index (PDI), water deficit index (WDI) and waterlogging index (WLI) for emergence (S1), vegetative growth (S2), flowering (S3) and grain filling and ripening (S4). Darker blue colors indicate more positive correlation and darker red colors indicate more negative correlation.
Agronomy 13 01104 g007
Figure 8. Correlation matrix (Pearson’s) for maize with potential yield (YP) optimal management yield (YM) and actual yield (YA). Heat stress index (HSI), precipitation deficit index (PDI), water deficit index (WDI) and waterlogging index (WLI) for emergence (S1), vegetative growth (S2), flowering (S3) and grain filling and ripening (S4). Darker blue colors indicate more positive correlation and darker red colors indicate more negative correlation.
Agronomy 13 01104 g008
Figure 9. Correlation matrix (Pearson’s) for potato with potential yield (YP) optimal management yield (YM) and actual yield (YA). Heat stress index (HSI), precipitation deficit index (PDI), water deficit index (WDI) and waterlogging index (WLI) for emergence (S1), vegetative growth (S2), tuber set (S3) and tuber bulking (S4). Darker blue colors indicate more positive correlation and darker red colors indicate more negative correlation.
Agronomy 13 01104 g009
Table 1. Effects of (agro-)meteorological indicators during crop growth stages on winter wheat yield. An overview of studies using yield–weather time series.
MethodWeather
Condition
Growth StageIndicatorResult
Region: Japan
Years: 1984–2020
Indicators: meteorological indicators
What is analyzed: yield penalty (in terms of yield gap)
Yield level: regional yield statistics
Analysis method: WOFOST for potential yields and Pearson’s correlation test for statistical analysis
Reference: [15]
Heat/droughtFloweringVapor pressure deficit (VPD); air temperature (Tair); number of rainy days (Rain).R2 between yield gap and indicators:
VPD: 0.07
Tair: 0.25
Rain: −0.09
Grain fillingVapor pressure deficit (VPD); air temperature (Tair); number of rainy days (Rain).R2 between yield gap and indicators:
VPD: −0.62
Tair: −0.65
Rain: 0.05
Region: Europe
Years: 1991–2014
Indicators: meteorological indicators and thresholds identified from literature
What is analyzed: yield penalty (in terms of reduction from average yield)
Yield level: field-level yields (variety trials)
Analysis method: linear mixed models
Reference: [12]
HeatHeadingAny day with maximum air temperature (Tmax) > 31 °C in 21-day interval around headingRange from +10% to −15% from normal, depending on cultivar
Heading to maturityAny day with maximum air temperature (Tmax) > 35 °C Range from +15% to −8% from normal, depending on cultivar
DroughtSowing to headingDays with ratio of actual to potential evapotranspiration (ETa/ETr) < 0.15Range from +15% to −10% from normal, depending on cultivar
Heading to maturityDays with ratio of actual to potential evapotranspiration (ETa/ETr) < 0.15Range from +15% to −5% from normal, depending on cultivar
Excess rainfallSowing to heading>60 days with water saturated at the field capacityRange from +10% to −10% from normal, depending on cultivar
Growing seasonAny day with +40 mm Range from +10% to −20% from normal, depending on cultivar
Low radiationSowing to headingSum of effective global radiationRange from +25% to 30%, depending on cultivar
FrostGrowing seasonAny day with minimum air temperature (Tmin) < −15 °C.Range from +5% to −30%, depending on the cultivar
Region: Western Europe
Years: 18–75 years depending on country and crop
Indicators: meteorological variables
What is analyzed: absolute yields
Yield level: regional yield statistics
Analysis method: yield response curve
Reference: [11]
High rainfallEarly vegetative growth (Jan–Feb)Precipitation (P) (mm day−1)Low relationship between P and yield
Late vegetative growth (Mar–Apr–May)Precipitation (P) (mm day−1)Steep yield increase at increasing P until turning point. After this point (2.8 mm day−1), little impact of increasing P on yield
Flowering + grain filling (Jun–Jul–Aug)Precipitation (P) (mm day−1)Slight decreasing in yield at increasing P
High temperaturesEarly vegetative growth (Jan–Feb)Maximum air temperature (Tmax) (°C)Steep increase in yield at increasing Tmax (−10 to 5 °C). At turning point (5 °C), steep decrease
Late vegetative growth (Mar–Apr–May)Maximum air temperature (Tmax) (°C)Low relationship between Tmax and yield
Flowering + grain filling (Jun–Jul–Aug)Maximum air temperature (Tmax) (°C)Slight decreasing relationship between Tmax and yield
Region: Germany
Years: 1995–2019
Indicators: (agro-)meteorological indicators with thresholds defined based on the 1st and 99th percentile of frequency distribution
What is analyzed: yield penalty (in terms of reduction from average yield)
Yield level: farm-level yields
Analysis method: logarithmic mixed models
Reference: [9]
FrostEarly vegetative growthMinimum air temperature (Tmin) ≤ −12.8 °CNo significant effect on yield
HeatFloweringMaximum air temperature (Tmax) ≥ 32.6 °CNo significant effect on yield
DroughtLate vegetative growth + floweringSoil moisture ≤ 14.4% of field capacity.One drought day reduces yield by 0.36%
Grain fillingSoil moisture ≤ 7.8% of field capacity.One drought day reduces yield by 0.36%
WaterloggingLate vegetative growth + floweringSoil moisture ≥ 115.3% of field capacity.One waterlogging day reduces yield by 0.28%
Grain fillingSoil moisture ≥ 111.6% of field capacity.One waterlogging day reduces yield by 0.32%
Region: Belgium
Years: 1947–2021
Indicators: (agro-)meteorological indicators (percentiles of cumulative probability distribution)
What is analyzed: absolute low yields (percentiles of cumulative probability distribution)
Yield level: national yield statistics
Analysis method: cumulative probability density function
Reference: [2]
Low radiationGrowing seasonRadiation sum (∑RAD)70% of low yields explained
Excess rainfallFloweringMaximum number of consecutive rainy days (CRDmx); rainfall amount during the maximum number of consecutive rainy days (ACRDmx); sum of precipitation (∑P).55% of low yields explained
Combined heat and droughtGrowing seasonSum of heat units (∑PHU); water balance deficit (WD); maximum cumulative precipitation deficit ((P − 0.5ET0)mx).36% of low yields explained
Region: Belgium
Years: 1971–2010
Indicators: meteorological indicators (dry/wet day at precipitation lower/higher than 0.2 mm)
What is analyzed: absolute low/high yields
Yield level: regional yield statistics
Analysis method:
ANOVA between 10 lowest and 10 highest yields
Reference: [13]
Dry and wet spellsGrowing seasonNumber of consecutive wet days (ncwd); total rainfall during wet days over growing season (totrain); number of consecutive dry days (ncdd).High values for ncwd were most associated with high yields (p < 0.001)
Table 2. Effects of (agro-)meteorological indicators during crop growth stages on maize yield. An overview of studies using yield–weather time series.
MethodWeather ConditionGrowth StageIndicatorResult
Region: France
Years: 2000–2013
Indicators: (agro-)meteorological indicators with thresholds defined from literature
What is analyzed: absolute low yields (percentiles of cumulative probability distribution)
Yield level: regional yield statistics
Analysis method: area under Receiver Operating Characteristic (ROC) curve
Reference: [10]
Low radiationVegetative growth stageSum of radiationPrediction performance of 0.86 for extreme yield loss
High temperatureVegetative growth stageMaximum air temperature (Tmax) > 35 °CPrediction performance of 0.86 for extreme yield loss
Low radiationFloweringSum of radiationPrediction performance of 0.77 for extreme yield loss
High temperatureFloweringMaximum air temperature (Tmax) > 35 °CPrediction performance of 0.78 for extreme yield loss
Region: Germany
Years: 1995–2019
Indicators: (agro-)meteorological indicators with thresholds defined based on the 1st and 99th percentile of frequency distribution
What is analyzed: yield penalty (in terms of reduction from average yield)
Yield level: farm-level yields
Analysis method: logarithmic mixed models
Reference: [9]
Cold temperatureSowing to emergenceMinimum air temperature (Tmin) ≤ 0.5 °CNo significant effect on yield
HeatVegetative growth and floweringMaximum air temperature (Tmax) ≥ 33.7 °CNo significant effect on yield
DroughtEmergence and vegetative growthSoil moisture ≤ 33.5% of field capacity.One drought day reduces yield by 0.52%
Flowering and grain fillingSoil moisture ≤ 8.7% of field capacityOne drought day reduces yield by 0.69%
WaterloggingEmergence and vegetative growthSoil moisture ≥ 118.7% of field capacity.No significant effect on yield
Flowering and grain fillingSoil moisture ≥ 112.7% of field capacity.No significant effect on yield
Region: Belgium
Years: 1947–2012
Indicators: (agro-)meteorological indicators (percentiles of cumulative probability distribution)
What is analyzed: absolute low yields (percentiles of cumulative probability distribution)
Yield level: national yield statistics
Analysis method: cumulative probability density function
Reference: [2]
Combined low temperature and excess rainfallEarly vegetative growthSum of heat units (∑PHU); sum of precipitation (∑P).79% of low yields explained
Low radiationGrowing seasonSum of radiation (∑RAD)64% of low yields explained
Excess rainfallHarvestMaximum number of consecutive rainy days (CRDmx); rainfall amount during the maximum number of consecutive rainy days (ACRDmx); sum of precipitation (∑P).29% of low yields explained
Combined heat and droughtFloweringSum of heat units (∑PHU); water balance deficit (WD); maximum cumulative precipitation deficit (∑(P − 0.5ET0)mx).21% of low yields explained
Region: Belgium
Years: 1971–2010
Indicators: meteorological indicators (dry/wet day at precipitation lower/higher than 0.2 mm)
What is analyzed: absolute low/high yields
Yield level: regional yield statistics
Analysis method:
ANOVA between 10 lowest and 10 highest yields
Reference: [13]
Dry and wet spellsGrowing seasonNumber of consecutive wet days (ncwd); total rainfall during wet days over growing season (totrain); number of consecutive dry days (ncdd).High values for totrain were most associated with high yields (p < 0.001)
Table 3. Effects of (agro-)meteorological indicators during crop growth stages on potato yield. An overview of studies using yield-weather time-series.
MethodWeather ConditionCritical StageIndicatorResults
Region: Belgium
Years: 1947–2012
Indicators: (agro-)meteorological indicators (percentiles of cumulative probability distribution)
What is analyzed: absolute low yields (percentiles of cumulative probability distribution)
Yield level: national yield statistics
Analysis method: cumulative probability density function
Reference: [2]
Combined drought and heatTuber setSum of heat units (∑PHU); water balance deficit (WD); maximum cumulative precipitation deficit (∑(P − 0.5ET0)mx).79% of low yields explained
WaterloggingPlanting and HarvestWaterlogging index (WLt).43% of low yields explained
Region: Netherlands
Years: 1994–2021
Indicators: meteorological variables (5th upper and lower percentiles of cumulative probability distribution)
What is analyzed: absolute low yields (5th upper and lower percentiles of cumulative probability distribution)
Yield level: regional yield statistics
Analysis method: probability distributions
Reference: [14]
DroughtGrowing periodSum of precipitation deficit (∑(ET0-rain)).13% of low yields explained
WaterloggingHarvestSum of precipitation (∑P).73% of low yields explained
Region: Belgium
Years: 1971–2010
Indicators: meteorological indicators (dry/wet day at precipitation lower/higher than 0.2 mm)
What is analyzed: absolute low/high yields
Yield level: regional yield statistics
Analysis method:
ANOVA between 10 lowest and 10 highest yields
Reference: [13]
Dry and wet spellsGrowing seasonNumber of consecutive wet days (ncwd); total rainfall during wet days over growing season (totrain); number of consecutive dry days (ncdd).High values for totrain were most associated with high yields (p < 0.001)
Table 4. Overview of crop information obtained from field trials across Flanders used for calibration of AquaCrop and the assimilated reference harvest index (HI0) during calibration.
Winter Wheat
Soil TypeObserved YearsSowing Density Range (Mean) (Grains/m2)Sowing DateRangeFlowering Date RangeHarvesting Date RangeHI0 Range (Mean)
Clay loam2011–2012, 2014–2021350–475 (400)17 Oct.–12 Dec.30 May–7 Jun.26 Jul.–21 Aug.41–86 (67)
Silt2011–2012, 2014–2021300–350 (325)13 Oct.–7 Nov.26 May–4 Jun.18 Jul.–10 Aug.31–70 (57)
Silt loam2016–2021250–350 (350)25 Oct.–21 Nov.28 May–6 Jun.19 Jul.–15 Aug.36–60 (58)
Grain maize
Soil typeObserved yearsSowing density range (mean) (grains/ha)Sowing daterangeFlowering date rangeHarvesting date rangeHI0 range (mean)
Sandy loam2014–202197,32424 Apr.–29 Apr.10 Jul.–23 Jul.19 Sep.–23 Nov.33–45 (38)
Silt2011–20208888–100,000 (95,619)20 Apr.–8 May10 Jul.–23 Jul.19 Sep.–15 Nov.42–48 (45)
Silt loam2011–2012, 2015, 2017–202196,000–100,000 (100,000)20 Apr.–29 May10 Jul.–23 Jul.19 Sep.–9 Nov.27–48 (44)
Late potato
Soil typeObserved yearsPlant density (plants/ha)Sowing date
range
Date of tuber set *Haulm killing
date range
Harvesting date rangeHI0 range
Silt2014–202040,0007 Apr.–25 Apr.21 Jun.7 Sep.–24 Sep.29 Sep.–24 Oct.33–57 (43)
Silt loam2011–201940,00019 Apr.–28 May21 Jun.2 Sep.–6 Oct.19 Sep.–13 Nov.42–77 (66)
* No data were provided in the field trials. A norm value for potato in Flanders was adapted from [2].
Table 5. Optimal and maximal temperatures for main growth stages of winter wheat, maize and late potato.
CropPhenological StageBBCHTopt (°C)Tmax (°C)
Winter wheatEmergence00–0922.032.7
Vegetative growth10–4922.032.7
Flowering51–6921.031.0
Grain filling and ripening71–9920.735.4
MaizeEmergence00–0929.340.2
Vegetative growth10–3928.339.2
Flowering51–6930.537.3
Grain filling and ripening71–9926.436.0
PotatoEmergence00–0918.027.0
Vegetative growth10–3918.027.0
Tuber setting4020.030.0
Tuber development41–4920.030.0
Table 6. Variables significantly (alpha = 0.1) correlated (Pearson’s correlation) with yield and yield gap.
CropY-VarVariables Significantly Correlated (Alpha = 0.1)
Winter wheatYP-YMHSI_S3, HSI_S4, PDI_S4, WLI_S2, WLI_S4
YP-YAHSI_S3, HSI_S4, WLI_S1, WLI_S2
YMPDI_S1, PDI_S4, WDI_S2, WDI_S3, WDI_S4, WLI_S1, WLI_S4
YAHSI_S4, PDI_S1, PDI_S2, PDI_S3, PDI_S4, WDI_S2, WDI_S3, WDI_S4, WLI_S4
MaizeYP-YMHSI_S4, PDI_S2, PDI_S3, PDI_S4, WDI_S2, WDI_S3, WDI_S4
YP-YAHSI_S4, PDI_S3, PDI_S4, WDI_S3, WDI_S4
YMHSI_S4, PDI_S3, PDI_S4, WDI_S2, WDI_S3, WDI_S4
YAHSI_S4, PDI_S4, WDI_S3, WDI_S4
PotatoYP-YM/
YP-YAHSI_S1
YMHSI_S4
YAHIS_S1, HSI_S4, PDI_S4, WDI_S1, WDI_S4, WLI_S1
Table 7. Goodness-of-fit indicators for a multiple linear model for winter wheat including all (agro-)meteorological variables, with and without soil type, for optimal management yield gap (YP-YM), actual yield gap (YP-YA), optimal management yield (YM) and actual yield (YA).
Model Type Goodness-of-Fit Indicators
Without soilYield (gap) R2AICRMSEMAEd
YP-YM0.85104.970.980.770.96
YP-YA0.9672.420.530.390.99
YM0.61114.701.190.950.87
YA0.7162.320.430.350.91
With soilYield (gap) R2AICRMSEMAEd
YP-YM0.9292.680.720.570.98
YP-YA0.9852.160.330.251.00
YM0.8692.680.720.570.96
YA0.8352.160.330.250.95
Table 8. Goodness-of-fit indicators for a multiple linear model for maize including all (agro-)meteorological variables, with and without soil type, for optimal management yield gap (YP-YM), actual yield gap (YP-YA), optimal management yield (YM) and actual yield (YA).
Model Type Goodness-of-Fit Indicators
Without soilYield (gap) R2AICRMSEMAEd
YP-YM0.7697.470.810.690.93
YP-YA0.7997.850.820.600.94
YM0.76105.500.940.800.93
YA0.8493.410.750.600.96
With soilYield (gap) R2AICRMSEMAEd
YP-YM0.7899.380.780.630.94
YP-YA0.9277.110.520.420.98
YM0.8399.380.780.630.95
YA0.9377.110.520.420.98
Table 9. Goodness-of-fit indicators for a multiple linear model for potato including all (agro-)meteorological variables, with and without soil type, for optimal management yield gap (YP-YM), actual yield gap (YP-YA), optimal management yield (YM) and actual yield (YA).
Model Type Goodness-of-Fit Indicators
Without soilYield (gap) R2AICRMSEMAEd
YP-YM0.9575.750.690.450.99
YP-YA0.9948.600.340.241.00
YM0.9761.200.470.290.99
YA0.998.750.120.081.00
With soilYield (gap) R2AICRMSEMAEd
YP-YM0.9858.260.410.271.00
YP-YA1.0010.590.120.081.00
YM0.9858.260.410.270.99
YA0.9910.590.120.081.00
Disclaimer/Publisher’s Note: The statements, opinions and data contained in all publications are solely those of the individual author(s) and contributor(s) and not of MDPI and/or the editor(s). MDPI and/or the editor(s) disclaim responsibility for any injury to people or property resulting from any ideas, methods, instructions or products referred to in the content.

