Article

Mapping Irrigated Areas Based on Remotely Sensed Crop Phenology and Soil Moisture

1
National Engineering and Technology Center for Information Agriculture, College of Agricultural, Nanjing Agricultural University, Nanjing 210095, China
2
Key Laboratory for Crop System Analysis and Decision Making, Ministry of Agriculture and Rural Affairs, Nanjing 210095, China
3
Jiangsu Key Laboratory for Information Agriculture, Nanjing 210095, China
4
Jiangsu Collaborative Innovation Center for Modern Crop Production, Nanjing 210095, China
*
Author to whom correspondence should be addressed.
Agronomy 2023, 13(6), 1556; https://doi.org/10.3390/agronomy13061556
Submission received: 8 April 2023 / Revised: 1 June 2023 / Accepted: 2 June 2023 / Published: 5 June 2023

Abstract

:
Artificial irrigation is critical for improving soil moisture conditions and ensuring crop growth. Its irrational deployment can lead to ecological and environmental issues. Mapping and understanding the changes in irrigated areas are vital to effectively managing limited water. However, most researchers map irrigated areas with a single data resource, which makes it hard to detect irrigated signals in complex situations. The case study area for this paper was China’s winter wheat region, and an irrigated area map was generated by analyzing the effects of artificial irrigation on crop phenological characteristics and soil moisture time series. The mapping process involved three steps: (1) generating a basic irrigated map by employing the ISODATA classification method on the Kolmogorov–Smirnov test irrigation signals from the microwave remote sensing data and reanalysis data; (2) creating the other map with the maximum likelihood ratio classification and zoning scheme on the phenological parameters extracted from the NDVI time series; and (3) fusing these two maps at the decision level to obtain the final map with a higher spatial resolution of 1 km. The map was evaluated against existing irrigated area data and was highly compatible with GMIA 5.0. The overall accuracy (OA) was 73.49%.

1. Introduction

Irrigation water is a vital supplement to soil moisture and accounts for 70% of global freshwater resources. It is crucial in the terrestrial water balance and the global water cycle. However, large-scale irrational irrigation can result in serious ecological problems, including declining groundwater levels, shrinking lakes, and land desertification [1]. Wheat, one of the most important cereal crops for humans, is susceptible to dynamic changes in irrigation. Water scarcity and waterlogging hinder wheat yield and its quality [2,3]. Therefore, large-scale irrigated area mapping is essential for precise water management, crop yield increase, and sustainable farming. Currently, there are three primary technical approaches to mapping irrigated areas [4,5,6]: irrigation mapping based on irrigation facility statistics [7,8], irrigation mapping based on multi-source remote sensing data interpretation [9,10], and irrigation mapping based on empirical or semi-empirical physical models of the ground surface [3,11,12]. Some global irrigated area maps based on statistical data, such as the Global Map of Irrigated Areas (FAO-GMIA) [7] and Global Monthly Irrigated and Rainfed Crop Areas (MIRCA2000) [13], directly reflect artificial irrigation behaviors but have limitations in terms of resolution, quality, timeliness, and coverage. Remote sensing can remedy these limitations. Interpreting irrigation information with optical remote sensing (ORS) images relies on the spectral differences between irrigated and non-irrigated areas [4]. Normalized difference vegetation index (NDVI) [10,14], enhanced vegetation index (EVI) [15,16], and Greenness index (GI) [14,17] are standard indices used to capture these differences.
However, certain wheat-producing countries or regions, such as China and India, have diverse climate types, complex landforms, and complicated social behaviors, resulting in temporal and spatial heterogeneity in irrigation areas. Therefore, multi-source data fusion becomes an essential technical tool for irrigation mapping to accommodate more challenging scenarios. Many efforts have combined ORS and auxiliary data to generate global irrigated maps, such as the Global Irrigated Area Map (IWMI-GIAM) [18]; the Global Rain-Fed, Irrigated, and Paddy Croplands (GRIPC) [19]; and the Global Food Security Support Analysis Data project (MEaSUREs-GFSAD) [20]. Common auxiliary data include elevation, meteorological, and land use/cover data. Meier et al. used GMIA, GFSAD, and normalized difference water index (NDWI) [21]. Furthermore, many irrigation maps at regional or national scales have been developed by many institutes, including the MODIS GI Irrigated Agriculture Dataset for the US [14], the Landsat GI-EVI irrigation Dataset for the US [16], and the yearly MODIS NDVI irrigated area maps in India for 2000–2015 [22]. As for China, besides using standard vegetation indices and auxiliary data, Zhu et al. incorporated precipitation indexes [23]; Xiang et al. used the land surface water index (LSWI) [24]; and Zhang et al. added existing irrigation products [25]. Zhang et al. produced the first 250 m irrigated cropland map (CIrrMap250) with multiple satellite-derived vegetation indices (NDVI, EVI, and GI) and auxiliary data [17]. Mapping irrigation areas in small-scale regions and heterogeneous landscapes requires complex climate elements and surface energy balance modules [26,27]. However, some indices and auxiliary data (NDWI, LSWI, and land cover) are still derived from ORS. Incorporating too many mixed pixels introduces uncertainties, complexity, and interpretation difficulties [28].
Microwave remote sensing (MRS) is widely used in marine and terrestrial resource surveys and thematic map production because it can penetrate through clouds, vegetation, snow and ice, and dry sandy soils [29]. It can effectively estimate soil moisture and detect irrigation activity by measuring alterations in the soil dielectric constant, which significantly increases after irrigation and decreases after evapotranspiration [29,30]. MRS can be used in various ways to detect, extract, or quantify irrigation [31]. The first method is to compare MRS soil moisture in an irrigated area to that in a rain-fed area [32] or a non-irrigated area [33]. The second method integrates empirical or semi-empirical physical models. For example, some researchers have employed an empirical model on MRS soil moisture and compared it to the observed precipitation [5,29,30]. Other studies have matched MRS soil moisture to land surface model simulations (LSM), such as the Noah Land Surface Model [3], SURFEX [12], and MERRA [30], based on their assumptions of non-irrigation. Moreover, ERA-Interim reanalysis datasets simulated soil moisture without considering artificial irrigation [34], so the differences in soil moisture values between the datasets and MRS could indicate irrigation signals [35,36]. However, MRS still has limitations, including low resolution, long re-entry cycle time, and poor uniformity among different sources.
This study proposed a novel method for irrigation mapping that integrated ORS and multi-MRS techniques and selected the winter wheat production region in China as the case area. The classification and interpretation algorithms were refined repeatedly to take advantage of vegetation and soil moisture’s spatial and temporal characteristics and improve irrigation mapping accuracy. The main objectives of this paper are as follows: (i) the assessment of the capability of multiple soil moisture products for irrigation detection; (ii) the estimation of irrigation areas using easily accessible spatiotemporal datasets; and (iii) ensuring the accuracy and weakening the noise of irrigation maps.

2. Materials and Methods

2.1. The Case Study Area

We chose China’s main winter wheat production region as the case study area. The primary water sources in it were rainfall and irrigation [37]. This area, including 13 provinces and a municipality, was divided into four sub-regions based on geographical location and climate conditions [38]. These were the northern winter wheat sub-region (NS), the Huanghuai winter wheat sub-region (HHS), the middle–lower Yangtze River winter wheat sub-region (MYS), and the southwest winter wheat sub-region (SWS) (Figure 1). The NS region has a significant continental climate with distinct seasons, concentrated precipitation, and relatively low annual rainfall. The HHS region features flat terrain, a moderate temperature, and adequate rainfall. The MYS region belongs to the subtropical monsoonal climate zone, with low-lying terrain, abundant annual rainfall, and simultaneous rainfall and warmth. The SWS region has a mild climate and favorable water and heat conditions, but its topography is undulating and complex, and it receives insufficient light. Additionally, there are apparent differences in topography and climate within each sub-region.

2.2. Data

The datasets comprised irrigation datasets, ORS vegetation index products, MRS soil moisture products, and reanalysis soil moisture datasets (Table 1). The latest version of GMIA 5.0, updated in 2013, includes city-level effective irrigated areas and a data layer equipped with an irrigation water source (Figure 2a). The value represents the irrigated areas within a single pixel; the benchmark years are 2000–2008 [39]. Compared with the other three global irrigated maps (GRIPC, GFSAD, and GlobCover), the GMIA exhibited the best correlation and the lowest dispersion in China [8]. Thus, it was the reference map. Besides the GMIA 5.0, we added GFSAD, Meier’s Map (Figure 2), agrometeorological irrigated stations (Figure 1), and statistically effective irrigation areas in the China Statistical Yearbook as auxiliary validation data. Those agrometeorological stations where irrigation activities were conducted each year between 2000 and 2008 were selected as irrigated ground points, while those without irrigation activities were non-irrigated ground points.
Three microwave soil moisture products, advanced microwave scanning radiometer for EOS (AMSR-E), the advanced scatterometer (ASCAT), the European Space Agency Climate Change Initiative (ESA-CCI), and ERA-Interim reanalysis simulation datasets were selected from 2000 to 2008 to ensure the spatiotemporal continuity of the soil moisture data and match the time range of the GMIA. At the same time, we selected the MOD13A2 vegetation index product synthesized by the MODIS satellite with a global 1 km resolution for 16 days [43].

2.3. Methods

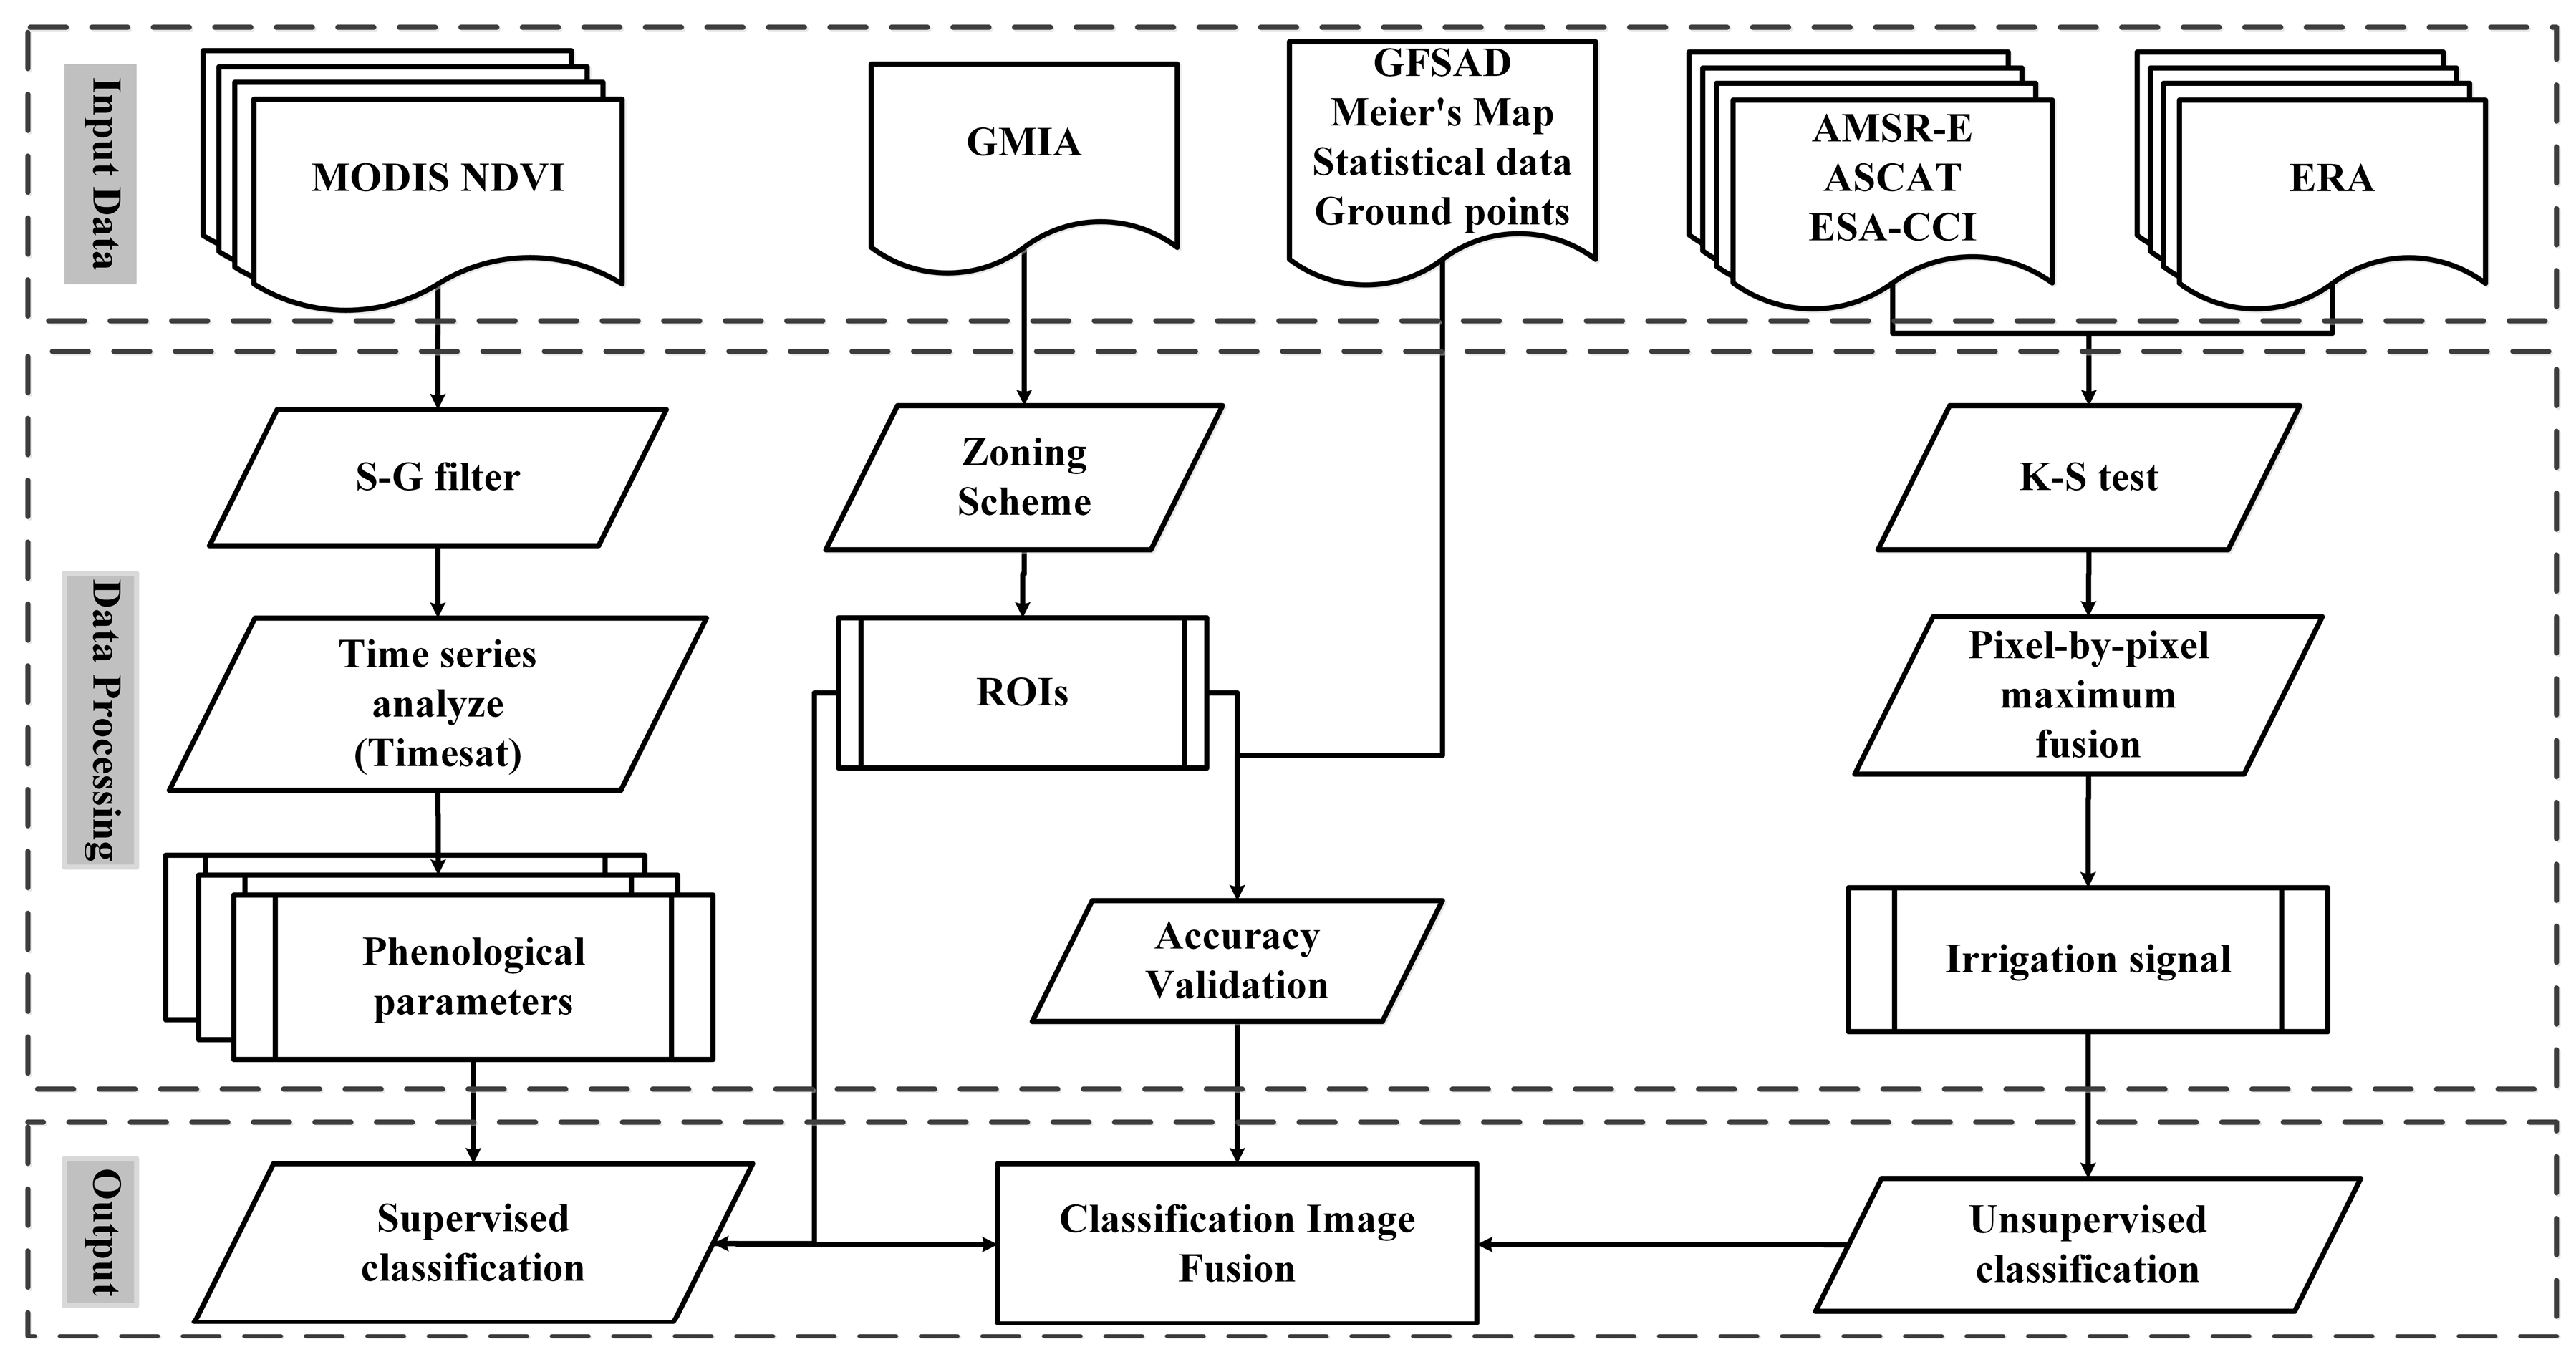
This study aims to develop a regional-scale irrigation mapping method using multi-source remote sensing datasets. The method relied on NDVI physical parameters and the signal differences in MRS and ERA. Figure 2 shows that irrigated areas were often underestimated or overstated. Hence, the classification rules included GMIA 5.0 and zoning. Finally, the resultant map was compared to other irrigated area maps and evaluated with some ground points (Figure 3).

2.3.1. Irrigation Signals Extraction of Soil Water Based on MRS

The low correlation between soil water data from various sources is reliable for detecting irrigation information [36,44]. The K-S test [3,36] calculates the cumulative distribution function of two sequential data and determines whether there is a significant difference between them. The test statistic is Dn,m [34] (Equation (1)):
D n , m = sup x | F 1 , n ( x ) F 2 , m ( x ) |
x represents the sampled variable, and F1,n and F1,m represent the cumulative empirical distribution functions (CDF) of the first and second samples. The sup x is the supremum function. The null hypothesis is that the two datasets have the same distribution. The null hypothesis is rejected if the test statistic Dn,m exceeds the critical value at a significance level of α. Otherwise, the null hypothesis is accepted (Equation (2)):
D n , m > c ( α ) n + m n m
The K-S test was employed to determine the similarity of the three control groups of soil water data (AMSRE with ERA, ASCAT with ERA, ESA CCI with ERA) in time series and to compute the cumulative distribution function. The pixel-by-pixel maximum fusion method was then applied to merge the results of three group tests in irrigation month and to detect the irrigation signals. The fusion process demanded coherence for four years.

2.3.2. Phenological Parameter Extraction Based on ORS Vegetation Index

Soil moisture dominates winter wheat growth in arid and semi-arid regions [37]. NDVI was the most widely used and easily accessible vegetation index for irrigation maps, such as GFSAD, GIAM, GRIPC, and CIrrMap250 [17,18,19,20]. Differences in soil moisture can induce vegetation canopy information alterations and ultimately affect the dynamic changes in the NDVI time series [2]. The sudden changes in the NDVI curve can be used to track vegetation growth status. The NDVI characteristic values at crucial time points in continuous spectra can effectively identify irrigated croplands [45].
We used the Savitzky–Golay (S-G) filter in TIMESAT® software, version 3.3 [25,46] to reconstruct NDVI time series data and eliminate cloud and shadow noise. A total of 13 phenological parameters were extracted from NDVI time series data in 2008 (Figure 4) [47]. The base level represents the average left and right minimum NDVI values on the fitting function. The amplitude is the difference between the maximum value and the base level. The length of the growing season (LGS) refers to the time interval within which NDVI increases or decreases to a specific percentage of amplitude (20% in this study). The time middle of the season is the midpoint of the start of the growing season (SGS) and the end of the growing season (EGS). The left and right derivatives represent the ratio of the differences between the 20% and 80% levels and the corresponding time difference. The small integral represents the differences between the fitting function and the base level from SGS and EGS [48,49]. The large integral also includes the differences between the base level and the zero level.

2.3.3. Irrigation Mapping Based on Zoning and Multi-Source Remote Sensing Data Fusion

This study conducted ISODATA (iterative self-organizing data analysis technique) clustering classification [15,50] on the K-S irrigation signals to obtain a microwave-based irrigation map. ISODATA iteratively assigns pixels to different clusters based on their spectral characteristics. Then, regions with very high irrigation intensity in GMIA 5.0 were assigned as irrigated ROIs and regions with low irrigation intensity as non-irrigated ROIs. However, a zoning scheme was necessary for selecting ROIs because water demand and irrigation intensity varied in different sub-regions. Next, the maximum likelihood ratio classification was conducted [51,52] in order to generate the irrigation map based on ORS, which involved ROIs obtained from GMIA 5.0 and phenological parameters obtained from NDVI. Finally, decision-level fusion was carried out to obtain the final irrigation map, which focused on the decision results based on different remote sensing platforms. Decision-level fusion aims to improve overall decision making or classification performance by leveraging other sources or classifiers’ complementary strengths and expertise. This had processing efficiency and excellent fault tolerance ability for big data, but it was not easy to create a fusion strategy [53]. Moreover, there is often a difficult choice between performing fusion at a higher resolution or a lower resolution.

2.3.4. Precision Evaluation

The precision valuation processes included four parts: (1) inter-comparison with existing irrigation products, (2) validation through ground truth data, (3) validation through statistical data analysis, and (4) assessment using a specialized indicator of GMIA. The first two parts used four accuracy metrics: overall accuracy (OA), producer’s accuracy (PA, corresponding to omission error), and user’s accuracy (UA, commission error) [25]. In the third part, the irrigated pixels aggregated at the city level of the final map were compared to the statistically effective irrigated areas with the coefficient of determination (R2). In the last part, we developed a specific classification evaluation indicator for GMIA 5.0 because it was an irrigation intensity map rather than a binary irrigation map. The indicator was called irrigation accuracy (IA) (Equation (3)):
I A a = j = 1 m x j i = 1 n x i + j = 1 m x j × 100 % ,   0 < a < Δ i = 1 n x i i = 1 n x i + j = 1 m x j × 100 % ,   a Δ
a represents the irrigation intensity of GMIA 5.0, n and m separately denote the number of irrigation and non-irrigation pixels within a, x i denotes the area of irrigation pixel i, and x j denotes the area of non-irrigation pixel j. Δ represents the irrigation intensity threshold for determining whether there is irrigation activity. If α > Δ , IAα indicates the proportion of the area of irrigation pixels to the total area of irrigation intensity a, i.e., the classification accuracy of the irrigation pixel. Conversely, IAα denotes the classification accuracy of non-irrigated areas.

3. Results

3.1. Irrigation Signals Extraction of Soil Water Based on MRS

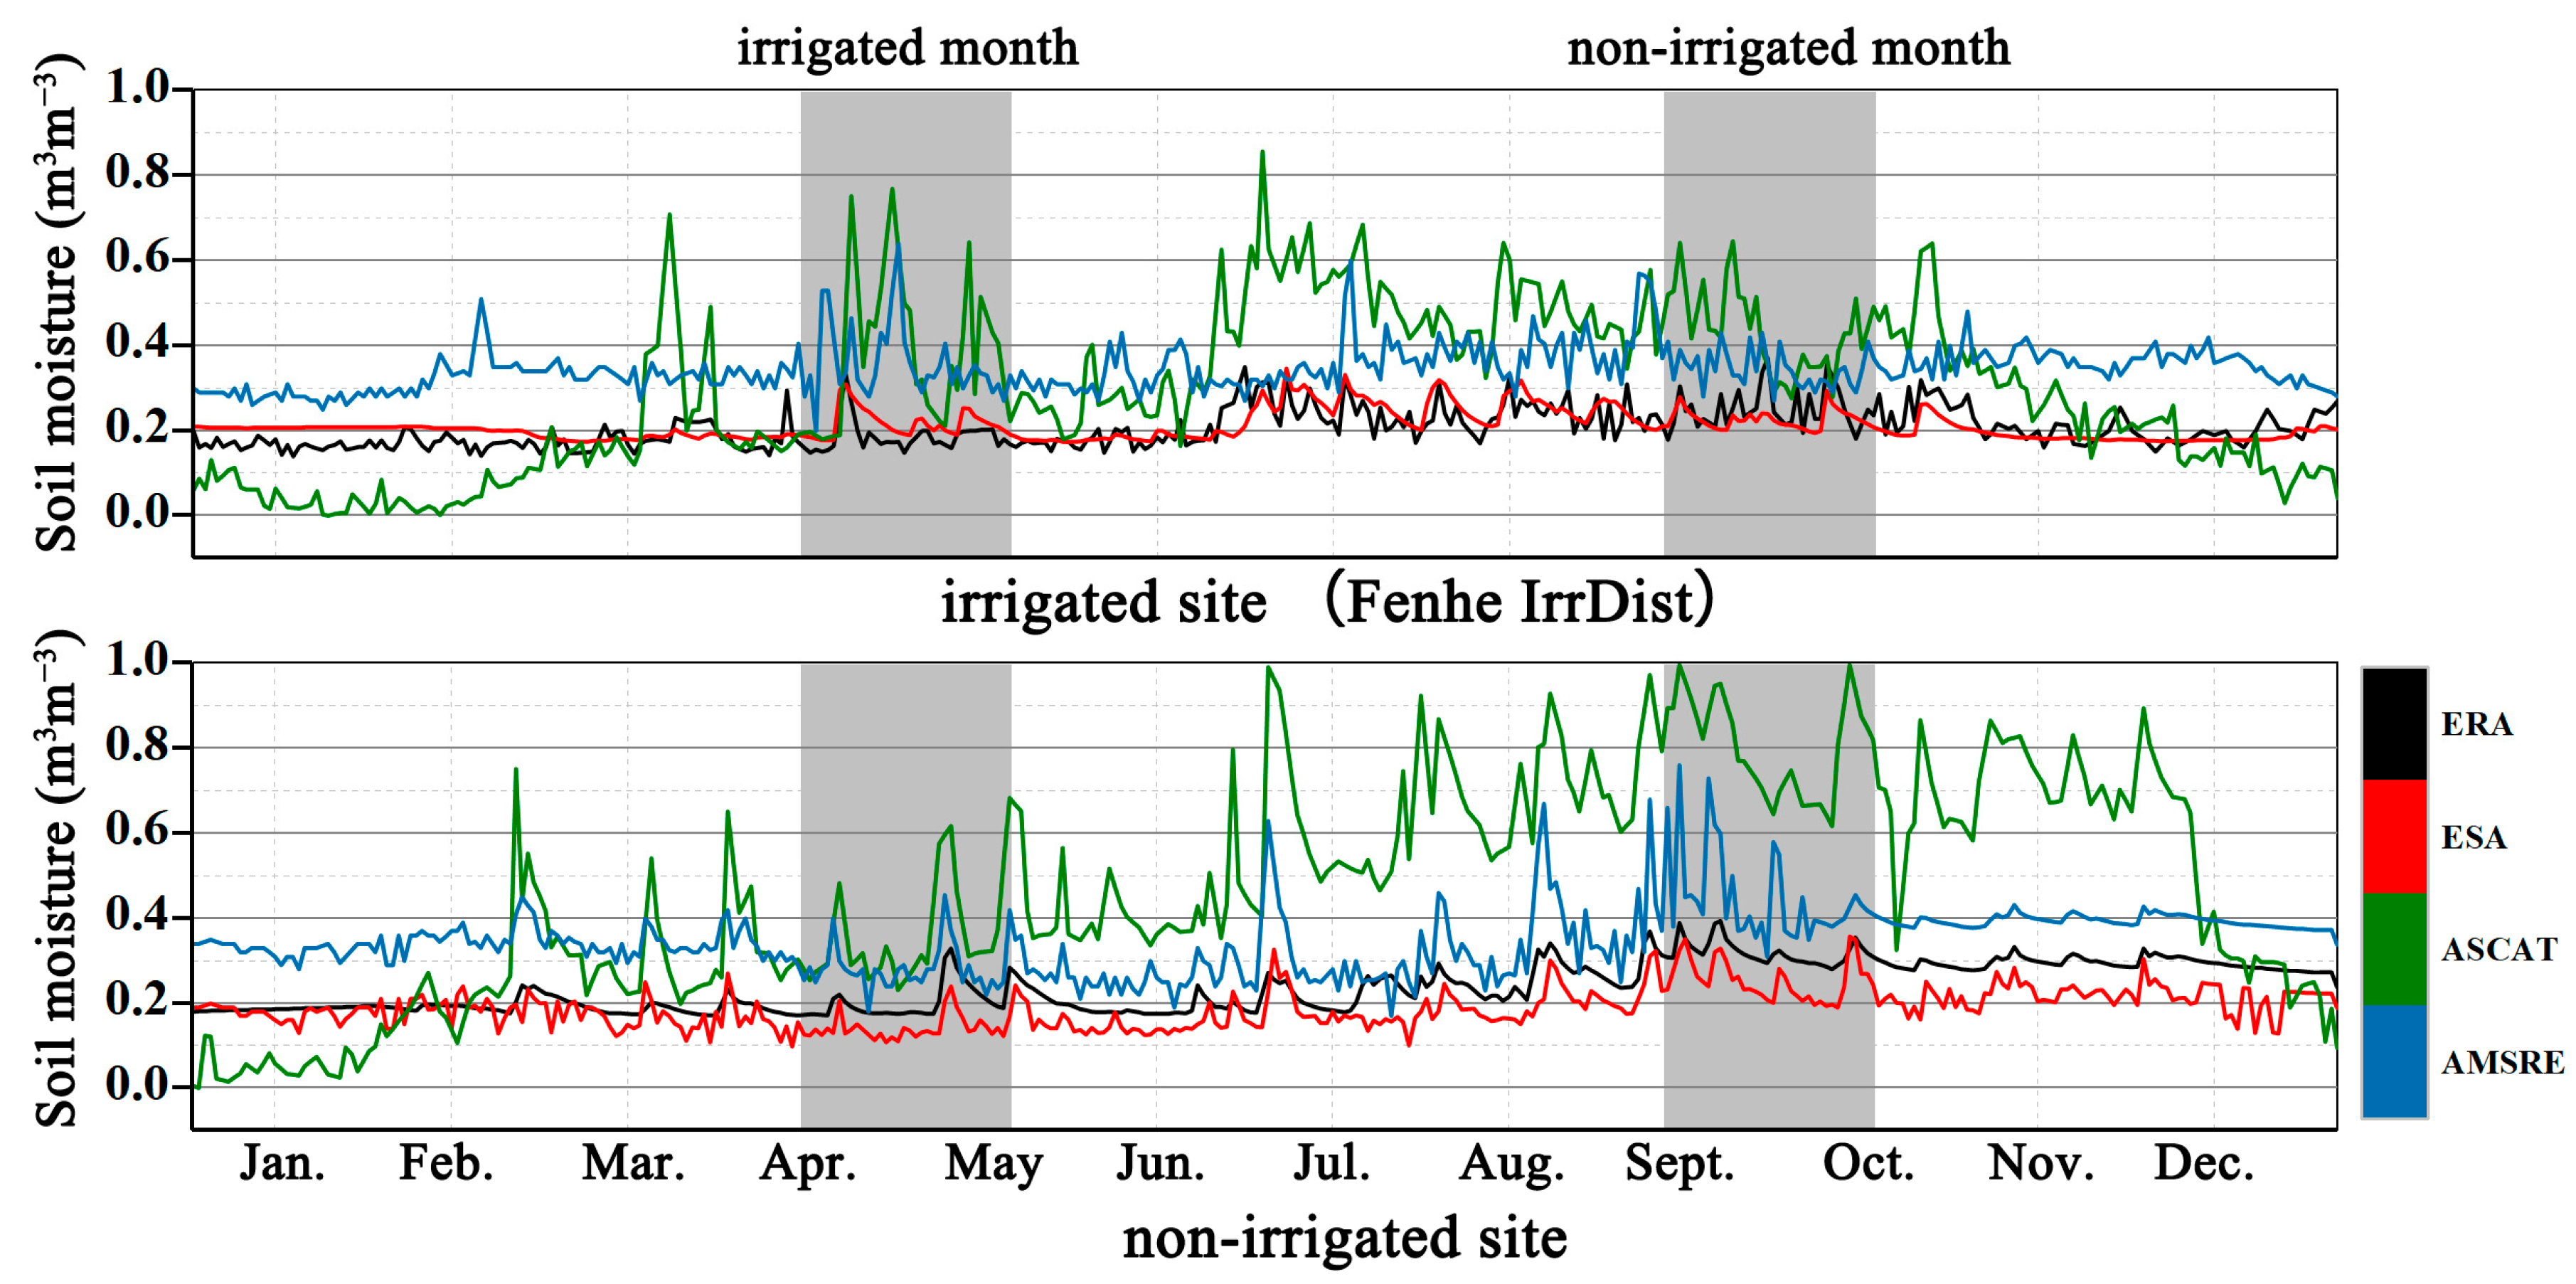
In the case study area, the usual practice was to sow winter wheat between late September and early November, following pre-winter and spring irrigation schedules. As a result, there are few irrigations in September but plenty in April. Furthermore, in April, irrigated crops had higher evapotranspiration than non-irrigated crops. We selected a typical irrigated station (112.24° E, 37.41° N) and a non-irrigated site (103.5° E, 30.5° N) to show the differences between three MRS products and ERA reanalysis simulated datasets (Figure 5). At the irrigation site, noticeable differences were observed in the time series curves between April and May, indicating irrigation activities. Nevertheless, the non-irrigation site showed stable curve patterns without significant fluctuations.
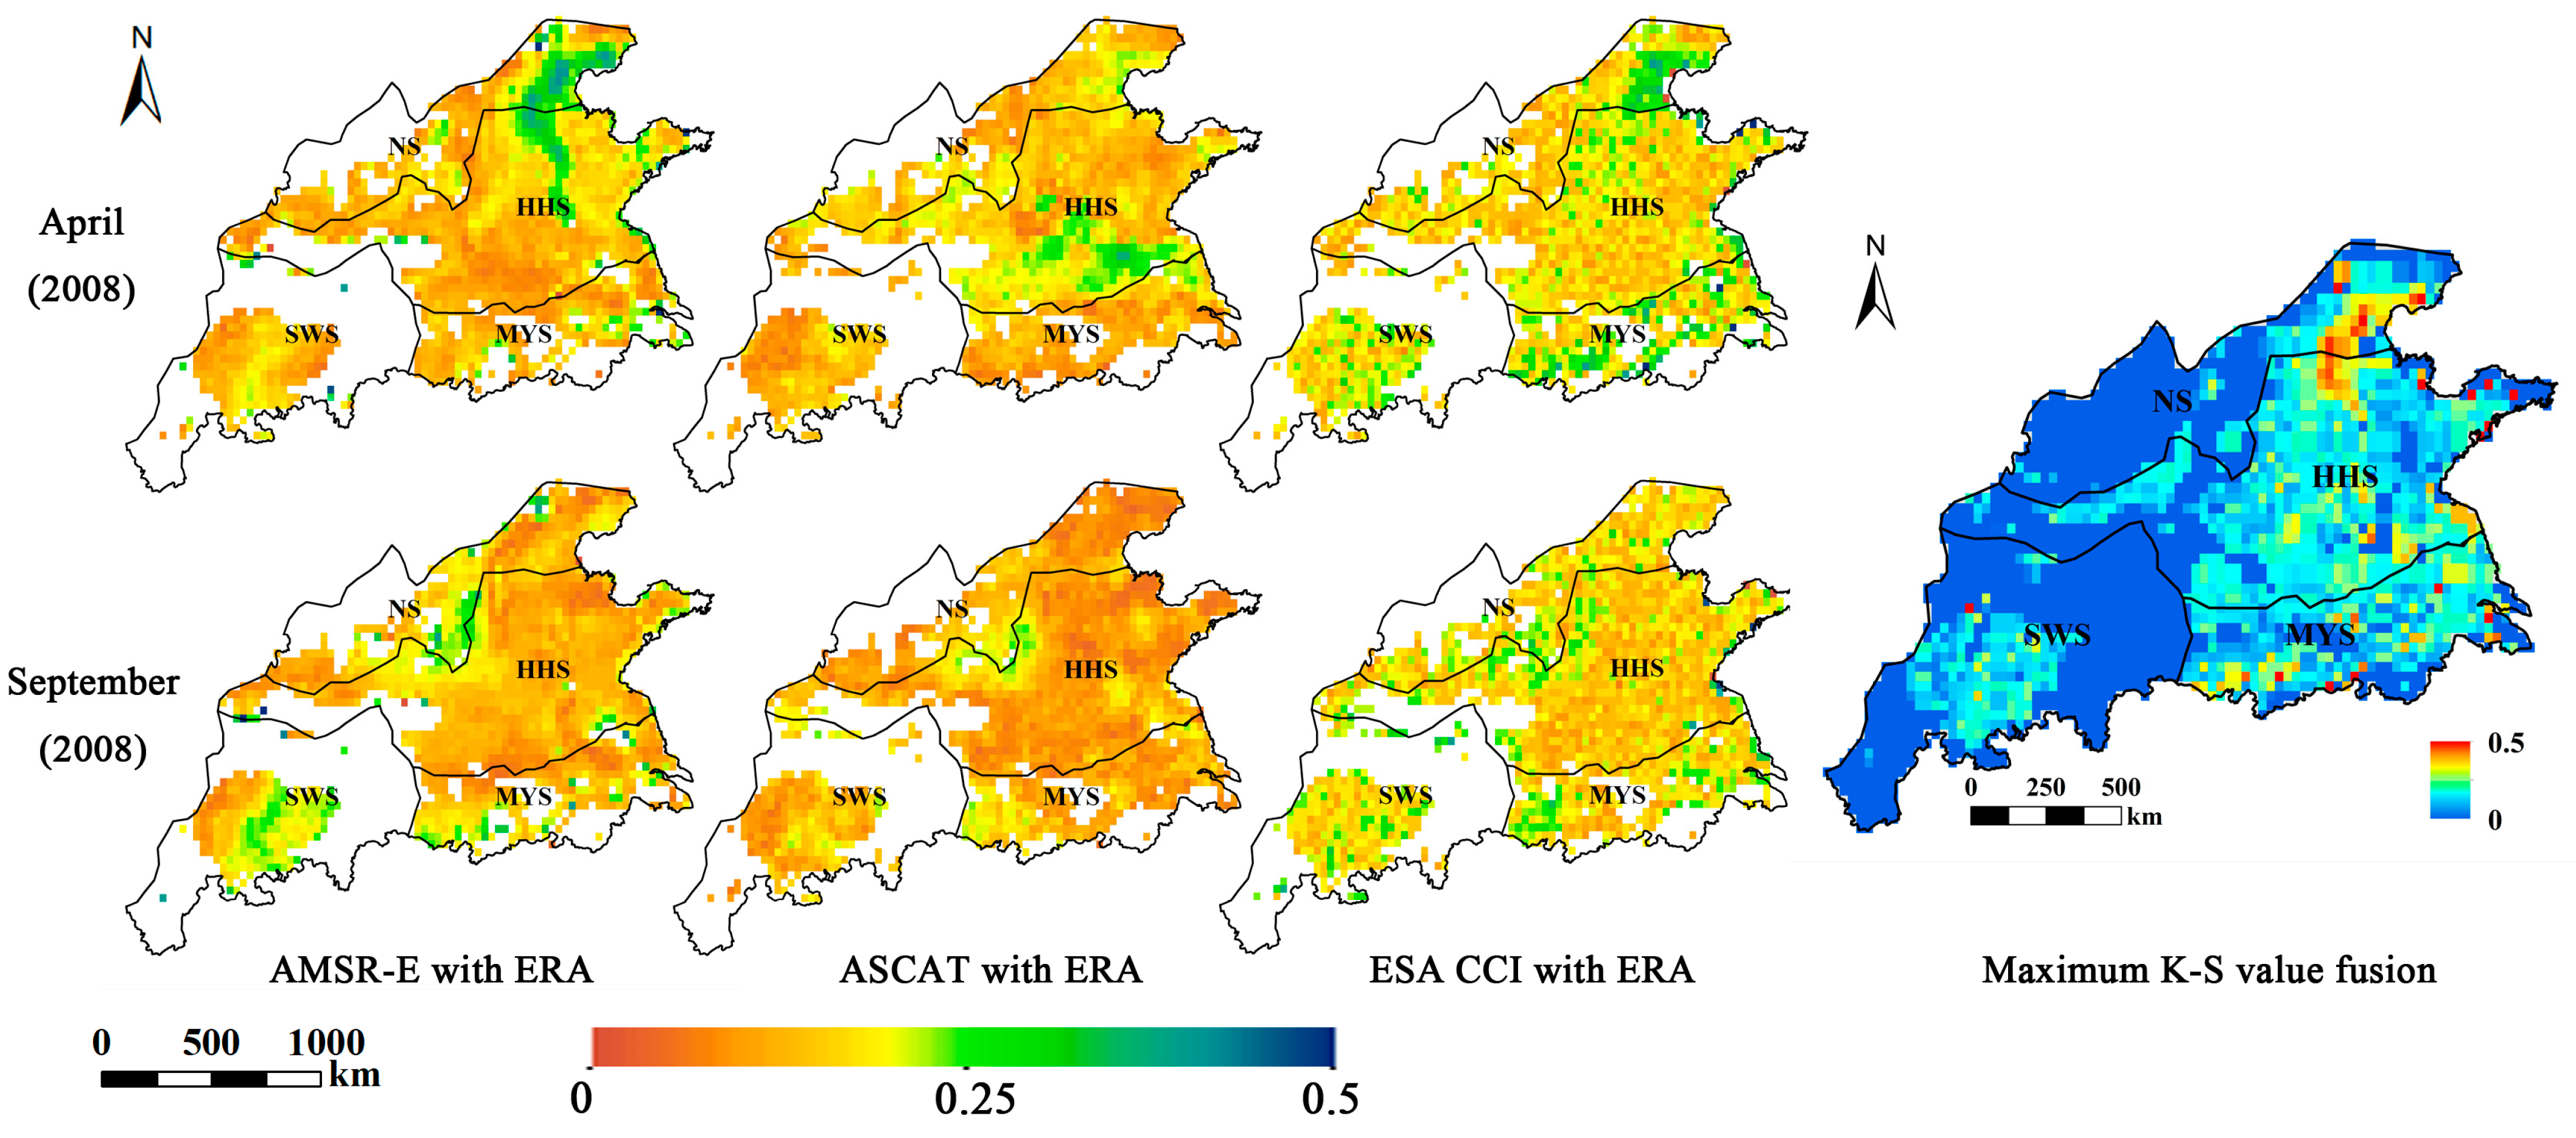
Irrigation and non-irrigation signals were extracted from the K-S test. In irrigation month (April), the K-S test results of the three control groups showed significant spatial distribution differences. The AMSRE with ERA group successfully detected irrigation signals in the northern region of NS and the middle region of HHS. The ASCAT with ERA group detected irrigation signals in the southern part of NS and HHS. The ESC CCI with ERA group highlighted irrigation signals in SWS, MYS, and northern NS. In non-irrigation months (e.g., September), there were no apparent differences among the K-S characteristic values and distributions. The maximum K-S test results merged signal information of all groups and showed high consistency with the spatial distribution of GMIA 5.0 (Figure 6).

3.2. Phenological Parameter Extraction Based on ORS Vegetation Index

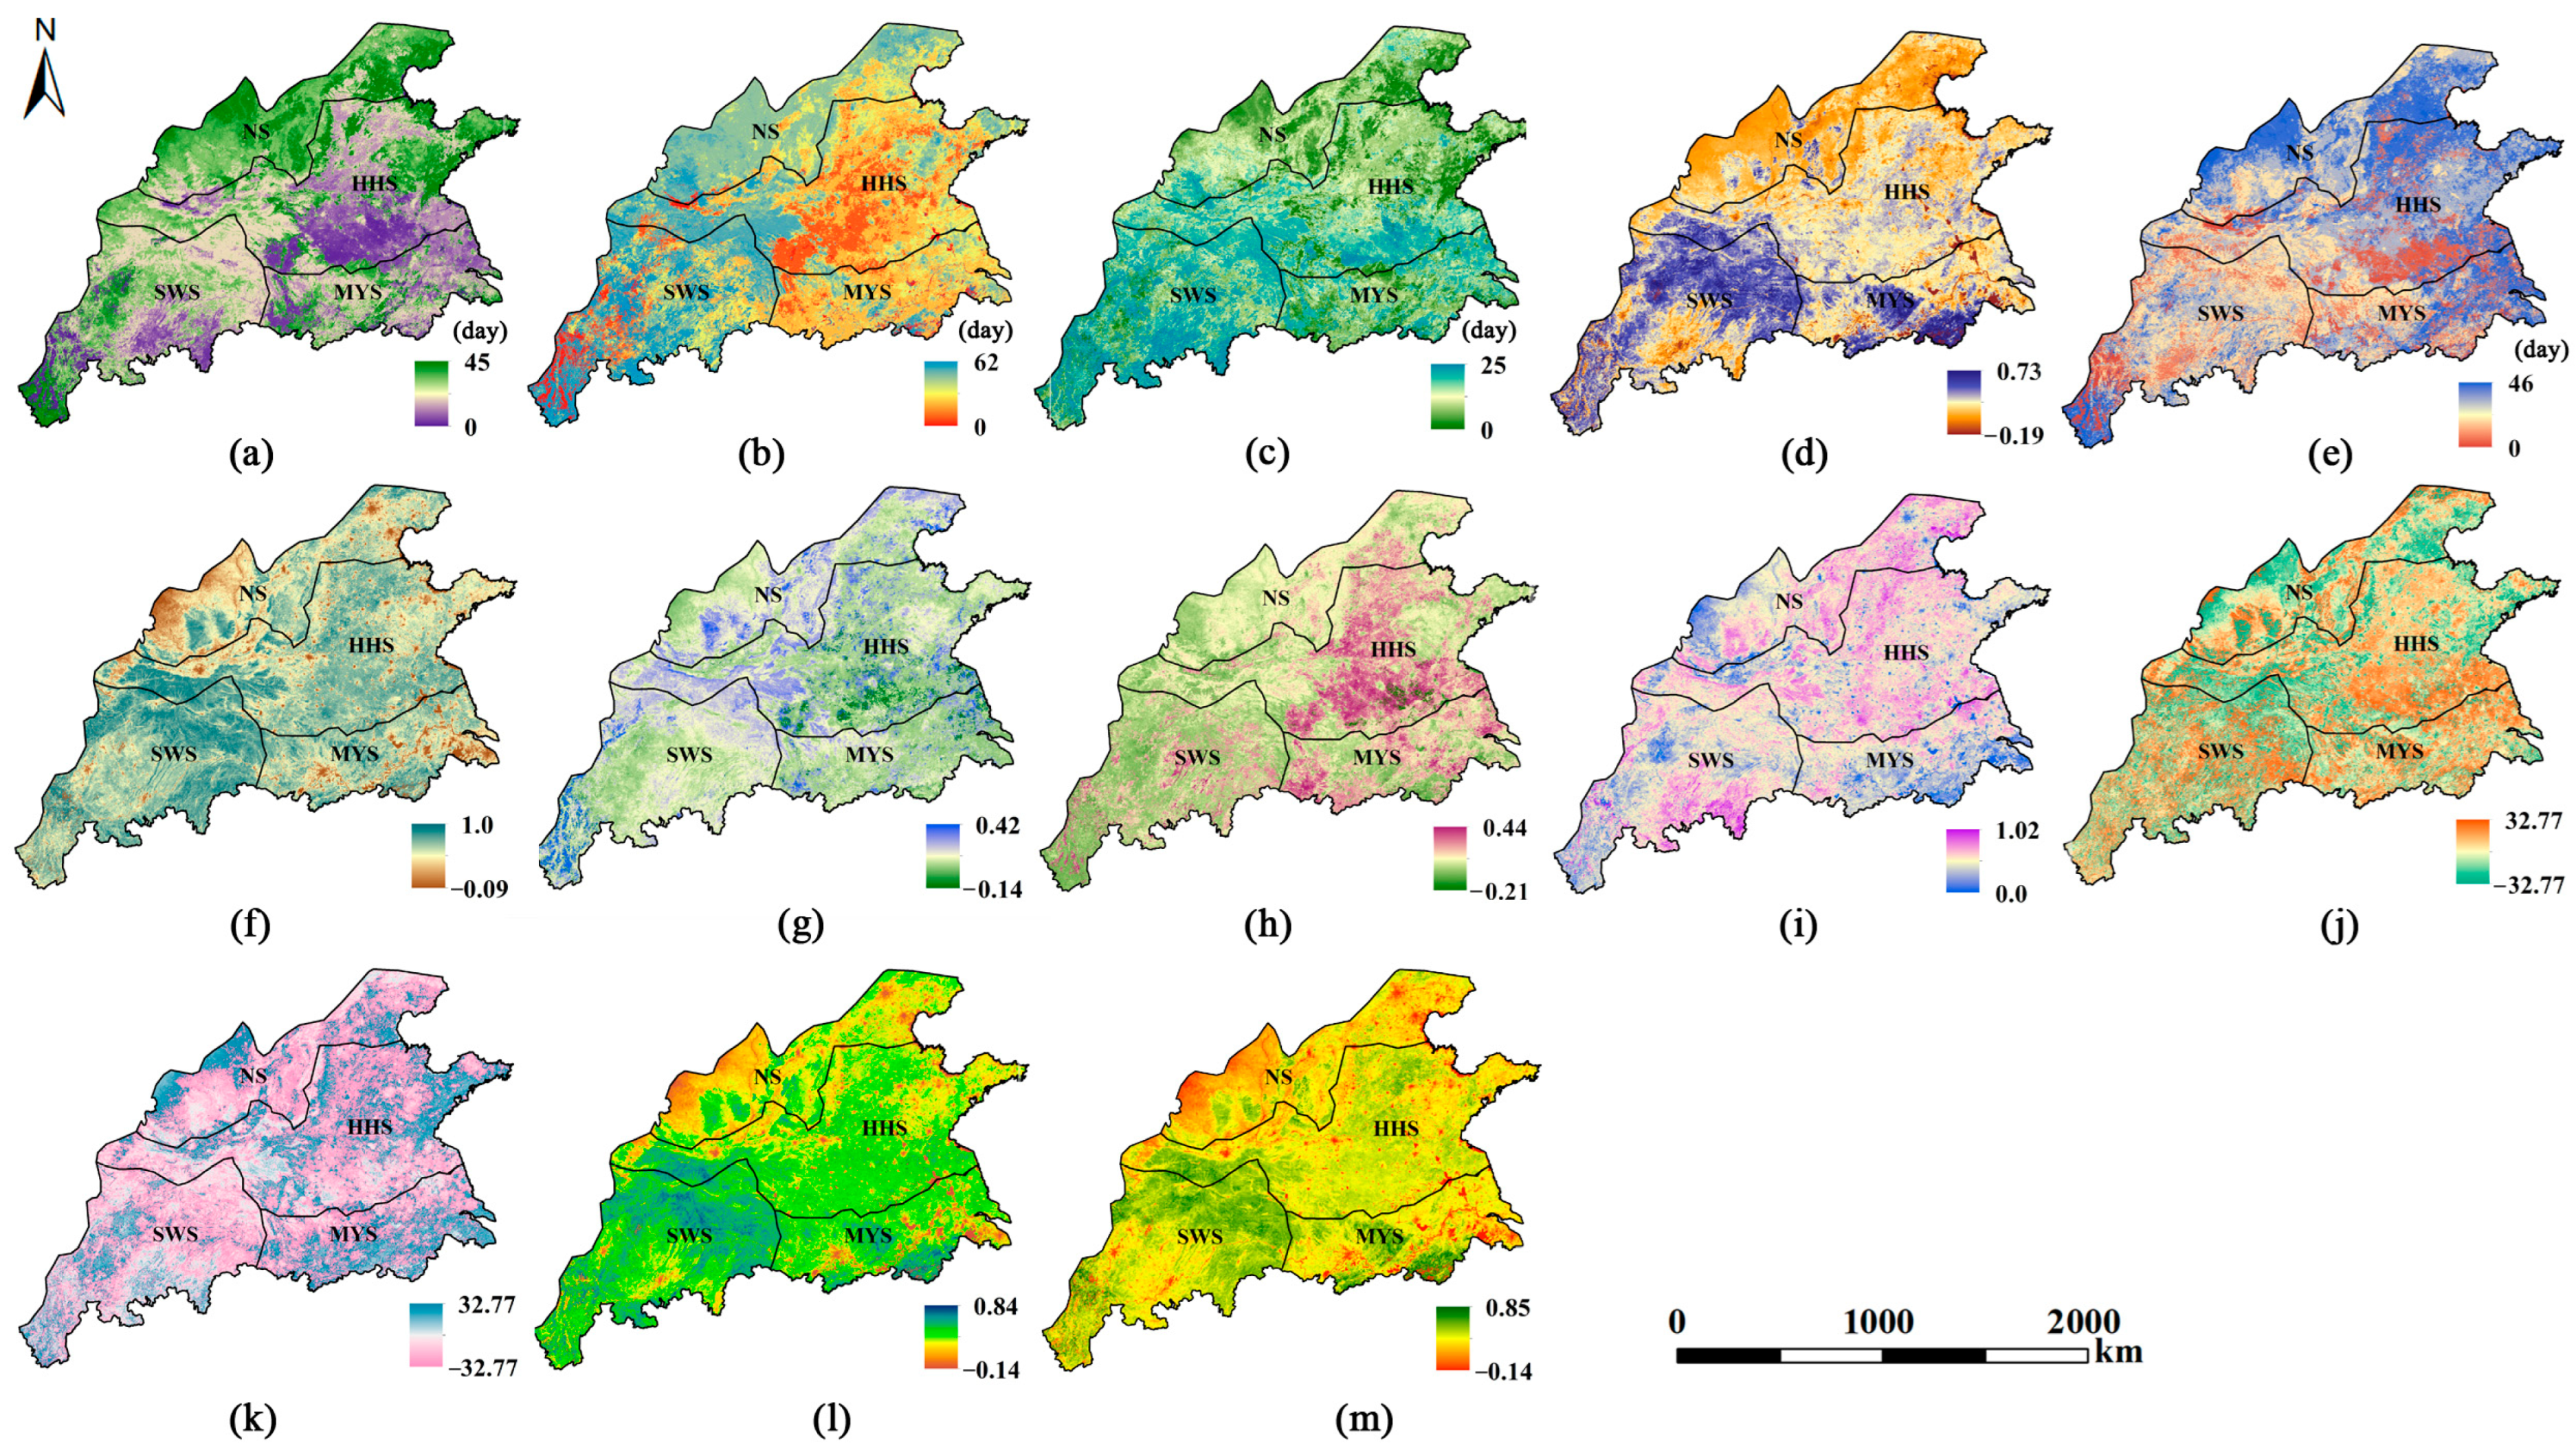
The spatial distribution of certain phenological parameters, such as SGS, EGS, LGS, base level, left derivative, right derivative, and large integral, were consistent with the distribution of irrigated areas in GMIA 5.0 (Figure 7). However, there were significant spatial differences and separability in the phenological parameters of winter wheat across sub-regions. Thus, all phenological parameters were involved in irrigation mapping to avoid losing helpful information.

3.3. Irrigation Mapping Based on Zoning and Multi-Source Remote Sensing Data Fusion

To ensure the accuracy of the irrigated area map, we adopted a zoning scheme and calculated the irrigation intensity of each sub-region based on GMIA 5.0 (Table 2). The ROIs for the irrigated area were sample points with irrigation intensity equal to or more than the upper quartiles, and the ROIs for the non-irrigated area were sample points with irrigation intensity equal to 0. Thus, the irrigation intensity threshold was 4500 for NS and HHS and 3000 for SWS and MYS. The ORS-based map was produced based on the ROIs of GMIA. However, the MRS-based irrigation map and the ORS-based irrigation map exhibited overestimation phenomena in all sub-regions (Figure 8). About 70% of pixels were identified as irrigation in MYS and HHS, and more than 30% were classified as irrigation in NS (Table 3).
The spatial distribution of the decision-level fused irrigation map exhibited the highest level of consistency with the GMIA 5.0. We fused images at different resolutions to analyze the impact of resolution on the fusion process. The results indicated that the decision-level fusion at high resolution performed better than that at low resolution, preserving more detail and removing more noise. Compared with irrigation mapping results based on single remote sensing, the decision-level fusion method based on multi-source remote sensing compensated misclassification problems caused by redundant spectral information. The method significantly improved the accuracy and resolution of the irrigated area map (Figure 7).
Decision-level resultant maps both demonstrated a similar distribution pattern characterized by a gradual decrease in irrigation density from east to west. The primary source of irrigation water in the North China Plain was groundwater, resulting in a triangular distribution of irrigated areas, decreasing from east to west [54]. The Qinling Mountains intercepted the southward warm and humid airflow between NS and HHS, leading to a narrow crescent distribution of irrigated areas along the Taihang Mountains-Qinling Mountains [55]. The SWS irrigated areas were surrounded by Daba Mountains, Qinghai-Tibet Plateau, Wuyi Mountains, and Yunnan-Guizhou Plateau, forming an almost circular shape around the Sichuan Basin. Many irrigated districts, such as Fenhe, Baojixia, Dujiangyan, Zhanghe, Shijin, and Pishihang, have intensively irrigated behaviors (Figure 8). As shown in Figure 9, the decision-level resultant maps performed well in Baojixia Irrigated District and Fenhe Irrigated District, and some pixels along mountains were not classified into irrigation areas. However, they did not perform well in Dujiangyan District and Pishihang District because of the flatter terrain.

3.4. Precision Evaluation

In irrigation mapping research, it was essential to prioritize the accuracy of identifying irrigated areas and improving the identification rate of non-irrigated areas [6]. According to the precision evaluation with ground points, the PA and UA values of irrigated and non-irrigated pixels of the map with ORS resolution were 71.05% and 75.56%. The OA was 73.49%. The PA values of irrigated pixels and non-irrigated pixels of the map with MRS resolution were 68.42% and 65.91%, while the UA values were 63.41% and 70.73%. The OA was 67.07% (Table 4). The higher-resolution resultant map performed better than the lower-resolution one. Compared with other existing maps, the OA and the UA for irrigation areas of the resultant map at higher resolution were the highest. Therefore, the irrigation mapping method with ORS and MRS was able to effectively identify irrigated areas.
We compared the city-level differences between the irrigated area statistics from the resultant map in this study and the effective irrigated area data from the National Statistics of China. Compared with the statistical data, the map we produced had some overestimation because of the spatial resolution of remote sensing data. However, the resultant map at ORS resolution shows a good agreement with the statistics in general, with the coefficient of determination (R2) of 0.757. Meier’s map matched the municipal statistics with R2 of 0.775 because the land use cover dataset was included [21]. GFSAD has the lowest R2 of 0.606.
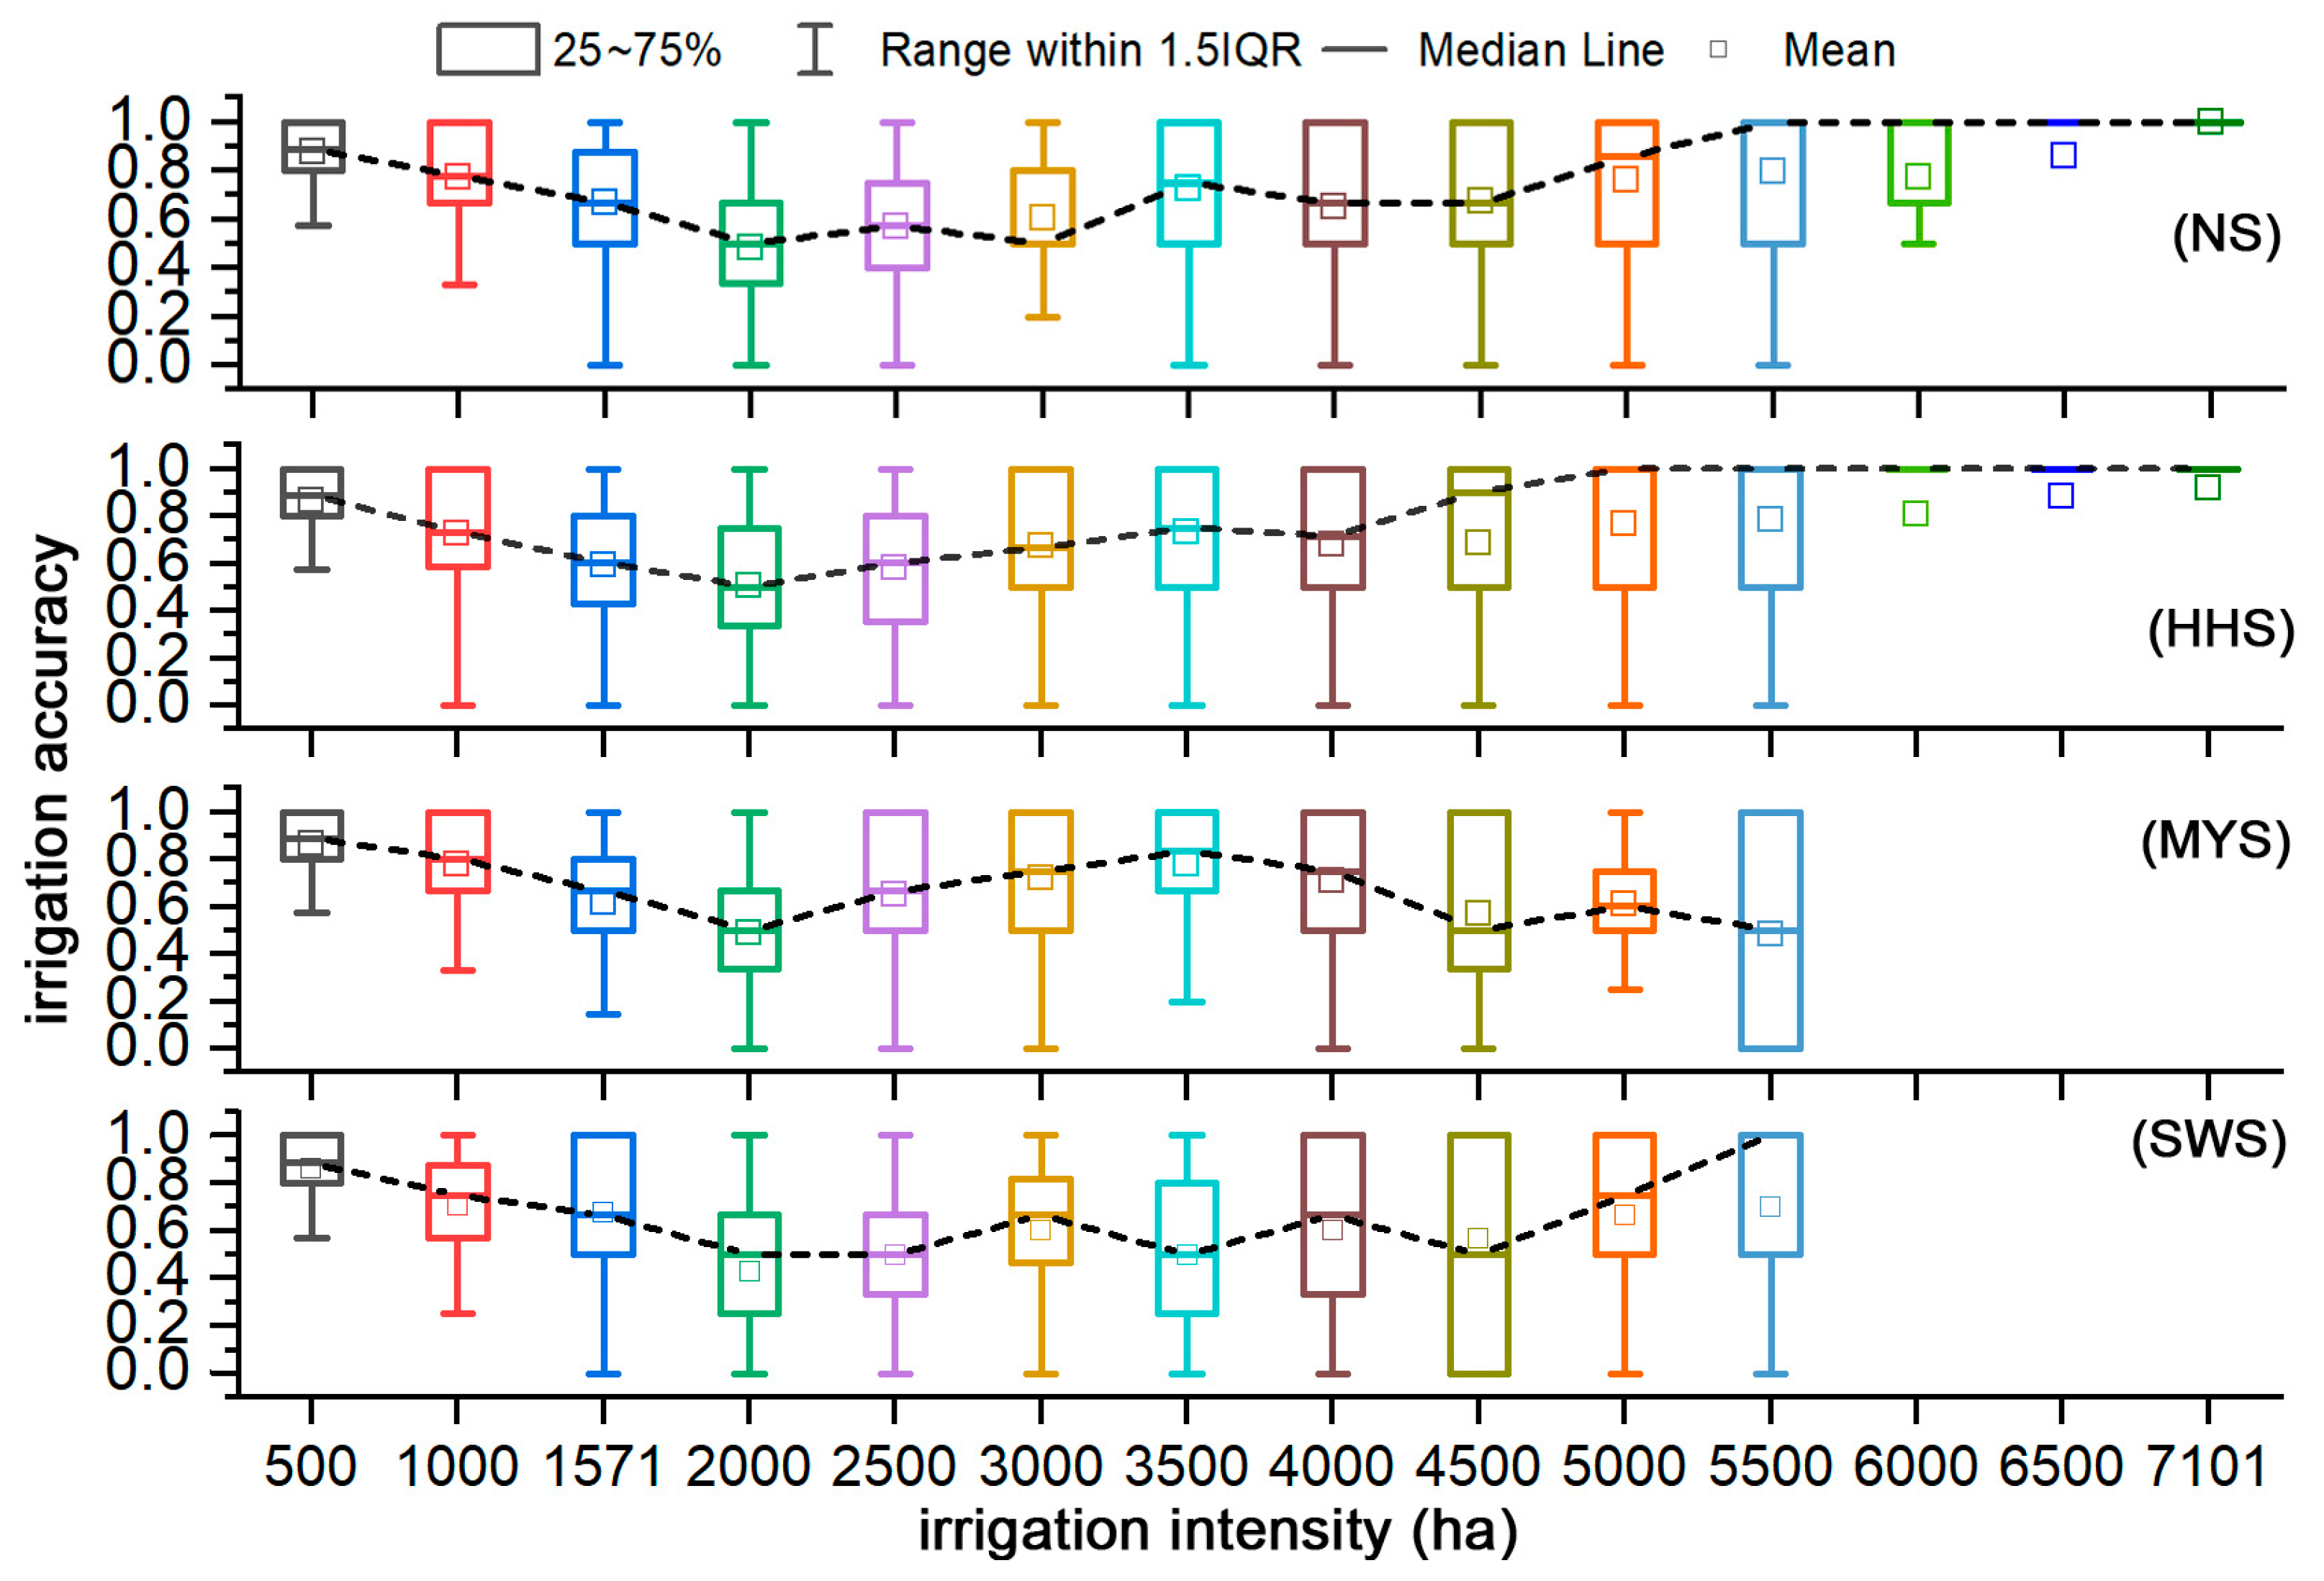
According to the above validation results, we can conclude that the decision-level map at high resolution is better than that at low resolution. Thus, we used the higher-resolution map to calculate the indicator IA. The minimum irrigation intensity value of 1572 was taken as the threshold Δ for IA (Table 2). In general, the IA of non-irrigated areas (0–1571) in all sub-regions decreased as the irrigation intensity increased. However, the IA of irrigated areas (1572–7101) varied across different sub-regions. The IA of irrigated pixels peaked at an irrigation intensity of 3500–4000 and then decreased in MYS. In HHS, the IA of irrigated pixels increased with the irrigated intensity and peaked at an irrigation intensity of 5000. The irrigation patterns of SWS and NS were more complex than those of MYS and HHS, which led to the unstable changes of IA. In NS and SWS, the amounts of pixels with low irrigated intensity were more than those with a high one (Figure 10). This approach, however, could not be effectively applied to areas with low irrigation intensity and discrete irrigation activities.

4. Discussion

4.1. The Influence of Selection of Multi-Source MRS Soil Moisture Data on Irrigation Mapping

MRS and meteorological simulation model (MSM) were the primary skills for obtaining regional soil moisture and monitoring irrigation behaviors. However, different soil moisture products have different characteristics and limitations. Microwave soil moisture products mainly differed in terms of sensors (active/passive), inversion methods, and spatial-temporal resolutions. Soil moisture in the irrigated areas strongly correlated with irrigation, while soil moisture in non-irrigated areas had no significant deviation in terms of rainfall [56]. When the irrigation behavior was not considered in MSM, the differences between MSM with MRS could be used to detect the irrigated areas [34]. In addition, different soil moisture products had different sensitivities to soil properties, climatic conditions, vegetation coverage, and other factors. The differences between SMOS and ERA were mainly affected by terrain and soil characteristics. In contrast, the differences between ASCAT and ERA were primarily influenced by rainfall and evaporation, and ASCAT was more sensitive to irrigation than SMOS and AMSR2 [57]. Other microwave soil moisture data, including AMSR-E and ESA-CCI, also exhibited sensitivity to irrigation-induced soil moisture changes.
In three soil moisture control groups, irrigation signal intensities varied across regions. Therefore, restoring the actual irrigation intensity with any single control group was challenging. The irrigation signals between ESA CCI products and ERA were weak because ESA CCI matched the Global Land Data Assimilation System (GLDAS) in its algorithm [36]. Therefore, the study utilized the pixel-by-pixel maximum fusion method to aggregate irrigation signals and maximize the benefits of multi-source microwave soil moisture products. The above research proved that various microwave soil water products was able to improve accuracy and reliability significantly.
The K-S test was a commonly used method for comparing the similarity of distributions between two samples. It was frequently utilized in microwave soil moisture and soil water distribution models to extract irrigation signals [34]. However, it is worth noting that a high K-S value did not always indicate a significant irrigated area. Disparities in remote sensing could also influence the K-S value magnitude [3]. Besides, Massari et al. concluded that the spatial mismatch between model and satellite data and the confounding effects of topography, vegetation, frozen soils, and radiation frequency interference would lead to substantial uncertainties in most regions [4]. As a result, this study also incorporated NDVI phenological parameters as an additional factor to identify irrigated areas.

4.2. The Influence of NDVI Phenological Parameters and Zoning Scheme on Irrigation Mapping

NDVI-based phenological parameters are the most intuitive and sensitive indicators for seasonal and interannual changes in environmental conditions [58]. However, different phenological parameters responded differently to soil moisture. For example, the SGS parameter, which indicated the greening stage of winter wheat, was more easily influenced by low temperature than soil moisture, and appropriate water stress could boost wheat growth. The left and right derivatives of NDVI represented winter wheat’s growth and ripening rate [49]. After heading, wheat experienced an increased demand for water due to a higher transpiration rate resulting in water loss. This posed a challenge in arid to semi-arid regions where more than precipitation was needed to satisfy wheat’s growth requirements. Drought during the filling period may reduce the filling rate of wheat and result in a shorter LGS [58]. Maximum NDVI indicated the peak photosynthetic activity of winter wheat at the heading stage [10,43]. The growing season integral measured the accumulated photosynthesis during the growing season and was closely related to biomass or net primary productivity [49,59]. Srivastava et al. showed a close correlation between the large integral value and crop evapotranspiration [60]. Its value was higher in irrigated areas than that in non-irrigated areas. Jin et al., used maximum NDVI and Time Integral NDVI to successfully classify irrigated wheat in a semi-arid region of China [10]. The maximum NDVI value of dryland wheat occurred earlier than irrigated wheat.
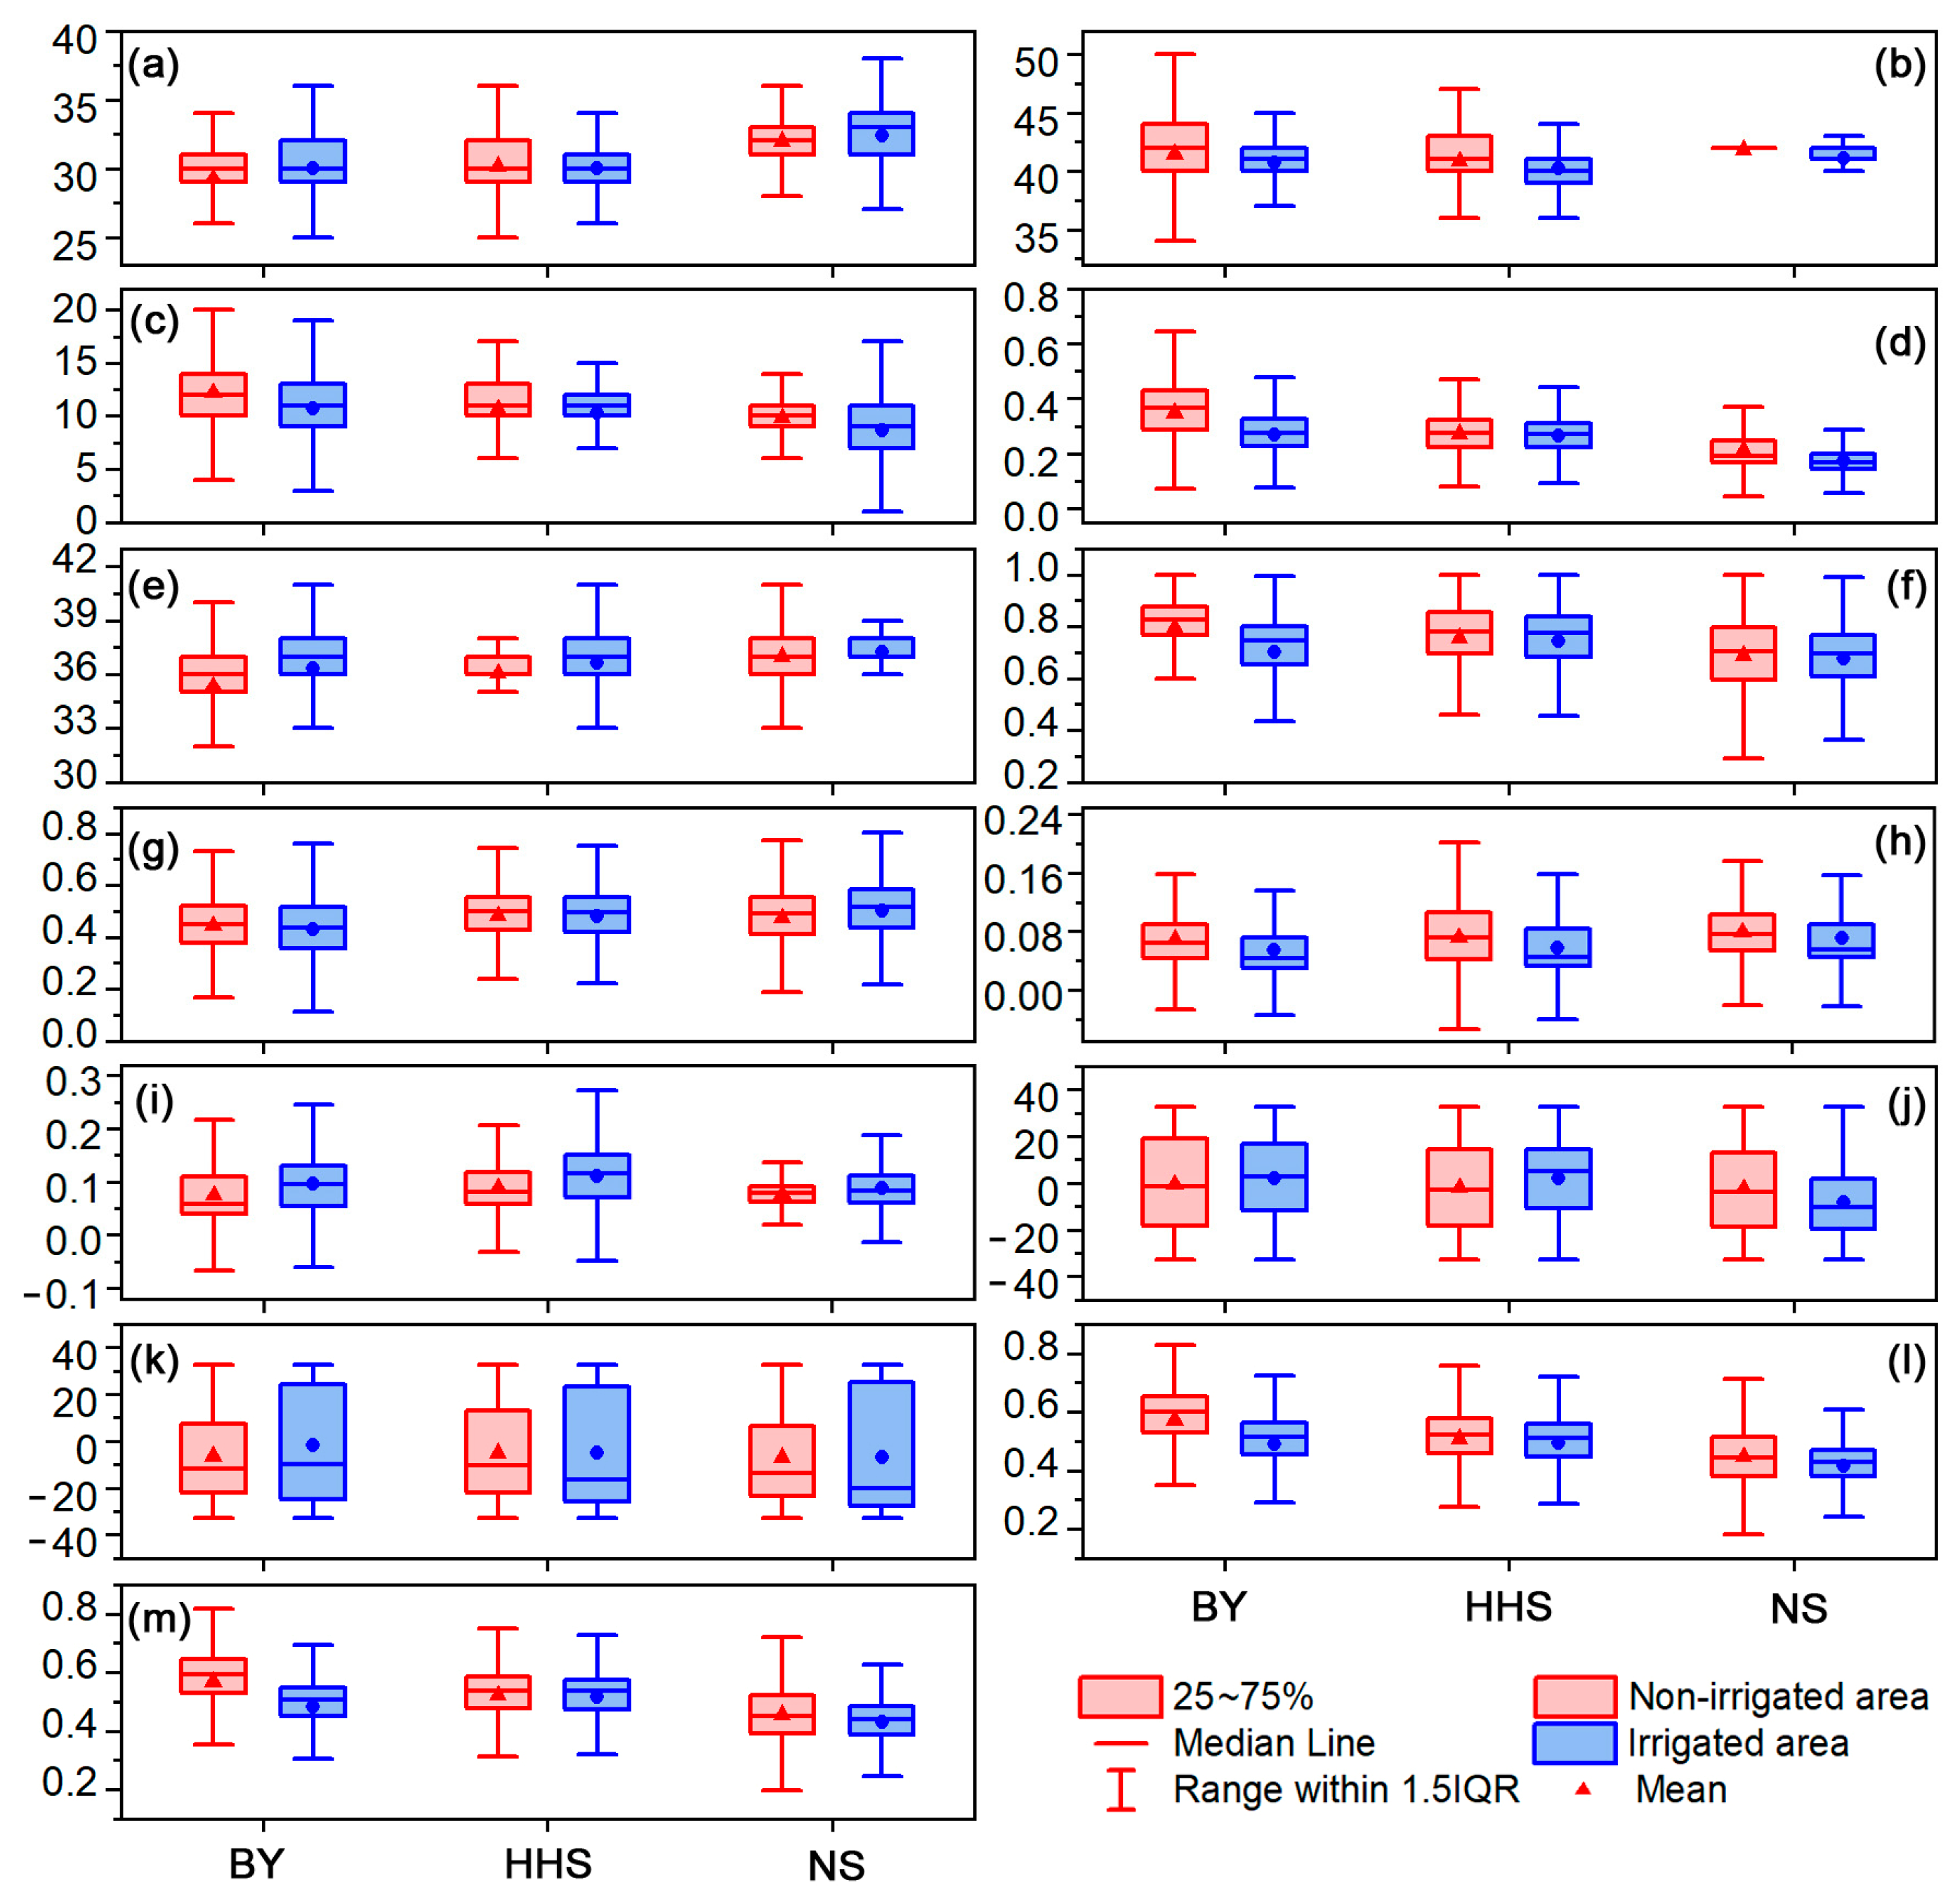
The GMIA threshold separated the phenological parameters of irrigated and non-irrigated areas, but the separability differed among sub-regions (Figure 11). For example, SGS’s NDVI distinguished irrigated and non-irrigated areas in NS and the banks of the Yangtze River (BY, including SWS and MYS) but not in HHS. SGS was able to separate the irrigated and non-irrigated areas in BY and NS but not in HHS. Existing irrigation maps also showed differences in irrigation intensity across different sub-regions (Figure 2). Therefore, the phenological zoning method was suitable for mapping irrigated areas in the case area. However, we did not use land cover datasets to separate cropland and forest, which led to some overestimations in the irrigated map with ORS (Figure 8b). Additionally, NDVI is more applicable for vegetation cover between 25% and 80%, and the effectiveness of NDVI declines as the vegetation cover exceeds 80% [61]. Thus, this study comprehensively utilized the advantages of both ORS and MRS to enhance the interpretability and accuracy of irrigation maps.
In recent years, many scholars proved the sensitivities of GI to irrigation activities and combined GI with NDVI for irrigation mapping [14,17,27]. We may integrate these two indices in future studies to enhance the irrigation map. Additionally, machine learning classification methods, such as supervised classification [51] and unsupervised classification [18,62,63], including decision trees [14,19,21,22], random forests [17,26,64], support vector machines [10,65], and clustering or combinatorial classifiers [66], are often used to classify and extract irrigation information from the ORS imagery. More complex machine learning classification approaches, instead of the traditional maximum likelihood ratio classification method in this study, need to be used to weaken the influence of mixed pixels when integrating more ORS metrics.

4.3. Advantages and Other Limitations of Irrigation Mapping Based on Multi-Source Remote Sensing and Decision-Level Fusion

Remote sensing data fusion methods contain three levels: pixel, feature, and decision. The feature-level fusion method is able to effectively reduce data dimensions and enhance fusion results interpretation, but feature screening significantly impacted fusion results. Ensuring clear correlation and interpretation between features is crucial for feature-level fusion [67]. The decision-level data fusion method displayed the highest levels of the two methods. The mapping results obtained through decision-level fusion were compared to those obtained through feature-level fusion. The latter map showed much more overestimation. The decision-level fusion weakened the spatiotemporal and mechanistic differences between ORS phenological parameters and MRS K-S signals. Moreover, it also ensured the identification accuracy of irrigation areas and improved the recognition rate of the non-irrigation areas. Some other scholars also used the Sentinel 2 optical time series and the soil backscatter response of Sentinel 1 synthetic aperture radar time series to map irrigated areas [68,69,70]. In addition, Singh et al. used AMSR-E and SPOT NDVI to discern shifting irrigation practices [32]. However, few researchers cooperated multi MRS data with ORS to map irrigation.
The case area of this study was China’s main winter wheat production region, where irrigation intensities vary across sub-regions (Table 2). In HHS and NS, high irrigation intensity pixels are much more frequent than low ones. However, the proportion of irrigated pixels in the total area is relatively small in NS, and limited rainfall and high evaporation bring much irrigation demand in NS. In SWS, the irrigated areas are less than non-irrigated areas, and there is significant variation in irrigation intensity. Moderate irrigation intensity is predominant in MYS (Figure 2). Rainfall provides much soil moisture for vegetation in BY [71]. Moreover, the irrigation method is also able to affect the soil moisture memory curve, thereby impacting the accuracy of irrigation mapping. In plain areas (HHS), sprinkler irrigation is the predominant irrigation method. The significant changes in soil moisture in sprinkler irrigations would translate into changes in remotely sensed signals [4]. However, the irrigation methods are diverse and complex in watershed areas (MYS and SWS), making detecting using coarse-resolution satellite sensors more challenging.
Given the above two points, the irrigated scope in these regions varied inapparently across different existing irrigation maps. Thus, more complex and higher-resolution input data are needed for small-scale regions and heterogeneous landscapes [26]. In these regions, the actual evapotranspiration of crops is close to potential evapotranspiration, which can be simulated from meteorological data (Meteosat-9 ET, [72]), land surface brightness temperature (MOD16A2 ET [73], Landsat 8 LST [74]), gravities (Gravity Recovery and Climate Experiment, GRACE [75]) or thermal infrared data [76]. For instance, Pun et al. computed an evaporative fraction based on the surface energy balance system model and applied a simple threshold on vegetation indices to discriminate irrigated areas [27].
Moreover, the study primarily relied on remote sensing data and did not incorporate additional non-remote sensing data, apart from the GMIA. The topographic derivatives, soil texture, land-cover distribution, crop coefficient, and social behaviors also affect the distribution and amount of irrigation. For instance, Zurqani et al. integrated Sentinel-2 spectral indices, climate elements (precipitation, evapotranspiration, aridity, humidity, and temperature), and topographic derivatives to map the irrigated areas in the coastal plain of the South Carolina region [64]. Attia et al. integrated water accessibility (distance from surface water and groundwater potential), soil, climate conditions, slope, and land use/land cover to promote irrigation in Mali [77]. However, it is essential to carefully consider the trade-off between additional data sources and mixed pixels. While additional data can provide valuable information, the complexity introduced by mixed pixels may also introduce uncertainties in the analysis and require additional computational resources. Future research must balance data richness and manage the associated uncertainties and resource requirements.

5. Conclusions

The differences in soil moisture between MRS and MSM can be used for irrigation mapping. The K-S test was employed to identify the differences and detect irrigation signals. However, the effectiveness of these products can vary across different regions. The pixel-by-pixel maximum fusion method was used to merge signals from multiple MRS data and enhance the detection. The vegetation phenological parameter based on NDVI was a reliable way to track dynamic ecosystem change. It could effectively detect irrigated areas by highlighting the differences in vegetation growth between irrigated and non-irrigated areas. However, different NDVI phenological parameters among different sub-regions had different responses to soil moisture. Thus, a zoning scheme was used to maximize the effectiveness of phenological parameters in each sub-region.
Various fusion strategies were utilized to optimize the integration of ORS phenological parameters with MRS K-S signals. Irrigation mapping based on multi-source remote sensing and decision-level fusion at high resolution maximized the benefits of this integration. It overcame the overestimation problem of irrigation pixels in ORS, addressed the issue of coarse spatial resolution in MRS, and maintained a high level of consistency with existing irrigation mapping. These innovative elements contribute to a more accurate and comprehensive map of irrigated areas in China’s winter wheat region, enabling effective water resource management and sustainable agricultural practices. However, this approach is straightforward but inaccurate in small-scale regions or watershed areas, requiring finer and higher-resolution data, such as land cover and evapotranspiration.

Author Contributions

Conceptualization, W.Z. and X.Z.; data curation, J.M. and J.L.; formal analysis, X.Z.; funding acquisition, X.Z.; investigation, W.Z. and J.L.; methodology, W.Z. and J.M.; project administration, W.C.; supervision, Y.T. and Y.Z.; validation, Z.Z. and Q.H.; visualization, Z.Z., Q.H. and R.X.; writing—original draft, W.Z. and J.M.; writing—review and editing, W.Z. and X.Z. All authors have read and agreed to the published version of the manuscript.

Funding

This research is supported by grants from the National Key R&D Program of China (No. 2022YFD2001103-2) and the Key Projects (Advanced Technology) of Jiangsu Province (Grant No. BE2021308).

Data Availability Statement

The data presented in this study are available on request from the corresponding author.

Conflicts of Interest

The authors declare no conflict of interest.

References

  1. Tsunekawa, A.; Liu, G.; Yamanaka, N.; Du, S. Restoration and Development of the Degraded Loess Plateau, China; Springer: Tokyo, Japan, 2014; pp. 93–108. [Google Scholar] [CrossRef]
  2. Liu, J.; Wiberg, D.; Zehnder, A.J.B.; Yang, H. Modeling the role of irrigation in winter wheat yield, crop water productivity, and production in china. Irrig. Sci. 2007, 26, 21–33. [Google Scholar] [CrossRef] [Green Version]
  3. Kumar, S.V.; Peters-Lidard, C.D.; Santanello, J.A.; Reichle, R.H.; Draper, C.S.; Koster, R.D.; Nearing, G.; Jasinski, M.F. Evaluating the utility of satellite soil moisture retrievals over irrigated areas and the ability of land data assimilation methods to correct for unmodeled processes. Hydrol. Earth Syst. Sci. 2015, 19, 4463–4478. [Google Scholar] [CrossRef] [Green Version]
  4. Massari, C.; Modanesi, S.; Dari, J.; Gruber, A.; De Lannoy, G.J.M.; Girotto, M.; Quintana-Segui, P.; Le Page, M.; Jarlan, L.; Zribi, M.; et al. A review of irrigation information retrievals from space and their utility for users. Remote Sens. 2021, 13, 4112. [Google Scholar] [CrossRef]
  5. Jalilvand, E.; Tajrishy, M.; Ghazi Zadeh Hashemi, S.A.; Brocca, L. Quantification of irrigation water using remote sensing of soil moisture in a semi-arid region. Remote Sens. Environ. 2019, 231, 111226. [Google Scholar] [CrossRef]
  6. Zajac, Z.; Gomez, O.; Gelati, E.; van der Velde, M.; Bassu, S.; Ceglar, A.; Chukaliev, O.; Panarello, L.; Koeble, R.; van den Berg, M.; et al. Estimation of spatial distribution of irrigated crop areas in europe for large-scale modelling applications. Agric. Water Manag. 2022, 266, 107527. [Google Scholar] [CrossRef]
  7. Siebert, S.; Doll, P.; Hoogeveen, J.; Faures, J.M.; Frenken, K.; Feick, S. Development and validation of the global map of irrigation areas. Hydrol. Earth Syst. Sci. 2005, 9, 535–547. [Google Scholar] [CrossRef]
  8. Liu, Y.; Wu, W.; Li, H.; Imtiaz, M.; Li, Z.; Zhou, Q. Intercomparison on four irrigated cropland maps in mainland China. Sensors 2018, 18, 1197. [Google Scholar] [CrossRef] [Green Version]
  9. Shahriar Pervez, M.; Budde, M.; Rowland, J. Mapping irrigated areas in afghanistan over the past decade using modis ndvi. Remote Sens. Environ. 2014, 149, 155–165. [Google Scholar] [CrossRef] [Green Version]
  10. Jin, N.; Tao, B.; Ren, W.; Feng, M.; Sun, R.; He, L.; Zhuang, W.; Yu, Q. Mapping irrigated and rainfed wheat areas using multi-temporal satellite data. Remote Sens. 2016, 8, 207. [Google Scholar] [CrossRef] [Green Version]
  11. Ozdogan, M.; Rodell, M.; Beaudoing, H.K.; Toll, D.L. Simulating the effects of irrigation over the united states in a land surface model based on satellite-derived agricultural data. J. Hydrometeorol. 2010, 11, 171–184. [Google Scholar] [CrossRef]
  12. Dari, J.; Quintana-Seguí, P.; Escorihuela, M.J.; Stefan, V.; Brocca, L.; Morbidelli, R. Detecting and mapping irrigated areas in a mediterranean environment by using remote sensing soil moisture and a land surface model. J. Hydrol. 2021, 596, 126129. [Google Scholar] [CrossRef]
  13. Portmann, F.T.; Siebert, S.; Döll, P. Mirca2000-global monthly irrigated and rainfed crop areas around the year 2000: A new high-resolution data set for agricultural and hydrological modeling. Glob. Biogeochem. Cycles 2010, 24. [Google Scholar] [CrossRef]
  14. Ozdogan, M.; Gutman, G. A new methodology to map irrigated areas using multi-temporal modis and ancillary data: An application example in the continental us. Remote Sens. Environ. 2008, 112, 3520–3537. [Google Scholar] [CrossRef] [Green Version]
  15. Ide, A.K.; Baptista, G.M.d.M. Modis time series for irrigated-area mapping in hydrographic basins of the brazilian northeastern region. Pesqui. Agropecuária Bras. 2018, 53, 80–89. [Google Scholar] [CrossRef] [Green Version]
  16. Xie, Y.; Gibbs, H.K.; Lark, T.J. Landsat-based irrigation dataset (lanid): 30-m resolution maps of irrigation distribution, frequency, and change for the u.S., 1997-2017. Earth Syst. Sci. Data 2021, 13, 5689–5710. [Google Scholar] [CrossRef]
  17. Zhang, L.; Zhang, K.; Zhu, X.; Chen, H.; Wang, W. Integrating remote sensing, irrigation suitability and statistical data for irrigated cropland mapping over mainland china. J. Hydrol. 2022, 613, 128413. [Google Scholar] [CrossRef]
  18. Thenkabail, P.S.; Biradar, C.M.; Noojipady, P.; Dheeravath, V.; Li, Y.J.; Velpuri, M.; Gumma, M.; Gangalakunta, O.R.P.; Turral, H.; Cai, X.L.; et al. Global irrigated area map (giam), derived from remote sensing, for the end of the last millennium. Int. J. Remote Sens. 2009, 30, 3679–3733. [Google Scholar] [CrossRef]
  19. Salmon, J.M.; Friedl, M.A.; Frolking, S.; Wisser, D.; Douglas, E.M. Global rain-fed, irrigated, and paddy croplands: A new high resolution map derived from remote sensing, crop inventories and climate data. Int. J. Appl. Earth Obs. Geoinf. 2015, 38, 321–334. [Google Scholar] [CrossRef]
  20. Teluguntla, P.; Thenkabail, P.S.; Xiong, J.; Gumma, M.K.; Giri, C.; Milesi, C.; Ozdogan, M.; Congalton, R.; Tilton, J.; Sankey, T. Nasa Making Earth System Data Records for Use in Research Environments (Measures) Global Food Security Support Analysis Data (Gfsad) Crop Mask 2010 Global 1 km v001; NASA: Washington, DC, USA, 2016.
  21. Meier, J.; Zabel, F.; Mauser, W. A global approach to estimate irrigated areas—A comparison between different data and statistics. Hydrol. Earth Syst. Sci. Discuss. 2018, 22, 1119–1133. [Google Scholar] [CrossRef] [Green Version]
  22. Ambika, A.K.; Wardlow, B.; Mishra, V. Remotely sensed high resolution irrigated area mapping in india for 2000 to 2015. Sci. Data 2016, 3, 160118. [Google Scholar] [CrossRef] [Green Version]
  23. Zhu, X.; Zhu, W.; Zhang, J.; Pan, Y. Mapping irrigated areas in china from remote sensing and statistical data. IEEE J. Sel. Top. Appl. Earth Obs. Remote Sens. 2014, 7, 4490–4504. [Google Scholar] [CrossRef]
  24. Xiang, K.L.; Yuan, W.P.; Wang, L.W.; Deng, Y.J. An lswi-based method for mapping irrigated areas in china using moderate-resolution satellite data. Remote Sens. 2020, 12, 4181. [Google Scholar] [CrossRef]
  25. Zhang, C.; Dong, J.; Ge, Q. Mapping 20 years of irrigated croplands in china using modis and statistics and existing irrigation products. Sci. Data 2022, 9, 407. [Google Scholar] [CrossRef] [PubMed]
  26. Peña-Arancibia, J.L.; McVicar, T.R.; Paydar, Z.; Li, L.; Guerschman, J.P.; Donohue, R.J.; Dutta, D.; Podger, G.M.; van Dijk, A.I.J.M.; Chiew, F.H.S. Dynamic identification of summer cropping irrigated areas in a large basin experiencing extreme climatic variability. Remote Sens. Environ. 2014, 154, 139–152. [Google Scholar] [CrossRef]
  27. Pun, M.; Mutiibwa, D.; Li, R. Land use classification: A surface energy balance and vegetation index application to map and monitor irrigated lands. Remote Sens. 2017, 9, 1256. [Google Scholar] [CrossRef] [Green Version]
  28. Kaur, S.; Bansal, R.K.; Mittal, M.; Goyal, L.M.; Kaur, I.; Verma, A.; Son, L.H. Mixed pixel decomposition based on extended fuzzy clustering for single spectral value remote sensing images. J. Indian Soc. Remote Sens. 2019, 47, 427–437. [Google Scholar] [CrossRef]
  29. Brocca, L.; Tarpanelli, A.; Filippucci, P.; Dorigo, W.; Zaussinger, F.; Gruber, A.; Fernández-Prieto, D. How much water is used for irrigation? A new approach exploiting coarse resolution satellite soil moisture products. Int. J. Appl. Earth Obs. Geoinf. 2018, 73, 752–766. [Google Scholar] [CrossRef]
  30. Zaussinger, F.; Dorigo, W.; Gruber, A.; Tarpanelli, A.; Filippucci, P.; Brocca, L. Estimating irrigation water use over the contiguous united states by combining satellite and reanalysis soil moisture data. Hydrol. Earth Syst. Sci. 2019, 23, 897–923. [Google Scholar] [CrossRef] [Green Version]
  31. Zhu, L.; Zhu, A.X. Extraction of irrigation signals by using smap soil moisture data. Remote Sens. 2021, 13, 2142. [Google Scholar] [CrossRef]
  32. Singh, R.P.; Dubey, A.K.; Pradhan, R.; Gupta, P.K.; Singh, D. Discerning shifting irrigation practices from passive microwave radiometry over punjab and haryana. J. Water Clim. Chang. 2017, 8, 303–319. [Google Scholar] [CrossRef] [Green Version]
  33. Lawston, P.M.; Santanello, J.A.; Kumar, S.V. Irrigation signals detected from smap soil moisture retrievals. Geophys. Res. Lett. 2017, 44, 11860–11867. [Google Scholar] [CrossRef] [Green Version]
  34. Zohaib, M.; Choi, M. Satellite-based global-scale irrigation water use and its contemporary trends. Sci. Total Environ. 2020, 714, 136719. [Google Scholar] [CrossRef] [PubMed]
  35. Zohaib, M.; Kim, H.; Choi, M. Detecting global irrigated areas by using satellite and reanalysis products. Sci. Total Environ. 2019, 677, 679–691. [Google Scholar] [CrossRef] [PubMed]
  36. Zhang, X.H.; Qiu, J.X.; Leng, G.Y.; Yang, Y.M.; Gao, Q.Z.; Fan, Y.; Luo, J.S. The potential utility of satellite soil moisture retrievals for detecting irrigation patterns in china. Water 2018, 10, 1505. [Google Scholar] [CrossRef] [Green Version]
  37. Zhang, H.; Wang, X.; You, M.; Liu, C. Water-yield relations and water-use efficiency of winter wheat in the north china plain. Irrig. Sci. 1999, 19, 37–45. [Google Scholar] [CrossRef]
  38. Xu, H.; Zhang, X.H.; Ye, Z.; Jiang, L.; Qiu, X.L.; Tian, Y.C.; Zhu, Y.; Cao, W.X. Machine learning approaches can reduce environmental data requirements for regional yield potential simulation. Eur. J. Agron. 2021, 129, 126335. [Google Scholar] [CrossRef]
  39. Siebert, S.; Henrich, V.; Frenken, K.; Burke, J. Update of the Digital Global Map of Irrigation Areas to Version 5; Institute of Crop Science and Resource Conservation, Rheinische Friedrich-Wilhelms-Universität Bonn: Bonn, Germany, 2013. [Google Scholar]
  40. Wagner, W.; Lemoine, G.; Rott, H. A method for estimating soil moisture from ers scatterometer and soil data. Remote Sens. Environ. 1999, 70, 191–207. [Google Scholar] [CrossRef]
  41. Liu, Y.Y.; Parinussa, R.M.; Dorigo, W.A.; De Jeu, R.A.M.; Wagner, W.; van Dijk, A.I.J.M.; McCabe, M.F.; Evans, J.P. Developing an improved soil moisture dataset by blending passive and active microwave satellite-based retrievals. Hydrol. Earth Syst. Sci. 2011, 15, 425–436. [Google Scholar] [CrossRef] [Green Version]
  42. Liu, Y.Y.; Dorigo, W.A.; Parinussa, R.M.; de Jeu, R.A.M.; Wagner, W.; McCabe, M.F.; Evans, J.P.; van Dijk, A.I.J.M. Trend-preserving blending of passive and active microwave soil moisture retrievals. Remote Sens. Environ. 2012, 123, 280–297. [Google Scholar] [CrossRef]
  43. Pervez, M.S.; Brown, J.F. Mapping irrigated lands at 250-m scale by merging modis data and national agricultural statistics. Remote Sens. 2010, 2, 2388–2412. [Google Scholar] [CrossRef] [Green Version]
  44. Herbert, C.; Pablos, M.; Vall-llossera, M.; Camps, A.; Martínez-Fernández, J. Analyzing spatio-temporal factors to estimate the response time between smos and in-situ soil moisture at different depths. Remote Sens. 2020, 12, 2614. [Google Scholar] [CrossRef]
  45. Ozdogan, M.; Yang, Y.; Allez, G.; Cervantes, C. Remote sensing of irrigated agriculture: Opportunities and challenges. Remote Sens. 2010, 2, 2274–2304. [Google Scholar] [CrossRef] [Green Version]
  46. Chen, J.; Jönsson, P.; Tamura, M.; Gu, Z.; Matsushita, B.; Eklundh, L. A simple method for reconstructing a high-quality ndvi time-series data set based on the savitzky–golay filter. Remote Sens. Environ. 2004, 91, 332–344. [Google Scholar] [CrossRef]
  47. Jönsson, P.; Eklundh, L. Timesat—A program for analyzing time-series of satellite sensor data. Comput. Geosci. 2004, 30, 833–845. [Google Scholar] [CrossRef] [Green Version]
  48. Eklundha, L.; Jönssonb, P. TIMESAT 3.3 Software Manual; Lund University: Lund, Sweden, 2016. [Google Scholar]
  49. Reed, B.C.; Brown, J.F.; VanderZee, D.; Loveland, T.R.; Merchant, J.W.; Ohlen, D.O. Measuring phenological variability from satellite imagery. J. Veg. Sci. 1994, 5, 703–714. [Google Scholar] [CrossRef]
  50. Biggs, T.W.; Thenkabail, P.S.; Gumma, M.K.; Scott, C.A.; Parthasaradhi, G.R.; Turral, H.N. Irrigated area mapping in heterogeneous landscapes with modis time series, ground truth and census data, krishna basin, India. Int. J. Remote Sens. 2006, 27, 4245–4266. [Google Scholar] [CrossRef]
  51. Abou El-Magd, I.; Tanton, T.W. Improvements in land use mapping for irrigated agriculture from satellite sensor data using a multi-stage maximum likelihood classification. Int. J. Remote Sens. 2003, 24, 4197–4206. [Google Scholar] [CrossRef]
  52. Otukei, J.R.; Blaschke, T. Land cover change assessment using decision trees, support vector machines and maximum likelihood classification algorithms. Int. J. Appl. Earth Obs. Geoinf. 2010, 12, S27–S31. [Google Scholar] [CrossRef]
  53. Shen, J.G.; Zhang, C.; Zheng, Y.; Wang, R.X. Decision-level fusion with a pluginable importance factor generator for remote sensing image scene classification. Remote Sens. 2021, 13, 3579. [Google Scholar]
  54. Zhang, D.; Li, R.; Batchelor, W.D.; Ju, H.; Li, Y. Evaluation of limited irrigation strategies to improve water use efficiency and wheat yield in the north china plain. PLoS ONE 2018, 13, e0189989. [Google Scholar] [CrossRef] [Green Version]
  55. Guo, D.; Olesen, J.E.; Manevski, K.; Ma, X. Optimizing irrigation schedule in a large agricultural region under different hydrologic scenarios. Agric. Water Manag. 2021, 245, 106575. [Google Scholar] [CrossRef]
  56. Tuinenburg, O.A.; de Vries, J.P.R. Irrigation patterns resemble era-interim reanalysis soil moisture additions. Geophys. Res. Lett. 2017, 44, 10341–10348. [Google Scholar] [CrossRef]
  57. Rötzer, K.; Montzka, C.; Vereecken, H. Spatio-temporal variability of global soil moisture products. J. Hydrol. 2015, 522, 187–202. [Google Scholar] [CrossRef]
  58. Luo, M.; Meng, F.; Sa, C.; Duan, Y.; Bao, Y.; Liu, T.; De Maeyer, P. Response of vegetation phenology to soil moisture dynamics in the mongolian plateau. Catena 2021, 206, 105505. [Google Scholar] [CrossRef]
  59. Zhang, T.T.; Qi, J.G.; Gao, Y.; Ouyang, Z.T.; Zeng, S.L.; Zhao, B. Detecting soil salinity with modis time series vi data. Ecol. Indic. 2015, 52, 480–489. [Google Scholar] [CrossRef]
  60. Srivastava, S.K.; Jayaraman, V.; Nageswara Rao, P.P.; Manikiam, B.; Chandrasekhar, M.G. Interlinkages of noaa/avhrr derived integrated ndvi to seasonal precipitation and transpiration in dryland tropics. Int. J. Remote Sens. 1997, 18, 2931–2952. [Google Scholar] [CrossRef]
  61. Carlson, T.N.; Ripley, D.A. On the relation between ndvi, fractional vegetation cover, and leaf area index. Remote Sens. Environ. 1997, 62, 241–252. [Google Scholar] [CrossRef]
  62. Ragettli, S.; Herberz, T.; Siegfried, T. An unsupervised classification algorithm for multi-temporal irrigated area mapping in central asia. Remote Sens. 2018, 10, 1823. [Google Scholar] [CrossRef] [Green Version]
  63. Bartholomé, E.; Belward, A.S. Glc2000: A new approach to global land cover mapping from earth observation data. Int. J. Remote Sens. 2007, 26, 1959–1977. [Google Scholar] [CrossRef]
  64. Zurqani, H.A.; Allen, J.S.; Post, C.J.; Pellett, C.A.; Walker, T.C. Mapping and quantifying agricultural irrigation in heterogeneous landscapes using google earth engine. Remote Sens. Appl. Soc. Environ. 2021, 23, 100590. [Google Scholar] [CrossRef]
  65. Zheng, B.; Myint, S.W.; Thenkabail, P.S.; Aggarwal, R.M. A support vector machine to identify irrigated crop types using time-series landsat ndvi data. Int. J. Appl. Earth Obs. Geoinf. 2015, 34, 103–112. [Google Scholar] [CrossRef]
  66. Gumma, M.K.; Thenkabail, P.S.; Hideto, F.; Nelson, A.; Dheeravath, V.; Busia, D.; Rala, A. Mapping irrigated areas of ghana using fusion of 30 m and 250 m resolution remote-sensing data. Remote Sens. 2011, 3, 816–835. [Google Scholar] [CrossRef] [Green Version]
  67. Cai, H.; Wang, Y.; Lin, Y.; Li, S.; Wang, M.; Teng, F. Systematic comparison of objects classification methods based on als and optical remote sensing images in urban areas. Electronics 2022, 11, 3041. [Google Scholar] [CrossRef]
  68. Ferrant, S.; Selles, A.; Le Page, M.; Herrault, P.-A.; Pelletier, C.; Al-Bitar, A.; Mermoz, S.; Gascoin, S.; Bouvet, A.; Saqalli, M.; et al. Detection of irrigated crops from sentinel-1 and sentinel-2 data to estimate seasonal groundwater use in south india. Remote Sens. 2017, 9, 1119. [Google Scholar] [CrossRef] [Green Version]
  69. Pageot, Y.; Baup, F.; Inglada, J.; Baghdadi, N.; Demarez, V. Detection of irrigated and rainfed crops in temperate areas using sentinel-1 and sentinel-2 time series. Remote Sens. 2020, 12, 3044. [Google Scholar] [CrossRef]
  70. Bazzi, H.; Baghdadi, N.; Fayad, I.; Zribi, M.; Belhouchette, H.; Demarez, V. Near real-time irrigation detection at plot scale using sentinel-1 data. Remote Sens. 2020, 12, 1456. [Google Scholar] [CrossRef]
  71. Ding, J.F.; Liang, P.; Wu, P.; Zhu, M.; Li, C.Y.; Zhu, X.K.; Gao, D.R.; Chen, Y.L.; Guo, W.S. Effects of waterlogging on grain yield and associated traits of historic wheat cultivars in the middle and lower reaches of the yangtze river, china. Field Crops Res. 2020, 246, 107695. [Google Scholar] [CrossRef]
  72. Romaguera, M.; Hoekstra, A.Y.; Su, Z.; Krol, M.S.; Salama, M.S. Potential of using remote sensing techniques for global assessment of water footprint of crops. Remote Sens. 2010, 2, 1177–1196. [Google Scholar] [CrossRef] [Green Version]
  73. Hao, Z.; Zhao, H.L.; Zhang, C.; Wang, H.; Jiang, Y.Z. Detecting winter wheat irrigation signals using smap gridded soil moisture data. Remote Sens. 2019, 11, 2390. [Google Scholar] [CrossRef] [Green Version]
  74. Aboelsoud, H.M.; Habib, A.; Engel, B.; Hashem, A.A.; El-Hassan, W.A.; Govind, A.; Elnashar, A.; Eid, M.; Kheir, A.M.S. The combined impact of shallow groundwater and soil salinity on evapotranspiration using remote sensing in an agricultural alluvial setting. J. Hydrol. Reg. Stud. 2023, 47, 101372. [Google Scholar] [CrossRef]
  75. Pan, Y.; Zhang, C.; Gong, H.; Yeh, P.J.F.; Shen, Y.; Guo, Y.; Huang, Z.; Li, X. Detection of human-induced evapotranspiration using grace satellite observations in the haihe river basin of china. Geophys. Res. Lett. 2017, 44, 190–199. [Google Scholar] [CrossRef]
  76. van Eekelen, M.W.; Bastiaanssen, W.G.M.; Jarmain, C.; Jackson, B.; Ferreira, F.; van der Zaag, P.; Saraiva Okello, A.; Bosch, J.; Dye, P.; Bastidas-Obando, E.; et al. A novel approach to estimate direct and indirect water withdrawals from satellite measurements: A case study from the incomati basin. Agric. Ecosyst. Environ. 2015, 200, 126–142. [Google Scholar] [CrossRef] [Green Version]
  77. Attia, A.; Qureshi, A.S.; Kane, A.M.; Alikhanov, B.; Kheir, A.M.S.; Ullah, H.; Datta, A.; Samasse, K. Selection of potential sites for promoting small-scale irrigation across mali using remote sensing and gis. Sustainability 2022, 14, 12040. [Google Scholar] [CrossRef]
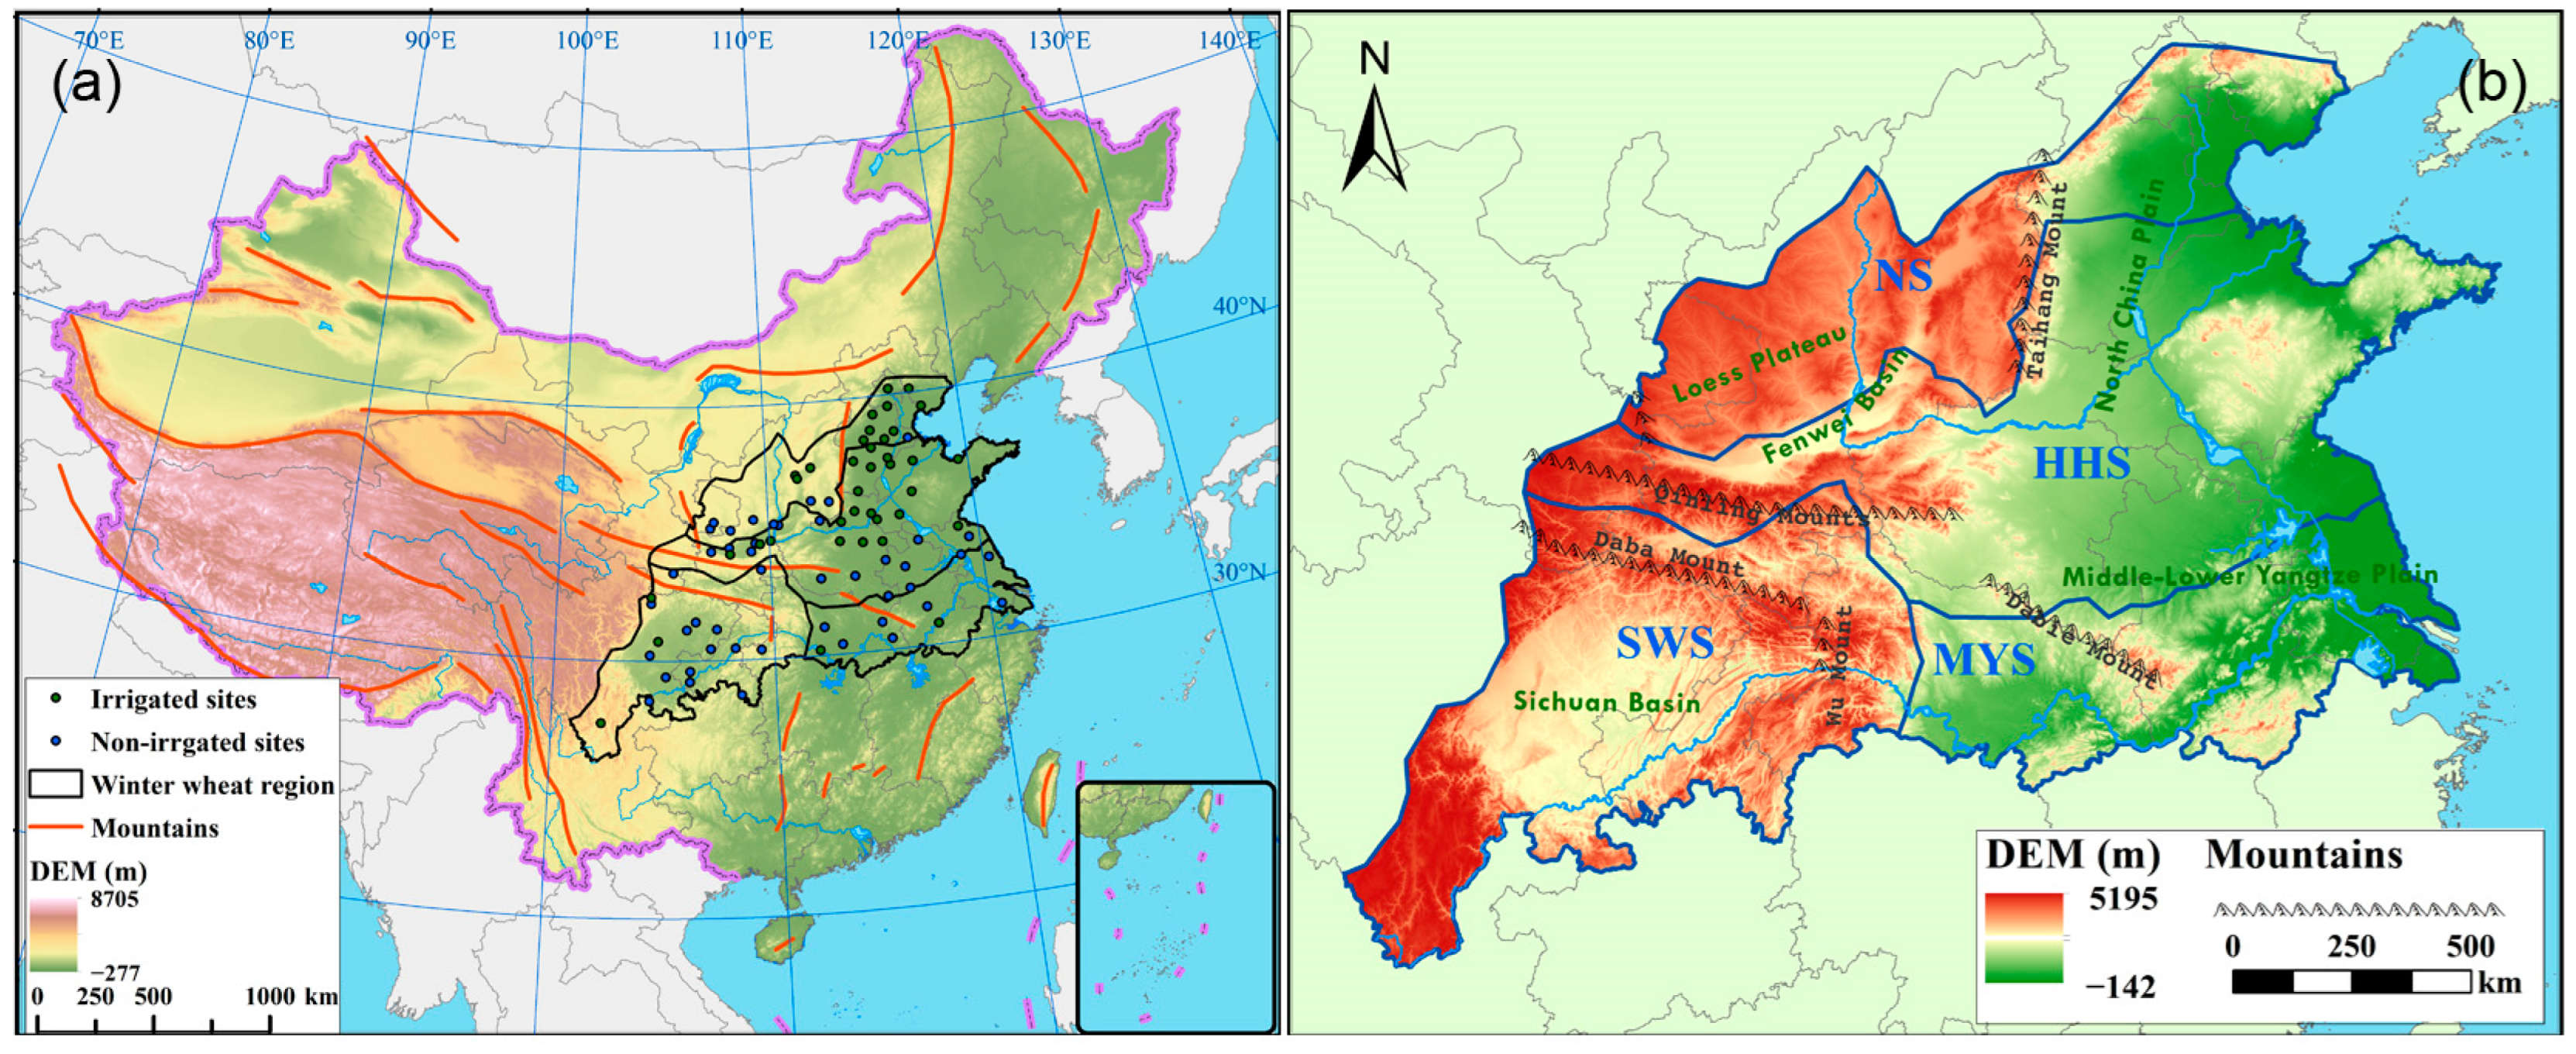
Figure 1. Location map of the winter wheat region in China: (a) China; (b) winter wheat region. SWS: southwest winter wheat sub-region; MYS: middle-lower Yangtze River winter wheat sub-region; HHS: Huanghuai winter wheat sub-region; NS: northern winter wheat sub-region.
Agronomy 13 01556 g001
Figure 2. Existing irrigated maps scoping winter wheat region in China. (a) GMIA 5.0. (b) GRIPC. (c) GIAM. (d) GFSAD. (e) Meier’s Map. (f) CIrrMap.
Agronomy 13 01556 g002
Figure 3. Technical path of this study.
Agronomy 13 01556 g003
Figure 4. Phenological parameters extraction from the NDVI time series [48].
Agronomy 13 01556 g004
Figure 5. The comparison of microwave soil moisture products with ERA-Interim. Jan.: January; Feb.: February; Mar.: March; Apr.: April; Jun.: June; Jul.: July; Aug.: August; Sept.: September; Oct.: October; Nov.: November; Dec.: December.
Agronomy 13 01556 g005
Figure 6. K-S values of microwave soil moisture products with ERA-Interim.
Agronomy 13 01556 g006
Figure 7. Phenological parameters extraction from NDVI. (a): Start of growing season; (b): End of growing season; (c): Length of growing season; (d): Base value; (e): Time of middle of season; (f): Maximum value of fitted; (g): Left derivative; (h): Right derivative; (i): Amplitude; (j): Large integral; (k): Small integral; (l): Start of season value; (m): End of season value.
Agronomy 13 01556 g007
Figure 8. Irrigation mapping products. (a) based on the K-S test and MRS. (b) based on phenology and ORS. (c) Decision-level fusion with ORS resolution. (d) Decision-level fusion with MRS resolution.
Agronomy 13 01556 g008
Figure 9. Inter-comparison of this study with existing maps in sub-regions. DL-fusion (ORS): decision-level fused map at ORS resolution. Fenhe District is in the northern winter wheat sub-region; Baojixia District is in the Huanghuai winter wheat sub-region; Dujiangyan District is in the southwest winter wheat sub-region; Pishihang District is in the middle–lower Yangtze River winter wheat sub-region.
Agronomy 13 01556 g009
Figure 10. The boxplot of irrigation accuracy in China’s winter wheat sub-regions.
Agronomy 13 01556 g010
Figure 11. The boxplot of phenological parameters, the start (a), end (b), and length (c) of the growing season. (d) Base value, (e) time of the middle of the growing season, (f) max value, (g) left derivative, (h) right derivative, (i) amplitude, (j) large integral, (k) small integral, (l) value at the start of the growing season, and (m) value at end of the growing season. BY: Banks of Yangtze River winter wheat sub-region (SWS and MYS); HHS: Huanghuai winter wheat sub-region; NS: northern winter wheat sub-region. The units used in the plots of the start (a), end (b), length (c), and middle (e) of the growing season are days.
Agronomy 13 01556 g011
Table 1. Research data sources and descriptions.
Research DataYearDescriptionResolutionResource
ASCAT [40,41], AMSR-E [41],
ESA CCI [42]
2000–20080–2.5 cm volume of water content0.25°ftp://hydro1.sci.gsfc.nasa.gov/data/s4pa/
accessed on 25 October 2021
ERA-Interim2000–20080–7 cm volume
water content
0.25°https://cds.climate.copernicus.eu/
accessed on 25 October 2021
MOD13A22007–201016d-NDVI1 kmGoogle Earth engine
GMIA 5.0 [39]2000–2008irrigation intensity5′FAOSTAT
accessed on 25 October 2021
GRIPC [19]2005irrigation intensity5′https://ftp-earth.bu.edu/public/friedl/GRIPCmap/
accessed on 30 October 2021
GIAM [18]2000irrigated area10 kmhttp://waterdata.iwmi.org
accessed on 7 November 2021
GFSAD [20]2007–2012irrigated area1 kmGoogle Earth engine
Meier’s Map [21]1999–2012irrigated area30′′https://doi.pangaea.de/10.1594/PANGAEA.884744
accessed on 20 May 2022
CIrrMap [17]2000irrigated area250 mhttps://doi.org/10.6084/m9.figshare.17056442.v2
accessed on 20 May 2022
Table 2. Statistics of irrigation intensity in GMIA.
NSHHSSWSMYS
Top Quartile4492447926303498
Min1573157215721573
Max6562710153245331
Mean3527351223782951
Median2017682102148
STD156218118031289
Table 3. The proportion of irrigated pixels within each sub-region. DL: decision-level.
ProductsNSHHSSWSMYS
This studyMRS-based map42.1%72.7%29.1%76.4%
ORS-based map31.8%74.0%28.2%78.8%
DL fused map at ORS resolution21.3%50.8%8.2%56.6%
DL fused map at MRS resolution 21.9%52.7%8.1%56.6%
GFSAD24.5%56.6%9.0%12.5%
Meier’s Map16.4%42.6%7.9%27.2%
Table 4. Ground point validation with overall accuracy (OA), producer’s accuracy (PA), and user’s accuracy (UA). DL: decision-level. GFSAD: Global Food Security Support Analysis Data project. DL-fusion (ORS): decision-level fused map at ORS resolution.
.Meier’s MapGFSADDL-Fusion (ORS)DL-Fusion (MRS)
OA69.51%68.67%73.49%67.07%
PA (irrigation)56.76%57.89%71.05%68.42%
PA (non-irrigation)80%77.78%75.56%65.91%
UA (irrigation)70%68.75%71.05%63.41%
UA (non-irrigation)69.23%68.63%75.56%70.73%
Disclaimer/Publisher’s Note: The statements, opinions and data contained in all publications are solely those of the individual author(s) and contributor(s) and not of MDPI and/or the editor(s). MDPI and/or the editor(s) disclaim responsibility for any injury to people or property resulting from any ideas, methods, instructions or products referred to in the content.