Article

Optimization of Winter Irrigation under Freeze–Thaw Conditions: A Case Study of the Yellow River Delta, China

1
State Key Laboratory of Eco-Hydraulics in Northwest Arid Region of China, Xi’an University of Technology, Xi’an 710048, China
2
Xinjiang Institute of Water Resources and Hydropower Research, Urumqi 830049, China
3
College of Hydraulic and Civil Engineering, Xinjiang Agricultural University, Urumqi 830052, China
4
Xinjiang Key Laboratory of Hydraulic Engineering Security and Water Disasters Prevention, Urumqi 830052, China
*
Authors to whom correspondence should be addressed.
Agronomy 2023, 13(7), 1743; https://doi.org/10.3390/agronomy13071743
Submission received: 31 May 2023 / Revised: 22 June 2023 / Accepted: 26 June 2023 / Published: 28 June 2023

Abstract

:
Optimal winter irrigation may be an alternative method for controlling soil salinization under seasonal freezing and thawing conditions in the Yellow River Delta. However, few studies have focused on optimal winter irrigation based on the dynamics of soil water, heat, and salt during the freezing–thawing period in this region. Taking the seedling stage of winter wheat in the Yellow River Delta as the research object and using observation data of hydrothermal salt from the Shandong agricultural high-tech demonstration base from 17 October 2019 to 15 June 2021, a numerical simulation of the hydrothermal coupling process of freeze–thaw soil in the experimental area was carried out through the Simultaneous Heat and Water Model (SHAW). The simulation results of the model were evaluated according to the mean error (ME), root mean square error (RMSE), and Nash efficiency coefficient (NSE). The results showed that the SHAW can well simulate the soil moisture (SM), soil temperature, and soil salt during the growth of winter wheat in this region: the SM at the depth of 0–80 cm with an ME < 0.038 cm3 cm−3, RMSE < 0.064 cm3 cm−3, and NSE > 0.669; the soil temperature with an ME < 1.311 °C, RMSE < 1.493 °C, and NSE > 0.738; and the soil salinity with an ME < 0.005 g kg−1, RMSE < 0.014 g kg−1, and NSE > 0.607. Moreover, the model was used to simulate the distribution of soil water and salt in the winter wheat seedling stage under different winter irrigation methods during wet, normal, and dry years. It was suggested that the appropriate winter irrigation amount was 80 mm in wet years and normal years and 100 mm in dry years, which could be beneficial to winter wheat growth during the seedling stage. These results provide a reference for irrigation optimization in the Yellow River Delta and other similar areas.

1. Introduction

Winter irrigation is widely used in agriculture [1,2,3,4]. For saline-alkali areas, in addition to the role of SM, it has the more important role of leaching salinity [5,6]. However, with the increasing shortage of water resources, it is important to develop a reasonable winter irrigation approach with consideration of many factors, such as soil type, soil initial water content, soil salinity content, groundwater level, etc. In addition to the above factors, the phenomenon of soil freezing and thawing must also be taken into account. Freeze–thawing is an important factor in soil salt accumulation. As the president of the International Permafrost Association has pointed out, understanding the laws of water and salt movement in the process of freezing and thawing may represent a new approach to prevent and control soil salinization.
Soil freezing and thawing is a very complex process which is accompanied by physical, chemical, and mechanical phenomena and has an effect on water and heat convection, water phase change, and salt accumulation. In order to better understand the various migration laws of water-heat-solute in freeze–thaw soil, models have been developed, including the Harlan model [7], CoupModel [8], and SHAW model [9], among others. Currently, compared with the Harlan model and CoupModel, the SHAW model is not only more flexible and applicable but also has a wider range of applications. It performs well in quantitatively simulating water and salt transport during soil freezing and thawing periods, making it an ideal model. He et al. (2021) combined the FSTC algorithms in the SHAW model into a numerical simulation model [10]. Li et al. (2012, 2013) employed the SHAW model to simulate the process of soil freezing–thawing and evaluate the effect of antecedent soil water storage on the dynamic variation in moisture-heat transfer in the seasonal freezing–thawing period in the Inner Mongolia Hetao irrigation district of China [11,12]. Lu et al. (2019) simulated the process of a year-round soil moisture-salt transport under different mulching treatments by using the SHAW model [13]. Liu et al. (2022) employed the SHAW model to simulate the SM dynamics in the Loess Plateau of China over a 30-year period. The study also assessed the process of SM restoration in this region [14]. Lin et al. (2023) employed the SHAW model to explore the mechanism of SM and heat and salt migration and explore the optimal strategy of combined winter and spring irrigations in the cotton fields of Southern Xinjiang during the fallow season [15]. Lin et al. (2023) obtained appropriate spatial distribution characteristics of the salt leaching quota under different irrigation modes by establishing the irrigation district-scale distribution model based on the SHAW model [16]. These results proved that the model can simulate the water-heat-solute transport in freezing–thawing conditions and can be used as a valid tool to provide a valuable reference for agricultural production. However, the model has had limited applications in coastal regions.
The Yellow River Delta is not only the main production base of winter wheat in China but is also a typical coastal saline-alkali area in China [17,18,19]. In addition, the soil in the region experiences a freeze–thaw process every year, and the soil salt increases after this process. In order to ensure the normal growth of winter wheat during the winter period, winter irrigation is common in the local area. However, because the winter irrigation volume is determined empirically, it often leads to waste of water resources, groundwater rise, salt accumulation, and winter wheat loss. Therefore, it is necessary to address the above problems. The purpose of this study was (1) to test the ability of the SHAW model to simulate water-salinity-heat transfer; (2) to evaluate the impacts of differing irrigation volumes on water and salinity transfer in different hydrological years; and (3) to provide a suitable winter irrigation recommendation in the research area.

2. Materials and Methods

2.1. Description of the Study Area and Plots

The study area was situated in the Yellow River Delta, located in the northern part of Shandong Province. Specifically, it was positioned between the high-tech demonstration base at coordinates (37°21′ N, 118°57′ E) in the agricultural high-tech zone of Guangrao County, Dongying City (Figure 1). The region has a monsoon climate characterized by distinct wet and dry seasons. The annual sunshine hours in this area amount to 2234.0 h, with an annual precipitation of 587.4 mm. Rainfall is primarily concentrated between June and September each year. Over the years, the average temperature in the study area has been recorded as 12.3 °C. Guangrao County, where the study area was located, has an average altitude of less than 10 m. The annual average frost-free period spans approximately 198 days, giving a relatively long growing season. Additionally, the groundwater depth in the area is approximately 1 m. Due to its low altitude and coastal influences, the soil in the study area initially exhibited a salt content of 4.236 g kg−1. This salinity level may impact agricultural practices and crop growth in the region.

2.2. Data Measurement and Collection

The field experiment was carried out from October 2019 to June 2021. The test cycle was 240 d, and the tested crop was winter wheat (Triticum aestivum L.), which was sown on 11 October 2019 and 13 October 2020, at a seeding density of 4.56 × 10⁶ plants/hm2. A single-factor completely randomized experiment was used for the design. The area of the experimental plot was approximately 2.5 m × 4 m, and the winter wheat variety tested was “Jinan 17”. Winter wheat was planted in wide and narrow rows, with a wide row spacing of 70 cm and a narrow row spacing of 50 cm. The irrigation method was flood irrigation. The field management mode was consistent with local farmland management, including the use of fertilization, pesticides, etc. The amount of irrigation and fertilization followed local standards, with 210 mm irrigation for the entire growth period of winter wheat in wet years, 300 mm irrigation for the entire growth period in normal years, and 420 mm irrigation for the entire growth period in dry years. An observation well was drilled 52.5 m away from the north and 19.5 m away from the west to observe the groundwater level. There was 1 meter reserved between the left and right (east–west direction), and 0.5 m was reserved up and down (north–south direction) for walking, etc.

2.2.1. Determination of SM and Soil Salt Content

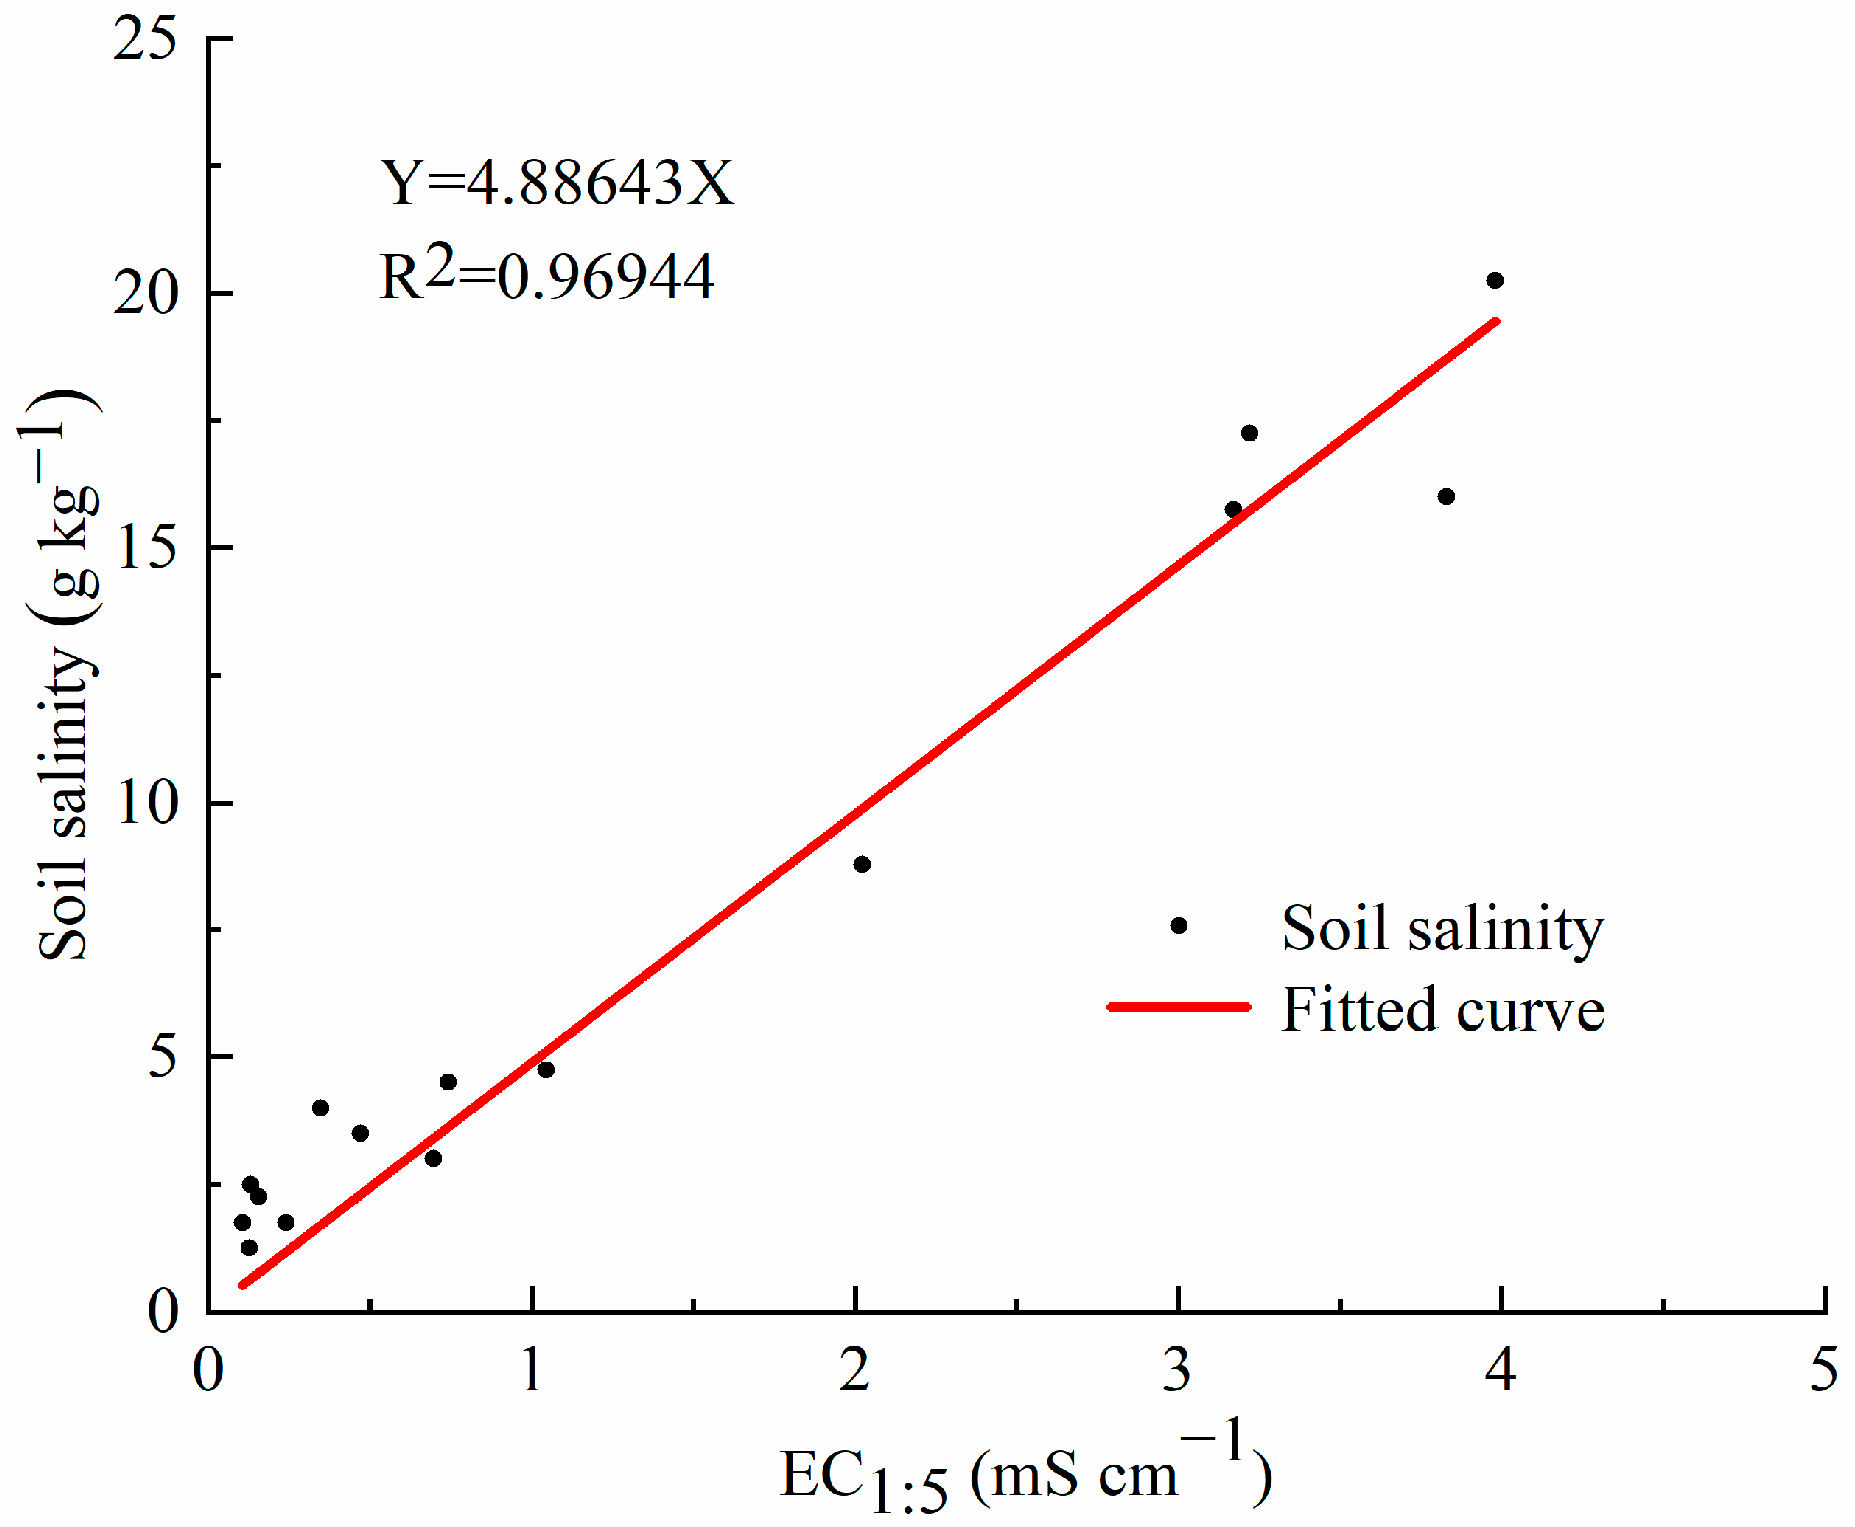
Soil samples were taken at the seedling stage, overwintering stage, and rejuvenation stage of winter wheat, at soil depths of 5, 10, 15, 20, 30, 40, 50, 60, and 80 cm. The drying method (105 ± 2 °C for 24 h) was used to determine SM. According to the measured electrical conductivity of the 1:5 soil–water extraction solution, the soil salt content was converted from a calibration curve (Figure 2).

2.2.2. Observation of Meteorological Data

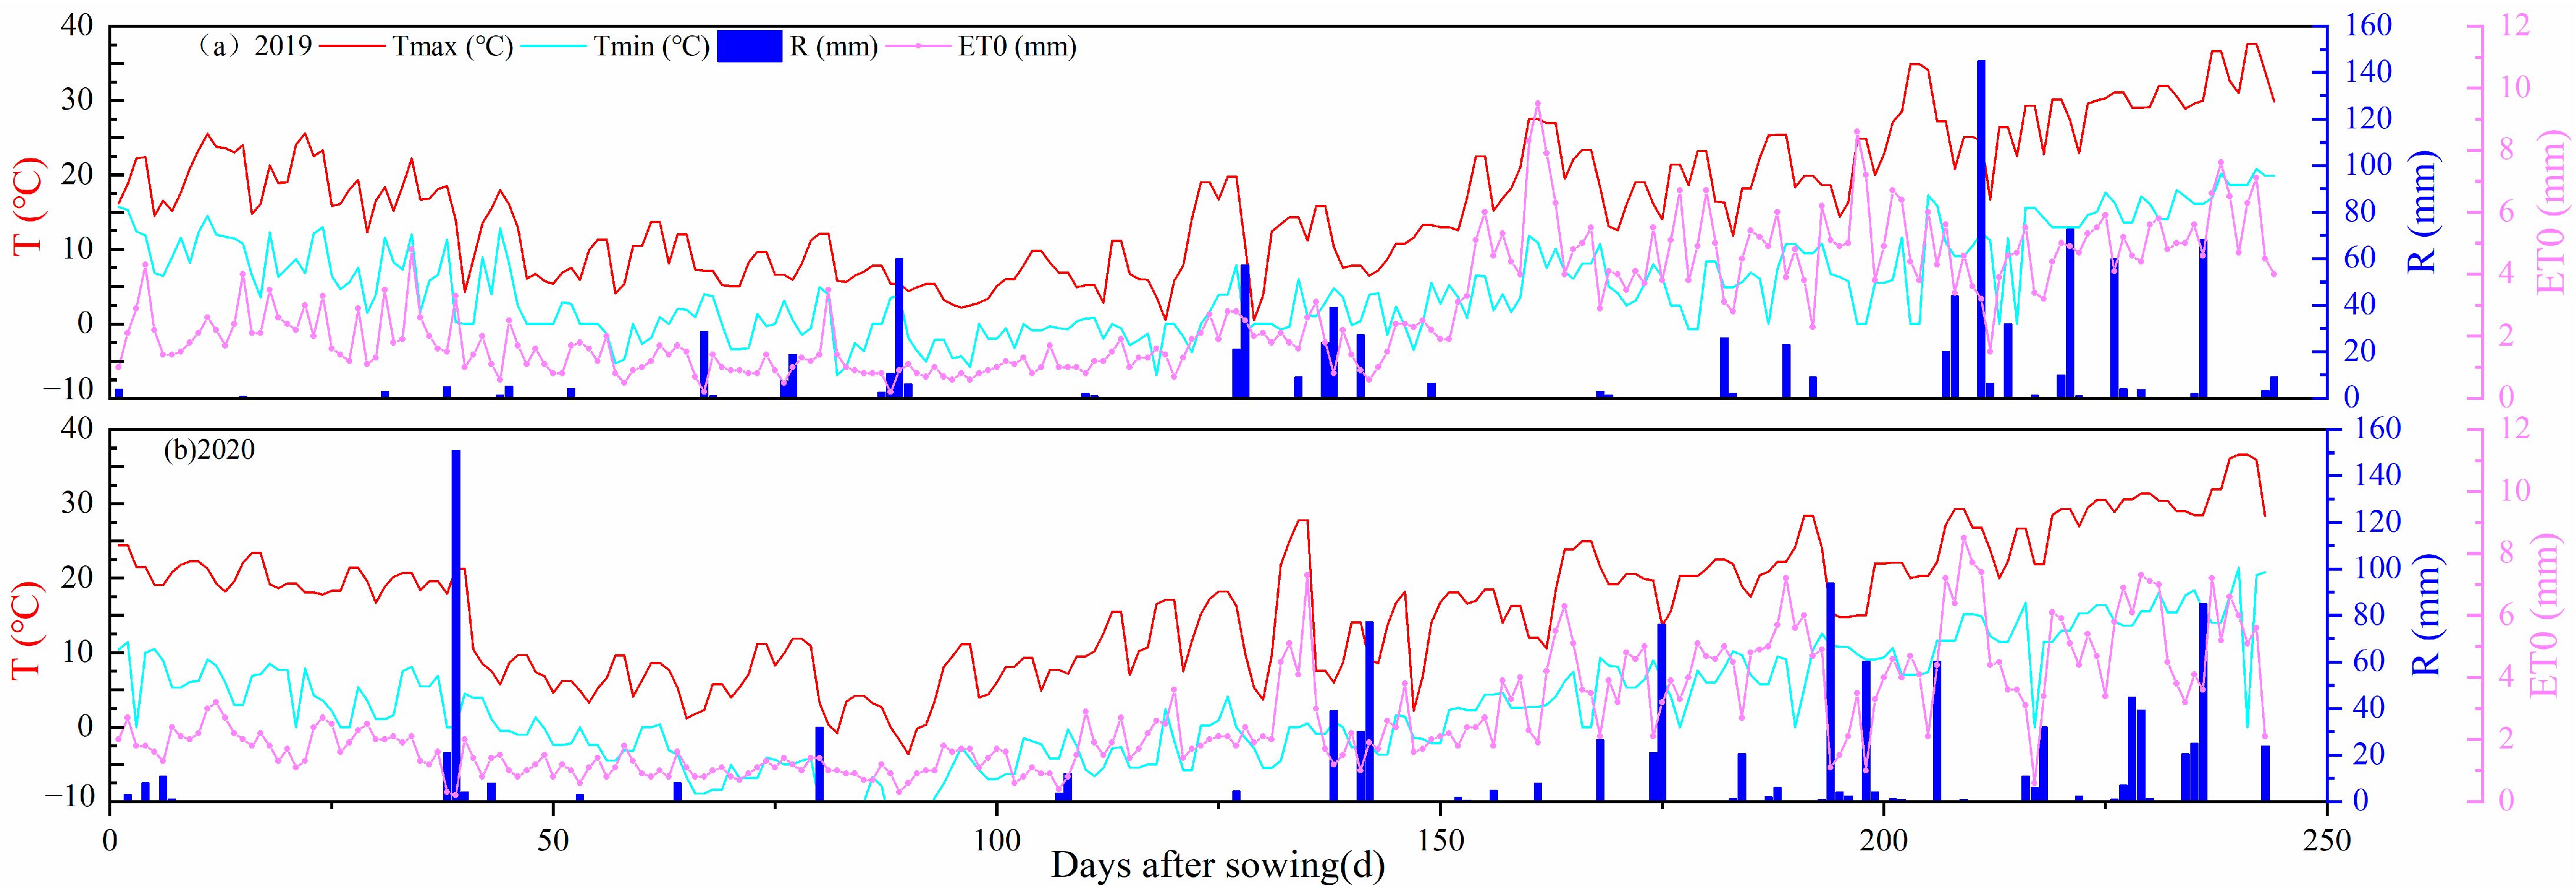
A small meteorological station (Weather Hawk 500, Campbell Scientific, Logan, UT, USA) was installed at a height of 2 m above the soil of the field, and the solar radiation intensity, maximum air temperature, minimum air temperature, relative air humidity, wind speed, and rainfall were observed every 30 min. The daily ET0 during the winter wheat growth period was calculated by using an ET0 calculator (Penmen–Monteith formula), as recommended by FAO. The daily rainfall and ET0 during the growth period of winter wheat from 2019 to 2021 are shown in Figure 3.

2.3. Simulation Method

2.3.1. SHAW Model Description

The SHAW model is a one-dimensional multi-layer hydrothermal coupling model, which is a three-dimensional finite difference model to simulate various coupling processes and characteristics (Figure 4). The heat and water fluxes of the soil–plant–atmosphere continuum (SPAC) (longwave radiation exchange, absorbed solar radiation, and turbulent transfer of steam and heat) are determined by the weather conditions at the upper boundary and the soil conditions at the lower boundary [9]. At present, it is widely used to simulate the numerical model of heat and salt transport in frozen soil. In addition, the model has also been proved to accurately simulate the depth of frozen soil, the impact of water and solutes on frozen soil, water storage, and the irrigation schedule.
The theoretical core of the model is based on the energy balance on the surface boundary, and its core calculation equation is
R n + H + L v E + G = 0
where Rn is the full wave net radiation (W m−2); H is the sensible heat flux (W m−2); Lv is the latent heat of evaporation (J kg−1); G is the soil or surface heat flux (W m−2); and E is the total evaporation of soil surface and crop canopy (kg m−2 s−1).
The energy flux control equation is based on the energy balance of each node under the condition of soil freezing and thawing:
α z ( k s T z ) ρ l c l ( q l T ) z + S = C s T t ρ i L f · Q i t + L v ( q v z + q v t )
where ks is the thermal conductivity of the soil (W m−1 K−1); ρl is the bulk density of water (g cm−3); ρi is the bulk density of ice (g cm−3); θi is the ice volume content of the soil (m3 m−3); cl is the specific heat capacity of liquid water (4200 J kg−1 k−1); ql is the flux of liquid water (kg m−2 s−1); Cs is the volume heat capacity of the soil (W m−1 K−1); Lf is the latent heat of melting (3350 kJ kg−1); qv is the flux of gaseous water (kg m−2 s−1); ρv is the density of water vapor in the soil void (g cm−3); z is the depth of soil layer (m); T is the soil temperature (°C); and t is the time.
The soil water flux equation considering soil freezing and thawing is
θ l t + ρ i ρ l θ i t = z [ K ( φ z + 1 ) ] + 1 ρ l q v z + U
where K is unsaturated hydraulic conductivity (m s−1); ψ is the soil matrix potential (m); and U is the source term of water flux (m3 m−3 s−1).
The assumed relationship of the soil water distribution characteristic equation is [20,21]
φ = φ e ( θ l θ s ) b
where φe is the air entry potential (m), b is the pore size distribution parameter, and θs is the saturated water content (m3 m−3).
Unsaturated hydraulic conductivity (K) is calculated as follows:
K = K s ( θ l θ s ) 2 b + 3
where Ks is the saturated hydraulic conductivity (m h−1).
In the expression of plant biophysical characteristics, the stomatal resistance (rs) is expressed by the empirical equation proposed by Campcell (1985) [22]:
r s = r s o [ 1 + ( φ l φ c ) n ]
where rso is the stomatal resistance (m s−1) without water stress; φc is the critical leaf water potential (m); φl is the leaf water potential; and n is the empirical coefficient.

2.3.2. Main Parameters of the SHAW Model

Location information: The location of the study area was between 37°21′ N and 118°57′ E, and the slope and aspect were zero.
Plant biophysical characteristic parameters: The recommended parameters of the SHAW model and the corresponding parameters of winter wheat were used as the initial values (Table 1).

2.3.3. Data Processing and Acquisition of the Model

The model is driven by daily meteorological data, including maximum and minimum air temperature, solar radiation, wind speed, dew point temperature, and precipitation. The daily meteorological conditions were set as the upper boundary meteorological conditions of the model. According to soil texture, soil bulk density, saturated water content, and saturated hydraulic conductivity, the soil profile was divided into 10 layers: 0–5, 5–10, 10–15, 15–20, 20–30, 30–40, 40–50, 50–60, 60–70, and 70–80 cm, respectively. Plant growth data included the plant height, leaf area index, aboveground biomass, and effective root depth.

2.3.4. SHAW Model Optimization and Evaluation

The soil parameters were estimated according to the soil texture of the SHAW model user interface, and then optimized using the field test data from 2019 to 2021 (Table 2). The statistical analysis evaluated the simulation performance of the SHAW model, and the Nash–Sutcliffe efficiency coefficient (NSE), mean error (ME), and root mean square error (RMSE) were used to evaluate the model performance.
N S E = 1 i = 1 N ( O i P i ) 2 i = 1 N ( O i O ¯ ) 2
M E = 1 N i = 1 N ( P i O i )
R M S E = 1 N i = 1 N ( O i P i ) 2
where Oi is the observed value, Pi is the simulated value, and N is the total number of observations.

2.4. Scenario Simulation

The SHAW model was used to simulate the distribution of soil water and salt during the growth period of winter wheat under different amounts of irrigation. The simulated irrigation method was flood irrigation, and the SM and salt leaching effect were used as evaluation indicators.
(1)
Irrigation was initiated on November 15.
(2)
A total of 8 irrigation quotas were set, i.e., 0 mm, 20 mm, 40 mm, 60 mm, 80 mm, 100 mm, 120 mm, and 150 mm.
(3)
The meteorological data (the temperature, wind speed, and precipitation) of Dongying City, Shandong Province, from 1965 to 2015 were used as inputs in the model.
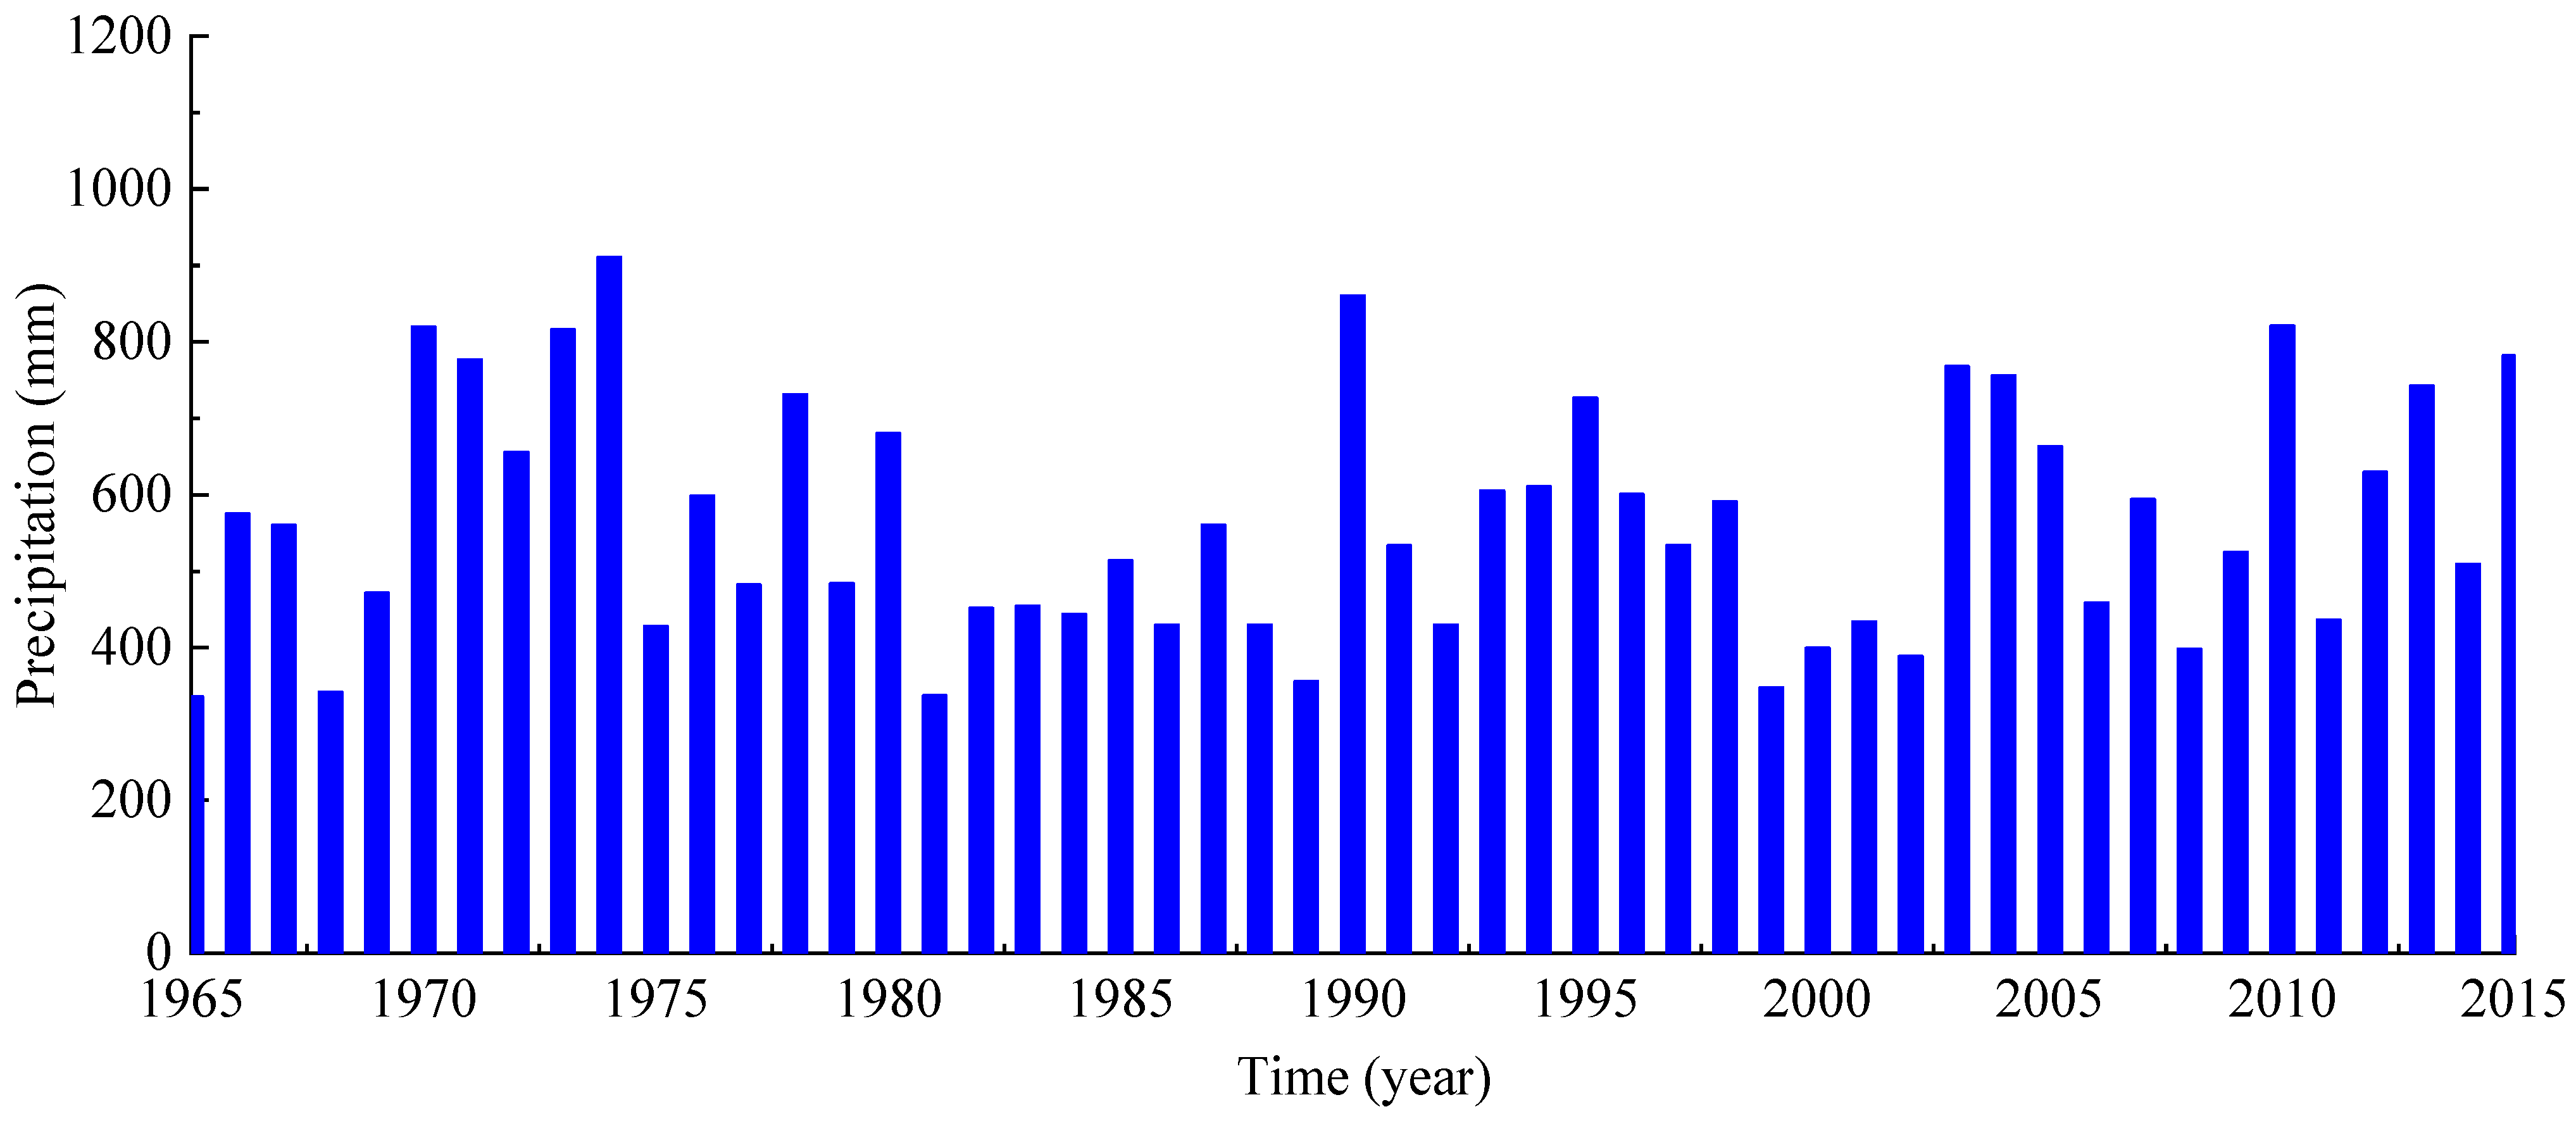
Based on the precipitation observation data of Dongying City, Shandong Province, China, from 1965 to 2015, the frequency of precipitation in the Yellow River Delta was analyzed by using the Pearson III curve (Figure 5). We found that the annual rainfall distribution law in this area conformed to the Pearson III frequency curve of Ex = 589.35, Cv = 0.29, Cs = 0.56. Thus, the precipitation distribution in this area could be obtained. The frequency of annual rainfall above 1154.6 mm was 1%, and the frequency of annual rainfall above 429.7 mm was 80%. The annual rainfall values with a corresponding frequency above 25%, 50%, and 75% were 726.8 mm, 560.7 mm, and 436.5 mm, respectively. The simulations under different irrigation volumes were conducted for three hydrological years (i.e., dry years, normal water years, and wet years).

3. Results

3.1. Calibration of SHAW Model

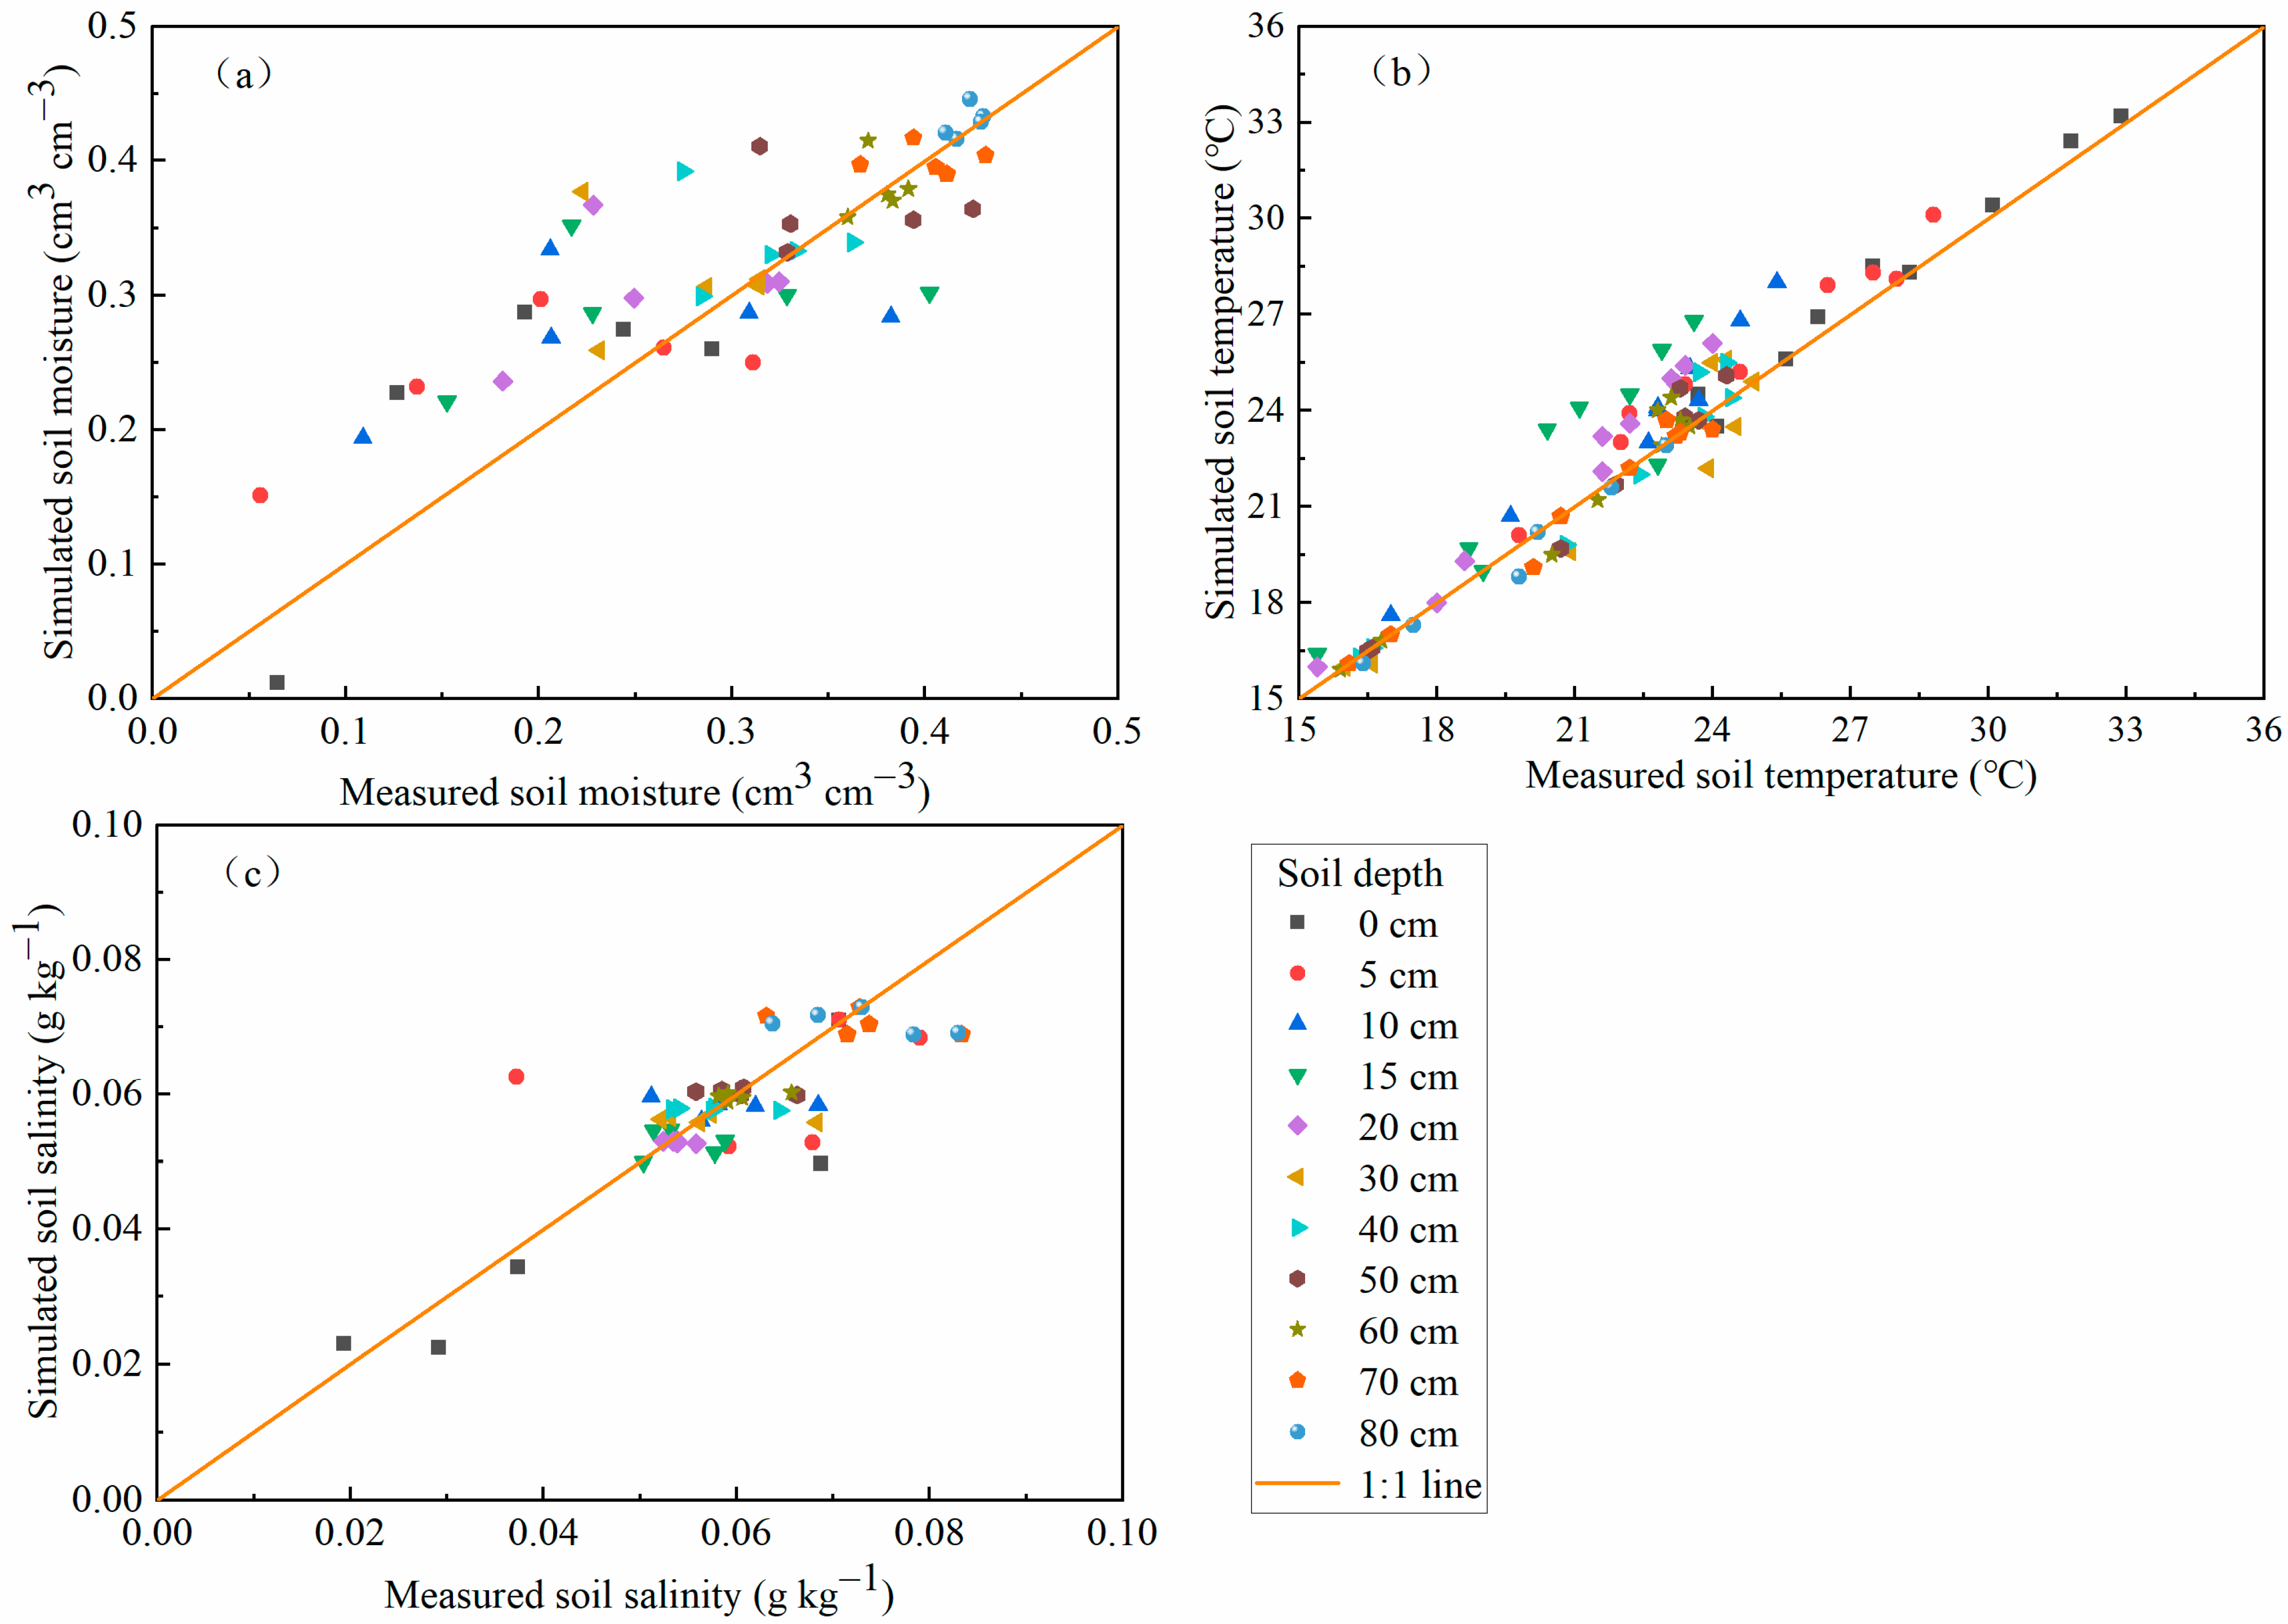
The SHAW model was calibrated with the data of the SM, soil temperature, and soil salinity in the 0.8 m soil layer from 2019 to 2020 and verified with data from 2020 to 2021. The SHAW model satisfactorily simulated the SM with an RMSE < 0.064 cm3 cm−3, ME < 0.038 cm3 cm−3, and NSE > 0.669. Additionally, the model was able to predict the soil temperature with an RMSE < 1.493 °C, ME < 1.311 °C, and NSE > 0.738. Similarly, the soil salt could be simulated with an RMSE < 0.014 g kg−1, ME < 0.005 g kg−1, and NSE > 0.607 (Table 3). The observation and simulation of the freeze–thaw period of winter wheat in the SHAW model from October 2020 to June 2021 are shown in Figure 6. Overall, the SHAW model was able to accurately simulate the dynamic changes in the water, salt, and heat in the 0.8 m soil profile for winter wheat from 2019 to 2020.

3.2. Validation of the SHAW Model

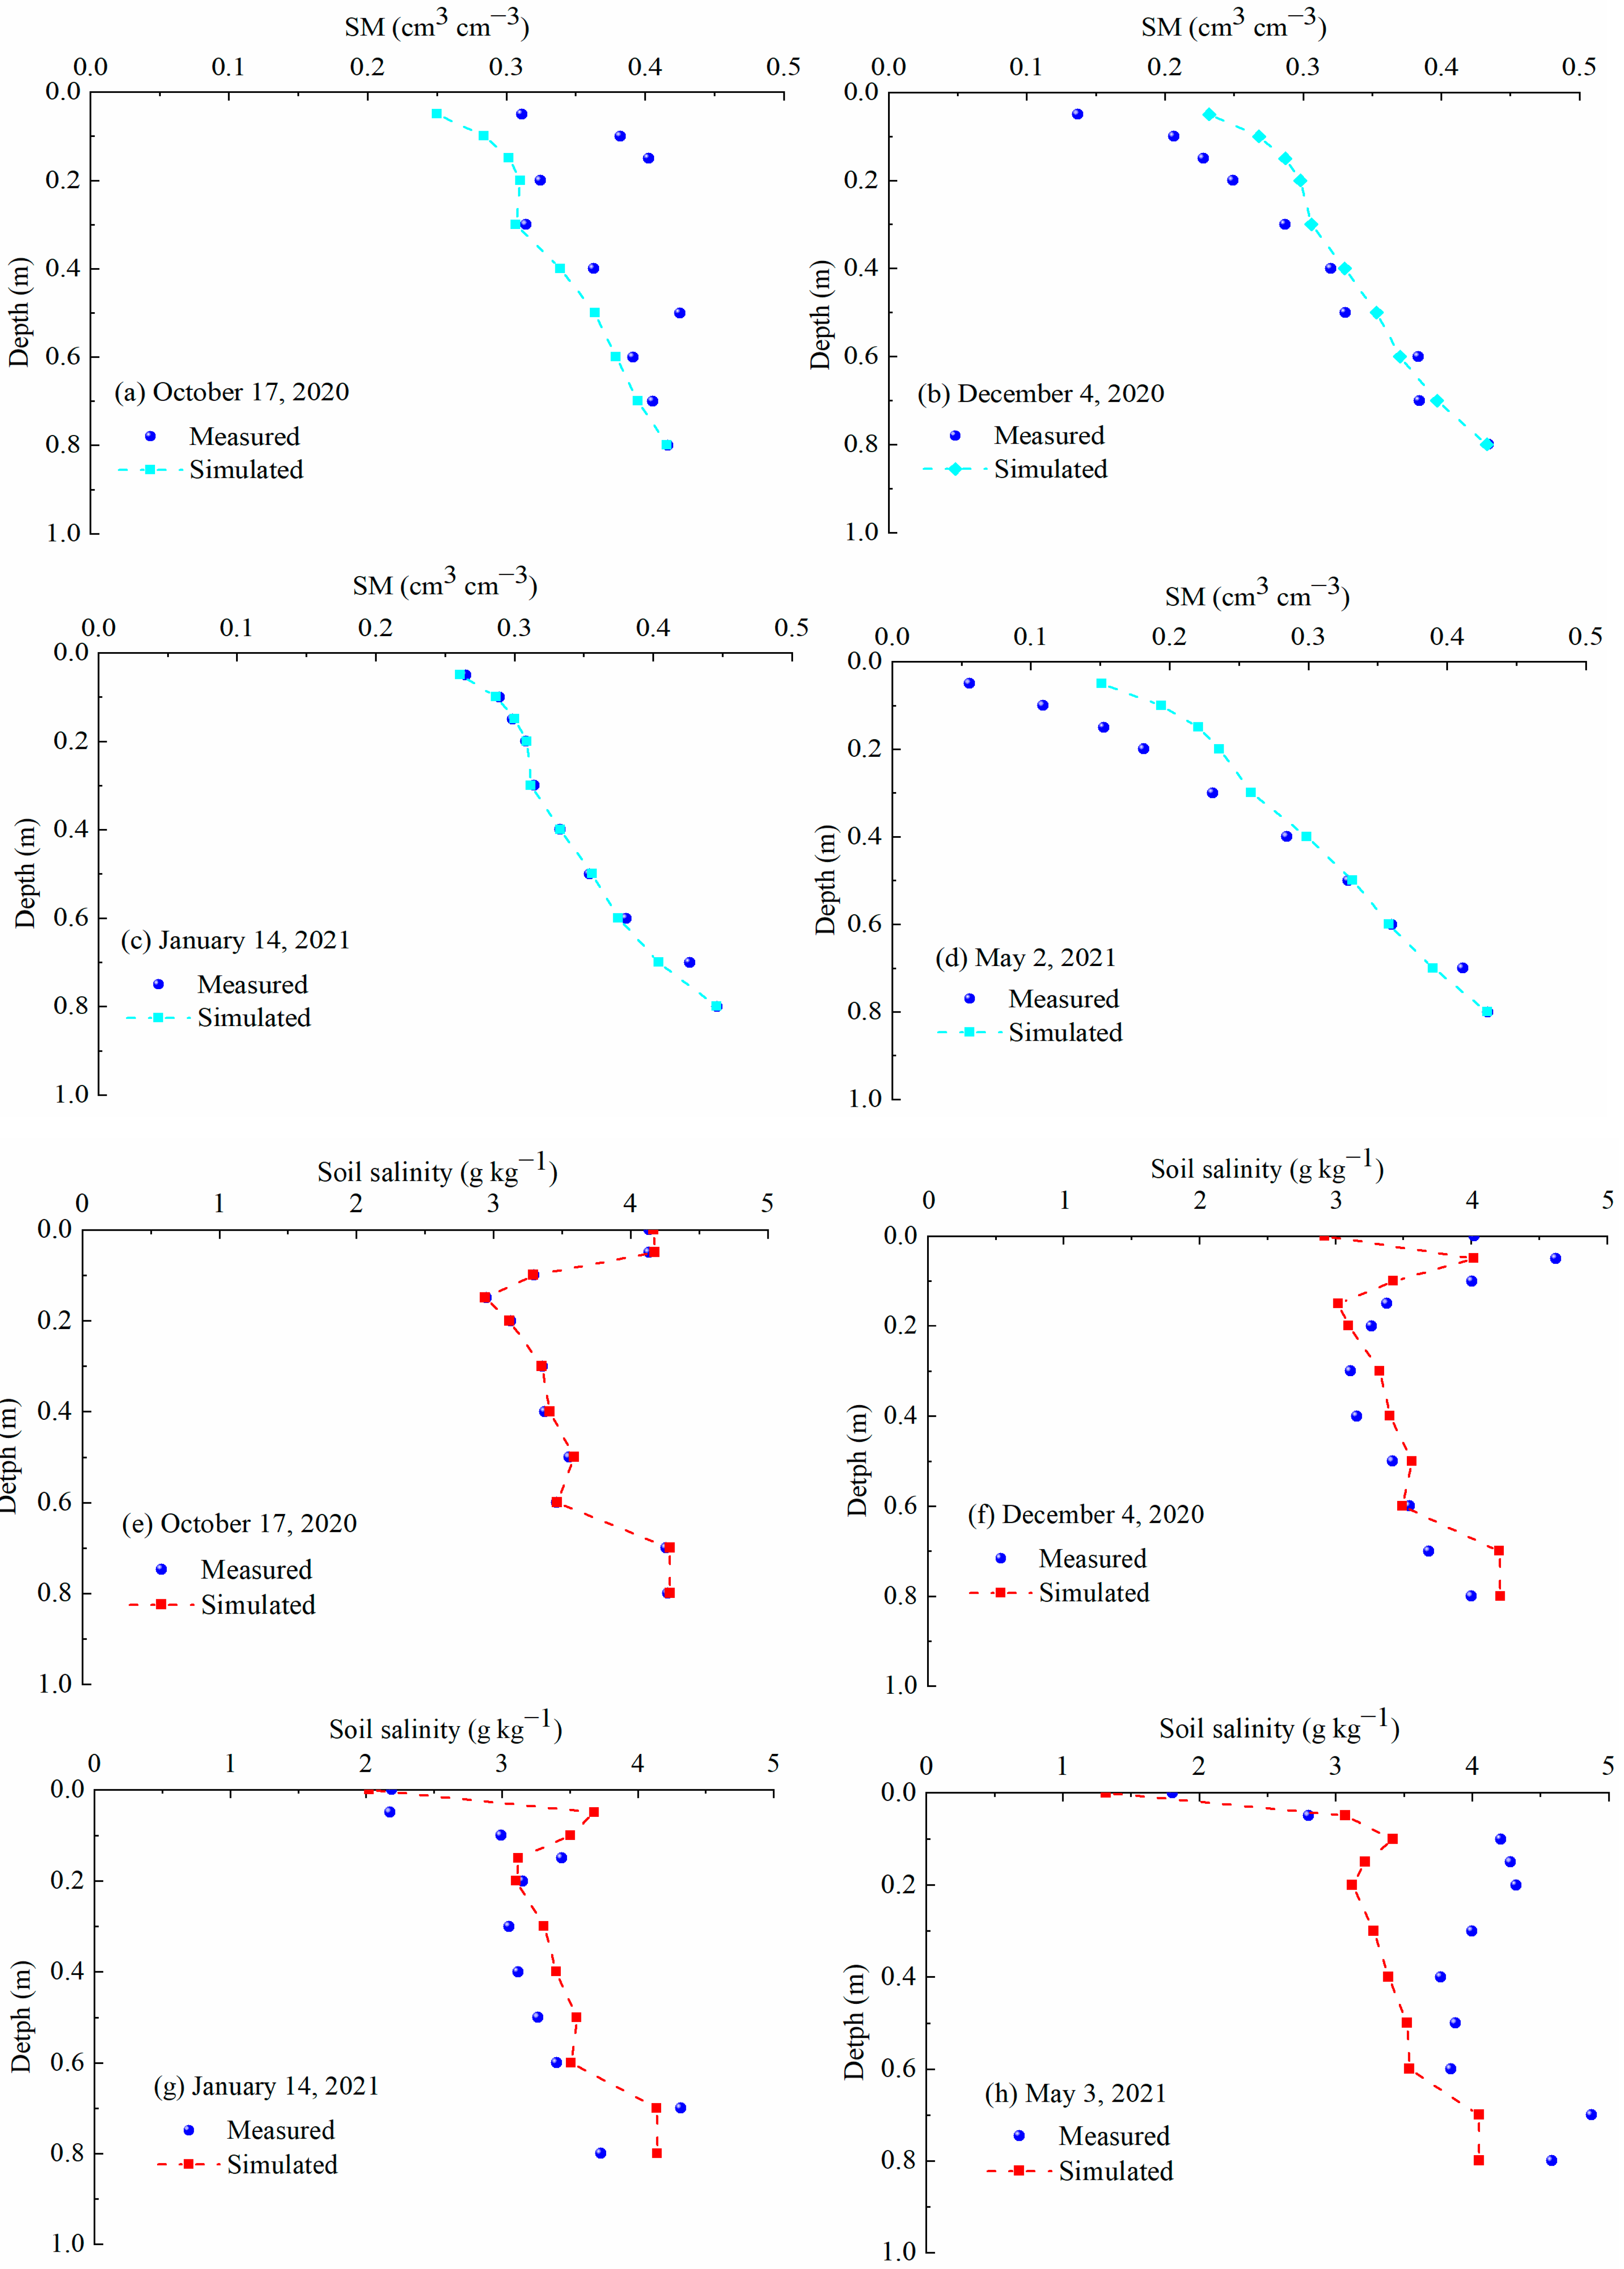
The SHAW model was verified by using the measured values of the SM and salt content in each soil layer of winter wheat from 2020 to 2021. The verification results are shown in Figure 7. The validation results of the SHAW model showed that the RMSE of the SM ranged from 0.0075 to 0.0532 cm3 cm−3. The simulation result of the model on the SM of winter wheat was better, and the simulation effect of deep soil was significantly better than that of surface soil, due to the phase change in the water in the soil during the freezing and thawing process causing changes to the unfrozen water content and matrix potential, making it more difficult to accurately predict water migration. Additionally, the model could also better simulate the soil salt of each soil layer. The RMSE of the soil salt was in the range of 0.0234–0.7141 g kg−1, but the RMSE of the topsoil was as high as 1.102 g kg−1. The large error in the salt content was due to the strong spatial variability in the salt content and the large error in the monitoring data itself. It was also contributed to by the SM and temperature having a strong coupling effect on the transport of the soil salt during the freezing and thawing processes, and the errors in the moisture and heat transport further affecting the simulation accuracy of the salt. In addition, there was a significant return of salt on the surface in the spring, and the crystallization and precipitation of the salt were not considered in the simulation, which also affected the simulation.

3.3. Response of SM to Winter Irrigation Amount

According to the calibrated and verified SHAW model parameters, the response of the SM to the irrigation volume in wet years, normal years, and dry years was studied, and the appropriate irrigation volume was selected in each typical year. We showed the dynamic changes in the SM at 0–80 cm depth in typical years under winter irrigation (Figure 8).
It can be seen from Figure 8 that the content of soil unfrozen water in the 0–20 cm soil layer in each typical hydrological year remained at a low level, mainly because the soil in this layer is greatly affected by the atmosphere, and part of the soil water is stored in the soil in solid form, while the other part of the soil water evaporates into the atmosphere and seeps into the lower soil. The SM in the 20–80 cm soil layer was less affected by the atmosphere, and the content of unfrozen soil water increased with the increase in depth. This was similar to findings by Li et al. (2018) [23]. Winter irrigation in each typical hydrological year can significantly affect the soil water content in the freezing and thawing period. The larger the winter irrigation quota, the better the soil water environment effect of winter wheat in the freezing and thawing period.
In wet years, the regional rainfall can form a better soil water environment, and winter irrigation is not needed to improve the winter wheat growth during the winter. In normal years, when the winter irrigation amount was 20 mm, 40 mm, 60 mm, 80 mm, 100 mm, 120 mm, or 150 mm, the average SM of the 0–80 cm soil layer profile increased by 14.4%, 25.0%, 32.7%, 37.2%, 37.2%, 37.2%, and 37.2%, respectively. When the winter irrigation amount was 60 mm, the soil water environment of the 0–80 cm soil layer could be improved. In dry years, when the winter irrigation amount was 20 mm, the average SM of the 0–80 cm soil layer profile increased by 16.3%. When the winter irrigation water volume was 40 mm, 60 mm, 80 mm, 100 mm, 120 mm, or 150 mm, the average SM of the 0–80 cm soil layer profile increased by 26.9%, 33.8%, 36.6%, 37.1%, 37.1%, and 37.1%, respectively. Therefore, in dry years, when the winter irrigation amount is 80 mm, a better soil water condition can be formed for winter wheat seedling growth.

3.4. Response of Soil Temperature to Winter Irrigation Amount

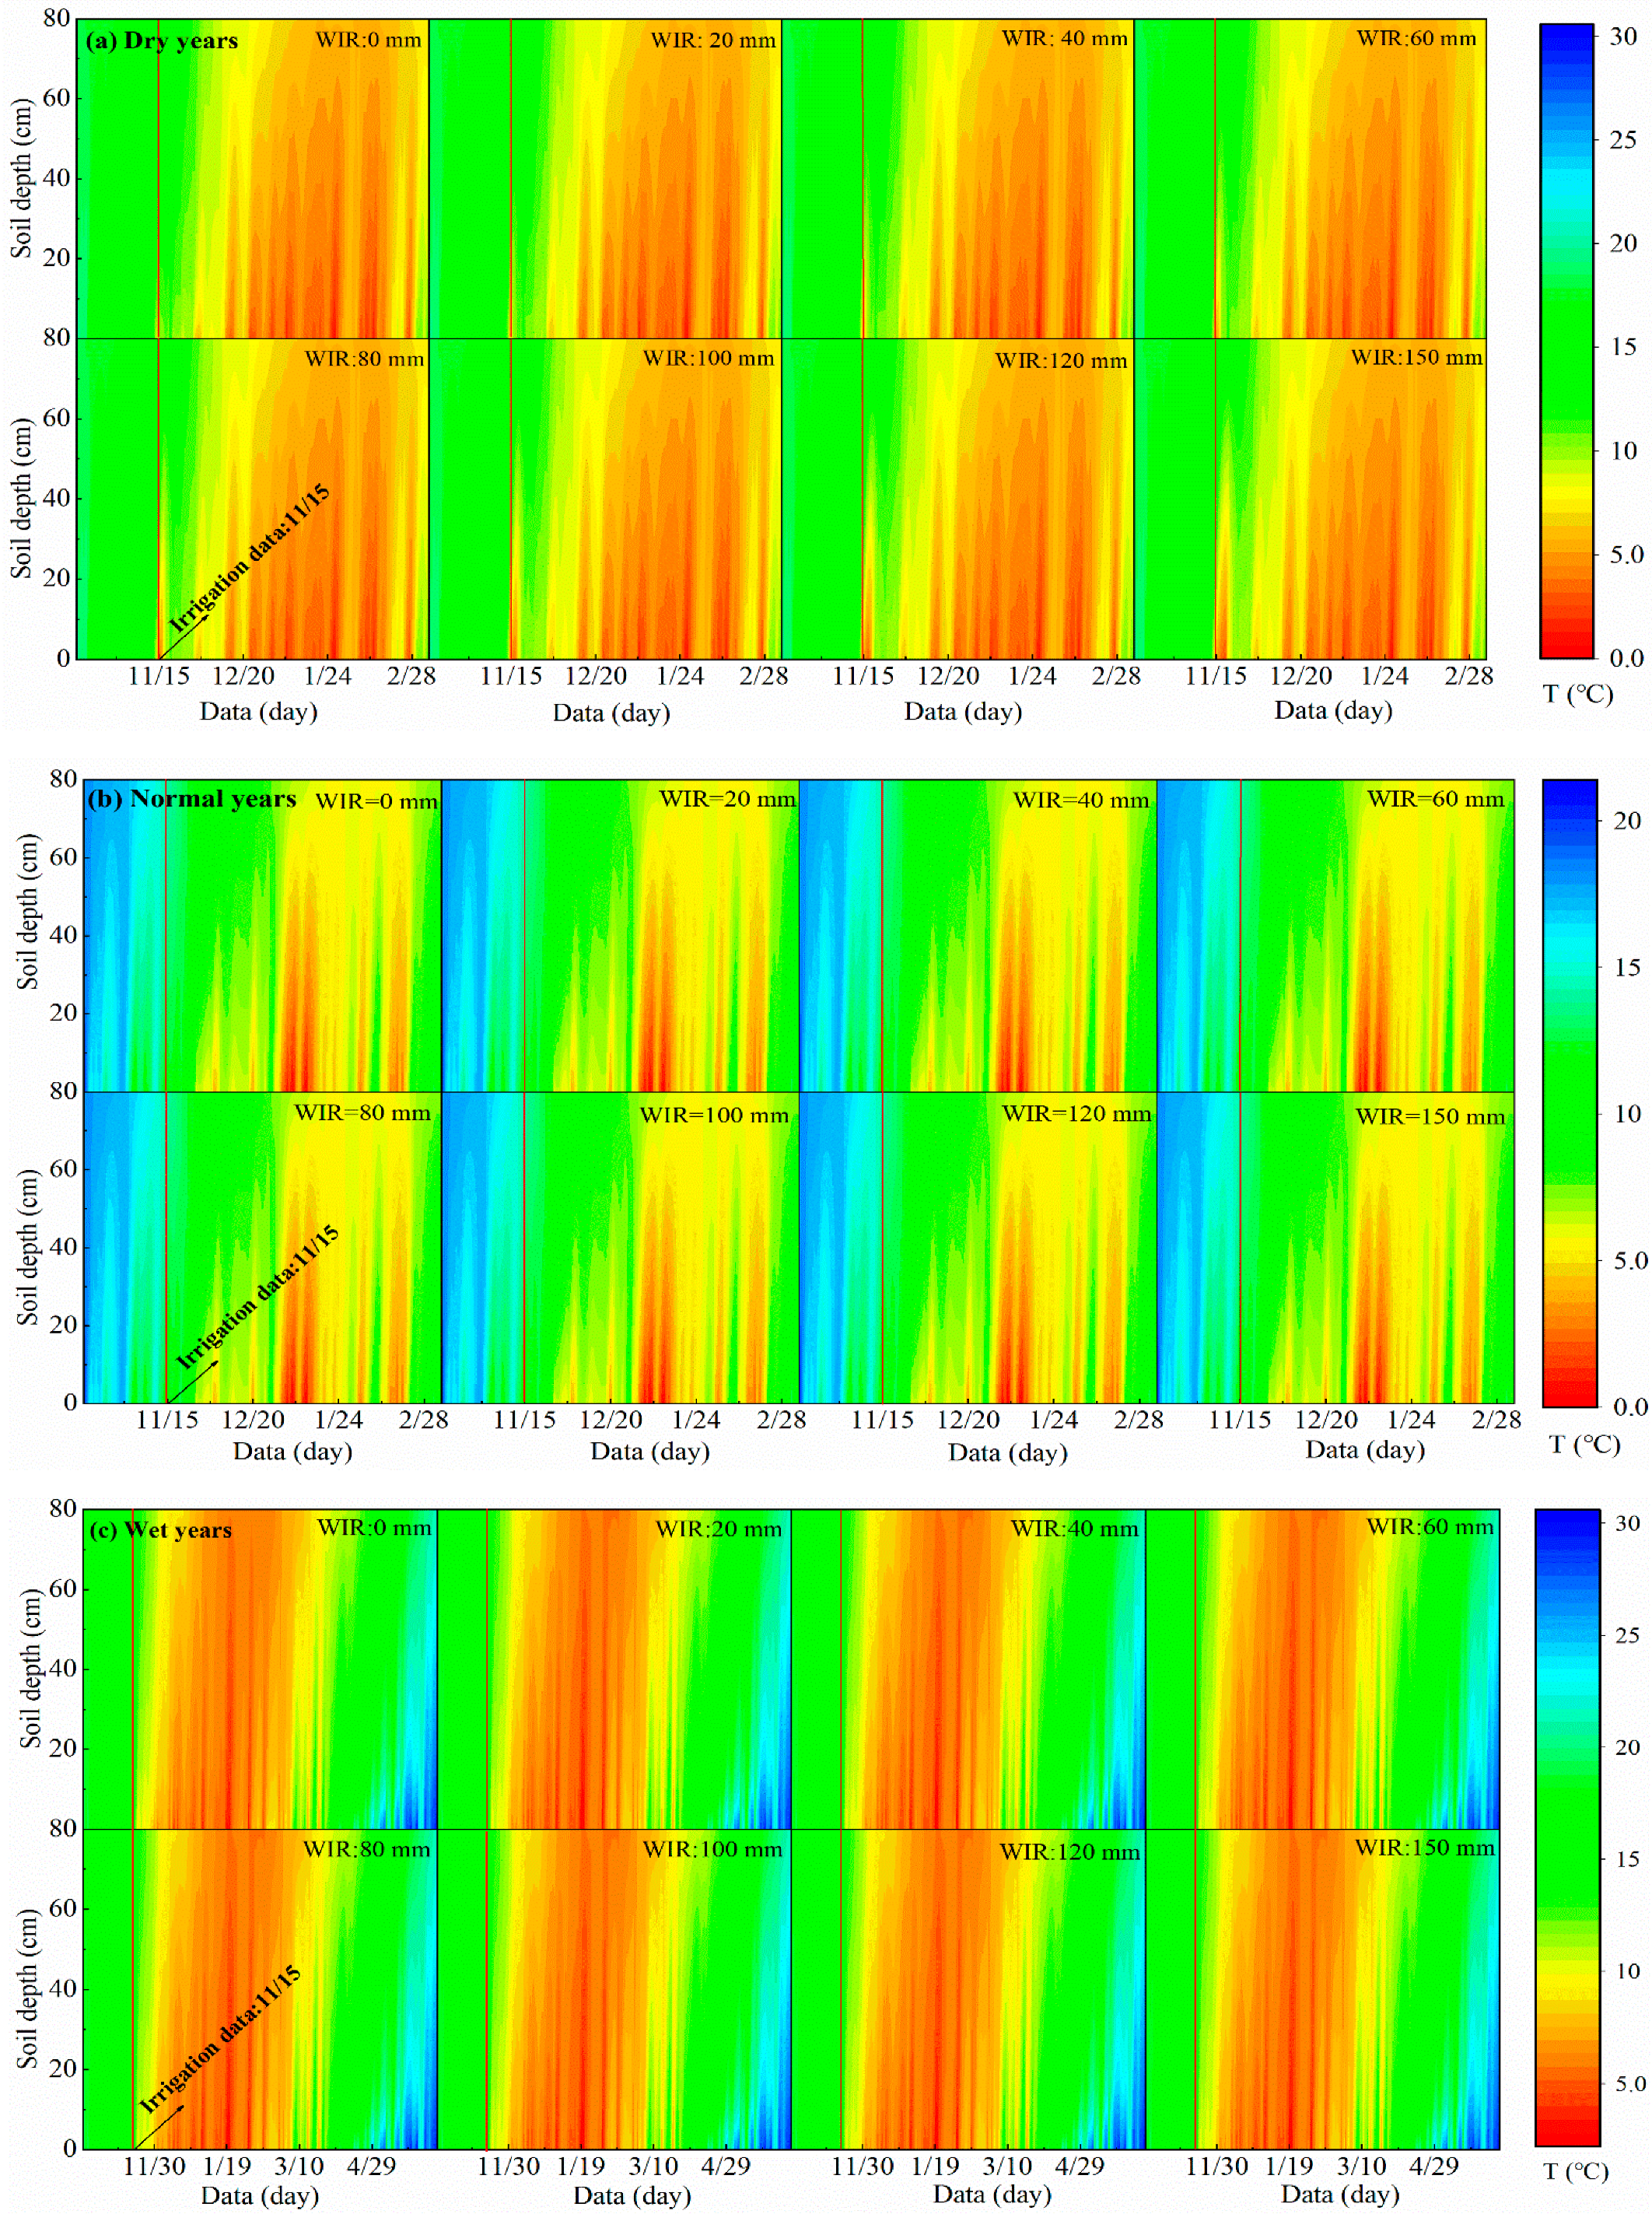
Figure 9 shows the dynamic changes in the soil temperature at a depth of 0–80 cm under winter irrigation treatment in wet, normal, and dry years. It can be seen that winter irrigation has a relatively small impact on soil temperature. Compared with deep soil, the temperature variation in the 0–20 cm soil layer was larger, mainly influenced by the air temperature. In dry years, when the winter irrigation volume was 20 mm, 40 mm, 60 mm, 80 mm, 100 mm, 120 mm, or 150 mm, the average temperature changes in the 0–20 cm soil layer after winter irrigation were 0.22 °C, 0.18 °C, 0.12 °C, 0 °C, −0.14 °C, −0.42 °C, and –1.22 °C, respectively. In normal years, when the winter irrigation volume was 20 mm, 40 mm, 60 mm, 80 mm, 100 mm, 120 mm, or 150 mm, the average temperature changes in the 0–20 cm soil layer after winter irrigation were 0.12 °C, 0.14 °C, 0.14 °C, 0.14 °C, 0.14 °C, 0.14 °C, and 0.14 °C, respectively. In wet years, when the winter irrigation volume was 20 mm, 40 mm, 60 mm, 80 mm, 100 mm, 120 mm, or 150 mm, the average temperature changes in the 0–20 cm soil layer after winter irrigation were 0.26 °C, 0.26 °C, 0.28 °C, 0.28 °C, 0.28 °C, 0.28 °C, and 0.28 °C, respectively. In the Yellow River Delta region of China, the soil temperature of each soil layer is not lower than 0 °C in high-flow years, normal-flow years, and low-flow years, so there is no transformation process of liquid water and solid ice in the freezing and thawing period in this region.

3.5. Response of Soil Salinity to the Winter Irrigation Amount

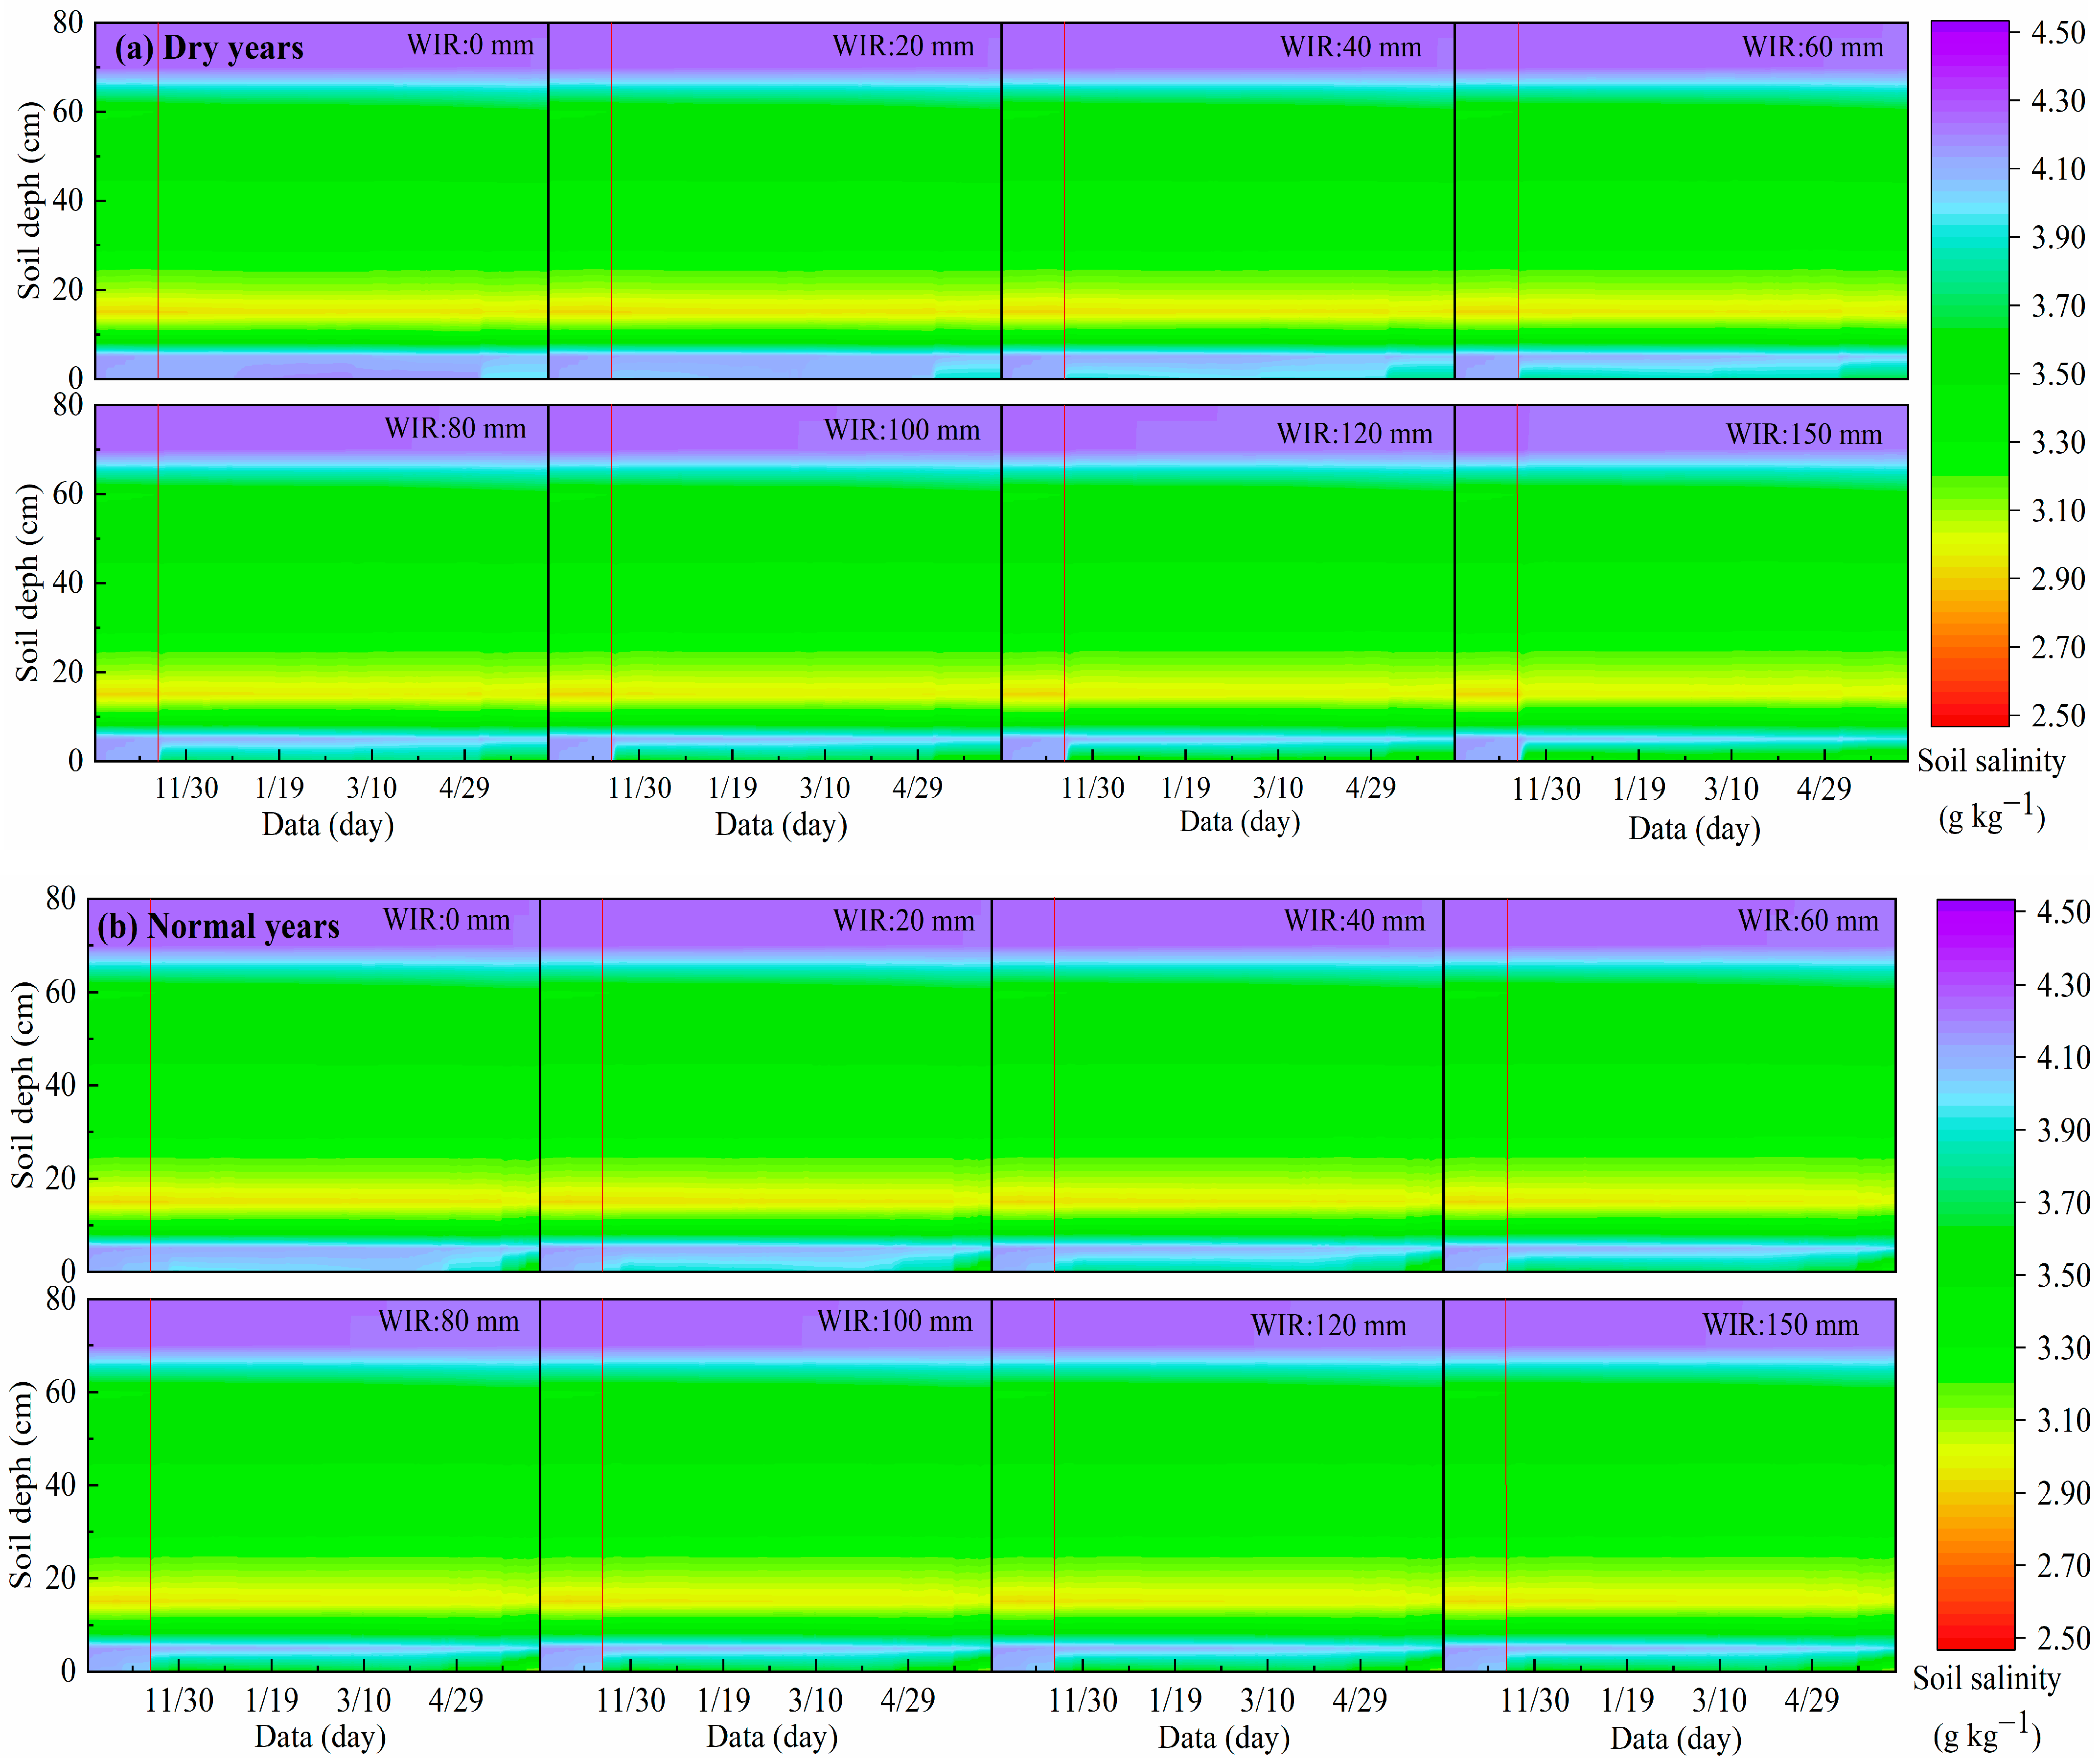
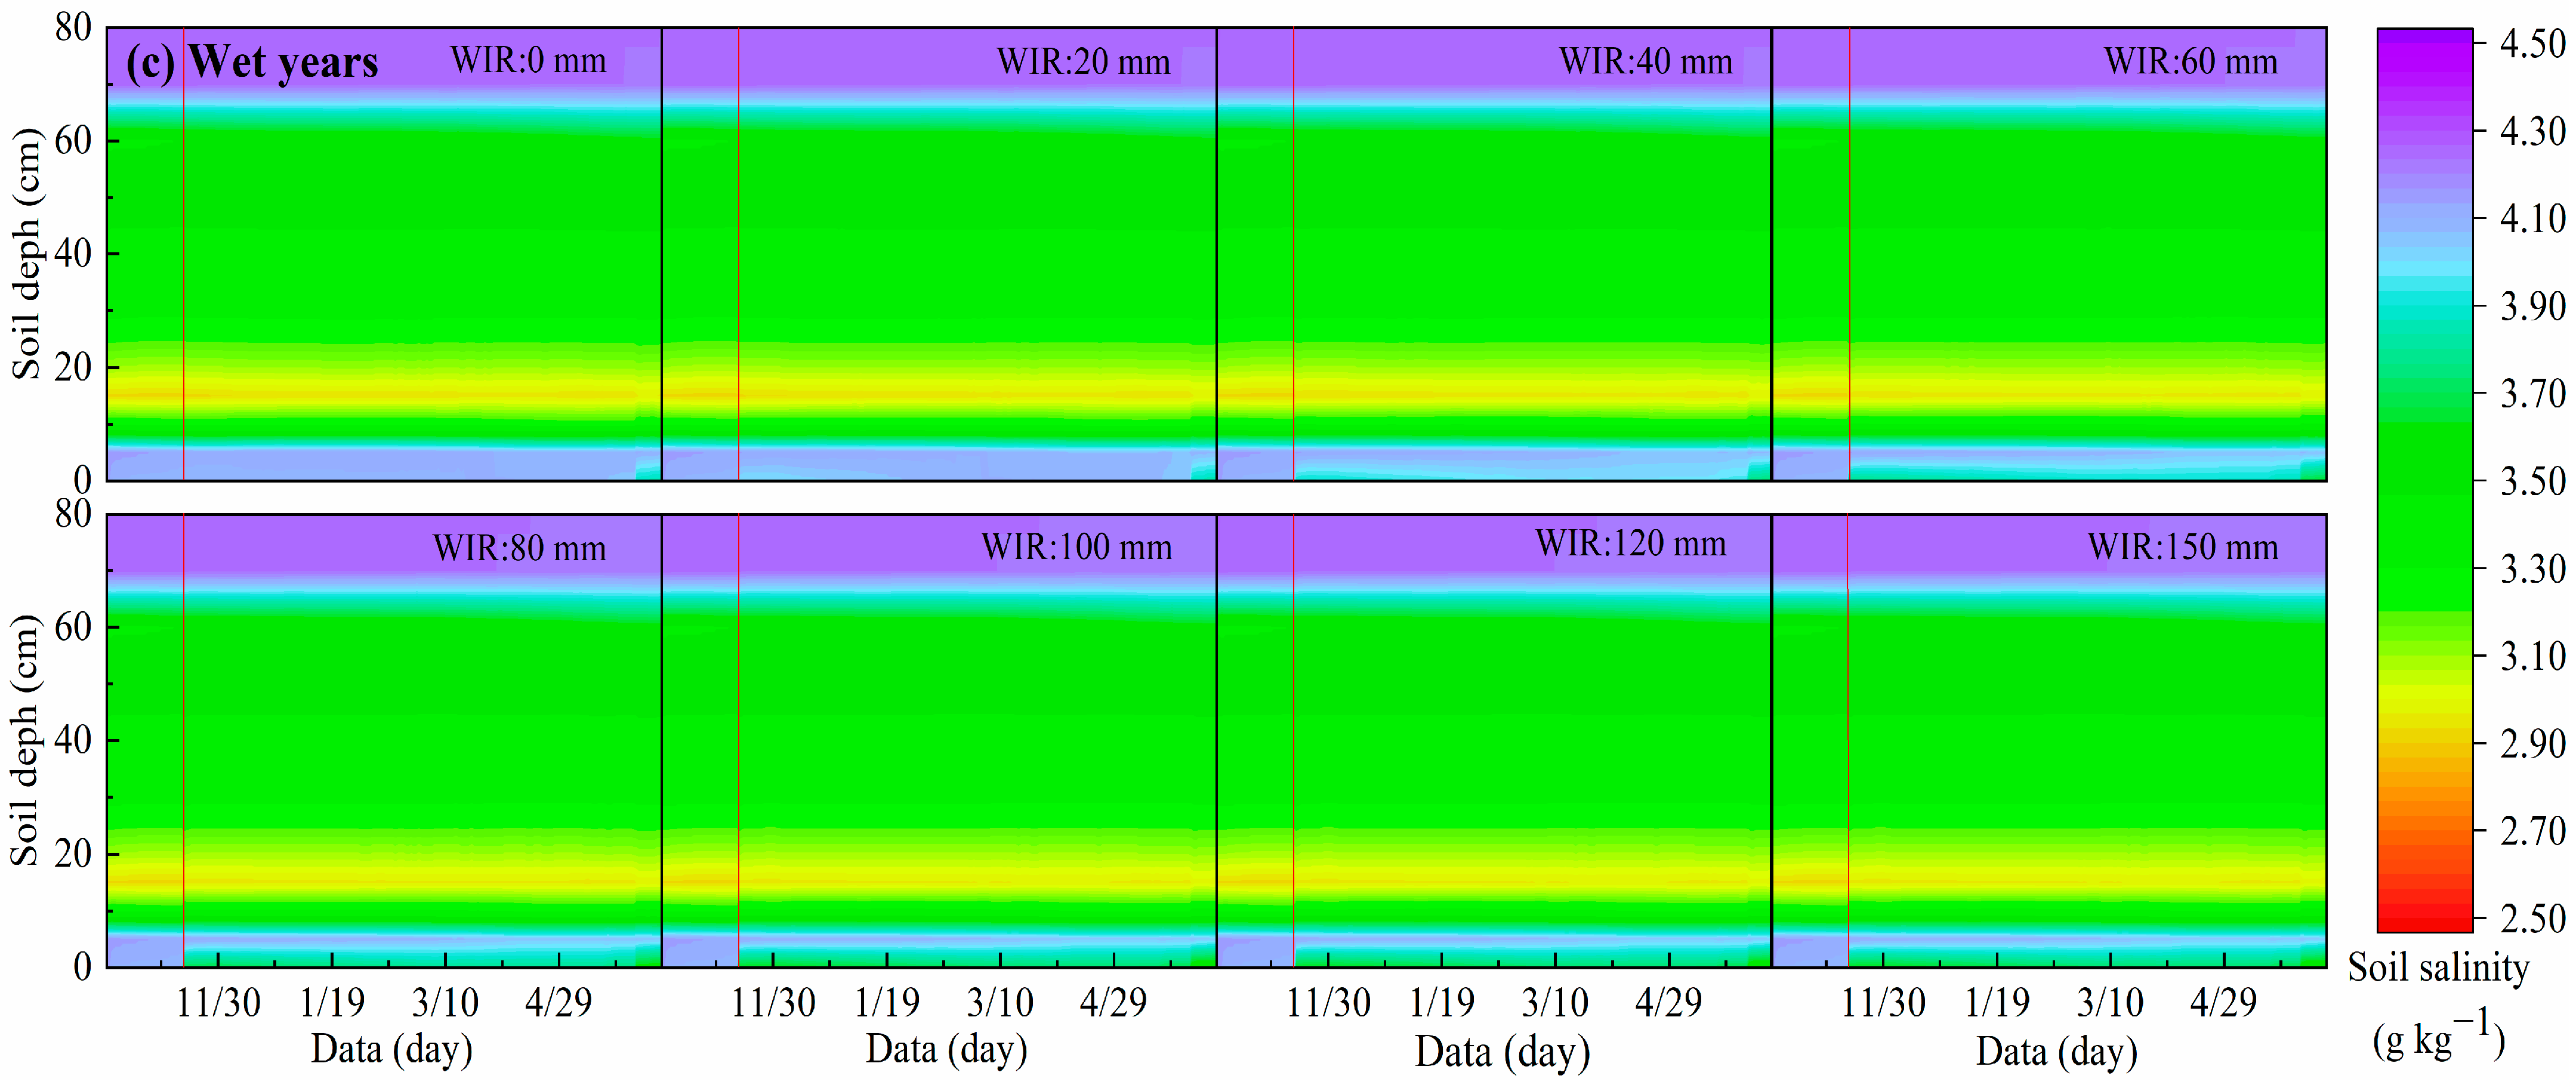
Figure 10 shows the dynamics of the soil salinity at 0–80 cm depth in typical years under different winter irrigation amounts. In wet years, when the winter irrigation amount was 20 mm, 40 mm, 60 mm, 80 mm, 100 mm, 120 mm, or 150 mm, the soil desalination rates of the 0–20 cm soil layer profile were 2.0%, 4.4%, 7.2%, 9.7%, 11.5%, 11.3%, and 11.5%, respectively. The soil salt status of the 20–80 cm soil layer profile was relatively stable. In normal years, when the winter irrigation amount was 20 mm, 40 mm, 60 mm, 80 mm, 100 mm, 120 mm, or 150 mm, the soil desalination rate of the 0–20 cm soil layer profile was 2.2%, 4.8%, 7.4%, 9.7%, 9.7%, 9.7%, and 9.7%, respectively. When the winter irrigation amount exceeded 80 mm, the desalination rate of the 20–80 cm soil layer was 0.14%. In dry years, when the winter irrigation amount was 20 mm, 40 mm, 60 mm, 80 mm, 100 mm, 120 mm, or 150 mm, the soil desalination rate of the 0–20 cm soil layer profile was 2.3%, 5.0%, 7.7%, 10.2%, 12.9%, 18.8%, and 15.3%, respectively. When the winter irrigation amount exceeded 80 mm, the soil desalination rate of the 20–80 cm soil layer profile was 4.0%. Therefore, a reasonable irrigation amount to alleviate the salinization of shallow soil was 80 mm in wet and normal years and 100 mm in dry years.

4. Discussion

4.1. Effect of Winter Irrigation on SM, Temperature, and Salt Transport

In recent years, there has been significant salt accumulation in the farmland soil profile of the study area in the Yellow River Delta. The irrigation amount, groundwater depth, and groundwater salinity are the main factors influencing the salt content of the primary saline soil in this region [24]. Freeze–thaw cycles are an important factor that can alter the soil structure and influence SM and soil salinity [13,25]. The freezing process causes a decrease in soil temperature and the freezing of SM, which hinders soil water retention. Winter irrigation, however, can significantly increase SM and the temperature during the freeze–thaw period in farmland. This practice effectively alleviates the impact of spring drought and promotes crop growth [23]. When the soil freezes, the distribution of soil salts is primarily influenced by convection. Under the influence of temperature gradients, salt particles are transported with the water flow from the warmer end to the colder end, resulting in salt accumulation in the soil [26]. Under winter irrigation conditions, the changes in SM and salt content over time exhibit a similar pattern. The SM increases while the salt content decreases in the frozen soil layer [27].
This study showed that winter irrigation during the freeze–thaw period leads to a significant increase in SM in the surface soil. A winter irrigation amount of 20 mm, 40 mm, 60 mm, 80 mm, 100 mm, 120 mm, and 150 mm increased the SM by 14.4–37.2% and 26.9–37.1%, respectively, in the normal and dry years at the 0–20 cm soil depth, and the SM remained relatively stable in the wet years. The maximum temperature increase in the soil surface layer in wet, normal, and dry years was 0.28 °C, 0.14 °C, and –1.22 °C, respectively. The desalination rates of the 0–20 cm soil depth in wet, normal, and dry years were 2.0–11.5%, 2.2–9.7%, and 2.3–18.8%, respectively. Therefore, winter irrigation in the freeze–thaw period can provide good soil water and salt conditions for crop growth and has the effect of storing water, preserving moisture, and desalinating the soil. With the increase in winter irrigation, the effect of salt leaching is significant [28,29]. The irrigation quota significantly affects SM. Within a certain range, as the irrigation quota increases, the SM of the profile (especially the surface soil) was significantly higher than that of the non-winter irrigation treatment [30]. Winter irrigation has a positive effect on soil water conservation and salt suppression, leaching soil salt into the depth of the soil layer, inhibiting soil salt reflux caused by evaporation in the next year, and providing good soil water and salt strips for crop growth [31]. Winter irrigation can leach soil salt into the deep soil layer. With the increase in the winter irrigation amount, the soil desalination rate rises, which can effectively inhibit the accumulation of soil salt in the surface soil [32]. Therefore, reasonable winter irrigation in the Yellow River Delta area could reduce the migration of deep soil water to the surface during the soil freezing process, inhibit the process of soil salt accumulation to the surface layer during the freezing and thawing period, and make the crop plough layer suitable for the normal growth of crops in the seedling stage, which would be of great significance to the sustainable development of agriculture in this area.

4.2. Optimization and Suggestions for the Irrigation Scheme

The irrigation scheme should comprehensively consider the soil water and salt environment at the growth stage of winter wheat. Winter wheat shows different drought and salt tolerance at different growth stages. Generally, the seedling stage is more sensitive to the soil water and salt environment, and the drought and salt tolerance are weak. With the growth of winter wheat, the drought and salt tolerance increase. Therefore, it is of great significance to adopt a reasonable winter irrigation system to improve the water and salt environment of winter wheat seedlings and ensure the normal growth of winter wheat. Jing et al. (2010) proposed that SM exceeding 0.30 cm3 cm−3 can lead to severe root rot of wheat during the turning-green period. An SM of 0.20–0.25 cm3 cm−3 is beneficial for wheat turning green and vigorous root growth [33]. During the overwintering period of winter wheat, a soil temperature below 0 °C or leaf surface temperature below –4 °C may cause freezing damage [34]. Research by Tao et al. (2023) showed that salt stress significantly reduces the leaf area index, dry matter accumulation, and yield of wheat at 3.294 g kg−1 [35]. According to the scenario simulation study of three typical years of wet, normal, and dry and eight winter irrigation amounts, it was found that a winter irrigation amount of 80 mm in wet years and normal years could significantly improve the water and salt growth environment of winter wheat seedlings. In dry years, the recommended winter irrigation amount is 100 mm to provide suitable soil water and salt conditions for winter wheat growth at the seedling stage. This conclusion is restrained by the research results of Wang et al. (2017), stating that irrigation in the winter of 80 mm in the Yellow River Delta can effectively leach the soil salt to avoid excessive accumulation of salt [36]. In dry years, the amount of irrigation in winter can be appropriately increased to ensure the safe and sustainable use of soil.
The study area is a coastal saline-alkali area, and the salinity is heavy. Reasonable winter irrigation should be carried out to ensure the growth of winter wheat. The winter irrigation time is from middle to late November to the first ten days of December every year, when the soil begins to freeze or freezes overnight. In order to prevent irrigation water from replenishing groundwater and causing the rise in the groundwater level, leading to soil secondary salinization, the amount of irrigation water should not be too large each time, and the sum of irrigation water and precipitation at the same time should not exceed 150 mm. Therefore, according to the effect of the winter irrigation amount on soil water conservation and soil desalination, the winter irrigation amount is recommended as 80 mm in wet years and normal years, and 100 mm in dry years, to ensure that the surface soil salt is relatively balanced and so as not to affect the growth and yield of winter wheat.

5. Conclusions

In this study, based on the field freeze–thaw SM, temperature, and salinity data from 2019 to 2021 and the monitoring of relevant meteorological data, we conducted a localized applicability analysis and scenario simulation under different winter irrigation quotas for the SHAW model. The field test data from 2019 to 2021 were used to calibrate and validate the SHAW model. Meteorological data from 1965 to 2015 and optimized model parameters were used to simulate the winter irrigation volume in wet, normal, and dry years. The results showed that the SHAW model has a good performance in the simulation of the freeze–thaw SM, temperature, and salt in the Yellow River Delta. It is suggested that the winter irrigation amount in Yellow River Delta should be 80 mm in high- and low-water years for winter wheat seedlings and 100 mm in low-water years. The simulation results provide a reliable reference for agricultural production and water and soil conservation in this region. Although the SHAW model is relatively successful in simulating the coupling processes of water, heat, and salt in freeze–thaw soil in the Yellow River Delta, it is insufficient for the use of more empirical formulas in the model, and a large number of data are needed to optimize the model parameters and increase the reliability, correctness, and applicability of the model. In this study, the optimization of winter irrigation under freeze–thaw conditions did not consider the influence of groundwater, and there were many empirical formulas in the model which affected the simulation accuracy of the model.

Author Contributions

Conceptualization, Y.B. and Q.F.; methodology, W.M. and H.L.; software, Q.F.; validation, Y.S. (Yuyang Shan), Y.B. and Y.S. (Yan Sun); formal analysis, L.S.; investigation, G.L.; resources, Y.S. (Yuyang Shan); data curation, Y.B.; writing—original draft preparation, G.L.; writing—review and editing, Y.S. (Yuyang Shan); visualization, Y.B.; supervision, Y.S. (Yan Sun) and L.S.; project administration, Y.B.; funding acquisition, Q.F. All authors have read and agreed to the published version of the manuscript.

Funding

Major Special Science and Technology Project of Xinjiang Province (2022A02007-3).

Institutional Review Board Statement

Not applicable.

Informed Consent Statement

Not applicable.

Data Availability Statement

The data presented in this study are available on request from the corresponding author.

Conflicts of Interest

The authors declare no conflict of interest. The funders had no role in the design of the study; in the collection, analyses, or interpretation of data; in the writing of the manuscript; or in the decision to publish the results.

References

  1. Cai, Z.; Xie, D.; Xu, H.; Wei, C.; Gao, M. Factors Influencing CH4 Emissions from a Permanently Flooded Rice Field during Rice Growing Period. Chin. J. Appl. Ecol. 2003, 14, 705–709. [Google Scholar]
  2. Chen, W.; Hou, Z.; Wu, L.; Liang, Y.; Wei, C. Evaluating Salinity Distribution in Soil Irrigated with Saline Water in Arid Regions of Northwest China. Agric. Water Manag. 2010, 97, 2001–2008. [Google Scholar] [CrossRef]
  3. Liu, M.; Yang, J.; Li, X.; Liu, G.; Yu, M.; Wang, J. Distribution and Dynamics of Soil Water and Salt under Different Drip Irrigation Regimes in Northwest China. Irrig. Sci. 2013, 31, 675–688. [Google Scholar] [CrossRef]
  4. Du, J.; Wang, Z.; Yu, H.; Ji, B. Optimum Winter Irrigation Amount of Subsurface Drip Irrigation in Alfalfa Grassland. Agric. Res. Arid. Areas 2020, 38, 166–172. [Google Scholar]
  5. Xiong, L.; Ma, F.; Fan, H.; Zhang, W.; Cui, J.; Zheng, Z. Interaction Effects of Winter Irrigation and Chemical Regulation on Lodging Resistance and Yield of Drip Irrigated Spring Wheat. J. Triticeae Crop. 2012, 32, 932–936. [Google Scholar]
  6. Wang, Z.; Jin, M.; Simunek, J.; Van Genuchten, M. Evaluation of Mulched Drip Irrigation for Cotton in Arid Northwest China. Irrig. Sci. 2014, 32, 15–27. [Google Scholar] [CrossRef] [Green Version]
  7. Harlan, R. Analysis of Coupled Heat-Fluid Transport in Partially Frozen Soil. Water Resour. Res. 1973, 9, 1314–1323. [Google Scholar] [CrossRef] [Green Version]
  8. Jansson, P.; Moon, D. A Coupled Model of Water, Heat and Mass Transfer Using Object Orientation to Improve Flexibility and Functionality. Environ. Model. Softw. 2001, 16, 37–46. [Google Scholar] [CrossRef]
  9. Flerchinger, G.; Saxton, K. Simultaneous Heat and Water Model of a Freezing Snow-Residue-Soil System II. Trans. ASAE 1989, 32, 573–576. [Google Scholar] [CrossRef]
  10. He, H.; Flerchinger, G.; Kojima, Y.; He, D.; Hardegree, S.; Dyck, M.; Horton, R.; Wu, Q.; Si, B.; Lv, J. Evaluation of 14 Frozen Soil Thermal Conductivity Models with Observations and SHAW Model Simulations. Geoderma 2021, 403, 115207. [Google Scholar] [CrossRef]
  11. Li, R.; Shi, H.; Flerchinger, G.; Akae, T.; Wang, C. Simulation of Freezing and Thawing Soils in Inner Mongolia Hetao Irrigation District, China. Geoderma 2012, 173, 28–33. [Google Scholar] [CrossRef]
  12. Li, R.; Shi, H.; Flerchinger, G.; Zou, C.; Li, Z. Modeling the Effect of Antecedent Soil Water Storage on Water and Heat Status in Seasonally Freezing and Thawing Agricultural Soils. Geoderma 2013, 206, 70–74. [Google Scholar] [CrossRef]
  13. Lu, Z.; Xian, S.; Yao, H.; Fang, R.; She, J. Influence of Freeze-Thaw Cycles in the Presence of a Supplementary Water Supply on Mechanical Properties of Compacted Soil. Cold Reg. Sci. Technol. 2019, 157, 42–52. [Google Scholar] [CrossRef]
  14. Liu, B.; Jia, X.; Shao, M.; Jia, Y. Assessing Soil Water Recovery after Converting Planted Shrubs and Grass to Natural Grass in the Northern Loess Plateau of China. Agric. Water Manag. 2022, 264, 107490. [Google Scholar] [CrossRef]
  15. Lin, D.; Wang, F.; Xu, Z.; Mao, X. Appropriate Winter and Spring Irrigations for Salt Leaching in Typical Cotton Field of Southern Xinjiang Based on SHAW Model. Trans. Chin. Soc. Agric. Mach. 2023, 54, 326–338. [Google Scholar]
  16. Lin, D.; Huang, X.; Xu, Z.; Mao, X. Spatial Distribution Characteristics of the Suitable Salt Leaching Quota in Typical Irrigation Areas of Southern Xinjiang Based on SHAW Model. Trans. Chin. Soc. Agric. Eng. 2023, 39, 70–80. [Google Scholar]
  17. Zhang, C.; Gong, Z.; Qiu, H.; Zhang, Y.; Zhou, D. Mapping Typical Salt-Marsh Species in the Yellow River Delta Wetland Supported by Temporal-Spatial-Spectral Multidimensional Features. Sci. Total Environ. 2021, 783, 147061. [Google Scholar] [CrossRef]
  18. Zhang, Z.; Song, Y.; Zhang, H.; Li, X.; Niu, B. Spatiotemporal Dynamics of Soil Salinity in the Yellow River Delta under the Impacts of Hydrology and Climate. Chin. J. Appl. Ecol. 2021, 32, 1393–1405. [Google Scholar]
  19. Liu, Z.; Feng, S.; Zhang, D.; Han, Y.; Cao, R. Effects of Precipitation, Irrigation, and Exploitation on Groundwater Geochemical Evolution in the People’s Victory Canal Irrigation Area, China. Appl. Water Sci. 2022, 13, 1. [Google Scholar] [CrossRef]
  20. Brooks, R.; Corey, A. Properties of Porous Media Affecting Fluid Flow. J. Irri. Drain. Div. 1966, 92, 61–88. [Google Scholar] [CrossRef]
  21. Campcell, G. A Simple Method for Determining Unsaturated Conductivity from Moisture Retention Data. Soil Sci. 1974, 117, 311–314. [Google Scholar] [CrossRef]
  22. Campcell, G. Soil Physics With Basic Transport Models for Soil–Plant Systems; Elsevier: Amsterdam, The Netherlands, 1985; Volume 14, p. 150. [Google Scholar]
  23. Li, J.; He, Z.; Du, J.; Chen, L.; Lin, P.; Zhu, X.; Fang, S.; Zhao, M.; Tian, Q. Effects of Winter Irrigation on Soil Hydro-Thermal Features in Desert Oasis Farmland in Arid Area during Freezing and Thawing Period. Trans. Chin. Soc. Agric. Eng. 2018, 34, 105–112. [Google Scholar]
  24. Fan, X.; Liu, G.; Tang, Z.; Su, L. Analysis on Main Contributors Influencing Soil Salinization of Yellow River Delta. Soil Water Conserv. 2010, 1, 139–144. [Google Scholar]
  25. Larson, L.; Kiemnec, G.; Johnson, D. Influence of Freeze-Thaw Cycle on Silt Loam Soil in Sagebrush Steppe of Northeastern Oregon. Rangel. Ecol. Manag. 2019, 72, 69–72. [Google Scholar] [CrossRef]
  26. Wu, M.; Huang, J.; Wu, J.; Tan, X.; Jansson, P. Experimental Study on Evaporation from Seasonally Frozen Soils under Various Water, Solute and Groundwater Conditions in Inner Mongolia, China. J. Hydrol. 2016, 535, 46–53. [Google Scholar] [CrossRef]
  27. Cui, L.; Zhu, Y.; Zhao, T.; Yang, J.; Wu, J. Soil Ion Components and Soil Salts Transport in Frozen Layer in Seasonal Freezing-Thawing Areas. Trans. Chin. Soc. Agric. Eng. 2019, 35, 75–82. [Google Scholar]
  28. Chen, J.; Zheng, X.; Xing, X.; Yang, J.; Hou, Y.; Jia, Z. Influence of Plastic Film Mulching on Infiltration into Seasonal Freezing-Thawing Soil. Trans. Chin. Soc. Agric. Eng. 2006, 22, 18–21. [Google Scholar]
  29. Phogat, V.; Skewes, M.; McCarthy, M.; Cox, J.; Simunek, J.; Petrie, P. Evaluation of Crop Coefficients, Water Productivity, and Water Balance Components for Wine Grapes Irrigated at Different Deficit Levels by a Sub-Surface Drip. Agric. Water Manag. 2017, 180, 22–34. [Google Scholar] [CrossRef] [Green Version]
  30. Zhao, B.; Wang, Z.; Li, W. Effects of Winter Drip Irrigation Mode and Quota on Water and Salt Distribution in Cotton Field Soil and Cotton Growth next Year in Northern Xinjiang. Trans. Chin. Soc. Agric. Eng. 2016, 32, 139–148. [Google Scholar]
  31. Xiao, Y.; Yang, P.; Bin, W.; Liu, J.; Guo, T. Analysis of Arid Oasis Areas Soil Nitrogen Accumulation and Winter Irrigation Effect. Water Sav. Irrig. 2018, 02, 71–82. [Google Scholar]
  32. Li, L.; Liu, H.; He, X.; Lin, E.; Yang, G. Winter Irrigation Effects on Soil Moisture, Temperature and Salinity, and on Cotton Growth in Salinized Fields in Northern Xinjiang, China. Sustainability 2020, 12, 7573. [Google Scholar] [CrossRef]
  33. Jing, Y.; Jiannan, M.; Yan, Z.; Jing, C.; Zhuofu, L. Effect of Temperature and Soil Moisture on Winter Wheat Morphogenesis and Overwinter Survival Rate. J. Northeast Agric. Univ. 2010, 41, 9–13. [Google Scholar]
  34. Feng, Y.; He, W.; Rao, M.; Zhong, X. Relationship between Frost Damage and Leaf Temperature with Winter Wheat after j ointing Stage. Acta Agrestia Sin. 2000, 26, 707–712. [Google Scholar]
  35. Tao, R.; Lu, Y.; Yu, Q.; Ma, Q.; Ding, Y.; Qian, J.; Ding, J.; Li, C.; Zhu, X.; Guo, W. Effects of Salt Stress on Physiological Characteristics and Yield of Different Salt-Tolerant Wheat Varieties. Chin. J. Eco-Agric. 2023, 31, 428–437. [Google Scholar]
  36. Wang, C.; Liu, X.; Liu, Q.; Liu, T. Dynamic Simulation Analysis of Soil Hydrothermal Salt of Horqin Meadow Ground in Freezing and Thawing Period Based on SHAW Model. Bull. Soil Water Conserv. 2017, 37, 322–327. [Google Scholar]
Figure 1. Shandong Academy of Agricultural Sciences Yellow River Delta Modern Agricultural Experiment Demonstration Base (created in ArcGIS, developed by Environmental Systems Resource Institute, ArcGIS 10.8).
Agronomy 13 01743 g001
Figure 2. Relationship between soil salinity and conductivity of soil extracts.
Agronomy 13 01743 g002
Figure 3. Meteorological data of the winter wheat growth period in 2019–2021. Tmax and Tmin represent the maximum and minimum air temperature; R represents rainfall; and ET0 represents the reference evapotranspiration.
Agronomy 13 01743 g003
Figure 4. The physical system described by the SHAW model. Ta represents air temperature; u represents wind speed; hr represents relative humidity; St represents solar radiation; i represents precipitation; T represents soil temperature; and θt represents soil moisture.
Agronomy 13 01743 g004
Figure 5. Precipitation from 1965 to 2015 in Dongying City, Shandong Province, China.
Agronomy 13 01743 g005
Figure 6. Simulation and observation of SM (a), soil temperature (b), and soil salinity (c) in different soil layers of winter wheat in 2019–2020.
Agronomy 13 01743 g006
Figure 7. Test of simulated and measured values of SM and soil salinity.
Agronomy 13 01743 g007
Figure 8. Simulated SM dynamics of the 0–80 cm profile in dry, normal, and wet years. Note: WIR represents the winter irrigation water amount.
Agronomy 13 01743 g008
Figure 9. Simulated soil temperature dynamics of the 0–80 cm profile in dry, normal, and wet years. Note: WIR represents winter irrigation; T represents soil temperature.
Agronomy 13 01743 g009
Figure 10. Simulated soil salinity dynamics of the 0–80 cm profile in dry, normal, and wet years. Note: WIR represents winter irrigation.
Agronomy 13 01743 g010aAgronomy 13 01743 g010b
Table 1. Main characteristic parameters of SHAW at an experimental site.
SourceModel ParameterValue
Biophysical characteristic parameters of winter wheatXANGLE0.96
CANALB
TCCRIT/°C
0.20
7
RSTOMO/(s m−1)100
RSTEXP5
PLEAFO/m−200
RLEAF0/(m3 s kg−1)1.5 × 10⁵
RROOT0/(m3 s kg−1)3.0 × 10⁵
Field measurement0–40 cm sand content/%75.61
0–40 cm silt content/%21.55
0–40 cm clay content/%2.84
0–40 cm ρb/(kg m−3)1.457
0–40 cm θs/(m3 m−3)0.42
Empirical formulaKs/(cm h−1)0.958
ψe/m−0.1
b3
Note: Critical leaf water potential (PLEAF0) refers to the leaf water potential when the stomatal resistance is two times the minimum. Ks, ψe, and b are calculated by using Campbell’s empirical equations based on soil structure, bulk density, and particle composition.
Table 2. Optimization for the soil texture and soil hydraulic parameters of the SHAW model in the study area.
Depth (cm)ρb (g cm−3)θs (cm3 cm−3)Ks (cm h−1)bClay (%)Clay (%)Sand (%)
0–101.400.4600.8002.503.3924.4872.13
10–201.440.4400.9003.002.1818.3779.45
20–401.430.4500.7003.302.9421.8075.26
40–601.480.5300.6503.306.7355.4137.86
60–801.460.5300.7003.307.6450.9241.44
Note: ρb is the bulk density; θs is the saturated volumetric moisture content; Ks is the saturated conductivity; and b is Cambell’s pore-size distribution index for the soil layer.
Table 3. Error analysis and linear regression of SM, temperature, and salinity in the test plot.
SMSoil TemperatureSoil Salinity
Depth
(cm)
ME
(cm3 cm−3)
RMSE
(cm3 cm−3)
NSEDepth
(cm)
ME
(°C)
RMSE
(°C)
NSEDepth
(cm)
ME
(g kg−1)
RMSE
(g kg−1)
NSE
00.0380.0640.79300.3330.5680.96600.0050.0090.607
5−0.0100.0300.82150.9561.0850.8645−0.0010.0140.733
100.0090.0200.874101.3111.4930.74310−0.0010.0060.851
150.0150.0370.742150.7781.2310.78815−0.0020.0040.872
200.0240.0380.669201.2001.4000.73820−0.0010.0020.764
300.0080.0160.82930−0.1891.0420.89930−0.0010.0060.801
400.0010.0130.807400.1440.7340.942400.0000.0040.824
500.0110.0130.766500.15 60.6500.949500.0000.0040.914
60−0.0080.0090.774600.1780.6980.93460−0.0010.0030.923
70−0.0090.0170.81170−0.1000.4530.97270−0.0020.0080.695
800.0070.0110.88880−0.2330.3670.97780−0.0030.0080.682
Disclaimer/Publisher’s Note: The statements, opinions and data contained in all publications are solely those of the individual author(s) and contributor(s) and not of MDPI and/or the editor(s). MDPI and/or the editor(s) disclaim responsibility for any injury to people or property resulting from any ideas, methods, instructions or products referred to in the content.