Article

Data-Driven Projections Demonstrate Non-Farming Use of Cropland in Non-Major Grain-Producing Areas: A Case Study of Shaanxi Province, China

1
Shaanxi Key Laboratory of Earth Surface System and Environmental Carrying Capacity, Northwest University, Xi’an 710127, China
2
College of Urban and Environmental Sciences, Northwest University, Xi’an 710127, China
*
Author to whom correspondence should be addressed.
Agronomy 2023, 13(8), 2060; https://doi.org/10.3390/agronomy13082060
Submission received: 20 June 2023 / Revised: 31 July 2023 / Accepted: 1 August 2023 / Published: 4 August 2023
(This article belongs to the Special Issue Sustainable Agriculture — Practices and Implications)

Abstract

:
The non-farming use of cropland has led to food insecurity in China due to drastic land use (LU) changes under the stresses of ecological restoration and urbanization, particularly in non-major grain-producing areas. Questions were raised about spatiotemporal cropland losses/gains and their drivers in these areas in the future for sustainable development of the agriculture sector. However, the answers to these questions have not been well acknowledged. This study, therefore, presents analyses of cropland area change from 1990 to 2018 and from 2018 to 2051 in Shaanxi province based on the Future Land Use Simulation (FLUS) model that follows the integration of the Shared Socioeconomic Pathway 2 and the Representative Concentration Pathway 4.5 (SSP245) within the International Coupled Model Intercomparison Project 6 (CMIP6). The results highlight that ecological restoration and fast-paced urbanization mainly drove the alarming non-farming use of cropland. The per capita cropland area is projected to increase, but the cropland loss will still occur, which potentially causes food insecurity. Thus, food security will be a challenging issue in the near future. The quantitative findings call for careful designs of LU policies, taking into account cropland protection, socio-economic development, and ecological restoration.

1. Introduction

Food insecurity remains an extraordinary challenge in achieving Sustainable Development Goal 2 (SDG2) of “Zero hunger” worldwide [1]. The progress towards this goal has been hindered by considerable pressures of conflicts [2], socio-economic development [3,4], recent pandemic [5,6], extreme climate events [7], and climate change mitigation requirements [8], but are not limited to these. FAO reported that between 702 and 828 million people suffered from hunger in 2021 [1], and around 2.3 billion people (about 29.3 percent of the global population) experienced severe food insecurity. Given this severe situation, cropland protection is in urgent demand. To address this demand, exploring patterns and trends of cropland changes is critically important to identify essential land use (LU) policy reforms.
The non-farming use of cropland is intrinsically linked to food insecurity [9], encompassing both the occupation of cropland for non-farming purposes [10,11] and the cropland abandonment [2,12,13,14], both of which directly impact food production. Despite significant efforts made by the Chinese government, such as implementing the red line of 1.8 billion mu (1 mu ≈ 666.67 m2) of arable land, arable land requisition–compensation balance, and the basic arable land protection regulations, the cropland loss remains a growing concern.
The trend of non-farming activities has been intensified due to the promotion of urbanization and the adjustments in the industrial structure. From 1999 to 2017, the main driving force behind cropland loss in China has constantly evolved. Initially, the loss was primarily attributed to returning farmland to forest or grassland (RFFG) before 2006. Subsequently, urban expansion became the predominant driver [15]. For example, the implementation of the “Grain-for-Green” (GFG) project resulted in the reduction in China’s cropland by nearly 133,333 hectares from 1999 to 2018 [16]. Furthermore, in Yanchuan County, located in the central part of the Loess Plateau, approximately 64.85% of cropland conversion to forestland occurred on slopes lower than 15 degrees [17]. Across all provinces in China, construction land has been continuously expanding between 1996 and 2019, with 80% of arable land loss attributed to construction activities [18]. Additionally, cropland abandonment has significantly contributed to cropland loss, with an average abandoned cropland area of 23,400 km2 per year during 1990–2019 [19]. Given the prevailing circumstances, understanding the changing trends of the non-farming use of cropland becomes crucial for ensuring food security and fostering sustainable societal development.
Amidst these challenges, China is currently confronted with the monumental task of safeguarding its cropland. While the 13 major grain-producing provinces have received substantial attention and implemented well-performed cropland protection policies [20], the situation in non-major grain-producing provinces remains relatively neglected to the best of our knowledge. As China’s grain production barycenter has shifted northward, crossing the Yellow River into a marginal grain-producing area [21], non-major grain-producing areas are now burdened with the responsibility of supporting grain production. However, there exists a lack of comprehensive understanding regarding the utilization of cropland in these areas, both historically and in the near future. In order to alleviate this, it is imperative to thoroughly comprehend how the utilization of cropland is poised to change based on its historical transition patterns. Such an understanding is crucial for formulating effective policies that will contribute to the realization of SDG2. As a result, addressing this issue is of paramount importance, particularly in non-major grain-producing provinces.
This study aims to comprehensively explore patterns, trends, and drivers of non-farming use of cropland in non-major grain-producing provinces, specifically focusing on spatiotemporal cropland losses and gains. Note that the non-farming use of cropland area is defined as the difference between cropland loss area and cropland gain area for a given period. To achieve these objectives, we projected the LU of Shaanxi in 2030 and 2051 using the reliable Future Land Use Simulation model (FLUS) under the “middle of the road” scenario. The International Coupled Model Intercomparison Project (CMIP6) provides a scenario matrix framework of the Shared Socio-Economic Pathways (SSPs) and the Representative Concentration Pathways (RCPs). To demonstrate the temporal changes in the non-farming use of cropland, we integrated SSP2 and RCP4.5 (referred to as SSP245), which represents a business-as-usual pathway with intermediate societal vulnerability and an intermediate forcing level. The spatiotemporal analysis of non-farming use of cropland was performed using both past observed LU data (from 1990 to 2018) and future simulated LU data (from 2018 to 2051). By conducting these analyses, this study aims to enhance our understanding of the non-farming use of cropland and its underlying driving factors, ultimately benefiting cropland protection policies to ensure food security in the future.

2. Materials and Methods

2.1. Study Site

Shaanxi, a non-major grain-producing province, is located in the central region of China (31°42′ N–39°35′ N; 105°29′ E–111°15′ E), specifically in the middle reaches of the YRB (Figure 1). The average annual temperature and precipitation in the province are 13.4 °C and 904.5 mm, respectively, in 2021 [22]. Shaanxi comprises three parts, each characterized by diverse climates, hydrology, geomorphology, demographics, and economic development patterns. The northern part encompasses Yulin and Yan’an cities, situated partially in the Loess Plateau, and is of a temperate sub-arid climate. The central part (Guanzhong Plain) includes Xi’an, Xianyang, Baoji, Weinan, and Tongchuan cities and is of a temperate monsoon climate. The southern part comprises Shangluo, Hanzhong, and Ankang cities covering partial Qinling Mountains and with a subtropical monsoon climate.
Shaanxi province was selected to conduct the experiments due to four compelling reasons. First, it has undergone significant social-economic development, leading to extensive LU changes and substantial losses of cropland [23]. These changes make it an ideal case study to understand the implications of such developments on food security and LU. Second, it has been a subject of authoritative implementation of the GFG project for a long time. The GFG project highly impacted the cropland utilizations due to largely conversions from cropland into forestland and grassland. Third, it is a region of high sensitivity to both human activities and natural environmental changes, making it a valuable area for research purposes [24]. Finally, it plays a crucial dual role in accomplishing Ecological Protection and High-quality Development in the YRB [25] and contributing to “The Belt and Road Initiative” [26]. These roles necessitate a careful balance between food security, environmental protection, and socio-economic development in the province’s future planning and policy implementation.

2.2. Datasets Descriptions and Preprocess

This study reckons on the available LU data for the past and driving factor data for the projections. The LU data at 30 m spatial resolution for different years were obtained from the Institute of Geographic and Natural Resources Research, Chinese Academy of Sciences (CAS) (https://www.resdc.cn/ (accessed on 19 July 2022)). All six LU types (Table 1) were used for the analysts. The driving factor data were used to build and train Artificial Neural Network (ANN) model, part of the FLUS model. These data, collected from reliable organizations, are listed in Table 2 and encompass both socio-economic factors and natural factors for past and future scenarios. The socio-economic factors include population, the Gross Domestic Product (GDP), and road network. The natural factors include terrain conditions (elevation and slope) and climatic and ecological factors (soil quality, temperature, and precipitation). Note that, for future, the GDP and population were projected under SSP245 by Murakami [27] and Chen [28], respectively. The future climate (in 2030 and 2051), including average annual temperature and average annual precipitation, was generated based on CAMS-CSM1-0_ssp245 model under CMIP6. The slope data were generated from Digital Elevation Model (DEM) data using the Slope tools in ArcGIS software. The vector data of road network was converted to raster format using the Conversion tools in ArcGIS software. All data were reprojected to Krasovsky_1940_Albers and then resampled to 300 m using the Projections and Transformations tool in ArcGIS software.
The future population for each city was estimated via a two-step process. First, the population growth rates between 2018 and 2030 and between 2030 and 2051 were, respectively, calculated using the projected population data at provincial level. Second, for each of the given periods, the growth rate at municipal level was then assumed to be the same as the rate observed at provincial level. This assumption allowed for estimating the population for each city in future (Table 3).
r = ( N t + 1 N t ) / N t
where N denotes the total population, and t + 1 and t denote the ending year and starting year for the given period.

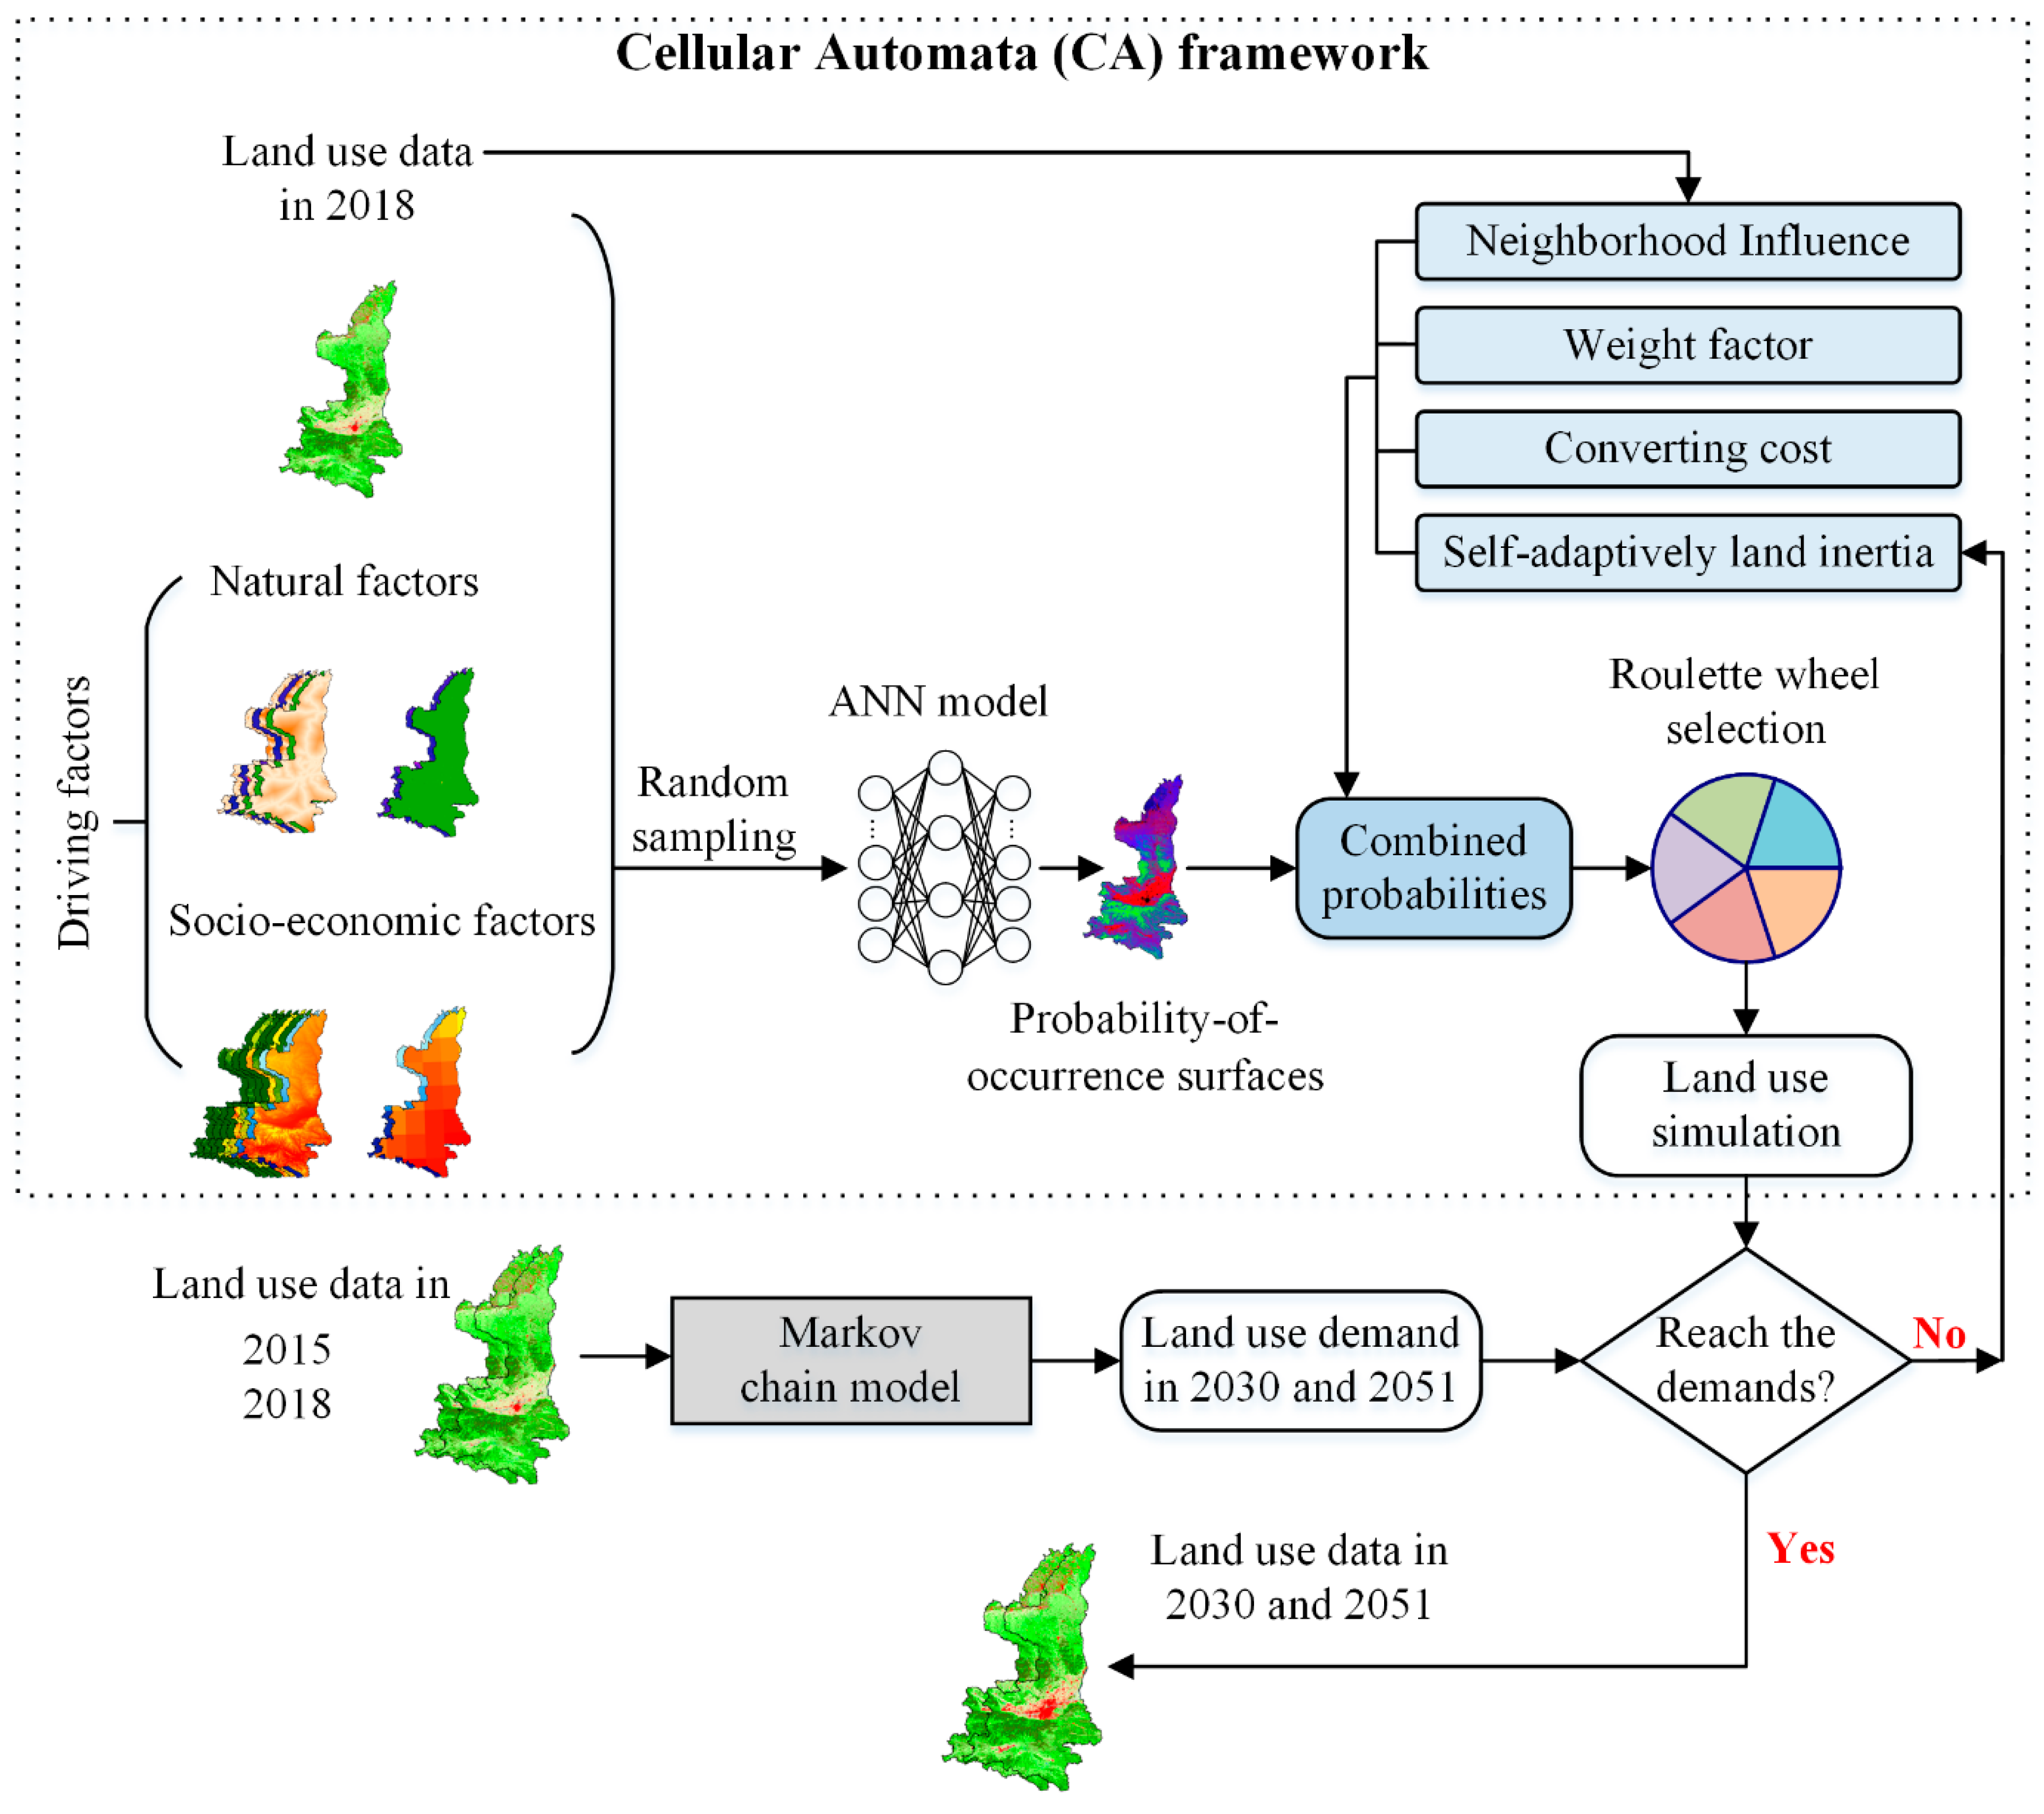
2.3. Land Use Projections

The LU data at 300 m resolution in 2030 and 2051 were projected using the FLUS model implemented via the GeoSOS-FLUS V2.4 software (https://www.geosimulation.cn/FLUS.html (accessed on 19 July 2022)) [29] under the SSP245 scenario (Figure 2). The FLUS model is well established in land change modeling and has been widely applied in various studies [30,31,32,33,34]. It takes into account the effects of human activities, climate, and other natural factors (Table 2) to simulate LU changes. It operates under the Cellular Automata (CA) framework by conducting three steps. (1) The ANN model is employed to predict the probability of occurrence of each LU type using driving factor data and historical LU data. (2) The model integrates neighborhood influence, weight factors, conversion costs, probability-of-occurrence, and self-adaptive land inertia to estimate the combined probabilities of all LU types for each pixel. These combined probabilities are then used to allocate the dominant LU type to each pixel after the CA iteration. (3) The Roulette wheel selection was employed based on the self-adaptively inertia competition mechanism and the combined probability to determine the transformation of different LU types under different effects. To terminate the loop of CA procedure, LU demands for target dates are estimated via the Markov Chain model using historical LU change information. The future LU scenario is generated once the simulation result reaches the LU demand.
The required parameters for the model are set as follows. (1) The sampling rate and the maximum number of the iteration were set as 20 and 1000, respectively. Specifically, for each iteration of CA, 20% of grids were randomly sampled in a balance and employed to train an ANN model to estimate the probabilities of occurrence for all different LU types throughout the entire study site. (2) The number of hidden layers of ANN was set as 12 as the model developers suggested. (3) The conversion cost indicating the conversion difficulty from one LU type to another target type was set as 0 or 1. Note that if one LU type was transited to another one from 2015 to 2018, the conversion cost between these two types was then assumed as 1. Otherwise, it was set as 0. (4) the neighborhood weight factor indicating the LU expansion capacity was determined in a neighborhood consisting of 3 × 3 grids (i.e., pixels) using the LU expansion coefficient, calculated by the following formula [34]. The dates t 1 and t 2 are 2015 and 2018, respectively.
R a t e i = A i t 2 A i t 1 A i t 1 × Δ T × 100 %
R i = { R a t e i , i f   min { R a t e i } 0 R a t e i + | min { R a t e i } | , if   min { R a t e i } < 0
W i = R i max { R i }
where, i denotes a land use type i ; R a t e i denotes the average annual change rate of land use i between t 1 and t 2 ; A i t 1 and A i t 2 denotes the area of land use i in date t 1 and t 2 , respectively; Δ T denotes the time interval between t 1 and t 2 , which equals t 2 t 1 ; R i denotes the average annual growth rate of land use i between date t 1 and t 2 .
The FLUS model was assessed by calculating the agreement between the simulated LU and the observed LU in 2018 based on three indicators. (1) F o M (Figure of Merit) indicator indicates the ratio of the intersection of the observed change and predicted change to the union of the observed change and predicted change [35,36,37]. The F o M ranges from 0 to 1, with 1 indicating a perfect fit between the simulated and observed changes. (2) The K a p p a coefficient is used to calculate the consistency between simulated and observed maps [38]. (Note that more details of estimation of K a p p a coefficient can be found in Ref. [39].) (3) The o v e r a l l   a c c u r a c y from confusion matrix indicates the proportion of LU types correctly assigned in the simulated map [40]. The LU data in 2015 were first used to train the ANN model by simulating LU in 2018. Thirty percent of pixels as random samples from the observed LU in 2018 were used to assess the model accuracy. The parameters were optimized to train the FLUS model until an acceptable accuracy was obtained. The projections of LU in 2030 and 2051 were then conducted.
F o M = B / ( A + B + C + D )
where A is the area of error due to observed change simulated as persistence, B is the area of error due to observed change simulated as change, C is the area of error due to observed change simulated as wrong gaining category, and D is the area of error due to observed persistence simulated as change.
K a p p a = P 0 P e 1 P e
where P 0 is the proportion of land use types correctly assigned, and P e is the expected proportion of land use types correctly classified by chance.
O v e r a l l   A c c u r a c y = i = 1 m A i c / i = 1 m A i
where i denotes the land use type, m denotes the total number of land use types, A i c denotes the area of land use type i correctly predicted, and A i denotes the observed total area of land use type i .

3. Results

3.1. Parameter Determinations and Accuracy Assessment

The LU data in 2015 and 2018 were used to determine the required parameters for the FLUS model. First, based on the assumption, the conversion cost between each LU type was set as 1. Note that we tested the influence of different conversion cost matrices on the simulation results and did not find significant discrepancies for the simulation. Note that this parameter is subject to potential impacts from LU policies, which may influence the simulation results. Future work needs to develop more sophisticated methods to determine the conversion cost parameter, taking into consideration the possible influence of LU policies. Additionally, the neighborhood weight factor for cropland, forestland, grassland, water area, construction land, and unused land was determined as 0.0503, 0.0993, 0.1241, 0.1129, 1, and 0, respectively. Last, the LU demands were estimated (Table 4).
There was a total of 457,310 samples randomly selected across the study site to train the ANN model. A total of 685,962 random samples were used to assess the accuracy of the FLUS model. The F o M of 0.0285, the kappa coefficient of 0.9316, and the o v e r a l l   a c c u r a c y of 95.27% for the simulation were obtained. Although the F o M was relatively lower, existing experiments of LU change modeling generally reported it of 0.1~0.3 (e.g., [41,42,43,44]). This is because of the path-dependence effects leading to inaccurate predictions of land change models [42,45].

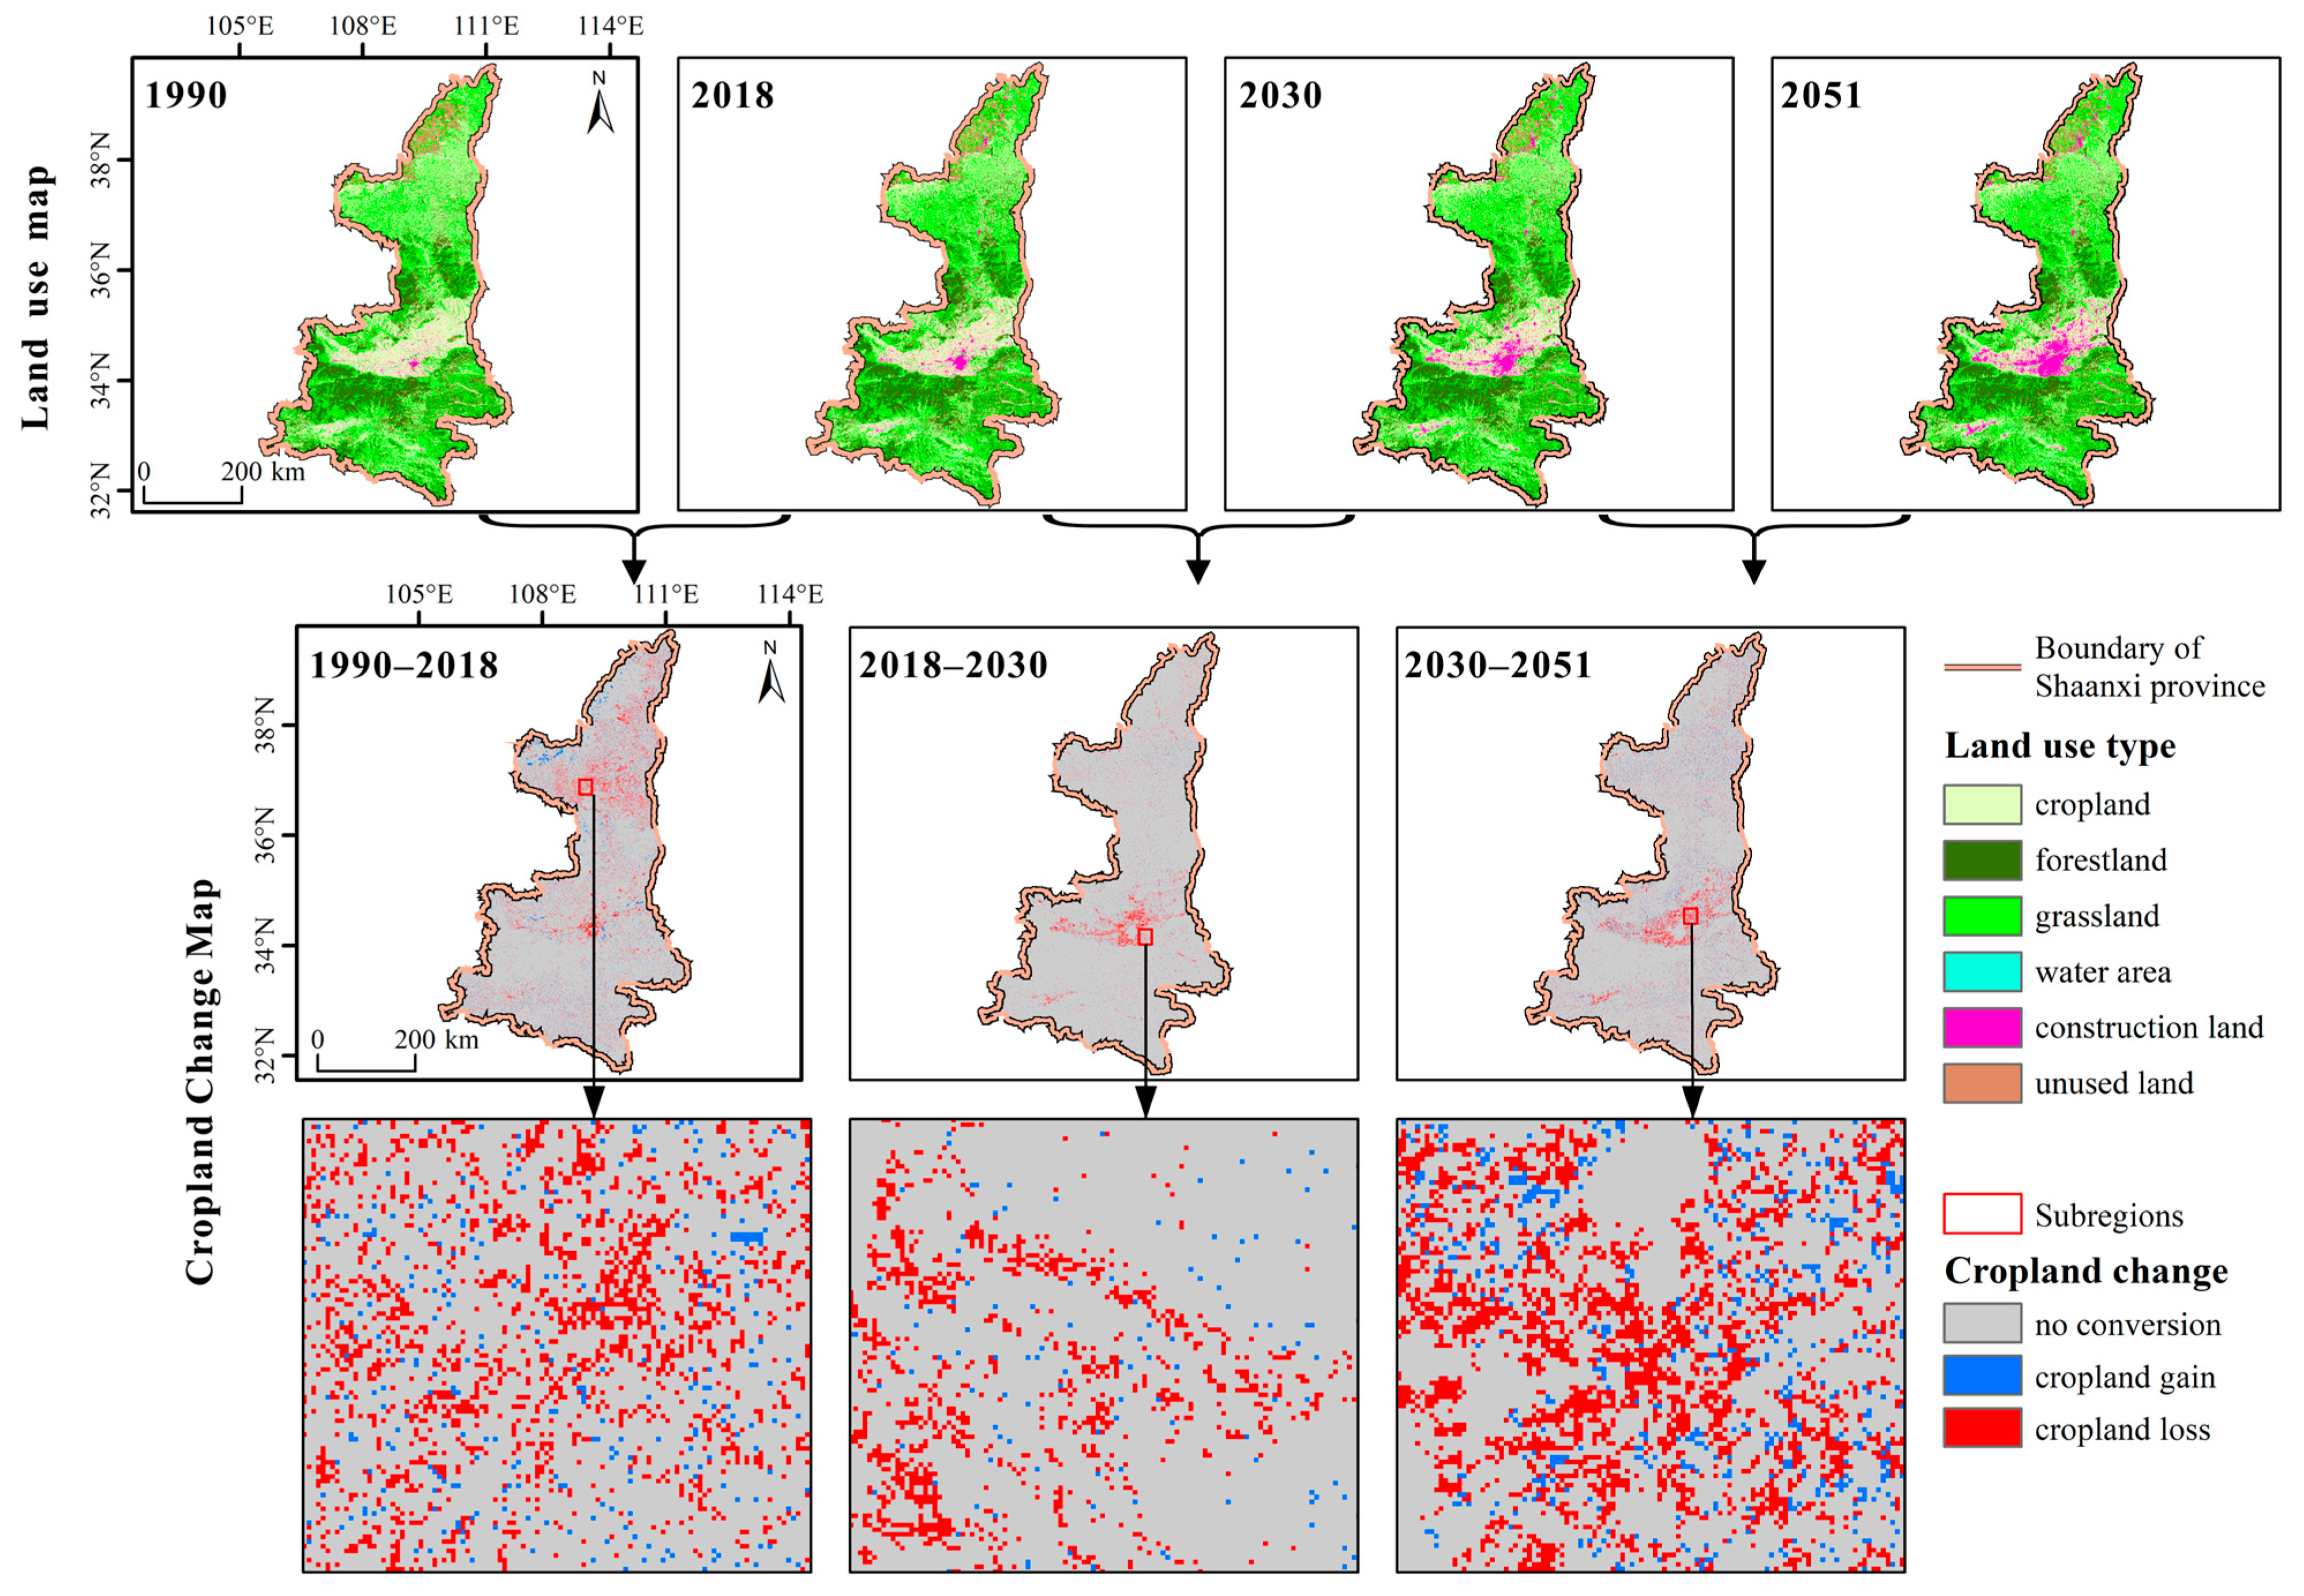
3.2. Land Use Projections and Cropland Changes

The cropland area and change trends from 1990 to 2051 are shown in Figure 3a,b. The results show that the cropland area in 2030 and 2051 were 6233.70 km2 and 63,123.48 km2, respectively. The total area of cropland loss was 4902.48 km2 from 1990 to 2018 and is projected to be continued to lose about 6413.00 km2 till 2051. This is reflected in 11.02% and 15.20% decrease in 2030 and 2051, respectively, relative to the observed area in 1990, and 4.75% and 9.22% decrease, respectively, relative to 2018. The per capita cropland area loss per 10,000 persons was 1.28 km2 from 1990 to 2018 and is projected to decrease to 0.83 km2 and 0.87 km2 in 2030 and 2051, respectively. From 1990 to 2030, the per capita cropland area per 10,000 persons decreased from 2272.89 km2 to 1667.94 km2, and it is projected to slightly increase to 1769.65 km2 in 2051.
The other five LU types are projected to show different trends (Figure 3a). Compared to the observed data in 2018, the projected data in 2030 and 2051, respectively, show (1) water area slightly decreased by 0.45% (7.65 km2) and 1.05% (17.55 km2), (2) forestland area slightly decreased by 0.84% (409.5 km2) and 1.98% (956.88 km2), (3) unused land area drastically decreased by 8.97% (390.60 km2) and 17.35% (755.91 km2), (4) grassland slightly increase by 1.38% (1061.01 km2) and 3.02% (2314.89 km2), and (5) construction land area considerably increased by 57.09% (3032.46 km2) and 109.05% (5792.04 km2).
The projected data depict Shaanxi’s spatiotemporal distributions and area of LU (Figure 4) over the long term (2030 and 2051), with 2018 as the starting point. The observed and simulated data provide spatiotemporally information on cropland losses and gains. From 1990 to 2018, the cropland losses mainly occurred in the northern and central parts of Shaanxi. The southern part shows slight cropland changes. From 2018 to 2051, three parts are projected to continue to experience cropland loss, particularly in the central part.

3.3. Attributions of Cropland Losses and Gains

The interconversion between LU types (Figure 3c and Table 5) shows that cropland losses are larger than the cropland gains both in the past and in the future until 2051. The total cropland loss areas are 10,407 km2, 4777 km2, and 7785 km2, respectively, for the three phases, while the total cropland gain areas are 5505 km2, 1474 km2, and 4675 km2, respectively. From 1990 to 2018, the contributions of forestland, grassland, and construction land to cropland losses and cropland gains were 97.2% and 91.6%, respectively. These proportions are projected to increase to 99.7% and 95.8%, respectively, from 2018 to 2030; and further increase to 99.1% and 97.5%, respectively, from 2030 to 2051.
Regarding the contribution of individual LU types to the non-farming use of cropland, the unused land accounts for 4.9%, 3.7%, and 2.1% of the total cropland gain area in 2018, 2030, and 2051, respectively, whilst the total cropland loss area, it accounts for 0.8%, 0%, and 0.5%, respectively. Taken together, the unused land is projected to diminish the non-farming use of cropland by increasing 193 km2, 54 km2, and 54 km2, respectively, in the three phases. The area of forestland conversion to cropland (750 km2) was lower than the area of cropland conversion to forestland (1920 km2) from 1990 to 2018, leading to a decreasing area of cropland. Contrarily, the forestland area is projected to decrease due that the forestland is considerably converted to cropland (642 km2 and 1555 km2, respectively, in 2030 and 2051) than cropland loss to forestland (501 km2 and 1253 km2, respectively, in 2030 and 2051).

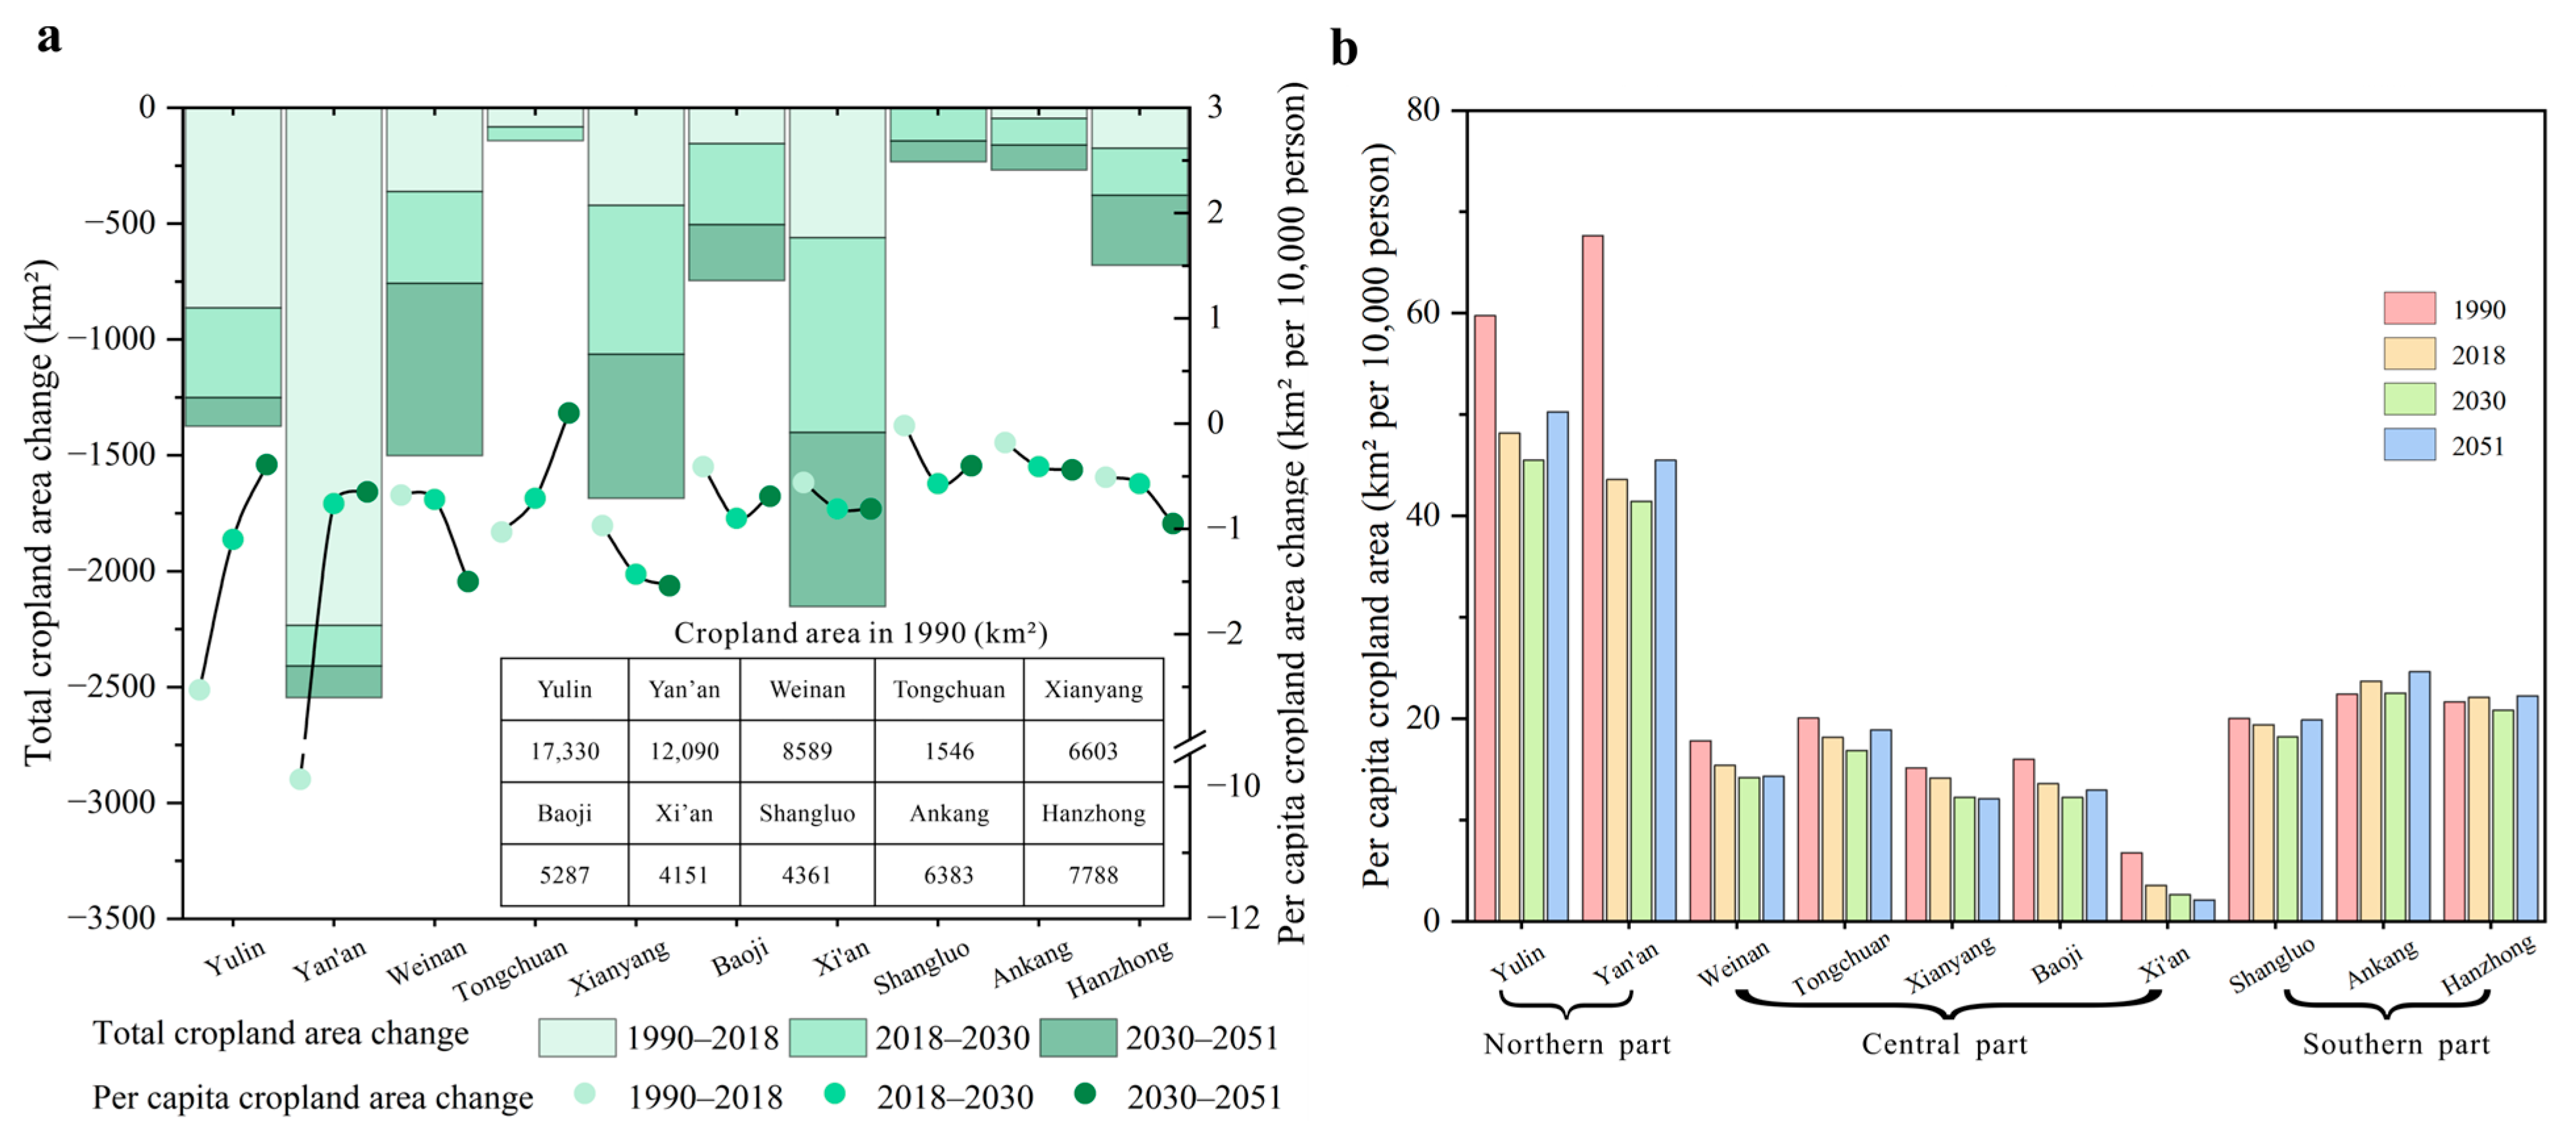
3.4. Non-Farming Use of Cropland at Municipal Level

The total cropland area change (Figure 5a) shows that all cities were losing cropland and are projected to keep losing. From 1990 to 2018, the northern part of Shaanxi accounted for the highest proportion of cropland change area, with 63.12% (3097.89 km2) of the total lost area. The central part and southern part contributed 32.27% (1583.55 km2) and 4.61% (226.35 km2) of the total lost area, respectively. From 2018 to 2051, of the total lost cropland area, the central part is projected to contribute the highest proportion of 72.27% (4637.07 km2). The northern part and the southern part are projected to have relatively close contributions to the non-farming use of cropland, accounting for 12.83% and 14.91%, respectively.
The per capita cropland area change (Figure 5a) shows that the largest area of per capita cropland loss occurred in Yan’an city (9.98 km2 per 10,000 persons) from 1990 to 2018. In the future, Xianyang city is projected to have the highest per capita cropland loss (1.42 km2 and 1.54 km2, respectively) from 2018 to 2030 and from 2030 to 2051, respectively. Further, the per capita cropland area of each city is generally projected to decrease from 1990 to 2030, but there is a difference from 2030 to 2051 (Figure 5b). The per capita cropland area in Xi’an decreased by 47.37%, 60.98%, and 68.43% from 1990 to 2018, 2030, and 2051, respectively. The per capita cropland area in Xianyang decreased by 6.81%, 19.18%, and 20.13%, respectively. Except for these two cities, the per capita cropland area of other cities in 2051 is slightly larger than that in 2030.

4. Discussion

4.1. Divergent Spatiotemporal Variations of Cropland across Three Parts

Shaanxi province experiences severe non-farming use of cropland from the past to the future but in three parts due to different reasons. From 1990 to 2018, significant cropland losses occurred in the northern and central parts. In the northern part, the implementation of the GFG project aimed at ecological restoration [46,47,48,49] led to considerable reductions in cropland areas. This project sought “win-win” gains by restoring ecology and promoting socioeconomic growth [50]. However, it came at the cost of substantial cropland losses. In the central part, the increasing expansion of construction land resulted from rapid urbanization, particularly in the capital city, Xi’an, which significantly contributed to cropland loss. The booming economy of Xi’an drove the transformation of cropland into urban areas. Additionally, the “One Village, One Product (OVOP)” strategy motivated farmers or smallholders to repurpose cropland for non-farming purposes [51]. This further exacerbated the cropland loss situation and posed a severe threat to food security. The regulation of RFFG launched in 1999 also exacerbates the loss situation.
Although undertaking a medium emission path in the future, three parts continue to experience cropland loss (Figure 3), leading to a deteriorated food insecurity situation. The alarming situation is particularly noticeable in the northern part, where the implementation of the RFFG project was expected to emphasize the protection of land ecological function. Unfortunately, cropland loss persists, calling for effective measurements to protect cropland. The Western Development program, which aims to promote large-scale development of urban and rural construction land, contributes to fast-paced urbanization, mainly concentrated in existing highly urbanized areas such as the Guanzhong Plain. These urbanization efforts further contribute to cropland losses in the region, which have significant impacts on the land system in Shaanxi. A systematic analysis of the land system’s status is essential for providing decision making references for future regional policies and ensuring sustainable LU practices. Understanding the mechanisms driving regional LU changes is crucial for implementing more targeted and effective management of land resources. To this end, the spatiotemporal details of historical and future cropland changes reveal the alarming cropland loss situation whilst highlighting the importance of protecting cropland to ensure food security towards SDGs in the agriculture sector.

4.2. Drivers for Non-Farming Use of Cropland

What and how different LU types drive the non-farming use of cropland is complex, both directly by occupying cropland and indirectly by affecting the ecosystem. Transitions between cropland and three other LU types, forestland, grassland, and construction land, mainly drive the non-farming use of cropland, underscoring the significance of the implementations of GFG and RFFG and the fast-paced urbanization as major contributing factors of non-farming use of cropland. To achieve sustainable LU planning, effectively and carefully designed LU policies are needed and strike a balance between agricultural production, ecological restoration, and urban development. Additionally, while the results suggest that unused land can be converted to cropland, its low land quality may be detrimental to food production, as it consists of LU types inappropriate for agricultural cultivation (Table 1). Therefore, the conversions from unused land potentially do not benefit cropland protection. Note that our results could not quantitatively confirm whether the unused land conversions to cropland areas would considerably benefit food production. Further research is needed to quantitatively assess the implications of such conversions on food security and sustainable LU planning.
The influence of forestland changes on cropland use in both the past and future shows opposite trends. One of the possible contributions to the conversion is a human-altered policy from the past. In the past, a vigorous government project aimed at afforestation and forest conservation (e.g., the GFG project) led to the conversion of cropland to forestland. However, in recent times, the provincial government has encouraged farmers to plant fruit trees on mountains, leading to the conversion of forestland to cropland. In implementing cropland protection regulations, policymakers must carefully consider the cost of losing forestland, as they play a crucial role in ensuring long-term food security [52]. Initiatives like the Three North Shelterbelt program and the GFG project are essential steps toward striking a balance between agricultural needs and ecological conservation. To achieve SDG’s targets to halt future potential deforestation in the province, conversions from forestland to cropland should be well managed by the policy makers.
China has established a comprehensive multi-level cropland protection system, including basic arable land protection, arable land requisition–compensation balance, LU control, and land reclamation. The arable land requisition–compensation balance has gradually evolved from solely pursuing quantity balance to encompassing the trinity of quantity, quality, and ecology [53]. Nevertheless, the current amount of cropland in Shaanxi is still insufficient, underscoring the importance of strictly enforcing cropland protection policies. Note that due to the negligible effects of water area on cropland use, we did not analyze the transitions between the water and the cropland. Overall, the observed and simulated non-farming use of cropland requires considerable efforts comprising a suitable balance among LU types.

4.3. Implications of Per Capita Non-Farming Use of Cropland

The non-farming use of cropland area at the municipal level is projected to increase from 1990 to 2051, with the largest contributor shifting from the northern part to the central part of Shaanxi. In the past, the large reduction in cropland in the northern part was attributed to the mineral mining activities that had destroyed arable land [54], as well as the GFG project returning a large amount of cropland to forestland and grassland since the 1980s [55,56,57]. In the future, the area of cropland loss in the central part is projected to increase the most because of the “Strategic Plan for 2050 Space Development in Greater Xi’an area” issued by the government. This plan will drive rapid urbanization at an unprecedented pace. Xi’an city, as the capital city of the province and the ninth national central city, is projected to account for the highest proportion of the total lost area, comprising 24.79% (1590.75 km2) of the total lost area. Conversely, the balance of land demands between re-vegetation and food production in the northern part and southern part will gradually be achieved. Note that urbanization is still having a great influence on cropland changes in these parts. Overall, these results highlight the growing public concern about food security being significantly threatened by urbanization processes and the need to carefully balance trade offs between ecological restoration and food production.
The per capita cropland area change at the provincial and municipal levels confirms the alarming situation of non-farming use of cropland. Not only the decreasing cropland area but also the increasing population are the key determinants of per capita cropland area change. Chen [42] reported that the population of Shaanxi increased by 21.25% (from 32.75 million to 39.71 million) from 1990 to 2030 and then decreased by 10.17% (from 39.71 million to 35.67 million) from 2030 to 2051. The general decrease in per capita cropland area from 1990 to 2030 is mainly due to the increase in population and the large-scale non-farming use of cropland in the next 10 years. With the strict implementation of cultivated land protection policies, the per capita cropland area in 2051 is projected to be slightly larger than that in 2030. This is because the decrease in total cropland area is much less than the decrease in the population. Additionally, the central part holds the smallest per capita cropland area for the past and near future, while the northern part has the largest per capita cropland area (Figure 5b). This is because the central part has less cropland area but the highest population, while the northern part has the largest cropland area but the lowest population.
Notably, the population for each city was estimated using the growth rate at the provincial level. This potentially introduced uncertainties for the results of per capita cropland area change at the municipal level. However, we believe that the results are reliable due to the fact that the patterns of the LU change are consistent with the patterns of non-farming use of cropland at the provincial level. Overall, these results highlight a strong conflict at this stage between the increasing population requiring larger cropland areas and the continuously decreasing cropland area mainly caused by future urbanization. However, under the background of decreasing population in the future, the increase in per capita cropland area may potentially alleviate the severity of food security to some extent. These results call for a careful balance between non-farming development and cultivated land protection to ensure food security and sustainable LU in Shaanxi province.

4.4. Limitations and Future Work

Despite the valuable insights gained from our study, there are some limitations that need to be acknowledged. First, while some studies on future LU simulation adopt multiple SSP to explore all possible LU situations at a global or national scale [58], our work only focused on the SSP245 scenario for simulation. The reason for this choice is twofold. (1) SSP245 does not deviate significantly from historical patterns [33], aligning well with our objective of understanding the non-farming use of cropland influenced by current LU policies integrated with socio-economic development and climate mitigation requirements. (2) In line with the existing literature, we selected only suitable scenarios that align with our research aims [59,60] for future LU simulation. Future work needs to explore the impact of different climate conditions on the non-farming use of cropland by considering a broader range of achievable LU scenarios.
Additionally, our study sheds light on potential food security challenges in Shaanxi due to the large-scale decrease in cropland area in the future, which did not consider the impacts of trade between different provinces. This could potentially introduce uncertainties to the overall food security situation. However, our focus was primarily on understanding the spatiotemporal variation of non-farming use of cropland at the regional level. For a comprehensive assessment of national food security, we are currently conducting a broader analysis at the national scale. Future work needs to incorporate all different aspects that impact food security, such as yield simulation, inter-provincial trade, climate changes, policy implications, etc.

5. Conclusions

This paper explored the future non-farming use of cropland in 2030 and 2050 in the non-major grain-producing province (Shaanxi), utilizing LU projections based on the FLUS model under the SSP245 scenario. The gross cropland area changes and per capita cropland area changes at both the provincial and municipal levels were explored. The results reveal the complex and intense influences of different LU types on the non-farming use of cropland area changes in different parts of Shaanxi. Forestland, grassland, and construction land considerably contribute to large cropland losses, while cropland gains are comparatively lower, leading to a marked increase in non-farming use of cropland area. The encouragement of fruit tree planting on mountains results in potential future conversions of forestland to cropland, highlighting the need for careful policy considerations. Additionally, unused land contributes to increased cropland area, but the potential for lower land quality poses a concern for food production. Four intense contradictions between cropland and other LU types emerge, involving ecological restorations, fast-paced urbanizations, cropland protection potentially leading to deforestation, and the conversion of unused land to cropland with limited food production benefits. The results at the municipal level confirm these contradictions. Notably, the per capita cropland area at both levels is projected to increase due to the decrease in future population. Overall, this study highlights worrying non-farming use of cropland in Shaanxi, which could potentially lead to food insecurity. Urgent efforts are needed to strike a balance between cropland protection, re-vegetation implementation, and a fast-paced urbanization process to address these challenges effectively.

Author Contributions

Conceptualization, methodology, investigation, and writing—original draft preparation, L.L. and P.S.; writing—review and editing, P.S.; investigation and original draft preparation, M.Z. and Y.W.; supervision, P.S.; funding acquisition, P.S., L.L. and P.S. contribute equally to this work and should be regarded as co-first authors. All authors have read and agreed to the published version of the manuscript.

Funding

This work was supported by the Natural Science Basic Research Program of Shaanxi Province of China [grant number 2020JQ-592]; and partial funding was provided by the National Natural Science Foundation of China [grant number 41901344].

Data Availability Statement

Not applicable.

Acknowledgments

We appreciate the editor and anonymous reviewers for their constructive comments and suggestions that greatly improved the manuscript. Additionally, we thank the Resource and Environment Science and Data Center and Institute of Geographic Sciences and Natural Resources Research of China for providing National Land Use Data.

Conflicts of Interest

The authors declare that they have no known competing financial interest or personal relationship that could have appeared to influence the work reported in this paper.

References

  1. FAO; IFAD; UNICEF; WFP; WHO. In Brief to the State of Food Security and Nutrition in the World 2022; FAO: Rome, Italy, 2022. [Google Scholar] [CrossRef]
  2. Olsen, V.M.; Fensholt, R.; Olofsson, P.; Bonifacio, R.; Butsic, V.; Druce, D.; Ray, D.; Prishchepov, A.V. The Impact of Conflict-Driven Cropland Abandonment on Food Insecurity in South Sudan Revealed Using Satellite Remote Sensing. Nat. Food 2021, 2, 990–996. [Google Scholar] [CrossRef] [PubMed]
  3. Fayet, C.M.J.; Reilly, K.H.; Van Ham, C.; Verburg, P.H. What Is the Future of Abandoned Agricultural Lands? A Systematic Review of Alternative Trajectories in Europe. Land Use Policy 2022, 112, 105833. [Google Scholar] [CrossRef]
  4. Schleifer, P.; Sun, Y. Reviewing the Impact of Sustainability Certification on Food Security in Developing Countries. Glob. Food Secur. 2020, 24, 100337. [Google Scholar] [CrossRef]
  5. Béné, C. Resilience of Local Food Systems and Links to Food Security—A Review of Some Important Concepts in the Context of COVID-19 and Other Shocks. Food Sec. 2020, 12, 805–822. [Google Scholar] [CrossRef] [PubMed]
  6. Lin, X.; Qi, L.; Pan, H.; Sharp, B. COVID-19 Pandemic, Technological Progress and Food Security Based on a Dynamic CGE Model. Sustainability 2022, 14, 1842. [Google Scholar] [CrossRef]
  7. Chavez, E.; Conway, G.; Ghil, M.; Sadler, M. An End-to-End Assessment of Extreme Weather Impacts on Food Security. Nat. Clim. Chang. 2015, 5, 997–1001. [Google Scholar] [CrossRef] [Green Version]
  8. Fujimori, S.; Hasegawa, T.; Krey, V.; Riahi, K.; Bertram, C.; Bodirsky, B.L.; Bosetti, V.; Callen, J.; Després, J.; Doelman, J.; et al. A Multi-Model Assessment of Food Security Implications of Climate Change Mitigation. Nat. Sustain. 2019, 2, 386–396. [Google Scholar] [CrossRef] [Green Version]
  9. Tu, Y.; Chen, B.; Yu, L.; Xin, Q.; Gong, P.; Xu, B. How Does Urban Expansion Interact with Cropland Loss? A Comparison of 14 Chinese Cities from 1980 to 2015. Landsc. Ecol. 2021, 36, 243–263. [Google Scholar] [CrossRef]
  10. Andrade, J.F.; Cassman, K.G.; Rattalino Edreira, J.I.; Agus, F.; Bala, A.; Deng, N.; Grassini, P. Impact of Urbanization Trends on Production of Key Staple Crops. Ambio 2022, 51, 1158–1167. [Google Scholar] [CrossRef]
  11. Maimaiti, B.; Chen, S.; Kasimu, A.; Simayi, Z.; Aierken, N. Urban Spatial Expansion and Its Impacts on Ecosystem Service Value of Typical Oasis Cities around Tarim Basin, Northwest China. Int. J. Appl. Earth Observ. Geoinform. 2021, 104, 102554. [Google Scholar] [CrossRef]
  12. Prishchepov, A.V.; Schierhorn, F.; Löw, F. Unraveling the Diversity of Trajectories and Drivers of Global Agricultural Land Abandonment. Land 2021, 10, 97. [Google Scholar] [CrossRef]
  13. Yin, H.; Brandão, A.; Buchner, J.; Helmers, D.; Iuliano, B.G.; Kimambo, N.E.; Lewińska, K.E.; Razenkova, E.; Rizayeva, A.; Rogova, N.; et al. Monitoring Cropland Abandonment with Landsat Time Series. Remote Sens. Environ. 2020, 246, 111873. [Google Scholar] [CrossRef]
  14. Yu, Q.; Hu, Q.; van Vliet, J.; Verburg, P.H.; Wu, W. GlobeLand30 Shows Little Cropland Area Loss but Greater Fragmentation in China. Int. J. Appl. Earth Obs. Geoinf. 2018, 66, 37–45. [Google Scholar] [CrossRef]
  15. Zhou, Y.; Li, X.; Liu, Y. Cultivated Land Protection and Rational Use in China. Land Use Policy 2021, 106, 105454. [Google Scholar] [CrossRef]
  16. Zhang, X.; Deng, Y.; Hou, M.; Yao, S. Response of Land Use Change to the Grain for Green Program and Its Driving Forces in the Loess Hilly-Gully Region. Land 2021, 10, 194. [Google Scholar] [CrossRef]
  17. Wang, J.; Liu, Y.; Liu, Z. Spatio-Temporal Patterns of Cropland Conversion in Response to the “Grain for Green Project” in China’s Loess Hilly Region of Yanchuan County. Remote Sens. 2013, 5, 5642–5661. [Google Scholar] [CrossRef] [Green Version]
  18. Zhou, Y.; Zhong, Z.; Cheng, G. Cultivated Land Loss and Construction Land Expansion in China: Evidence from National Land Surveys in 1996, 2009 and 2019. Land Use Policy 2023, 125, 106496. [Google Scholar] [CrossRef]
  19. Guo, A.; Yue, W.; Yang, J.; Xue, B.; Xiao, W.; Li, M.; He, T.; Zhang, M.; Jin, X.; Zhou, Q. Cropland Abandonment in China: Patterns, Drivers, and Implications for Food Security. J. Clean. Prod. 2023, 418, 138154. [Google Scholar] [CrossRef]
  20. He, J.; Liu, Y.; Yu, Y.; Tang, W.; Xiang, W.; Liu, D. A Counterfactual Scenario Simulation Approach for Assessing the Impact of Farmland Preservation Policies on Urban Sprawl and Food Security in a Major Grain-Producing Area of China. Appl. Geogr. 2013, 37, 127–138. [Google Scholar] [CrossRef]
  21. Wang, J.; Zhang, Z.; Liu, Y. Spatial Shifts in Grain Production Increases in China and Implications for Food Security. Land Use Policy 2018, 74, 204–213. [Google Scholar] [CrossRef]
  22. Shaanxi Provincial Bureau Statistics. Shaanxi Statistical Yearbook. Available online: http://tjj.shaanxi.gov.cn/upload/2021/zk/indexce.htm (accessed on 19 July 2022).
  23. Wei, X.; Ye, Y.; Li, B.; Chen, T. Reconstructing Cropland Change since 1650 AD in Shaanxi Province, Central China. Quat. Int. 2022. [Google Scholar] [CrossRef]
  24. Ma, C.H.; Ren, Z.Y. Prospective of Man-Earth Relationship of Land-Use in Shaanxi Loess Tableland Region. Arid Zone Res. 2015, 32, 1240–1246. [Google Scholar]
  25. State Council of China. Outline on Ecological Protection and High-Quality Development of Yellow River Basin. Available online: https://english.www.gov.cn/policies/latestreleases/202110/09/content_WS6160cd13c6d0df57f98e15b3.html (accessed on 19 July 2022).
  26. State Council of China. Action Plan on the Belt and Road Initiative. Available online: https://english.www.gov.cn/archive/publications/2015/03/30/content_281475080249035.htm (accessed on 19 July 2022).
  27. Murakami, D.; Yoshida, T.; Yamagata, Y. Gridded GDP Projections Compatible With the Five SSPs (Shared Socioeconomic Pathways). Front. Built Environ. 2021, 7, 760306. [Google Scholar] [CrossRef]
  28. Chen, Y.; Guo, F.; Wang, J.; Cai, W.; Wang, C.; Wang, K. Provincial and Gridded Population Projection for China under Shared Socioeconomic Pathways from 2010 to 2100. Sci. Data 2020, 7, 83. [Google Scholar] [CrossRef] [Green Version]
  29. Liu, X.; Liang, X.; Li, X.; Xu, X.; Ou, J.; Chen, Y.; Li, S.; Wang, S.; Pei, F. A Future Land Use Simulation Model (FLUS) for Simulating Multiple Land Use Scenarios by Coupling Human and Natural Effects. Landsc. Urban Plan. 2017, 168, 94–116. [Google Scholar] [CrossRef]
  30. Hurtt, G.C.; Chini, L.; Sahajpal, R.; Frolking, S.; Bodirsky, B.L.; Calvin, K.; Doelman, J.C.; Fisk, J.; Fujimori, S.; Klein Goldewijk, K.; et al. Harmonization of Global Land Use Change and Management for the Period 850–2100 (LUH2) for CMIP6. Geosci. Model Dev. 2020, 13, 5425–5464. [Google Scholar] [CrossRef]
  31. Kai, J.; Shengnan, W.; Lixia, G.; Qing, Z. Spatial Distribution Simulation and Trend Analysis of Land Use in Sanya Based on GeoSOS-FLUS Model. Urban Reg. Plan. 2020, 5, 97. [Google Scholar] [CrossRef]
  32. Luo, M.; Hu, G.; Chen, G.; Liu, X.; Hou, H.; Li, X. 1 km Land Use/Land Cover Change of China under Comprehensive Socioeconomic and Climate Scenarios for 2020–2100. Sci. Data 2022, 9, 110. [Google Scholar] [CrossRef]
  33. Popp, A.; Calvin, K.; Fujimori, S.; Havlik, P.; Humpenöder, F.; Stehfest, E.; Bodirsky, B.L.; Dietrich, J.P.; Doelmann, J.C.; Gusti, M.; et al. Land-Use Futures in the Shared Socio-Economic Pathways. Global Environ. Chang. 2017, 42, 331–345. [Google Scholar] [CrossRef] [Green Version]
  34. Wang, Y.; Shen, J.; Yan, W.; Chen, C. Backcasting Approach with Multi-Scenario Simulation for Assessing Effects of Land Use Policy Using GeoSOS-FLUS Software. MethodsX 2019, 6, 1384–1397. [Google Scholar] [CrossRef]
  35. Klug, W.; Grippa, G.; Tassone, C.; Graziani, G.; Pierce, D. Evaluation of Long Range Atmospheric Transport Models Using Environmental Radioactivity Data from the Chernobyl Accident (the ATMES Report); EUR (Luxembourg); Elsevier Applied Science: Amsterdam, The Netherlands, 1992. [Google Scholar]
  36. Perica, S.; Foufoula-Georgiou, E. Model for Multiscale Disaggregation of Spatial Rainfall Based on Coupling Meteorological and Scaling Descriptions. J. Geophys. Res. Atmos. 1996, 101, 26347–26361. [Google Scholar] [CrossRef]
  37. Pontius, R.G.; Boersma, W.; Castella, J.-C.; Clarke, K.; de Nijs, T.; Dietzel, C.; Duan, Z.; Fotsing, E.; Goldstein, N.; Kok, K.; et al. Comparing the Input, Output, and Validation Maps for Several Models of Land Change. Ann. Reg. Sci. 2008, 42, 11–37. [Google Scholar] [CrossRef] [Green Version]
  38. Cohen, J. A Coefficient of Agreement for Nominal Scales. Educ. Psychol. Meas. 1960, 20, 37–46. [Google Scholar] [CrossRef]
  39. Foody, G.M. Explaining the Unsuitability of the Kappa Coefficient in the Assessment and Comparison of the Accuracy of Thematic Maps Obtained by Image Classification. Remote Sens. Environ. 2020, 239, 111630. [Google Scholar] [CrossRef]
  40. Congalton, R.G. A Review of Assessing the Accuracy of Classifications of Remotely Sensed Data. Remote Sens. Environ. 1991, 37, 35–46. [Google Scholar] [CrossRef]
  41. Chen, G.; Li, X.; Liu, X. Global Land Projection Based on Plant Functional Types with a 1-km Resolution under Socio-Climatic Scenarios. Sci. Data 2022, 9, 125. [Google Scholar] [CrossRef]
  42. Chen, G.; Li, X.; Liu, X.; Chen, Y.; Liang, X.; Leng, J.; Xu, X.; Liao, W.; Qiu, Y.; Wu, Q.; et al. Global Projections of Future Urban Land Expansion under Shared Socioeconomic Pathways. Nat. Commun. 2020, 11, 537. [Google Scholar] [CrossRef] [Green Version]
  43. Chen, Y.; Li, X.; Liu, X.; Ai, B. Modeling Urban Land-Use Dynamics in a Fast Developing City Using the Modified Logistic Cellular Automaton with a Patch-Based Simulation Strategy. Int. J. Geogr. Inf. Sci. 2014, 28, 234–255. [Google Scholar] [CrossRef]
  44. Li, X.; Chen, G.; Liu, X.; Liang, X.; Wang, S.; Chen, Y.; Pei, F.; Xu, X. A New Global Land-Use and Land-Cover Change Product at a 1-km Resolution for 2010 to 2100 Based on Human–Environment Interactions. Ann. Am. Assoc. Geogr. 2017, 107, 1040–1059. [Google Scholar] [CrossRef]
  45. Brown, D.G.; Page, S.; Riolo, R.; Zellner, M.; Rand, W. Path Dependence and the Validation of Agent-based Spatial Models of Land Use. Int. J. Geogr. Inf. Sci. 2005, 19, 153–174. [Google Scholar] [CrossRef] [Green Version]
  46. Cao, S.; Chen, L.; Yu, X. Impact of China’s Grain for Green Project on the Landscape of Vulnerable Arid and Semi-Arid Agricultural Regions: A Case Study in Northern Shaanxi Province. J. Appl. Ecol. 2009, 46, 536–543. [Google Scholar] [CrossRef]
  47. Cao, S.; Xu, C.; Chen, L.; Wang, X. Attitudes of Farmers in China’s Northern Shaanxi Province towards the Land-Use Changes Required under the Grain for Green Project, and Implications for the Project’s Success. Land Use Policy 2009, 26, 1182–1194. [Google Scholar] [CrossRef]
  48. Chen, H.; Marter-Kenyon, J.; López-Carr, D.; Liang, X. Land Cover and Landscape Changes in Shaanxi Province during China’s Grain for Green Program (2000–2010). Environ. Monit. Assess. 2015, 187, 644. [Google Scholar] [CrossRef] [PubMed]
  49. Dang, X.; Gao, S.; Tao, R.; Liu, G.; Xia, Z.; Fan, L.; Bi, W. Do Environmental Conservation Programs Contribute to Sustainable Livelihoods? Evidence from China’s Grain-for-Green Program in Northern Shaanxi Province. Sci. Total Environ. 2020, 719, 137436. [Google Scholar] [CrossRef]
  50. Wu, X.; Wang, S.; Fu, B.; Feng, X.; Chen, Y. Socio-Ecological Changes on the Loess Plateau of China after Grain to Green Program. Sci. Total Environ. 2019, 678, 565–573. [Google Scholar] [CrossRef]
  51. Yang, Q.; Zhang, D. The Influence of Agricultural Industrial Policy on Non-Grain Production of Cultivated Land: A Case Study of the “One Village, One Product” Strategy Implemented in Guanzhong Plain of China. Land Use Policy 2021, 108, 105579. [Google Scholar] [CrossRef]
  52. The State of the World’s Forests. Forest Pathways for Green Recovery and Building Inclusive, Resilient and Sustainable Economies; FAO: Rome, Italy, 2022; ISBN 978-92-5-135984-6. [Google Scholar]
  53. Wang, N.; Hao, J.; Zhang, L.; Duan, W.; Shi, Y.; Zhang, J.; Wusimanjiang, P. Basic Farmland Protection System in China: Changes, Conflicts and Prospects. Agronomy 2023, 13, 651. [Google Scholar] [CrossRef]
  54. Yu, X.; Mu, C.; Zhang, D. Assessment of Land Reclamation Benefits in Mining Areas Using Fuzzy Comprehensive Evaluation. Sustainability 2020, 12, 2015. [Google Scholar] [CrossRef] [Green Version]
  55. Jia, X.; Fu, B.; Feng, X.; Hou, G.; Liu, Y.; Wang, X. The Tradeoff and Synergy between Ecosystem Services in the Grain-for-Green Areas in Northern Shaanxi, China. Ecol. Indicat. 2014, 43, 103–113. [Google Scholar] [CrossRef]
  56. Wang, T.; Gong, Z. Evaluation and Analysis of Water Conservation Function of Ecosystem in Shaanxi Province in China Based on “Grain for Green” Projects. Environ. Sci. Pollut. Res. 2022, 29, 83878–83896. [Google Scholar] [CrossRef]
  57. Zhou, H.; Van Rompaey, A.; Wang, J. Detecting the Impact of the “Grain for Green” Program on the Mean Annual Vegetation Cover in the Shaanxi Province, China Using SPOT-VGT NDVI Data. Land Use Policy 2009, 26, 954–960. [Google Scholar] [CrossRef]
  58. Guilpart, N.; Iizumi, T.; Makowski, D. Data-Driven Projections Suggest Large Opportunities to Improve Europe’s Soybean Self-Sufficiency under Climate Change. Nat. Food 2022, 3, 255–265. [Google Scholar] [CrossRef] [PubMed]
  59. Le Page, Y.; West, T.O.; Link, R.; Patel, P. Downscaling Land Use and Land Cover from the Global Change Assessment Model for Coupling with Earth System Models. Geosci. Model Dev. 2016, 9, 3055–3069. [Google Scholar] [CrossRef] [Green Version]
  60. Popp, A.; Humpenöder, F.; Weindl, I.; Bodirsky, B.L.; Bonsch, M.; Lotze-Campen, H.; Müller, C.; Biewald, A.; Rolinski, S.; Stevanovic, M.; et al. Land-Use Protection for Climate Change Mitigation. Nat. Clim. Chang. 2014, 4, 1095–1098. [Google Scholar] [CrossRef]
Figure 1. Study site.
Agronomy 13 02060 g001
Figure 2. The flowchart of land use projections based on FLUS model.
Agronomy 13 02060 g002
Figure 3. Cropland change based on past observed land use data and simulated future land use data from 1990 to 2051. (a) presents the change in each land use type; (b) presents provincial total and per capita non-farming use of cropland and the per capita share of cropland area; (c) presents the cropland losses and gains from different land use types.
Agronomy 13 02060 g003
Figure 4. Land use maps and cropland change maps. The upper row presents the historical and future land use maps. The middle row presents cropland change map in three phases, from 1990 to 2018, from 2018 to 2030, and from 2030 to 2051, respectively. The lower row presents the spatial details of cropland changes for three phases in different sub-regions.
Agronomy 13 02060 g004
Figure 5. Municipal comparisons of non-farming cropland area in three parts of Shaanxi between phase I, phase II, and phase III. The negative values represent the reduction in area. (a) presents the total and the per capita non-farming use of cropland of each city; (b) presents the per capita cropland area of each city in 1990, 2018, 2030 and 2051.
Agronomy 13 02060 g005
Table 1. Land use classification system for National Land Use Data (NLUD). The metadata of NLUD gives descriptions of each land use type.
Land Use TypeDescriptions
CroplandPaddy field, Dry land
ForestlandForest land, Shrub land, Open Forest land, Other woodlands
GrasslandGrassland with high coverage, Moderate grass coverage, Low coverage grass
Water areaGraff, Lakes, Reservoir and ponds, Glacial permanent snow, Tidal marsh, Beaches
Construction landCities and towns, Rural settlements, Construction land for industry and transportation
Unused landSand, Gobi, Saline–alkali land, Marsh land, Bare land, Bare rock, Gravel Fields
Table 2. Benchmark data as driving factors for the land use projections.
FactorsCategoryDatasetsYearResolutionProjectionData Source
Socio-
economic factors
Human influenceGDP20151000 mKrasovsky_
1940_
Albers
Institute of Geographic and
Natural Resources Research,
Chinese Academy of Sciences
(CAS) (https://www.resdc.cn/
(accessed on 19 July 2022))
Population20151000 m
Roads2018---GCS_WGS_
1984
Geospatial Data Cloud (http://www.gscloud.cn/
(accessed on 19 July 2022))
Railways---
Waterways---
Future human influenceGDP2030, 205010 km--Figshare [27]
Population2030, 20501000 mGCS_WGS_
1984
Springer Nature [28]
Natural factorsTerrainDEM200390 mGCS_WGS_
1984
Geospatial Data Cloud (http://www.gscloud.cn/
(accessed on 19 July 2022))
Slope200390 mKrasovsky_
1940_Albers
derived from DEM
SoilNutrient availability20085′GCS_WGS_
1984
Harmonized World Soil Database
v1.2 (http://webarchive.iiasa.ac.at/Research/LUC/External-World-soil-database/HTML/SoilQuality.html?sb=10
(accessed on 19 July 2022))
Oxygen availability to roots
Excess salts
Workability
ClimateAverage annual
temperature
20151000 mClarke_1866_
Albers
CAS (https://www.resdc.cn/
(accessed on 19 July 2022))
Average annual
precipitation
20151000 m
FutureclimateAverage annual
temperature
2030, 2050100 kmGCS_WGS_
1984
World Climate Research Programme
(https://esgf-node.llnl.gov/search/cmip6/
(accessed on 19 July 2022))
Average annual
precipitation
Table 3. The population data in 1990 and 2018 and the estimated population in 2030 and 2051 for each city in Shaanxi province (×10,000).
YearYulinYan’anWeinanTongchuanXianyangBaojiXi’anShangluoAnkangHanzhong
City
1990289.89178.69481.3276.96434.64330.27608.89231.11284.34358.91
2018341.78225.94532.7780.37436.61377.11000.37238.02266.89343.61
2030353.12233.44550.4583.04451.10389.611033.57245.92275.75355.01
2051317.20209.69494.4574.59405.20349.98928.41220.90247.69318.89
Table 4. Land use demands (km2) estimated via the Markov Chain model in the FLUS model.
YearCroplandForestlandGrasslandWater AreaConstruction LandUnused Land
201869,535.1748,231.6376,689.271664.915311.534356.45
203066,234.5147,822.5877,749.021672.568344.443965.85
205163,123.4847,274.7579,003.81682.4611,103.933600.54
Table 5. Relative importance of different types of land use transitions for cropland losses and gains estimated using the observed land use data and simulated future land use data for three phases (phase I from 1990 to 2018, phase II from 2018 to 2030, and phase III from 2030 to 2051). The values within the parentheses represent the proportions of each transited type from the gross area of non-farming use of cropland and gross cropland gain/loss.
1990–20182018–20302030–2051
Non-farming use of cropland area (km²)490233033110
Forestland1170(23.9%)−141(−4.3%)−302(−9.7%)
Grassland1950(39.8%)784(23.7%)962 (30.9%)
Water area12(0.2%)5 (0.2%)12(0.4%)
Construction land1963(40.0%)2709 (82.0%)2492(80.1%)
Unused land−193(−3.9%)−54(−1.6%)−54 (−1.7%)
Cropland gain (km2)550514744675
Forestland750(13.6%) 642(43.6%) 155 (33.3%)
Grassland4102(74.5%)415(28.2%)1910(40.9%)
Water area195(3.5%)8 (0.5%) 18 (0.4%)
Construction land186(3.4%)355(24.1%)1096 (23.4%)
Unused land272(4.9%)54 (3.7%)96 (2.1%)
Cropland loss (km2)10,40747777785
Forestland1920(18.4%)501 (10.5%)1253 (16.1%)
Grassland6052(58.2%)1199 (25.1%)2872 (36.9%)
Water area207(2.0%)13(0.3%)30 (0.4%)
Construction land2149(20.6%)3064 (64.1%)3588 (46.1%)
Unused land79(0.8%) ---42 (0.5%)
Disclaimer/Publisher’s Note: The statements, opinions and data contained in all publications are solely those of the individual author(s) and contributor(s) and not of MDPI and/or the editor(s). MDPI and/or the editor(s) disclaim responsibility for any injury to people or property resulting from any ideas, methods, instructions or products referred to in the content.

