Abstract
The removal of nitrogen from water is a consequence of the synergistic action of plant uptake, sediment sorption, and microbial decomposition. However, there is a lack of long-term experimental studies on the effects of each component in the process of nitrogen removal. In this study, we investigated the effect of sediment, plants, and microorganisms on nitrogen removal by setting up three systems: water–sterilized sediment, water–sediment, and water–sediment–plant. The nitrogen removal effect followed the following rank order of effectiveness: the “water–sediment–plant” system > the “water–sediment” system > the “water–sterilized sediment” system. The ditch sediment had a strong enrichment effect for nitrogen. In addition, the migration rate of nitrogen in the sediment with different depths was different. The ammonia-nitrogen migration rate in the sediment showed an increasing trend with time and depth. The nitrate-nitrogen migration process in the sediment showed a trend of enrichment toward the middle layer (15.0–25.0 cm). Aquatic plants and microorganisms can promote the removal of nitrogen in water, with the average purification rates of 13.92% and 19.92%, respectively.
1. Introduction
Water pollution is a very important issue []. With the improvement in public awareness and the strengthening in supervision, point source pollution is gradually being brought under comprehensive control, and an increasing number of people are beginning to pay attention to agricultural non-point source pollution, especially the pollution caused by the heavy use of chemical fertilizers and pesticides []. The process of agricultural non-point source pollution, starting from the formation of farmlands to the output of water bodies outside the farmland, can be partitioned into two phases: first, the production of pollutants—such as N, P, and others—in fields with surface runoff, subsurface seepage, and other processes into a final drainage ditch; second, the output of pollutants to external water bodies through the branch and dry-level farmland drainage ditches. The application of ecological engineering techniques to design or modify agricultural drainage ditches can effectively control agricultural non-point source pollution [,]. Furthermore, due to the low construction cost of eco-drainage ditches, they are more suitable for promotion and application in rural areas [,,].
Nitrogen in agricultural drainage ditches exists in both organic and inorganic forms; however, the mechanism of nitrogen removal is complex because of the various subdivisions of inorganic nitrogen and the conversion process of the redox reactions between different forms []. The transformation of nitrogen in ditches occurs mainly through two balance processes: the balance of deposition and mineralization with organic nitrogen [] and the balance of sediment sorption, plant uptake, microbial absorption, nitrification, and denitrification in the form of ammonia and nitrate-nitrogen [,,,]. The removal of nitrogen from water is the result of the synergistic action of plant uptake, sediment adsorption, and microbial decomposition. Plants can directly absorb nitrate-nitrogen (NO3−-N) and ammonia-nitrogen (NH4+-N) from water. In addition, plant roots can provide an alternating aerobic and anaerobic environment for nitrification and denitrification, which promotes the conversion and removal of nitrogen and its assimilation into plants. Ditch sediments can directly remove NO3−-N and NH4+-N from water bodies through adsorption, while various nitrifying and denitrifying bacteria grow in ditch sediments, which can effectively remove the nitrogen from water via the synergistic effect of physical adsorption and biochemical action [].
The current understanding of the mechanism of nitrogen transport and transformation by plants is mainly achieved through in situ monitoring experiments, such as the screening and planting of aquatic plants [,]. Studies on microbial purification mechanisms are mostly conducted through nitrification and denitrification mechanisms, as well as the addition of microbial strains. Zhao et al. [] showed that ammonia-oxidizing microorganisms, particularly ammonia-oxidizing archaea (AOA) are suitable for the treatment of nitrogen-containing wastewater. Studies on the purification mechanism of sediments have been conducted through adsorption and desorption experiments, as well as in situ monitoring []. In addition, Chen et al. [] found that the combination of submerged plants and microorganisms had a positive effect on total nitrogen (TN) and total phosphorus (TP) removal in marginally polluted water, with removal rates of 70% and 97.3%, respectively. The planting of reeds considerably reduces TN, total dissolved nitrogen, and NH4+-N in the sediment, as well as promotes the mineralization, nitrification, and denitrification of organic nitrogen in the sediment []. In summary, there are many studies on the mechanisms of nitrogen purification by sediment, plants, and microorganisms in drainage ditches, but they are limited by experimental conditions and methods, and only few long-term studies are available.
There are many experimental studies and model simulations on the purification effects, processes, and degradation mechanisms of pollutants in agricultural drains [,,]; for example, Kroger [,] found that a 400 m long and 7 m wide agricultural ditch could retain 57% of soluble inorganic nitrogen. Fan et al. [] developed a nitrogen balance model by analyzing the changes in TN, NH4+-N, and NO3−-N content in the whole system, providing a new idea for enhanced nitrogen removal from drainage ditch systems. Zhan et al. [] used the HYDRUS-1D model to simulate the removal of NH4+-N from soil based on an indoor soil-column leaching experiment. Huang et al. [] used the SWAT model and a modified SWAT-N2O coupler to investigate the effects of climatic factors on the transport and transformation of non-point source nitrogen and N2O emissions in an agricultural drain ditch. However, most studies were conducted to evaluate the overall purification effects of drains as a system or model simulation.
Studies in this area have deepened the understanding of the processes and effects of nitrogen purification in agricultural drainage ditches. However, due to the challenge of distinguishing the individual contributions of plants, sediments, and microorganisms in the removal of nitrogen within drainage ditch systems, their specific roles in the nitrogen removal process have not been adequately investigated [,], and there is a lack of long-term experimental studies on the effects of each component on nitrogen removal. Therefore, to address this research gap, this study conducted a meso-scale experimental study of microorganisms, sediments, and plants so as to understand their effect on the nitrogen migration and transformation process for about seven months by setting up three systems: the “water–sterilized sediment”, “water–sediment”, and “water–sediment–plant” columns. We hypothesized that (1) the purification effects of plants, sediments, and microorganisms on nitrogen in water can be superimposed, and (2) that ditch sediment has a strong enrichment effect for nitrogen. In addition, the migration rate of nitrogen in sediments with different depths was different. This study has important research significance for understanding the mechanism and influencing factors of nitrogen removal in farmland drainage ditches, and it can provide a theoretical reference and experimental basis for alleviating agricultural non-point source pollution.
2. Materials and Methods
2.1. Experimental Design
The experimental equipment was set up at the Water Conservation and Agroecology Experimental Base of the Yellow River Institute of Water Resources Science (35°18′ N, 113°53′ E). The area has a temperate continental monsoon climate, with an altitude of 73.2 m, an average annual temperature of 14.1 °C, a frost-free period of 210 d, 2398.8 h of sunshine, and an average annual precipitation of 582.0 mm (with June to October accounting for 70.0–80.0% of the annual rainfall).
Three Plexiglas columns (with a 60 cm inner diameter and 100 cm height) were used for the experiment, with the lower end closed and the upper end open. A 90 cm ranged transparent ruler was pasted on the glass column. The depths of the sediment and overlying water in the column were 40 and 50 cm, respectively. Sediments were collected from the experimental base. The water used for the experiment came from the groundwater in the well at the base, and the depth of the overlying water varied between 10 and 50 cm during the experiment (water was replenished when the water level dropped to 10 cm due to evaporation). The nitrogen index of the injection groundwater during the experimental period is shown in Table 1. The particle composition of the sediments in the study was 7.74% (<2.00 μm), 60.59% (2.00–50.00 μm), and 31.67% (2.00–50.00 μm). The initial nitrogen index of the sediment after one week of introducing the water is shown in Table 2. The WS column represents a “water–sediment” system, and the WSP column a “water–sediment–plant” system with one well-developed reed that was planted on the substrate. In order to study the purification effect of soil microorganisms on nitrogen, it is necessary to set a blank control and to sterilize the sediment so as to compare the purification effect of the sterilized sediment and the sediment on nitrogen. The WSS column represents a “water–sterilized sediment” system, where the sediment is autoclaved before filling (Figure 1). At the same time, to prevent the influence of external weather (rain, snow, and other precipitation), as well as the entry of mosquitoes and external nitrogen sources to the water body, the columns were placed in bird-proof cages and covered with rainproof covers during precipitation.

Table 1.
The nitrogen concentration of the injection groundwater during the experimental period.
Table 2.
Initial nitrogen concentration in the sediment.
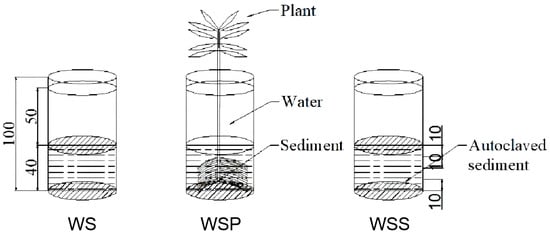
Figure 1.
Schematic diagram of the experimental equipment (unit: cm).
2.2. Experimental and Analytical Methods
This experiment was conducted from 7 April 2016 to 21 November 2016. Water samples (30 mL) were collected every two days in the early stage of the experiment and once a week in the later stage, with an additional measurement after each recharge. This was achieved using an injection syringe to aspirate the overlying water at half depth while also measuring the pH and temperature of the overlying water. Sediment samples were taken once a month at 0.0–10.0 cm, 10.0–20.0 cm, 20.0–30.0 cm, and 30.0–40.0 cm. Before measurement, the water samples were shaken in the sampling bottle, and then filtered in a conical bottle through the phosphorus-free filter paper. The soil samples were ground through a sieve, where each soil sample weighed 3 g, and were placed in a 100 mL conical flask. Then, 60.0 mL (at 2.0 mol/L) of KCl solution (at a 1:5 soil:KCl solution ratio) was added. The samples were then sealed with a sealing film and oscillated on a constant temperature oscillator for 1 h. Next, the samples were removed and filtered, and the filtrate for then taken for measurement. The NH4-N and NO3−-N contents in the water and sediment were directly measured by a Smartchem 140 automatic chemical analyzer (Alliance Corp., Paris, France). A HYDROLAB HL7 multi-parameter water quality analyzer (Hach, Loveland, CO, USA) was used to measure water parameters (temperature, pH, electrical conductivity, etc.).
As shown in Figure 1, when the other experimental conditions were the same, the difference in nitrogen concentrations in column WSP and column WS can be attributed to role of plants in the nitrogen migration and transformation process. As the NH4+-N in water was assimilated by plants, adsorbed by sediment, and degraded by microorganisms (in addition to being easily converted into ammonia gas and volatilized under alkaline conditions), the NO3−-N in the WS and WSP water columns was chosen as the study object. Similarly, when the other experimental conditions were the same, the difference in nitrogen concentration in the WSS and WS columns could be attributed to the role of microorganisms in the process of nitrogen transport and transformation. As the NO3−-N was both a generator of nitrification and a reactant of denitrification, the change in NO3−-N concentration could better reflect the role of microorganisms. To quantify the process of nitrogen migration and transformation, the plant purification rate Wp (WSP column vs. WS column) and the microbial purification rate Wm (WS column vs. WSS column) were calculated separately. The calculation equations are shown in Equations (1) and (2):
where Wp is the plant purification rate (%), Wm is the microbial purification rate (%), and Cws, Cwsp, and Cwss are the nitrogen concentrations in the water column in mg/L.
In addition, to quantify and analyze the degree of nitrogen transport and transformation between the sediments at different depths, the sediment migration rate Ma–b from depth a to depth b was calculated by Equation (3):
where M5–15 is the sediment migration rate from a depth of 5.0 cm to 15.0 cm (%), and C0–10 and C10–20 are the nitrogen contents (g/kg) in the sediment at 0–10.0 cm and 10.0–20.0 cm, respectively.
M5–15 = (C10–20 − C0–10)/C10–20 × 100%
The particle compositions of the sediment were 9.58% <2.00 μm, 60.48% 2.00–50.00 μm, and 29.94% >50.00 μm.
2.3. Statistical Analyses
SPSS 24.0 (IBM, New York, NY, USA) and Origin 2021 9.8.0.200 (Origin Lab, Northampton, MA, USA) software were used for data processing, graphing, and tabulation. Each data point was summarized by calculating the average value and standard deviation (S.D). A one-way analysis of variance (ANOVA) was conducted to compare the effects of the “water–sediment”, “water–sediment–plant”, and “water–sterilized sediment” systems on nitrogen concentration within the same time period. A significance level of p = 0.05 was set. And Origin 2021 was used for the linear regression analysis of the relevant data.
3. Results
3.1. Variation of pH, Electrical Conductivity, and Temperature in the Overlying Water
The variations in pH during the experiment were as follows: the WS column at 7.03–9.64 with a mean value of 8.98; the WSP column at 7.96–9.75 with a mean value of 9.00; and the WSS column at 7.94–9.82 with a mean value of 9.14. The variations in water temperature during the experiment are shown in Figure 2b. The range and trend of temperature changes in the WS–WSS columns were essentially the same during the experiment, showing an initial rise (7 April–21 June), followed by a fluctuation (21 June–29 August), and then a decline (29 August–30 November). The variation in temperature was in the range of 8.02–31.8 °C, with an average of 21.8 °C. The highest and lowest temperatures were recorded on 29 July and 30 November, respectively. The variation in electrical conductivity is shown in Figure 2c: the WS column at 1661.0–3820.0 mS/m with a mean value of 2501.8 mS/m; the WSP column at 1564.0–3750.0 mS/m with a mean value of 2397.2 mS/m; and the WSS column at 1620.0–3450.0 mS/m with a mean value of 2357.5 mS/m. During the experiment, the electrical conductivity showed an increasing trend (7 April–18 October), gradually reaching a peak, and then decreasing (18 October–16 December).
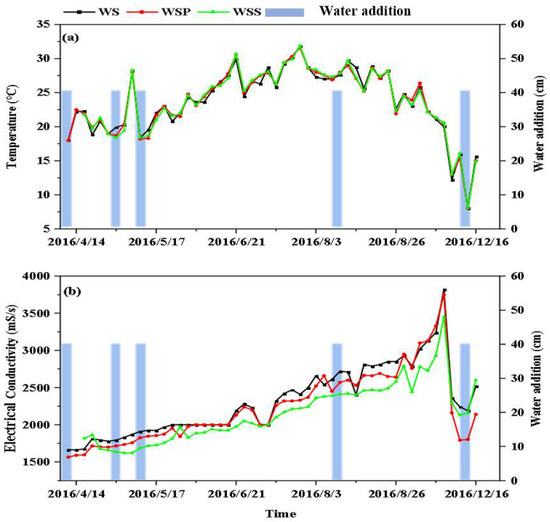
Figure 2.
Variation in water quality parameters in the WS–WSS columns: (a) temperature; (b) electrical conductivity.
3.2. Variation in Nitrogen in the Overlying Water
The purification process of the NO3−-N in the WS, WSP, and WSS columns is shown in Figure 3. After groundwater was injected into the three experimental columns on 7 April, the concentration of NO3−-N in the WS to WSS columns rose rapidly to reach the first peak of 18.60, 23.09, and 19.73 mg/L on 14 April, indicating the release of NO3−-N from the sediment to the overlying water through the interstitial water. The highest concentration of NO3−-N in the WSP column may be because, during the reed transplanting process, the reed root sediment contained more organic matter, which was released into the overlying water through the interstitial water. The content of NO3−-N in the WS, WSP, and WSS columns showed a similar trend, with the concentration increasing after groundwater injection on 7 April followed by a decline. A similar trend was shown on 19 April, 5 May, 26 May, 12 June, 21 June, and 3 November following the recharge of groundwater. Similarly, disturbances caused by the collection of sediment samples on 3 June, 22 July, 15 August, 14 September, and 18 October also resulted in a transient increase and decrease in the concentration of nitrate nitrogen in the water.
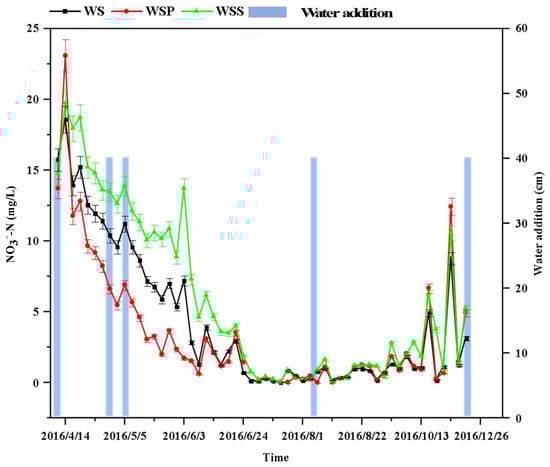
Figure 3.
Variation in the nitrate nitrogen content over time in the three systems (WS, WSP, and WSS).
The concentration of NO3−-N in the WS–WSS columns decreased from 14 April to 1 July, and followed the following rank order: WSP column (“water–sediment–plant” system) < WS column (“water–sediment” system) < WSS column (“water–sterilized sediment” system). The nitrate nitrogen content in the WS, WSP, and WSS systems all showed a decreasing trend at the initial stage, and the rate and range of the nitrate nitrogen content decrease in the WSP system was the largest (Figure 3).
From 1 July to 13 October, the NO3−-N concentrations fluctuated at a low level with a range of ≤2.79 mg/L and a mean concentration of 1.45 mg/L. The two peaks of the NO3−-N concentration in the water column occurred on 18 October and 3 November, respectively. The peak in the water column occurred on 18 October, which may be attributed to the leakage of the soil from the sampler during soil extraction, which increased the NO3−-N content in all three water columns. On 3 November, the increase in NO3−-N concentration may be attributed to the weakened plant absorption capacity and the weakened microbial activity.
Figure 4 shows that the variation in the NH4+-N in the WS–WSS columns was similar to that in the NO3−-N. Both the water column recharge and sediment sampling increased the concentration of ammonia in the water column, with a fluctuating upward trend from 7 April to 1 July; however, it remained stable with small changes from 1 July to 13 October, but then a fluctuating upward trend occurred from 18 October to 21 November. The average NH4+-N concentration in the columns during the entire experimental period followed the following rank order: WSP column (0.32 mg/L) < WS column (0.44 mg/L) < WSS column (0.47 mg/L). A one-way ANOVA analysis showed that there was no significant difference in the variation in NH4+-N concentration in the water columns from the WS–WSS systems, while there was a significant difference in the variation in NO3−-N in the columns, as shown in Table 3. This is because the presence of the water column above the sediment resulted in an anaerobic environment that facilitated denitrification, which is the main reaction process by which soil microorganisms reduce NO3−-N to nitrogen gas or nitrogen oxide. The reaction substrate is NO3−-N, which disrupts the NO3−-N balance between water and soil, as well as causes considerable differences in the NO3−-N processes in the water column [].
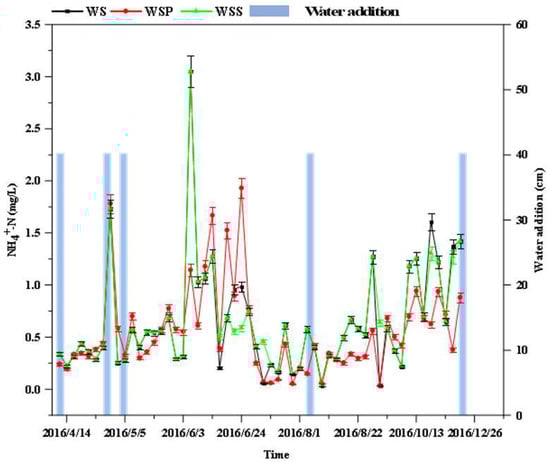
Figure 4.
Variation in ammonium nitrogen content over time in the three systems (WS, WSP, and WSS).
Table 3.
One-way ANOVA of the variation in NH4+-N concentration in the WS–WSS columns (F: variance ratio; P: significance level).
3.3. Variation in Nitrogen in the Sediment
To investigate specifically the sedimentation and absorption of the nitrogen by the ditch sediment, excluding the role of microorganisms and plants, the WSS column (water–sterilized sediment) was chosen for study. The changes in the NH4+-N content and the migration rate in the sediment at different depths are shown in Figure 5. The NH4+-N content in the sediment at different depths showed an increasing trend during the operation period. In May and June, as the temperature increased, the adsorption of the sediment was enhanced and the NH4+-N content increased rapidly, indicating the characteristics of a “rapid adsorption” of NH4+-N in the sediment and the maintenance of a “Slight rise” state from August to October. With increasing depth, the NH4+-N content showed an increasing trend, with an average of 9.0 × 10⁻³, 1.0 × 10⁻², 1.1 × 10⁻², and 1.3 × 10⁻² g/kg at 0.0–10.0 cm, 10.0–20.0 cm, 20.0–30.0 cm, and 30.0–40.0 cm, respectively. There was a significant difference in the migration rate of the NH4+-N at different depths (p = 0.00 < 0.05), indicating a trend of enrichment in the deeper layers. This observation was consistent with the mean values of the migration rate of NH4+-N, which were 16.20%, 11.54%, and 10.97%. Further, the migration rate of NH4+-N in the sediment at different depths showed a decreasing trend in the later stage of the experiment, indicating that the migration process gradually weakened.
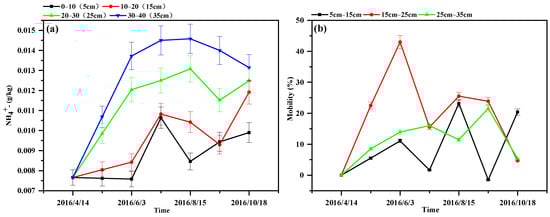
Figure 5.
Variation in the NH4+-N content and migration rate in sediments at different depths in the WSS column: (a) NH4+-N content; (b) migration rate of the NH4+-N content.
The variation, as the depth increased, in the NO3−-N content in the sediment at different depths (Figure 6) deviated from the trend observed for the NH4+-N content, with the highest NO3−-N content being represented at a 20.0–30.0 cm depth. The migration rate of the NO3−-N in the substrate at different depths showed the following rank order: 15.0–25.0 cm > 5.0–15.0 cm > 25.0–35.0 cm. The migration rate at a 25.0–35.0 cm depth was negative, indicating that the NO3−-N in the “water–sterilized sediment” system tended to be enriched in the middle substrate, which is consistent with the highest NO3−-N content in the substrate at a 20.0–30.0 cm depth.
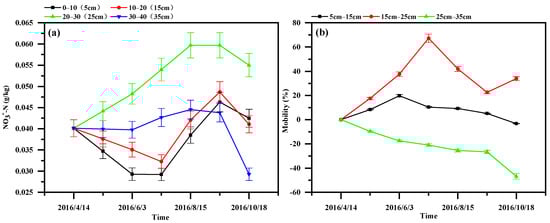
Figure 6.
Variation in the NO3−-N content and migration rate in sediments at different depths in the WSS column: (a) NO3−-N content; (b) migration rate of the NO3−-N content.
4. Discussion
4.1. Effect of Temperature and pH on the Nitrogen Content in Water and Sediment
Investigations have demonstrated that microbial activity and the rate of organic matter degradation are influenced by pH levels, with both excessively high and low values exhibiting an impact. Furthermore, different microorganisms display varying degrees of adaptability to different pH conditions. For nitrifying bacteria, the optimal pH range for nitrification reactions is typically observed between 7.0 and 8.0, while denitrifying bacteria (which play a key role in the denitrification processes), exhibit optimal performance at pH levels ranging from 7.0 to 7.5 []. In this study, the pH values of the water samples analyzed fell within this specified range, with all measurements indicating a neutral to weakly alkaline nature. Such conditions are highly conducive to the efficient removal of nitrogen from water.
From April to June, the nitrogen removal rate increased rapidly with increases in temperature. This was because appropriate high temperatures facilitate the microbial nitrification and denitrification reactions for removing nitrogen from the ditches []. From June to August, the purification rate of plants and microorganisms showed an oscillating trend with increases in temperature, which was due to the sensitivity of plants and microbial growth to external factors [,]. At high temperatures, the growth of plants, as well as the nitrification and denitrification of microorganisms were inhibited to a certain extent, thereby decreasing the nitrogen removal rate; moreover, the microbial population may reach a peak at this time due to the nutrients in the substrate that may not be sufficient to sustain the growth of the population, leading to a dynamic equilibrium [,].
In October, the purification rate of the plants and substrate was close to or equal to zero, and after October, the overall purification rate of the plants and microorganisms was less than zero. The desorption of the sediment, decomposition of the roots of aquatic plants, and the degradation of branches and leaves by microorganisms lead to the release of nitrogen into the water, causing secondary pollution []. Reduction in temperature had a significant impact on nitrogen removal efficiency. Tan et al. [] also reported that temperature has a significant impact on soil nitrification; the higher the soil temperature within a certain range, the faster the soil nitrification rate—reaching a maximum at 30 °C (after which soil nitrification is inhibited). However, the optimum temperature for nitrate and nitrogen removal in this experiment was approximately 22 °C, which was lower than that for soil nitrification, probably because of the differences in the optimum temperature for soil nitrification in different properties and regions [,], or due to the controlled conditions in this experiment.
4.2. Effect of Plants on Nitrogen Migration and Transformation
The purification rate of NO3−-N by plants showed an overall trend of first increasing, then fluctuating around zero, and finally becoming less than zero (Figure 7). This corresponded to the growth process of the reeds, which began to appear in April. This was then followed by rapid stem growth, and then finally entering into the aging stage. Throughout the experiment period, the average purification rate of the plants was 13.92%, indicating that the aquatic plants overall promoted the removal of nitrogen in the water. However, the influence of plants on nitrogen transport and transformation processes does not solely depend on the plants themselves, but also on the soil microbial community. This is because plants can alter the structural and functional properties of microbes, as well as promote their growth when grown in a new environment []. For example, during the peak period of plant growth, the plant N uptake rate is negatively correlated with the microbial biomass N content []. This may be but one reason for the fluctuation of the nitrogen migration rate nearing zero from June and October.
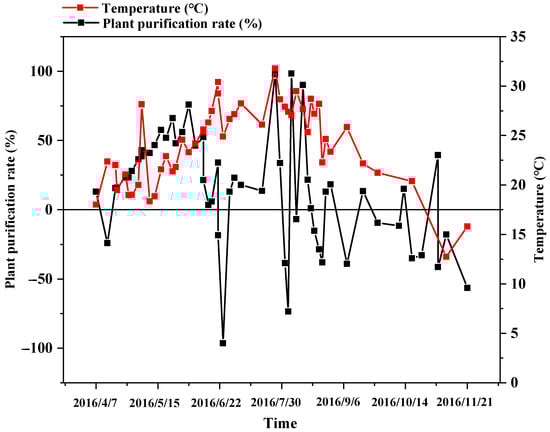
Figure 7.
Variations in the plant purification rate.
4.3. Effect of Microorganisms on Nitrogen Migration and Transformation
The main mechanism of pollutant degradation in ditches is the decomposition and transformation of nutrients by microorganisms []. As shown in Figure 8, the purification rate of microorganisms had a similar trend to that of plants with an increasing trend from April to July, which was related to the biochemical effect of microorganisms that were exacerbated by the increase in temperature. After October, the purification rate of microorganisms was less than or equal to zero, showing the same pattern as the purification rate of the plants. This was related to the decrease in temperature, the weakening of microbial activity, and the desorption of the substrate. The purification rate curve of microorganisms showed a sharp fluctuation in July and September because the microorganisms introduced in the process of groundwater replenishing gradually multiplied, resulting in a gradual increase in microorganisms in the WSS column and a reduction in the difference with the WS column. Simultaneously, the biochemical action of the microorganisms was also sensitive to the impact of the external factors [,], and this was inhibited under inappropriate conditions []. Throughout the experiment period, the average purification rate of the microorganisms was 19.92%, indicating that the presence of microorganisms had a facilitating effect on the purification process of nitrogen in water.
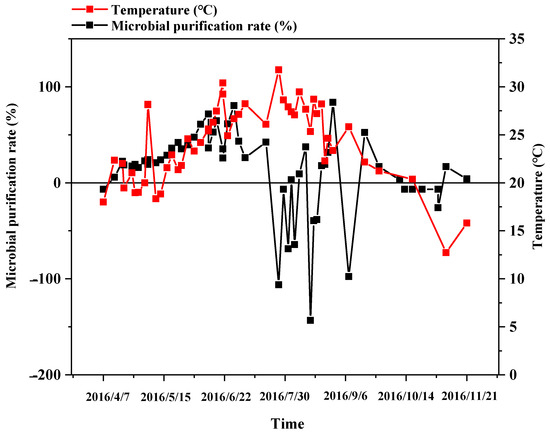
Figure 8.
Variations in the microbial purification rate.
Ammonia nitrogen gradually deposits during the adsorption of ditch sediment [,], thus migrating toward deeper layers with time. In addition, it is difficult to avoid the introduction of microorganisms during the groundwater injection process, and different depths of sediment have varying denitrification potentials []. Nitrate nitrogen gradually accumulates in the bottom layer, and there may be strong denitrification at a depth of 20–30 cm in the sediment. This results in the consumption of nitrate nitrogen [], and the indication of a tendency to accumulate in the middle layer. Due to limitations in experimental conditions, this study was unable to obtain the distribution of nitrate, oxygen, and microorganisms in the pore water of the sediment, and thus it cannot specifically discuss the distribution of the vertical denitrification potential of the sediment in this experiment. We will take this into consideration in future research.
5. Conclusions
In this paper, we analyzed the migration and transformation of nitrogen in drainage ditches by setting up three systems—namely “water–sediment”, “water–sediment–plant”, and “water–sterilized sediment”—as well as investigated the role of sediment, plants, and microorganisms in the process of nitrogen purification. This experiment generated the following conclusions.
- (1)
- In general, the rank order of nitrogen removal in the systems was as follows: the “water–sediment–plant” system > the “water–sediment” system > the “water–sterilized sediment” system.
- (2)
- The ditch sediment had a strong enrichment effect for nitrogen. The NH4+-N migration rate in the sediment showed an increasing trend with time and depth. The NO3−-N migration process in the sediment showed a trend of enrichment toward the middle layer (15.0–25.0 cm).
- (3)
- Compared with the WSS system, both the WSP and WS systems showed a better nitrogen purification effect. Aquatic plants and microorganisms can promote the purification of nitrogen in water, with average purification rates of 13.92% and 19.92%, respectively.
Author Contributions
Conceptualization, C.G. and Q.L.; methodology, Q.Z. (Qisen Zhang) and C.G.; investigation, Y.H. and Q.Z. (Qiang Zhao); resources, J.W.; data curation, Q.Z. (Qisen Zhang) and J.W.; writing—original draft preparation, C.G. and J.W.; writing—review and editing, Q.L. and J.W.; funding acquisition, J.W. and C.G. All authors have read and agreed to the published version of the manuscript.
Funding
This research was funded by the National Natural Science Foundation of China (grant no. 52209067), the National Key Research and Development Program of China (grant no. 2021YFD1900804), the Central Guidance on Local Science and Technology Development Fund (grant no. ZYYD2023A10), the Opening Foundation of Key Laboratory of Ecological Protection and Restoration of the Yellow River Basin in Henan Province (grant no. LYBEPR202205), and the Project funded by China Postdoctoral Science Foundation (grant no. 2022M712467).
Data Availability Statement
The datasets generated during and/or analyzed during the current study are not publicly available due to the confidential nature of the data but are available from the corresponding authors upon reasonable request.
Conflicts of Interest
The authors declare no conflict of interest.
References
- Maguire, T.J.; Spencer, C.; Grgicak-Mannion, A.; Drouillard, K.; Mayer, B.; Mundle, S.O.C. Distinguishing point and non-point sources of dissolved nutrients, metals, and legacy contaminants in the Detroit River. Sci. Total Environ. 2019, 681, 1–8. [Google Scholar] [CrossRef] [PubMed]
- Rissman, A.R.; Carpenter, S.R. Progress on Nonpoint Pollution: Barriers & Opportunities. Daedalus 2015, 144, 35–47. [Google Scholar]
- Coban, O.; Kuschk, P.; Kappelmeyer, U.; Spott, O.; Martienssen, M.; Jetten, M.S.M.; Knoeller, K. Nitrogen transforming community in a horizontal subsurface-flow constructed wetland. Water Res. 2015, 74, 203–212. [Google Scholar] [CrossRef]
- Liu, F.; Xiao, R.L.; Wang, Y.; Li, Y.; Zhang, S.L.; Luo, Q.; Wu, J.S. Effect of a novel constructed drainage ditch on the phosphorus sorption capacity of ditch soils in an agricultural headwater catchment in subtropical central China. Ecol. Eng. 2013, 58, 69–76. [Google Scholar] [CrossRef]
- Bennett, E.R.; Moore, M.T.; Cooper, C.M.; Smith, S.; Shields, F.D.; Drouillard, K.G.; Schulz, R. Vegetated agricultural drainage ditches for the mitigation of pyrethroid-associated runoff. Environ. Toxicol. Chem. 2005, 24, 2121–2127. [Google Scholar] [CrossRef]
- Needeman, B.A.; Kleinman, P.J.A.; Strock, J.S.; Allen, A.L. Improved management of agricultural drainage ditches for water quality protection: An overview. J. Soil Water Conserv. 2007, 62, 171–178. [Google Scholar]
- Strock, J.S.; Dell, C.J.; Schmidt, J.P. Managing natural processes in drainage ditches for nonpoint source nitrogen control. J. Soil Water Conserv. 2007, 62, 188–196. [Google Scholar]
- Huang, J.; Liu, R.M.; Wang, Q.R.; Gao, X.; Han, Z.Y.; Gao, J.M.; Gao, H.; Zhang, S.B.; Wang, J.F.; Zhang, L.; et al. Climate factors affect N2O emissions by influencing the migration and transformation of nonpoint source nitrogen in an agricultural watershed. Water Res. 2022, 223, 119028. [Google Scholar] [CrossRef]
- Nazaryuk, V.M.; Sidorova, K.K.; Shumny, V.K.; Kalimullina, F.R.; Klenova, M.I. Nitrogen regime of soils with different macrosymbiont genotypes. Eurasian Soil Sci. 2007, 40, 168–175. [Google Scholar] [CrossRef]
- In’t Zandt, D.; Fritz, C.; Wichern, F. In the land of plenty: Catch crops trigger nitrogen uptake by soil microorganisms. Plant Soil 2018, 423, 549–562. [Google Scholar] [CrossRef]
- Nasholm, T.; Kielland, K.; Ganeteg, U. Uptake of organic nitrogen by plants. New Phytol. 2009, 182, 31–48. [Google Scholar] [CrossRef] [PubMed]
- Saleem, M.; Fetzer, I.; Harms, H.; Chatzinotas, A. Trophic complexity in aqueous systems: Bacterial species richness and protistan predation regulate dissolved organic carbon and dissolved total nitrogen removal. Proc. R. Soc. B Biol. Sci. 2016, 283, 20152724. [Google Scholar] [CrossRef] [PubMed]
- Xiao, H.Y.; Liu, C.Q. Situation of sewage input reflected by nitrogen isotopic composition in a sediment core of Hongfeng Lake. Chin. Sci. Bull. 2006, 51, 971–976. [Google Scholar] [CrossRef]
- Ruiz, G.; Jeison, D.; Rubilar, O.; Ciudad, G.; Chamy, R. Nitrification-denitrification via nitrite accumulation for nitrogen removal from wastewaters. Bioresour. Technol. 2006, 97, 330–335. [Google Scholar] [CrossRef]
- Liu, J.K.; Liu, J.L.; Zhang, R.; Zou, Y.Q.; Wang, H.H.; Zhang, Z.M. Impacts of aquatic macrophytes configuration modes on water quality. Water Sci. Technol. 2014, 69, 253–261. [Google Scholar] [CrossRef]
- Chen, L.; Liu, F.; Wang, Y.; Li, X.; Zhang, S.N.; Li, Y.; Wu, J.S. Nitrogen removal in an ecological ditch receiving agricultural drainage in subtropical central China. Ecol. Eng. 2015, 82, 487–492. [Google Scholar] [CrossRef]
- Zhao, M.M.; Chen, Y.P.; Xue, L.G.; Fan, T.T. Three kinds of ammonia oxidizing microorganisms play an important role in ammonia nitrogen self-purification in the Yellow River. Chemosphere 2020, 243, 125405. [Google Scholar] [CrossRef]
- Ouyang, Q.L.; Gao, G.Q.; Liu, S.S.; Shi, X.L. Study on Characters of Nitrogen Adsorption and Desorption of Sediment in Ganjiang River. In Proceedings of the International Conference on Civil, Architectural and Hydraulic Engineering (ICCAHE 2012), Zhangjiajie, China, 10–12 August 2012; p. 391. [Google Scholar]
- Chen, D.Q.; He, H.; Chen, Y.Q. Purification of Nitrogen and Phosphorus in lightly Polluted Landscape River by effective microorganisms combined with submerged plants. In Proceedings of the International Conference on Energy Engineering and Environmental Engineering (ICEEEE 2013), Hangzhou, China, 18–19 January 2013; p. 430. [Google Scholar]
- Toyama, T.; Nishimura, Y.; Ogata, Y.; Sei, K.; Mori, K.; Ike, M. Effects of planting Phragmites australis on nitrogen removal, microbial nitrogen cycling, and abundance of ammonia-oxidizing and denitrifying microorganisms in sediments. Environ. Technol. 2016, 37, 478–485. [Google Scholar] [CrossRef]
- Chen, L.A.; Zhang, W.S.; Tan, J.Y.; Shao, X.H.; Qiu, Y.L.; Zhang, F.X.; Zhang, X. Nitrogen and Phosphorus Pollutants Removal from Rice Field Drainage with Ecological Agriculture Ditch: A Field Case. Phyton Int. J. Exp. Bot. 2022, 91, 2827–2841. [Google Scholar] [CrossRef]
- Kumwimba, M.N.; Zhu, B.; Muyembe, D.K. Assessing the influence of different plant species in drainage ditches on mitigation of non-point source pollutants (N, P, and sediments) in the Purple Sichuan Basin. Environ. Monit. Assess. 2017, 189, 267. [Google Scholar] [CrossRef]
- Liu, H.S.; Yang, H.; Shang, H.H.; Su, F.L.; Ji, C.Z.; Cheng, J. Effect of the Matrix Dam in the Paddy Field Drainage Ditch on Water Purification Based on the Physical Model Test. Sustainability 2022, 14, 8620. [Google Scholar] [CrossRef]
- Kroger, R.; Hollad, M.M.; Moore, M.T.; Cooper, C.M. Agricultural drainage ditches mitigate phosphorus loads as a function of hydrological variability. J. Environ. Qual. 2008, 37, 107–113. [Google Scholar] [CrossRef] [PubMed]
- Kroger, R.; Holland, M.M.; Moore, M.T.; Cooper, C.M. Hydrological variability and agricultural drainage ditch inorganic nitrogen reduction capacity. J. Environ. Qual. 2007, 36, 1646–1652. [Google Scholar] [CrossRef] [PubMed]
- Fan, G.D.; Li, Z.S.; Wang, S.M.; Huang, K.S.; Luo, J. Migration and transformation of nitrogen in bioretention system during rainfall runoff. Chemosphere 2019, 232, 54–62. [Google Scholar] [CrossRef]
- Zhan, J.; Li, W.J.; Li, Z.P.; Zhao, G.Z. Indoor experiment and numerical simulation study of ammonia-nitrogen migration rules in soil column. J. Groundw. Sci. Eng. 2018, 6, 205–219. [Google Scholar]
- Lv, X.D.; Li, H.B.; Wang, H.; Wang, X.; Li, Y.H.; Ji, X.C.; Yu, Y.Y. Effect of Matrixes and Plants on the Removal of Nitrogen and Phosphorus in Paddy Fields Drainage Ditch. In Proceedings of the 2nd International Conference on Renewable Energy and Environmental Technology (REET), Dalian, China, 19–20 August 2014; p. 516. [Google Scholar]
- Cui, N.X.; Zhang, X.; Cai, M.; Zhou, L.; Chen, G.F.; Zou, G.Y. Roles of vegetation in nutrient removal and structuring microbial communities in different types of agricultural drainage ditches for treating farmland runoff. Ecol. Eng. 2020, 155, 105941. [Google Scholar] [CrossRef]
- Ma, Y.H.; Zheng, X.Y.; Fang, Y.Q.; Xu, K.Q.; He, S.B.; Zhao, M. Autotrophic denitrification in constructed wetlands: Achievements and challenges. Bioresour. Technol. 2020, 318, 123778. [Google Scholar] [CrossRef]
- Fu, J.; Han, J.; Qi, J.; Han, R.; Xu, Y.; Wang, L. Study on the Shortcut Nitrification Process under Low DO and High pH Condition in Normal Temperature. J. Shenyang Inst. Archit. Eng. Nat. Sci. Ed. 2010, 26, 316–320. [Google Scholar]
- Fernando, K.M.C.; Ehoche, O.G.; Atkinson, J.A.; Sparkes, D.L. Root System Architecture and Nitrogen Uptake Efficiency of Wheat Species. J. Agric. Sci. 2021, 16, 37–53. [Google Scholar] [CrossRef]
- Godde, M.; Conrad, R. Immediate and adaptational temperature effects on nitric: Oxide production and nitrous oxide release from nitrification and denitrification in two soils. Biol. Fertil. Soils 1999, 30, 33–40. [Google Scholar] [CrossRef]
- Qun, Z.; Zhihao, Z.; Ting, Y.; Huchun, X.; Xin, Y.; Jing-jing, X. Effects of COD/N ratios on mainstream simultaneous nitritation and denitritation process. Environ. Ecol. 2023, 5, 68–73. [Google Scholar]
- Wang, J.; Huang, Q.; Li, Y.; Tu, X.S.; Chen, Z.X.; Elrys, A.S.; Cheng, Y.; Ma, L.F. A shift from nitrification to denitrification-dominated N2O emission in an acidic soil following organic amendment. Biol. Fertil. Soils 2023, 59, 117–122. [Google Scholar] [CrossRef]
- Li, W.H.; Siddique, M.S.; Liu, M.J.; Graham, N.; Yu, W.Z. The migration and microbiological degradation of dissolved organic matter in riparian soils. Water Res. 2022, 224, 119080. [Google Scholar] [CrossRef]
- Tan, X.Z.; Shao, D.G.; Gu, W.Q. Effects of temperature and soil moisture on gross nitrification and denitrification rates of a Chinese lowland paddy field soil. Paddy Water Environ. 2018, 16, 687–698. [Google Scholar] [CrossRef]
- Corre, M.D.; Schnabel, R.R.; Stout, W.L. Spatial and seasonal variation of gross nitrogen transformations and microbial biomass in a Northeastern US grassland. Soil Biol. Biochem. 2002, 34, 445–457. [Google Scholar] [CrossRef]
- Zaman, M.; Chang, S.X. Substrate type, temperature, and moisture content affect gross and net N mineralization and nitrification rates in agroforestry systems. Biol. Fertil. Soils 2004, 39, 269–279. [Google Scholar] [CrossRef]
- Liu, B.; Zeng, Q.; Yan, F.M.; Xu, H.G.; Xu, C.R. Effects of transgenic plants on soil microorganisms. Plant Soil 2005, 271, 1–13. [Google Scholar] [CrossRef]
- Bell, C.W.; Asao, S.; Calderon, F.; Wolk, B.; Wallenstein, M.D. Plant nitrogen uptake drives rhizosphere bacterial community assembly during plant growth. Soil Biol. Biochem. 2015, 85, 170–182. [Google Scholar] [CrossRef]
- Qin, R.Q.; Chen, H. The procession of constructed wetland removal mechanism of pollutants. In Proceedings of the 4th International Conference on Mechanical Materials and Manufacturing Engineering (MMME), Wuhan, China, 15–16 October 2016; pp. 568–570. [Google Scholar]
- Simek, M.; Santruckova, H. Influence of storage of soil samples on microbial biomass and its activity. Rostl. Vyrob. 1999, 45, 415–419. [Google Scholar]
- Lu, S.; Yang, Y.M.; Yin, H.L.; Su, X.S.; Yu, K.N.; Sun, C. Microbial Community Structure of Arsenic-Bearing Groundwater Environment in the Riverbank Filtration Zone. Water 2022, 14, 1548. [Google Scholar] [CrossRef]
- Kampman, C.; Piai, L.; Hendrickx, T.L.G.; Temmink, H.; Zeeman, G.; Buisman, C.J.N. Effect of temperature on denitrifying methanotrophic activity of ‘Candidatus Methylomirabilis oxyfera’. Water Sci. Technol. 2014, 70, 1683–1689. [Google Scholar] [CrossRef] [PubMed]
- Wang, C.Y.; Wu, D.F.; Mao, X.M.; Hou, J.M.; Wang, L.; Han, Y.P. Estimating soil ammonium adsorption using pedotransfer functions in an irrigation district of the North China Plain. Pedosphere 2021, 31, 157–171. [Google Scholar] [CrossRef]
- Ma, L.W.; Lindau, C.W.; Hongprayoon, C.; Burhan, W.; Jang, B.C.; Patrick, W.H.; Selim, H.M. Modeling urea, ammonium, and nitrate transport and transformations in flooded soil columns. Soil Sci. 1999, 164, 123–132. [Google Scholar] [CrossRef]
- Fernandes, S.O.; Javanaud, C.; Aigle, A.; Michotey, V.D.; Guasco, S.; Deborde, J.; Deflandre, B.; Anschutz, P.; Bonin, P.C. Anaerobic nitrification-denitrification mediated by Mn-oxides in meso-tidal sediments: Implications for N-2 and N2O production. J. Mar. Syst. 2015, 144, 1–8. [Google Scholar] [CrossRef]
- Martinez-Espinosa, C.; Sauvage, S.; Al Bitar, A.; Green, P.A.; Vorosmarty, C.J.; Sanchez-Perez, J.M. Denitrification in wetlands: A review towards a quantification at global scale. Sci. Total Environ. 2021, 754, 142398. [Google Scholar] [CrossRef]
Disclaimer/Publisher’s Note: The statements, opinions and data contained in all publications are solely those of the individual author(s) and contributor(s) and not of MDPI and/or the editor(s). MDPI and/or the editor(s) disclaim responsibility for any injury to people or property resulting from any ideas, methods, instructions or products referred to in the content. |
© 2023 by the authors. Licensee MDPI, Basel, Switzerland. This article is an open access article distributed under the terms and conditions of the Creative Commons Attribution (CC BY) license (https://creativecommons.org/licenses/by/4.0/).