Enhanced Soil Moisture Management Using Waste Green Algae-Derived Polymers: Optimization of Application Rate and Mixing Depth


 ,
,
Abstract
:1. Introduction
2. Materials and Methods
2.1. Materials
2.2. Synthesis of the Green Algae Polymers
2.3. Green Algae Polymer Performance Testing
2.3.1. Swelling Behavior and Reuse Performance Test
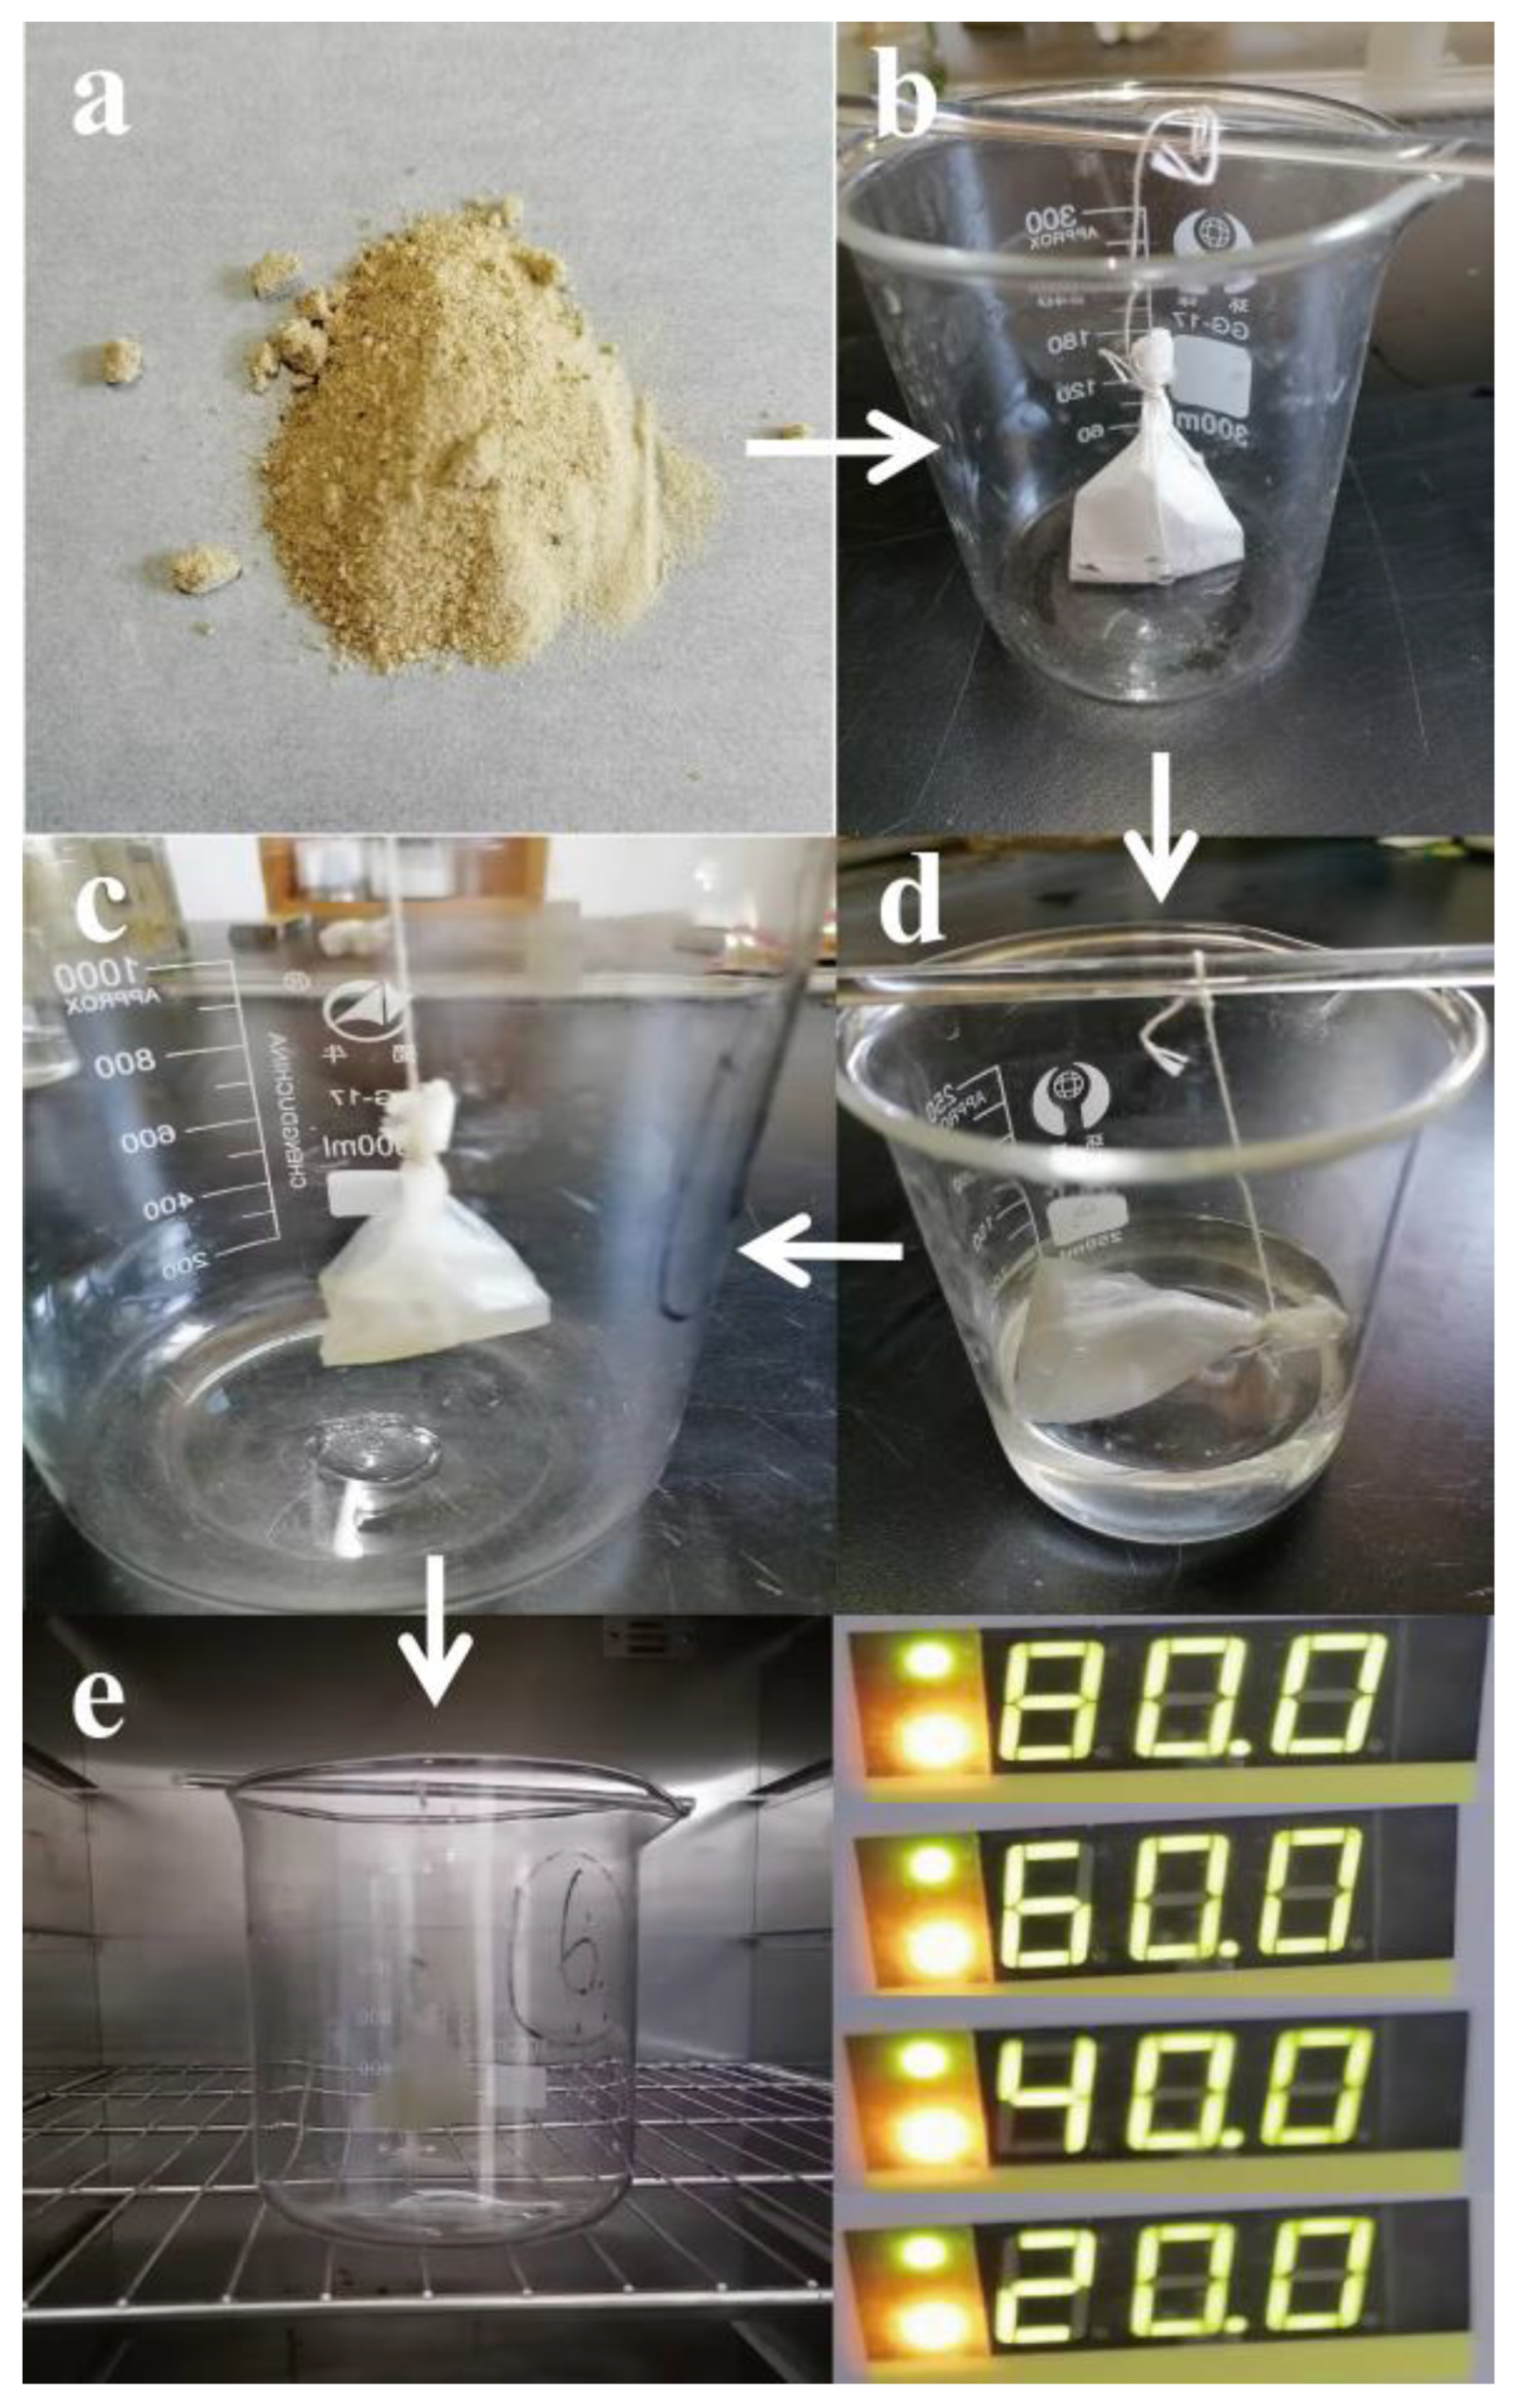
2.3.2. Water Retention Capacity
2.4. Soil Infiltration and Evaporation with Green Algae Polymer
2.4.1. Soil Water Infiltration
2.4.2. Soil Water Evapotranspiration
2.5. Infiltration Models, Evaporation Models and Evaluation Indices
2.5.1. Wetting Front Propulsion Model
2.5.2. Cumulative Infiltration Model
- 1.
- Lewis equation:I = Ktα
- 2.
- Philip infiltration model:I = St0.5
- 3.
- Horton infiltration model:I = at + (b − a)(1 − e−ct)/c
2.5.3. Evaporation Model
2.5.4. Evaluating Indices of Models
2.6. Comprehensive Evaluation
2.7. Statistical Analysis
3. Results
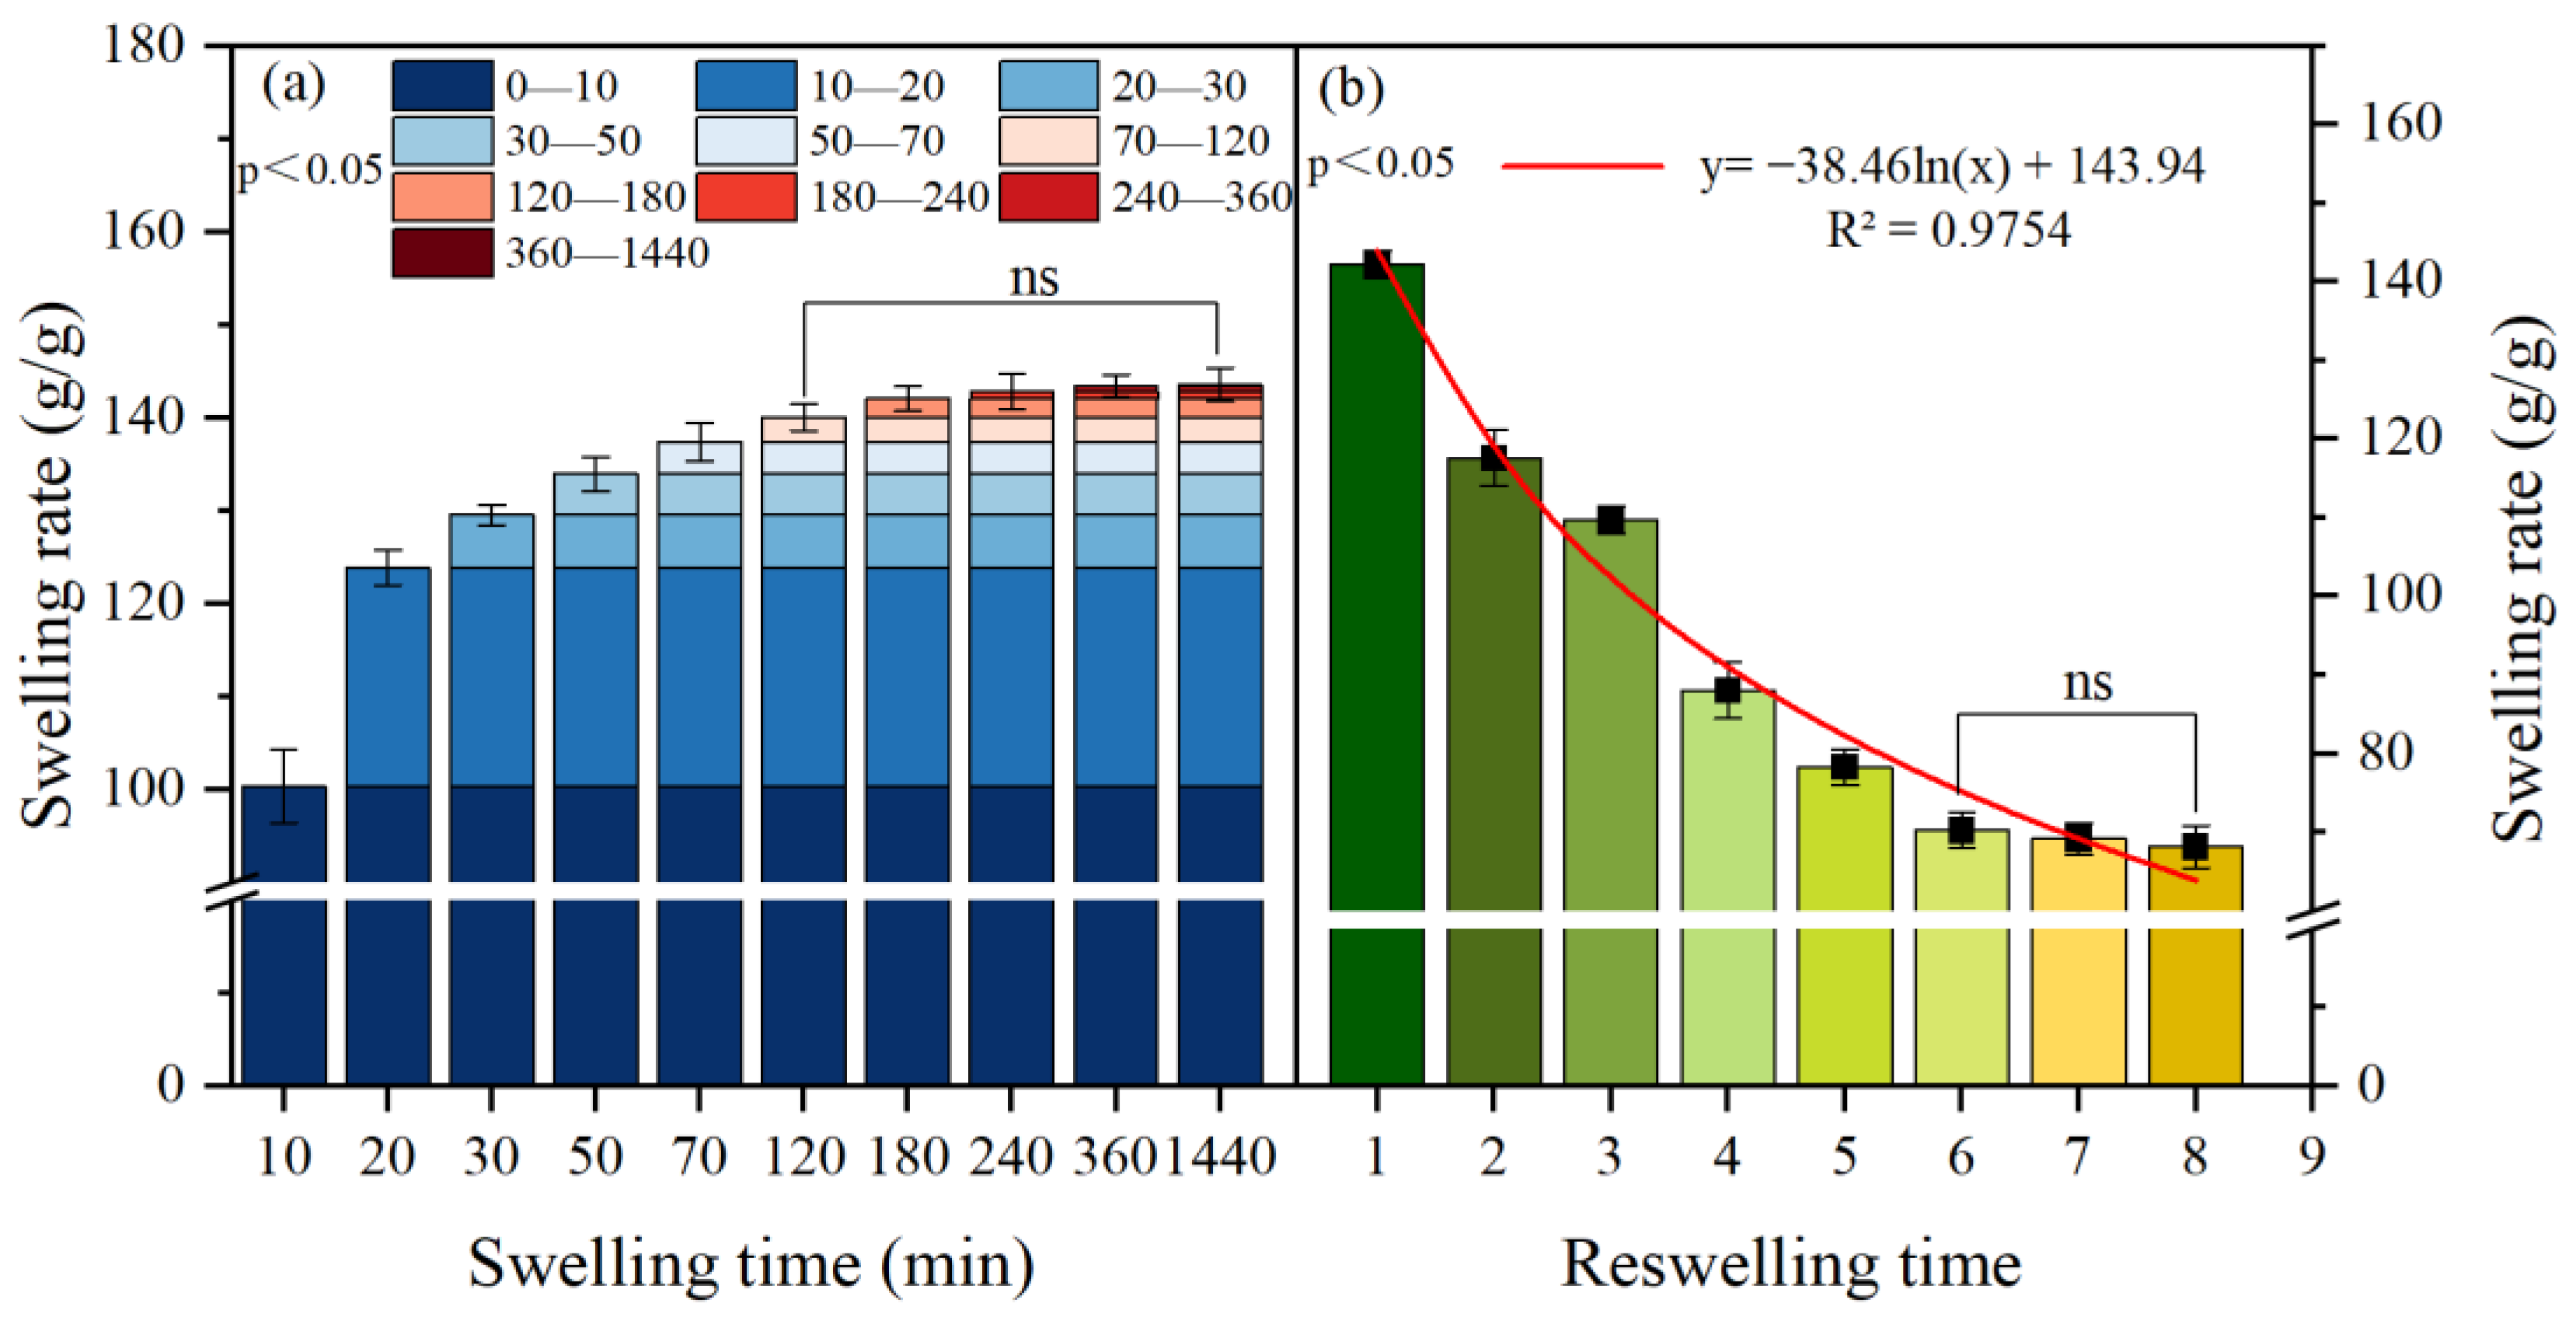
3.1. Swelling Performance
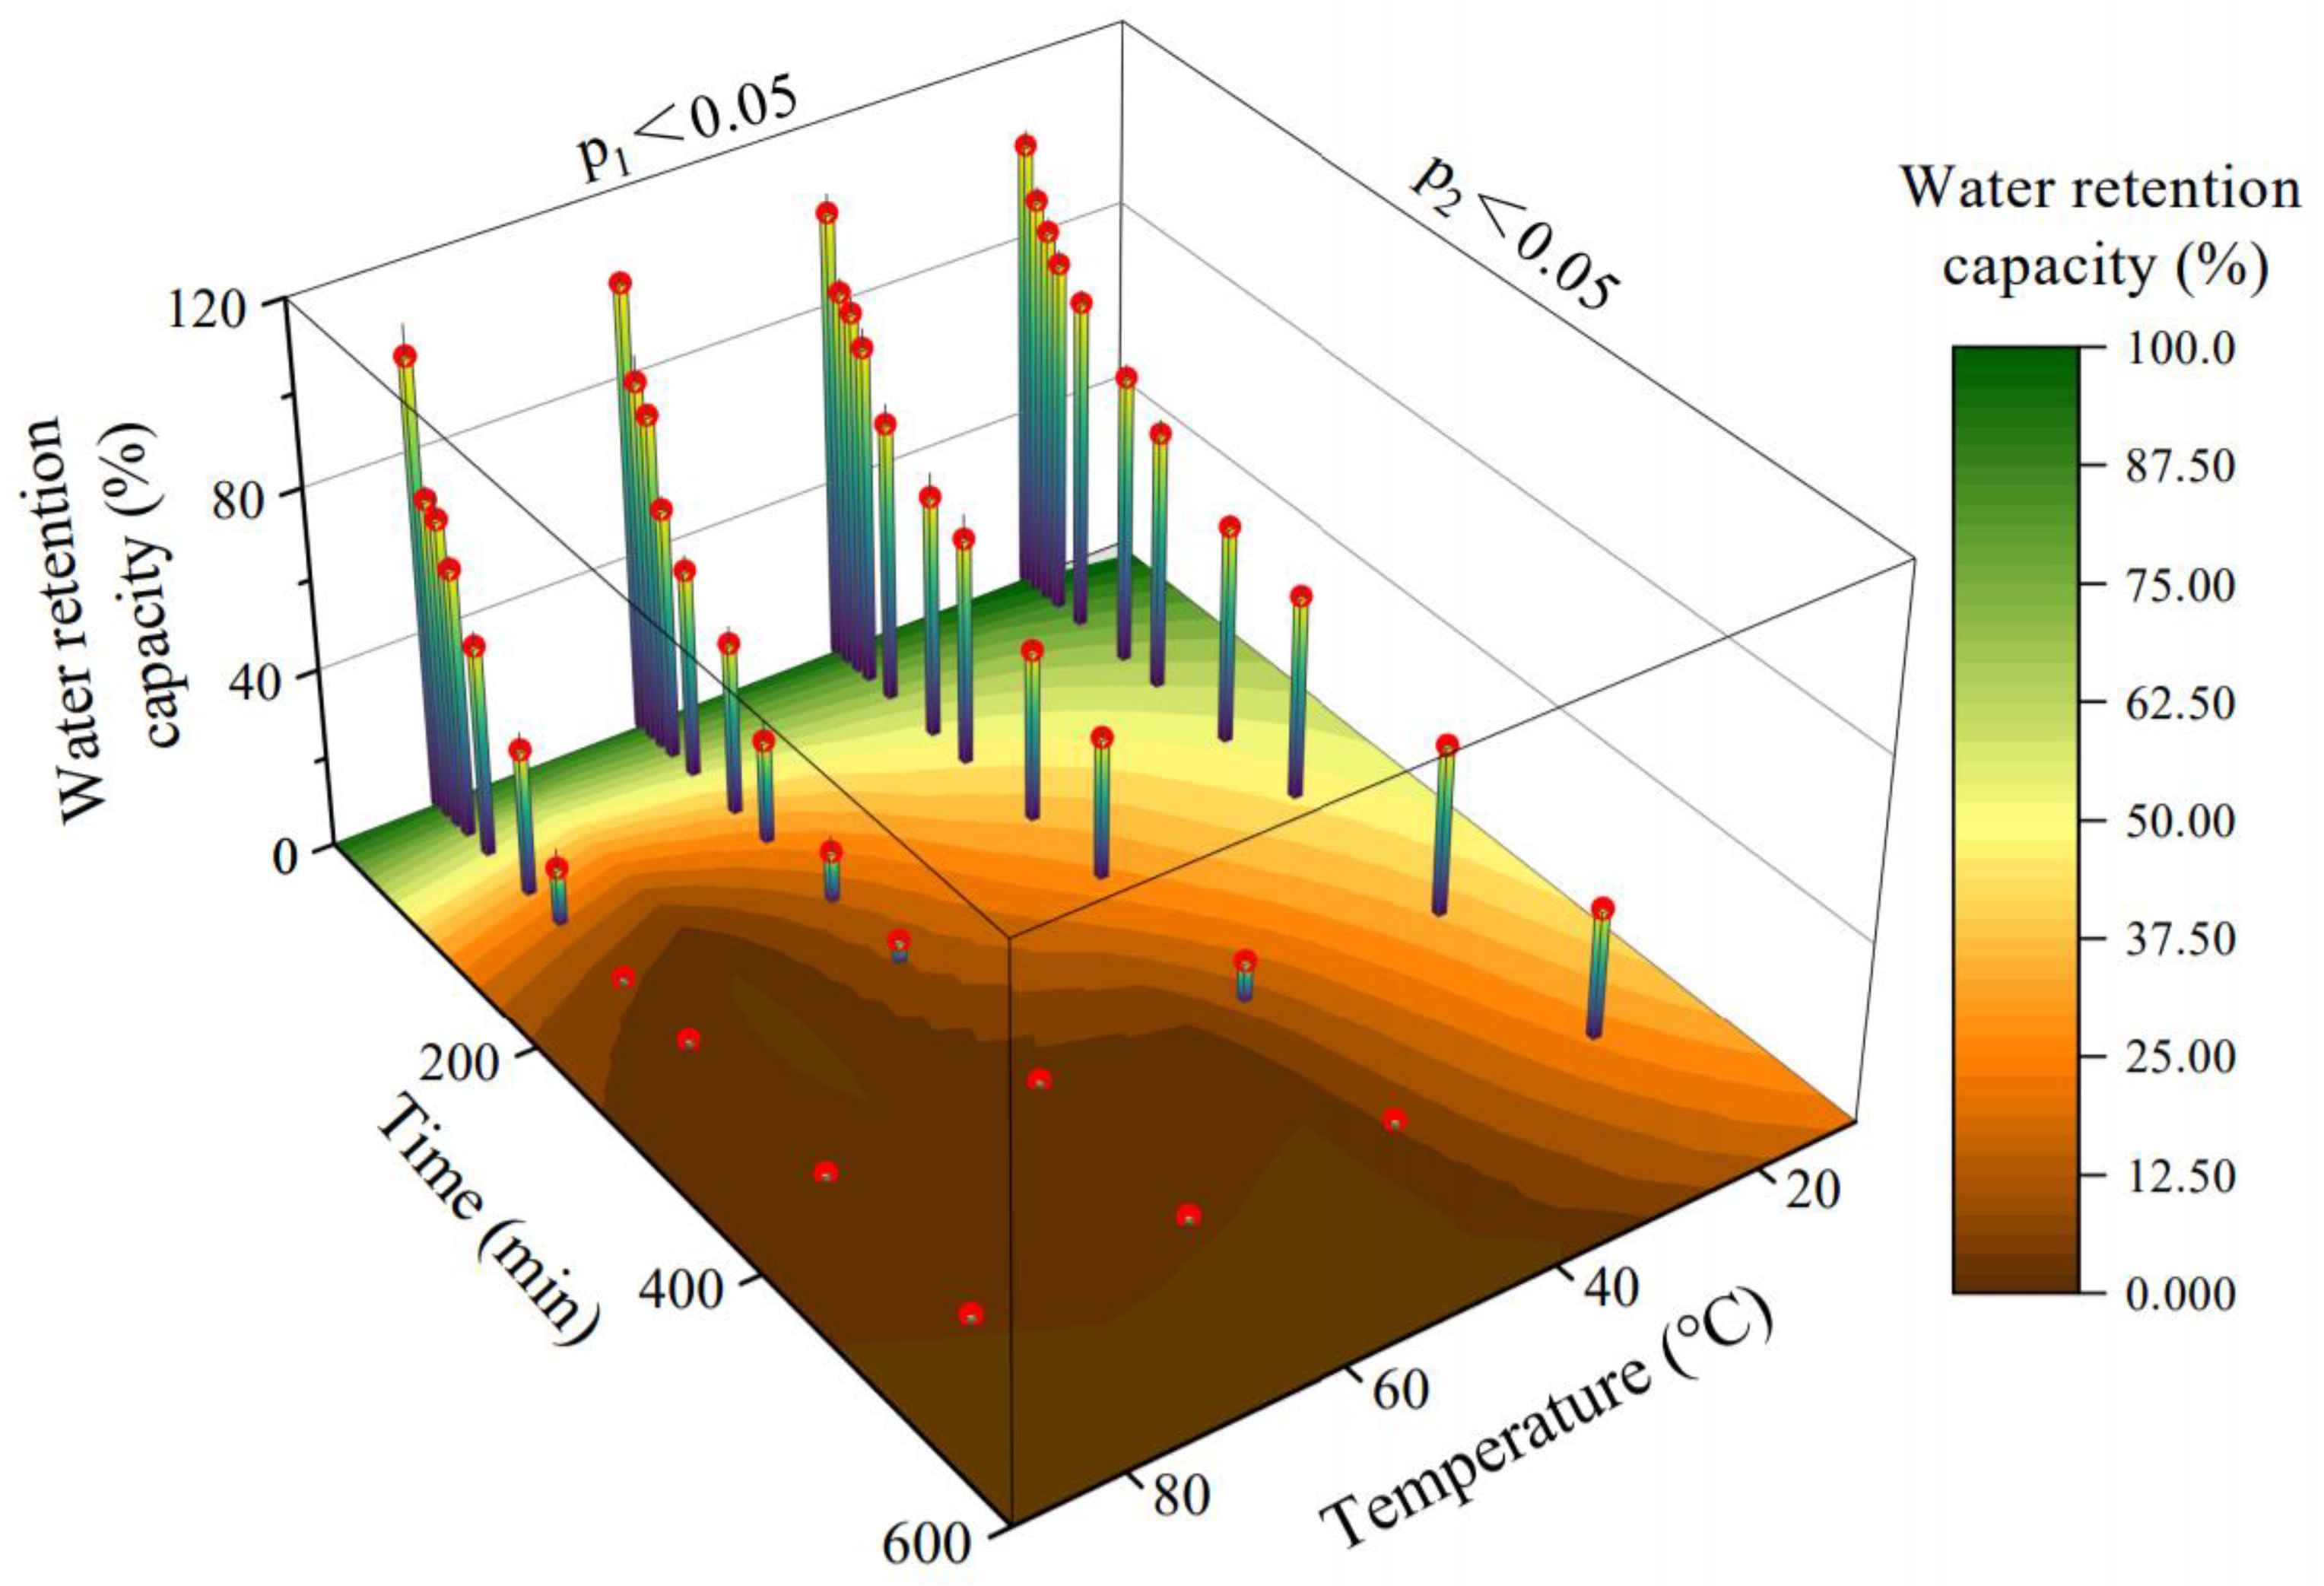
3.2. Water Retention Capacity
3.3. Soil Water Infiltration
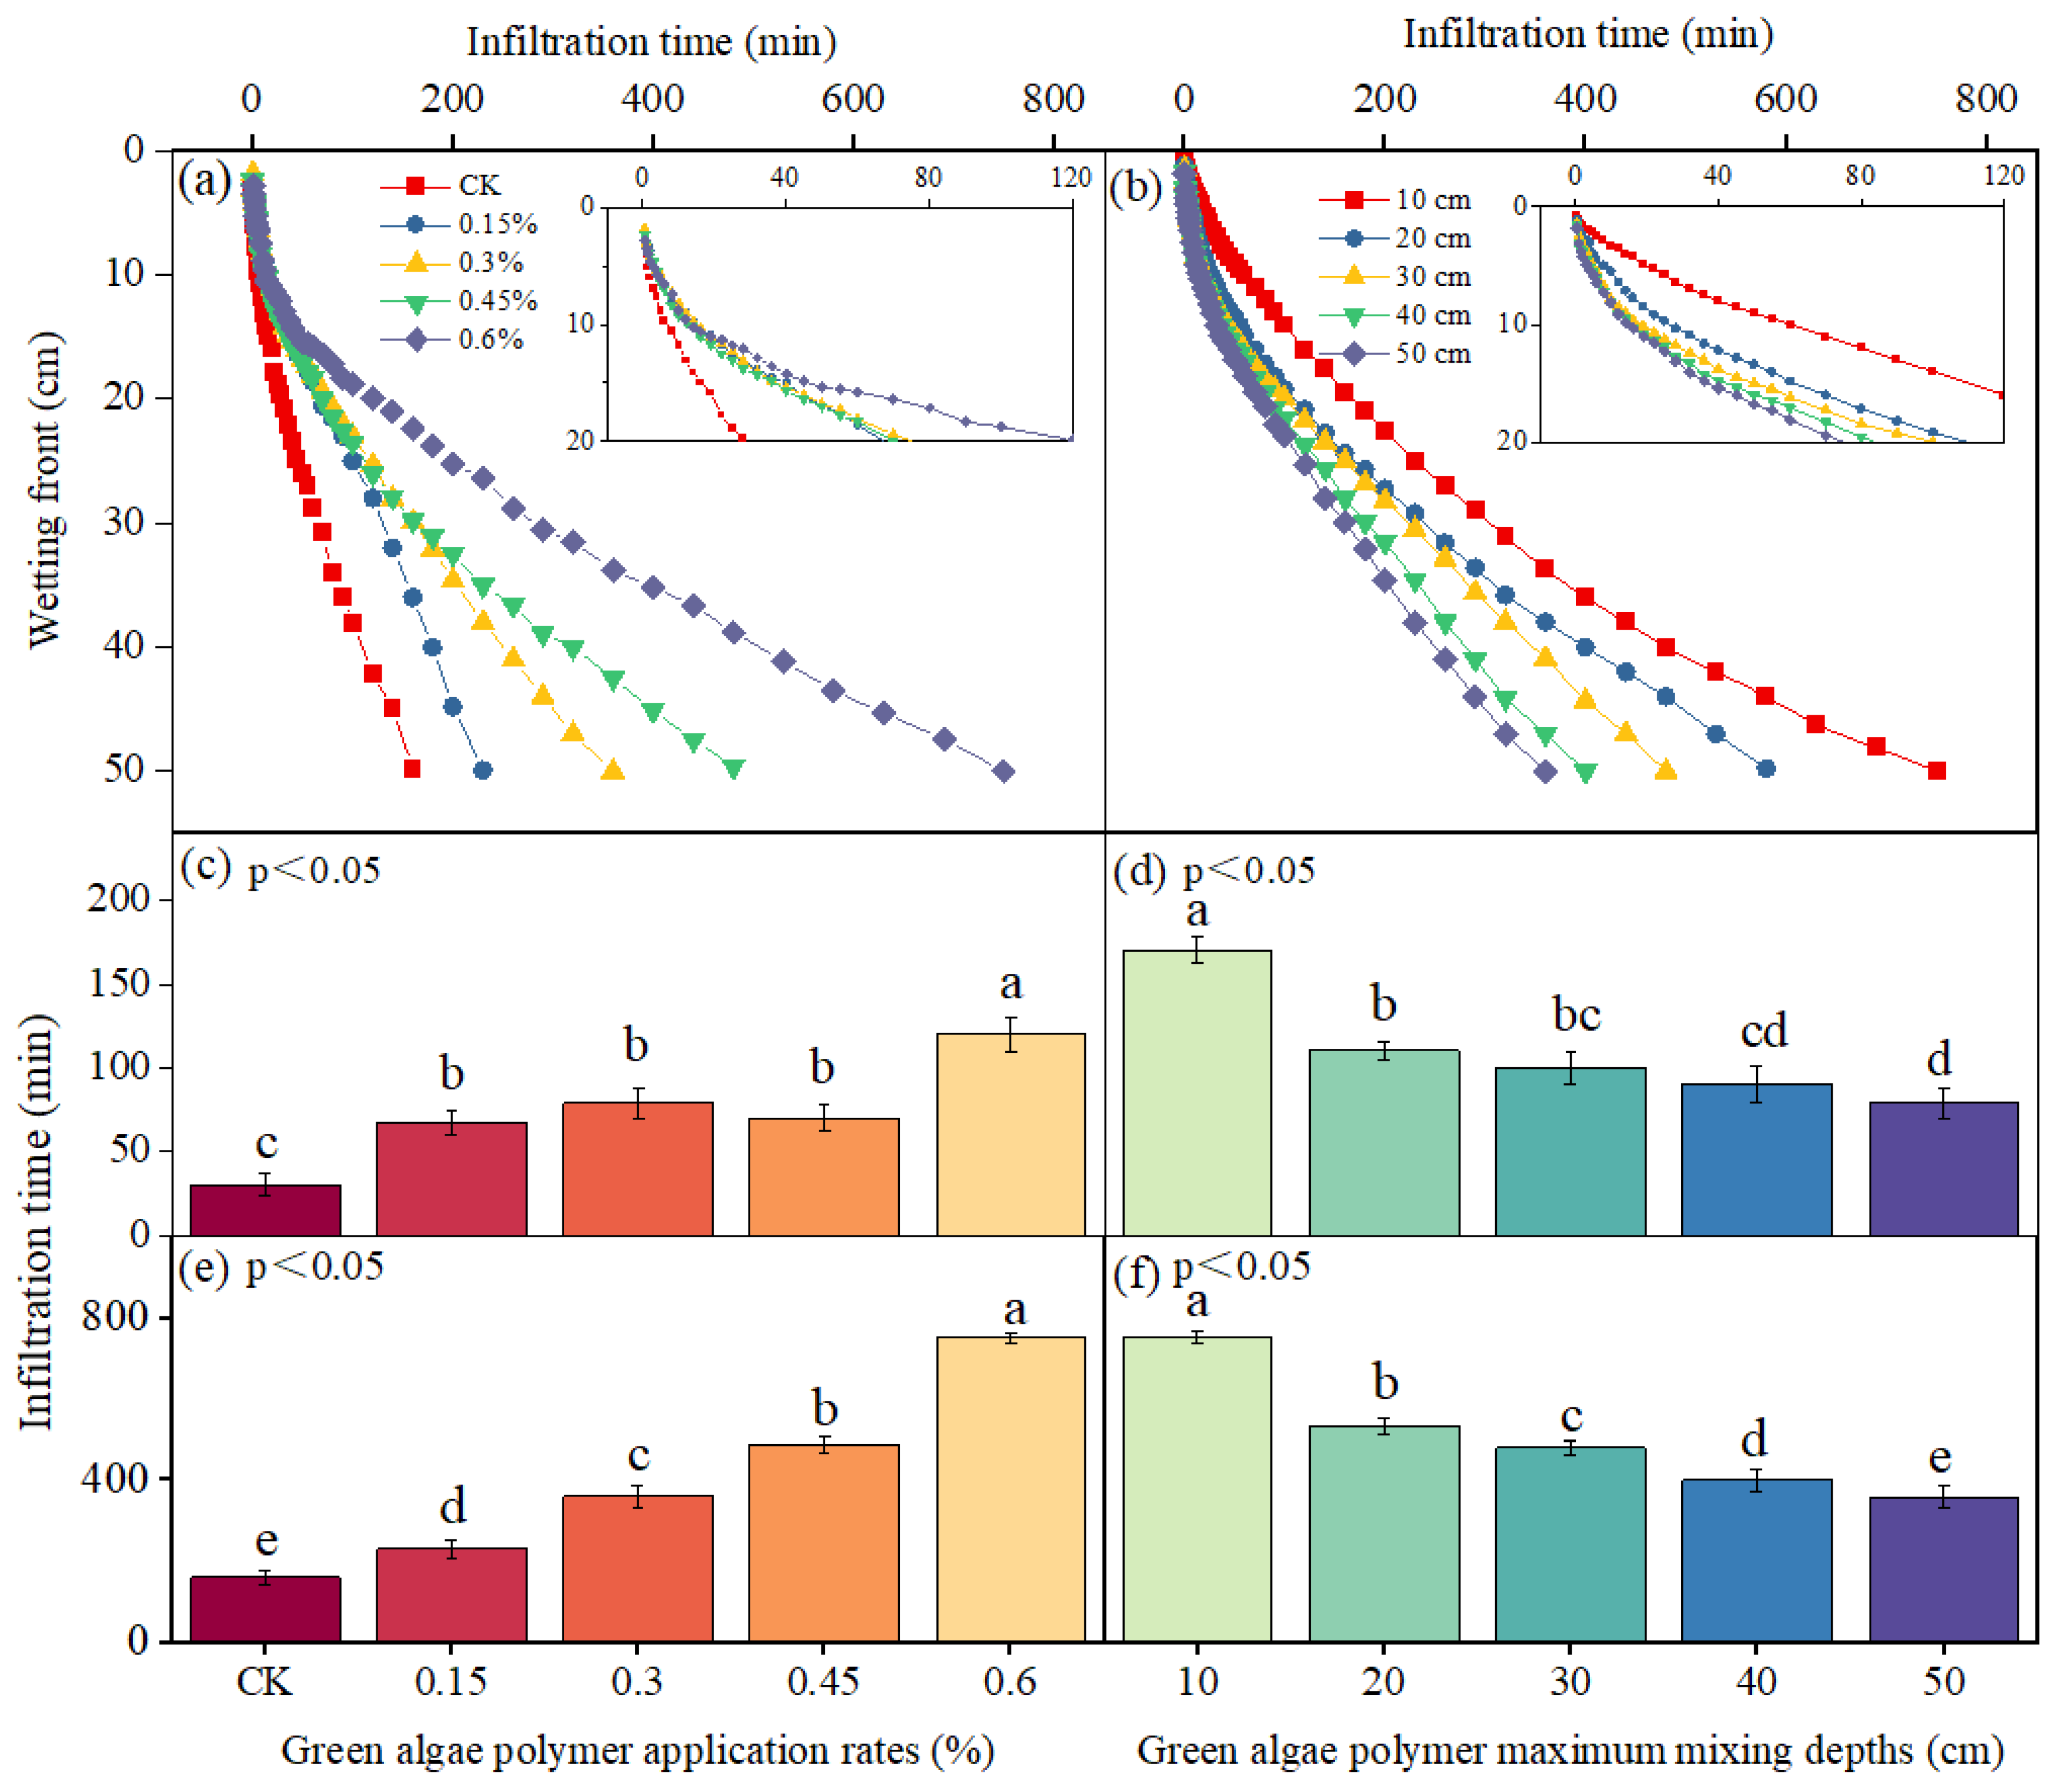
3.3.1. Wetting Front
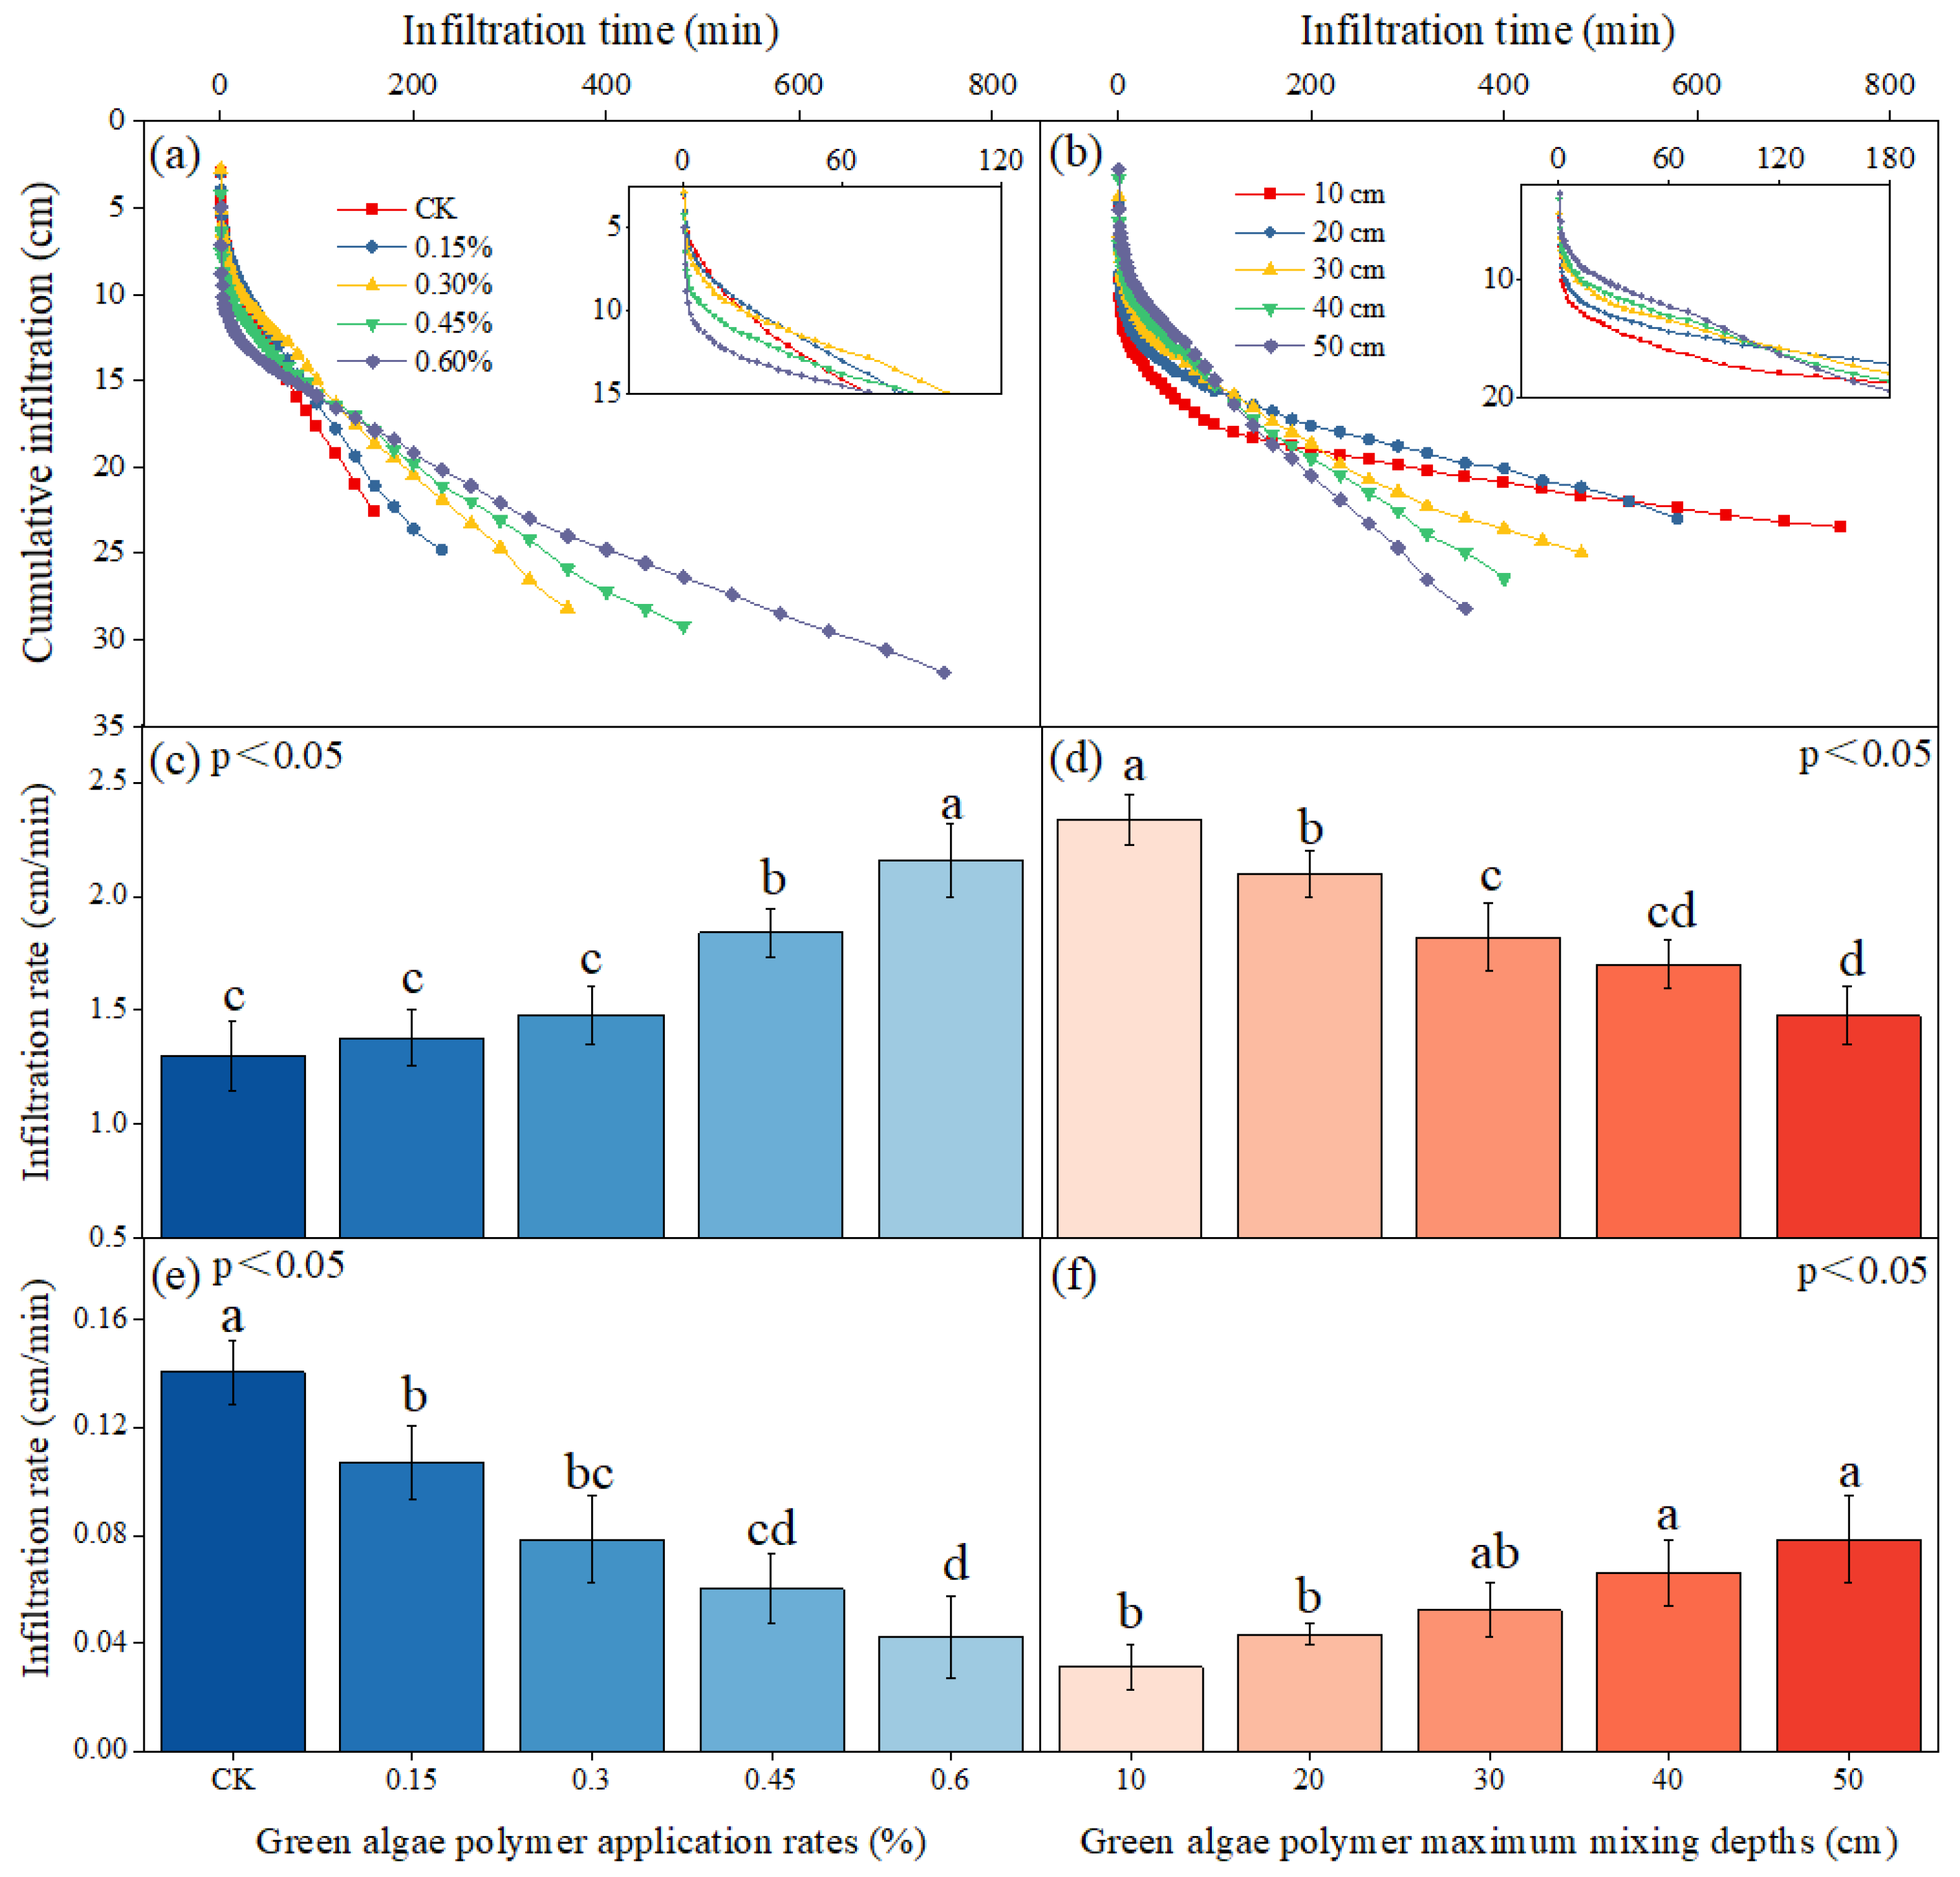
3.3.2. Cumulative Infiltration
3.3.3. Infiltration Model
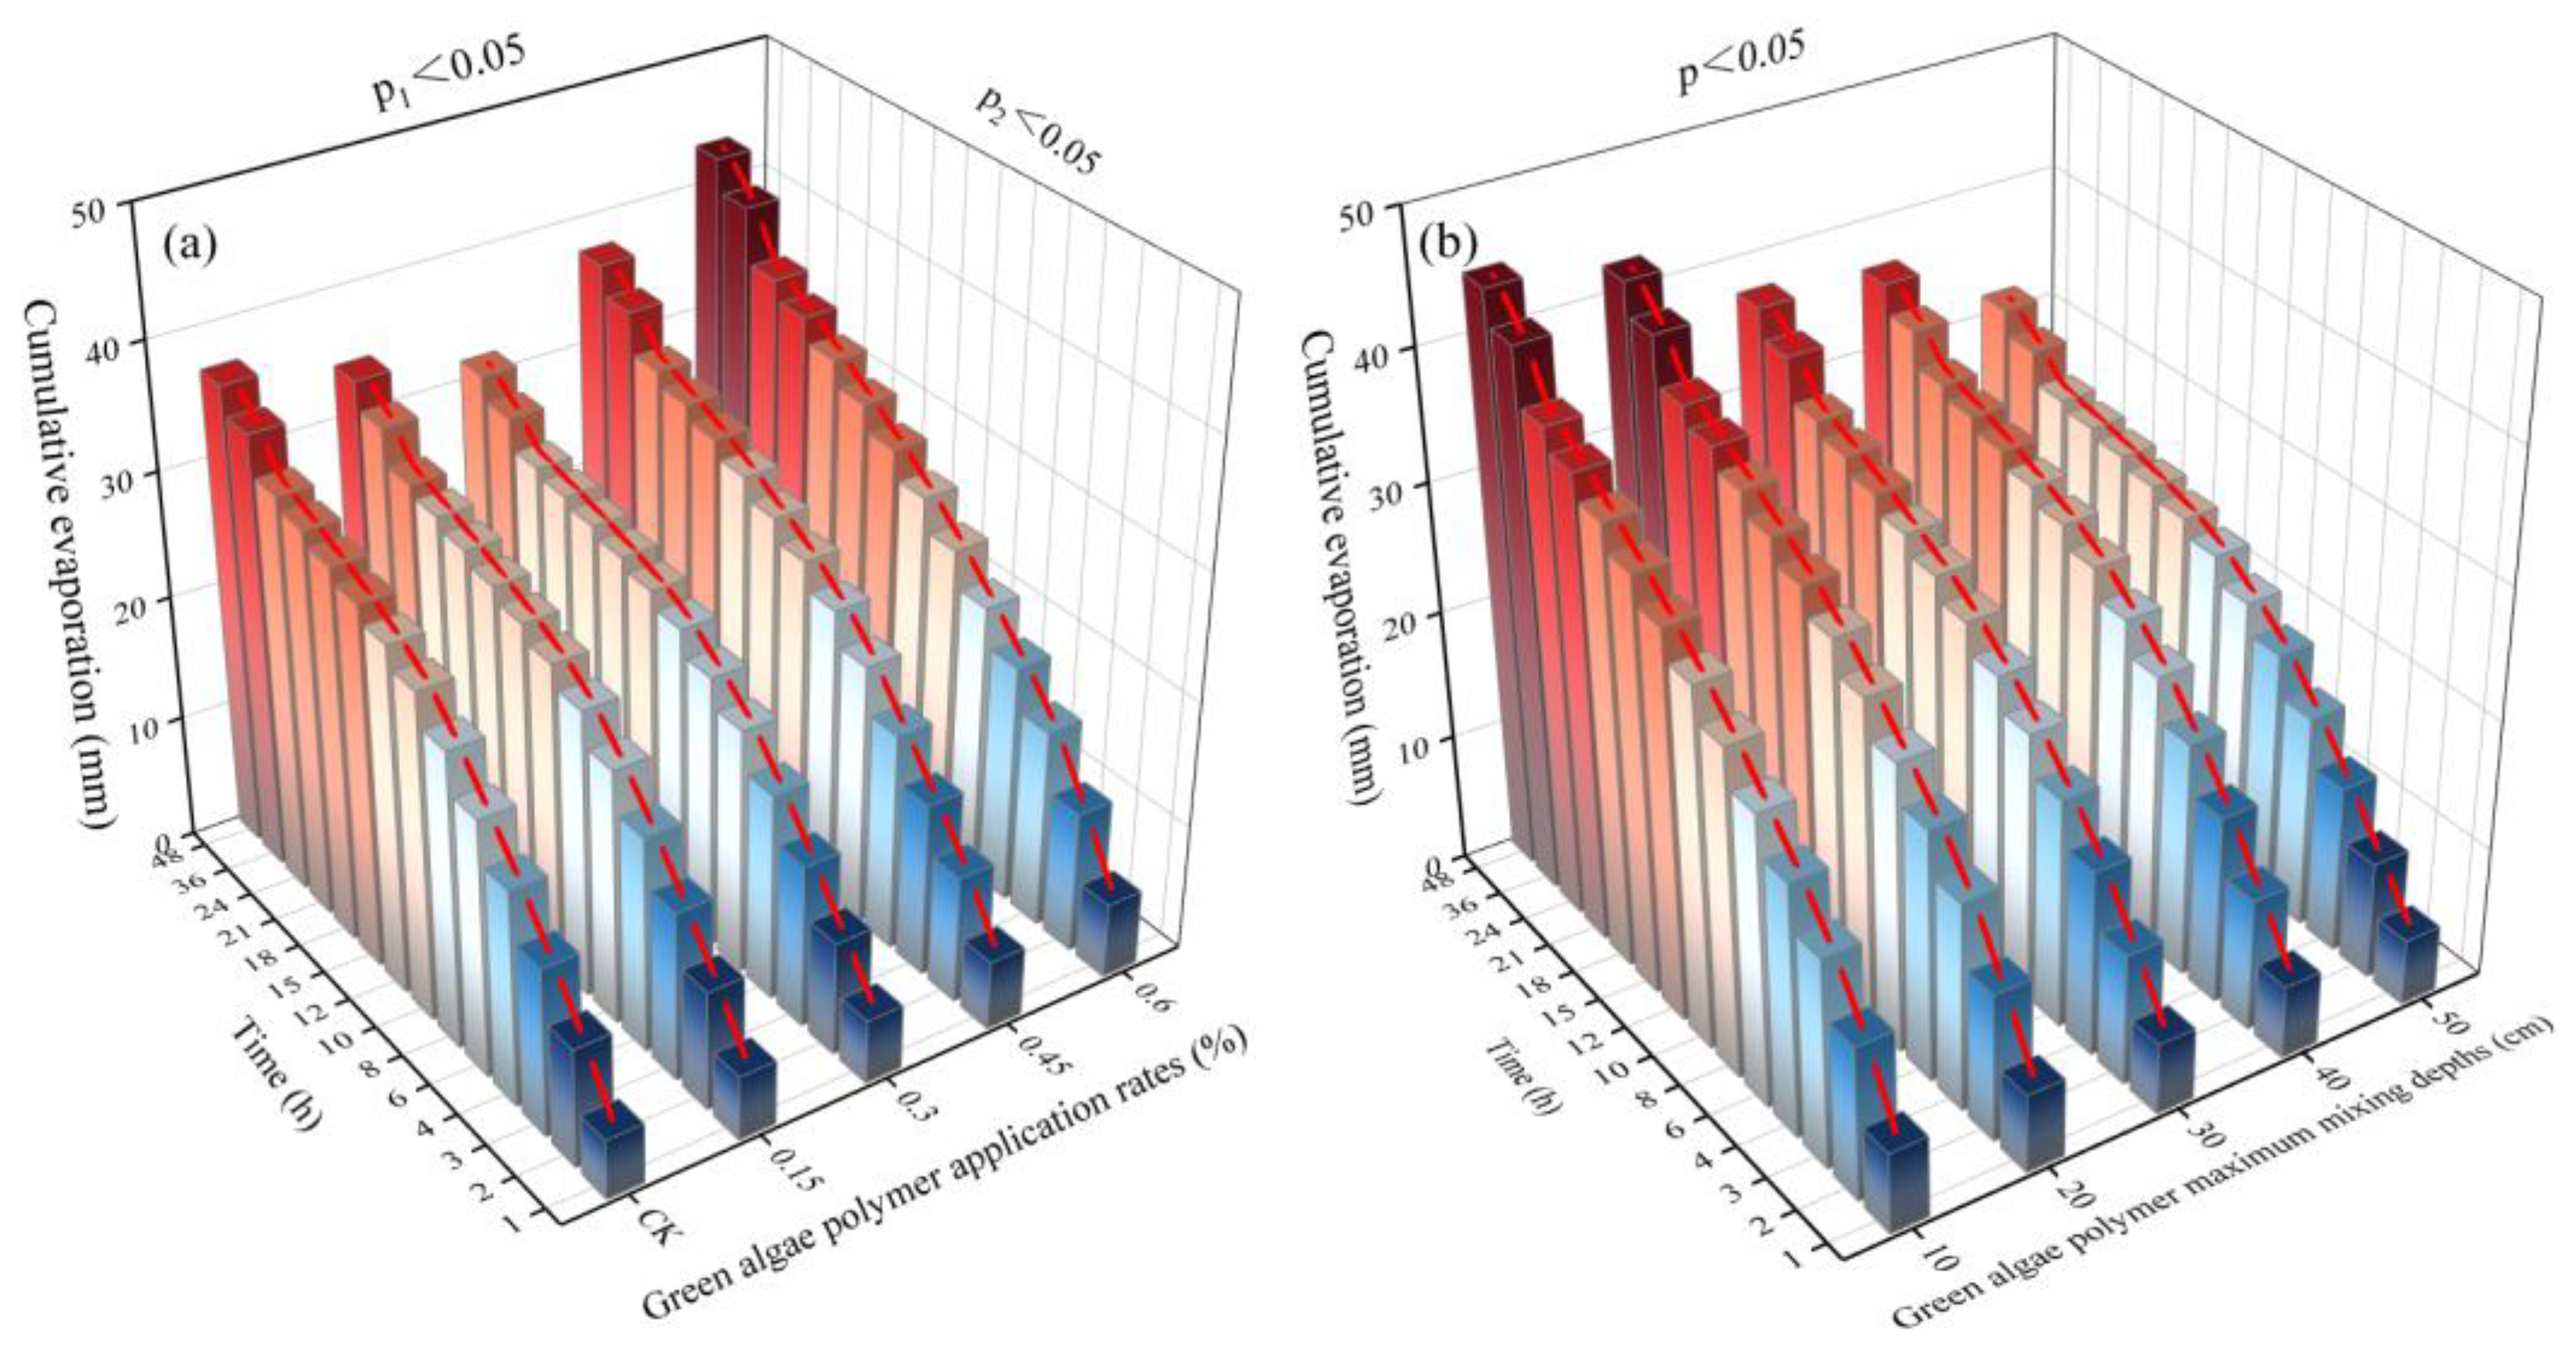
3.4. Soil Cumulative Evaporation
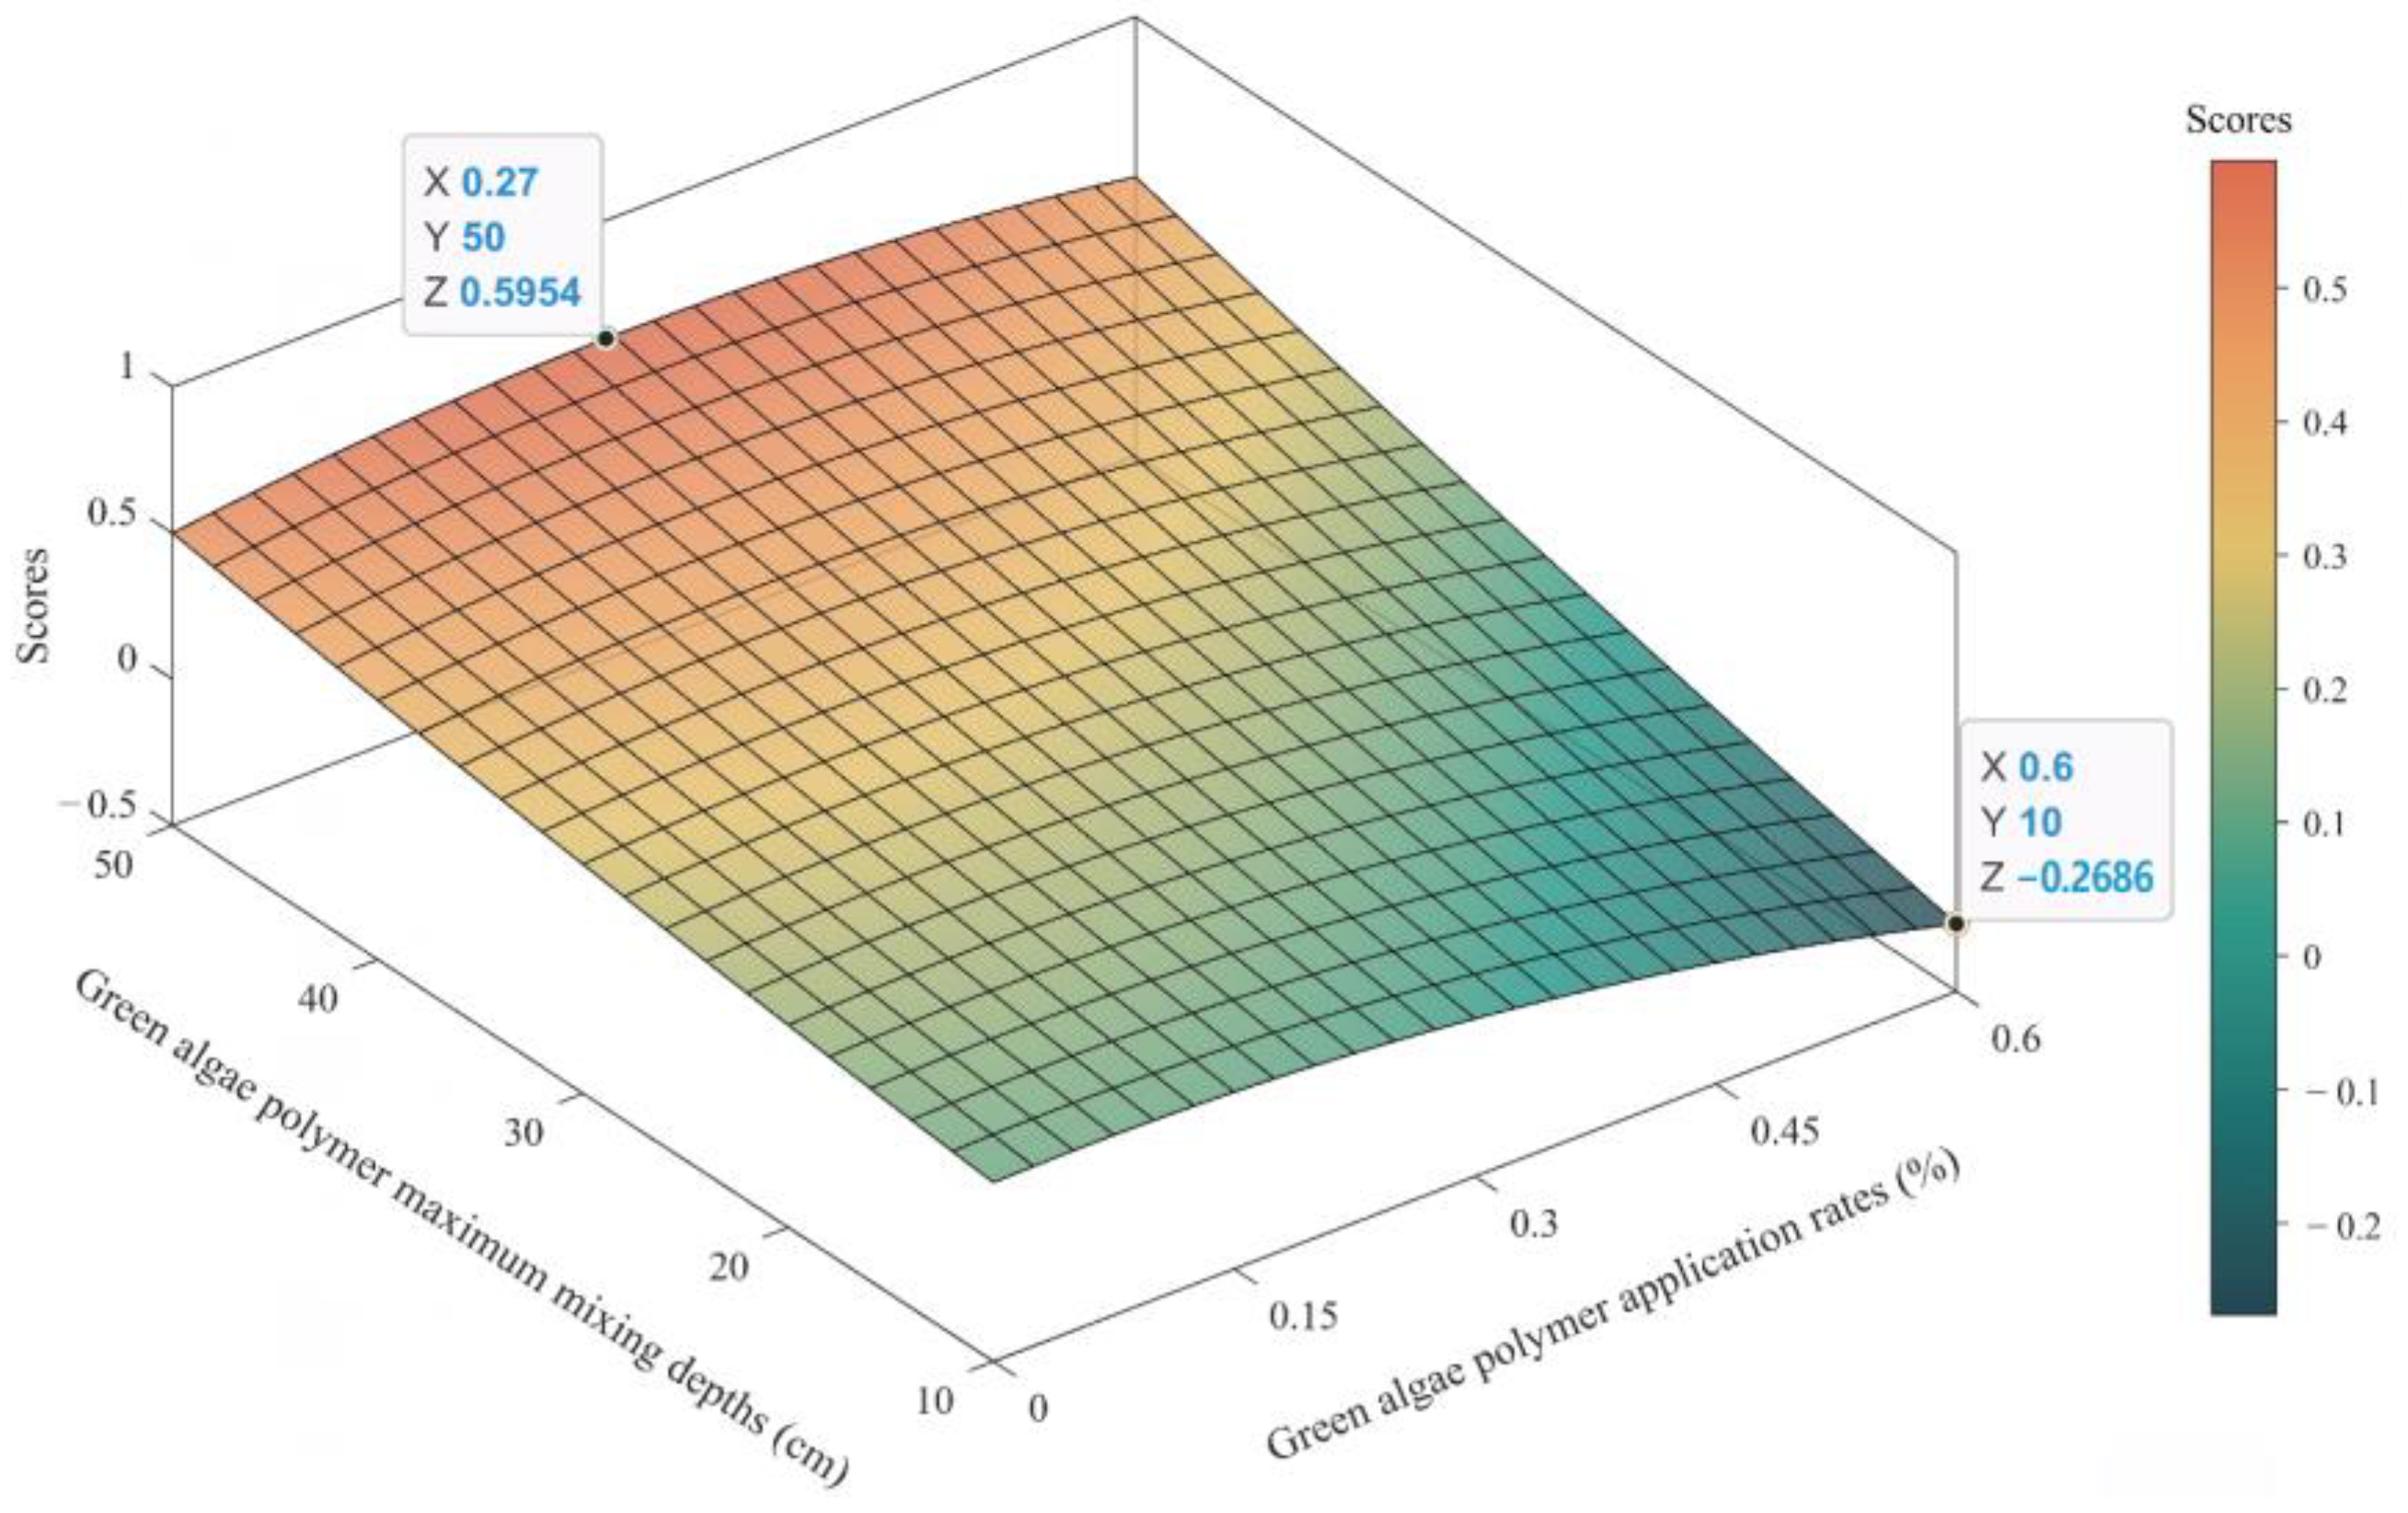
3.5. Optimal Polymer Management Practices Based on Comprehensive TOPSIS Evaluations
4. Discussion
4.1. Swelling Performance of Polymers Prepared from Green Algae
4.2. Effects of Green Algal Polymer on Soil Infiltration and Evaporation
4.3. Effects of Polymer Management on Overall Benefits
4.4. Limitations
5. Conclusions
Author Contributions
Funding
Data Availability Statement
Acknowledgments
Conflicts of Interest
References
- Zheng, H.; Mei, P.; Wang, W.; Yin, Y.; Li, H.; Zheng, M.; Ou, X.; Cui, Z. Effects of super absorbent polymer on crop yield, water productivity and soil properties: A global meta-analysis. Agric. Water Manag. 2023, 282, 108290. [Google Scholar] [CrossRef]
- Mazhar, M.W.; Ishtiaq, M.; Maqbool, M.; Akram, R. Seed priming with Calcium oxide nanoparticles improves germination, biomass, antioxidant defence and yield traits of canola plants under drought stress. S. Afr. J. Bot. 2022, 151, 889–899. [Google Scholar] [CrossRef]
- Albalasmeh, A.A.; Mohawesh, O.; Gharaibeh, M.A.; Alghamdi, A.G.; Alajlouni, M.A.; Alqudah, A.M. Effect of hydrogel on corn growth, water use efficiency, and soil properties in a semi-arid region. J. Saudi Soc. Agric. Sci. 2022, 21, 518–524. [Google Scholar] [CrossRef]
- Mi, J.; Gregorich, E.G.; Xu, S.; McLaughlin, N.B.; Ma, B.; Liu, J. Effect of bentonite amendment on soil hydraulic parameters and millet crop performance in a semi-arid region. Field Crops Res. 2017, 212, 107–114. [Google Scholar] [CrossRef]
- Ahmed, E.M. Hydrogel: Preparation, characterization, and applications: A review. J. Adv. Res. 2015, 6, 105–121. [Google Scholar] [CrossRef] [PubMed]
- Al-Jabari, M.; Ghyadah, R.A.; Alokely, R. Recovery of hydrogel from baby diaper wastes and its application for enhancing soil irrigation management. J. Environ. Manag. 2019, 239, 255–261. [Google Scholar] [CrossRef]
- AbdAllah, A.M.; Mashaheet, A.M.; Burkey, K.O. Super absorbent polymers mitigate drought stress in corn (Zea mays L.) grown under rainfed conditions. Agric. Water Manag. 2021, 254, 106946. [Google Scholar] [CrossRef]
- Verma, A.K.; Sindhu, S.S.; Singh, A.; Kumar, A.; Singh, A.; Chauhan, V.B.S. Conditioning effects of biodegradable superabsorbent polymer and vermi-products on media properties and growth of gerbera. Ecol. Eng. 2019, 132, 23–30. [Google Scholar] [CrossRef]
- Ai, F.; Yin, X.; Hu, R.; Ma, H.; Liu, W. Research into the super-absorbent polymers on agricultural water. Agric. Water Manag. 2021, 245, 106513. [Google Scholar] [CrossRef]
- Satriani, A.; Catalano, M.; Scalcione, E. The role of superabsorbent hydrogel in bean crop cultivation under deficit irrigation conditions: A case-study in Southern Italy. Agric. Water Manag. 2018, 195, 114–119. [Google Scholar] [CrossRef]
- Chang, L.; Xu, L.; Liu, Y.; Qiu, D. Superabsorbent polymers used for agricultural water retention. Polym. Test. 2021, 94, 107021. [Google Scholar] [CrossRef]
- Xie, X.; Ma, L.; Chen, Y.; Luo, X.; Long, M.; Ji, H.; Chen, J. Bagasse cellulose composite superabsorbent material with double-crosslinking network using chemical modified Nano-CaCO3 reinforcing strategy. Nanomaterials 2022, 12, 1459. [Google Scholar] [CrossRef] [PubMed]
- Chamizo, S.; Cantón, Y.; Rodríguez-Caballero, E.; Domingo, F.; Escudero, A. Runoff at contrasting scales in a semiarid ecosystem: A complex balance between biological soil crust features and rainfall characteristics. J. Hydrol. 2012, 452–453, 130–138. [Google Scholar] [CrossRef]
- Cui, Z.; Huang, Z.; Luo, J.; Qiu, K.; López-Vicente, M.; Wu, G.-L. Litter cover breaks soil water repellency of biocrusts, enhancing initial soil water infiltration and content in a semi-arid sandy land. Agric. Water Manag. 2021, 255, 107009. [Google Scholar] [CrossRef]
- Song, M.; Lin, S.; Takahashi, F. Coal fly ash amendment to mitigate soil water evaporation in arid/semi-arid area: An approach using simple drying focusing on sieve size and temperature. Resour. Conserv. Recycl. 2020, 156, 104726. [Google Scholar] [CrossRef]
- Misiewicz, J.; Datta, S.S.; Lejcuś, K.; Marczak, D. The characteristics of time-dependent changes of coefficient of permeability for superabsorbent polymer-soil mixtures. Materials 2022, 15, 4465. [Google Scholar] [CrossRef] [PubMed]
- Han, Y.G.; Yang, P.L.; Luo, Y.P.; Ren, S.M.; Zhang, L.X.; Xu, L. Porosity change model for watered super absorbent polymer-treated soil. Environ. Earth Sci. 2010, 61, 1197–1205. [Google Scholar] [CrossRef]
- Guo, J.; Shi, W.; Wen, L.; Shi, X.; Li, J. Effects of a super-absorbent polymer derived from poly-γ-glutamic acid on water infiltration, field water capacity, soil evaporation, and soil water-stable aggregates. Arch. Agron. Soil Sci. 2020, 66, 1627–1638. [Google Scholar] [CrossRef]
- Zhao, W.; Hu, J.; Cui, Z.; Dou, P.; Fan, Y. Effects of superabsorbent polymers on the vertical infiltration of soil water with sand mulching. Environ. Earth Sci. 2019, 78, 648. [Google Scholar] [CrossRef]
- Bai, W.; Li, M.; Zhao, H.; Liu, B.; Wu, Y.; Song, J. Effect of super absorbent polymer on the ponding infiltration characteristics of soil water. Chin. Agric. Sci. 2010, 43, 5055–5062. [Google Scholar]
- Zhao, W.; Cao, T.; Dou, P.; Sheng, J.; Luo, M. Effect of various concentrations of superabsorbent polymers on soil particle-size distribution and evaporation with sand mulching. Sci. Rep. 2019, 9, 3511. [Google Scholar] [CrossRef] [PubMed]
- Yu, J.; Shi, J.G.; Ma, X.; Dang, P.F.; Yan, Y.L.; Mamedov, A.I.; Shainberg, I.; Levy, G.J. Superabsorbent polymer properties and concentration effects on water retention under drying conditions. Soil Sci. Soc. Am. J. 2017, 81, 889–901. [Google Scholar] [CrossRef]
- Yang, L.; Han, Y.; Yang, P.; Wang, C.; Yang, S.; Kuang, S.; Yuan, H.; Xiao, C. Effects of superabsorbent polymers on infiltration and evaporation of soil moisture under point source drip irrigation. Irrig. Drain. 2015, 64, 275–282. [Google Scholar] [CrossRef]
- Chen, Y.; Tang , H.; Liu , Y.; Tan, H. Preparation and study on the volume phase transition properties of novel carboxymethyl chitosan grafted polyampholyte superabsorbent polymers. J. Taiwan Inst. Chem. Eng. 2016, 59, 569–577. [Google Scholar] [CrossRef]
- Fang, S.; Wang, G.; Li, P.; Xing, R.; Liu, S.; Qin, Y.; Yu, H.; Chen, X.; Li, K. Synthesis of chitosan derivative graft acrylic acid superabsorbent polymers and its application as water retaining agent. Int. J. Biol. Macromol. 2018, 115, 754–761. [Google Scholar] [CrossRef]
- Zhang, M.; Zhang, S.; Chen, Z.; Wang, M.; Cao, J.; Wang, R. Preparation and characterization of superabsorbent polymers based on sawdust. Polymers 2019, 11, 1891. [Google Scholar] [CrossRef]
- Qin, B.; Li, W.; Zhu, G.; Zhang, Y.; Wu, T.; Gao, G. Cyanobacterial bloom management through integrated monitoring and forecasting in large shallow eutrophic Lake Taihu (China). J. Hazard. Mater. 2015, 287, 356–363. [Google Scholar] [CrossRef]
- Amorim, C.A.; Moura, A.d.N. Ecological impacts of freshwater algal blooms on water quality, plankton biodiversity, structure, and ecosystem functioning. Sci. Total Environ. 2021, 758, 143605. [Google Scholar] [CrossRef]
- Yu, Q.; Chen, Y.; Liu, Z.; De Giesen, N.V.; Zhu, D. The Influence of a Eutrophic Lake to the River Downstream: Spatiotemporal Algal Composition Changes and the Driving Factors. Water 2015, 7, 2184–2201. [Google Scholar] [CrossRef]
- Yang, F.; Li, G.; He, Y.-G.; Ren, F.-X.; Wang, G.-X. Synthesis, characterization, and applied properties of carboxymethyl cellulose and polyacrylamide graft copolymer. Carbohydr. Polym. 2009, 78, 95–99. [Google Scholar] [CrossRef]
- Ashkani, M.; Bouhendi, H.; Kabiri, K.; Rostami, M.R. Synthesis of poly (2-acrylamido-2-methyl propane sulfonic acid) with high water absorbency and absorption under load (AUL) as concrete grade superabsorbent and its performance. Constr. Build. Mater. 2019, 206, 540–551. [Google Scholar] [CrossRef]
- Zhang, C.; García Meza, J.V.; Zhou, K.; Liu, J.; Song, S.; Zhang, M.; Meng, D.; Chen, J.; Xia, L.; Xiheng, H. Superabsorbent polymer used for saline-alkali soil water retention. J. Taiwan Inst. Chem. Eng. 2023, 145, 104830. [Google Scholar] [CrossRef]
- Zhang, J.-P.; Zhang, F.-S. Recycling waste polyethylene film for amphoteric superabsorbent resin synthesis. Chem. Eng. J. 2018, 331, 169–176. [Google Scholar] [CrossRef]
- Cheng, S.; Liu, X.; Zhen, J.; Lei, Z. Preparation of superabsorbent resin with fast water absorption rate based on hydroxymethyl cellulose sodium and its application. Carbohydr. Polym. 2019, 225, 115214. [Google Scholar] [CrossRef] [PubMed]
- Xiong, H.; Peng, H.; Ye, X.e.; Kong, Y.; Wang, N.; Yang, F.; Meni, B.-H.; Lei, Z. High salt tolerance hydrogel prepared of hydroxyethyl starch and its ability to increase soil water holding capacity and decrease water evaporation. Soil Tillage Res. 2022, 222, 105427. [Google Scholar] [CrossRef]
- Zhang, W.; Wang, P.; Deng, Y.; He, X.; Yang, X.; Chen, R.; Lei, Z. Preparation of superabsorbent polymer gel based on PVPP and its application in water-holding in sandy soil. J. Environ. Chem. Eng. 2021, 9, 106760. [Google Scholar] [CrossRef]
- Liu, Z.; Cai, L.; Dong, Q.; Zhao, X.; Han, J. Effects of microplastics on water infiltration in agricultural soil on the Loess Plateau, China. Agric. Water Manag. 2022, 271, 107818. [Google Scholar] [CrossRef]
- Wang, Z.C.; Zhang, B.W.; Ni, J.X.; Yang, W.H.; Li, W.P. Effect of Microplastics on Soil Water Infiltration and Evaporation. Environ. Sci. 2022, 43, 4394–4401. [Google Scholar]
- Wang, Z.; Li, X.; Shi, H.; Zhang, D.; Xu, P. Effects of residual plastic film on infiltration and evaporation for sandy loam and sandy soil. Trans. Chin. Soc. Agric. Mach. 2017, 48, 198–205. [Google Scholar]
- Liu, L.; Fei, L.; Zhu, H.; Hao, K.; Jie, F. Study on the influence of fertilizer solution concentration on soil water and nitrogen transport characteristics under film hole irrigation. J. Soil Sci. Plant Nutr. 2021, 21, 1653–1665. [Google Scholar] [CrossRef]
- Swartzendruber, D. Revised attribution of the power form infiltration equation. Water Resour. Res. 1993, 29, 2455–2456. [Google Scholar] [CrossRef]
- Liu, J.; Xie, M.; Chen, S.; Xu, G.; Wu, T.; Li, W. TS-REPLICA: A novel replica placement algorithm based on the entropy weight TOPSIS method in spark for multimedia data analysis. Inf. Sci. 2023, 626, 133–148. [Google Scholar] [CrossRef]
- Mihranyan, A. Cellulose from cladophorales green algae: From environmental problem to high-tech composite materials. J. Appl. Polym. Sci. 2011, 119, 2449–2460. [Google Scholar] [CrossRef]
- Wang, W.; Yang, Z.; Zhang, A.; Yang, S. Water retention and fertilizer slow release integrated superabsorbent synthesized from millet straw and applied in agriculture. Ind. Crops Prod. 2021, 160, 113126. [Google Scholar] [CrossRef]
- Wang, Y.; Wang, Y.; Wang, P. Synthesis and characterization of corn straw residue water retention agent. Trans. Chin. Soc. Agric. Mach. 2016, 47, 199–206. [Google Scholar]
- Zhang, W.; Wang, P.; Liu, S.; Chen, J.; Chen, R.; He, X.; Ma, G.; Lei, Z. Factors affecting the properties of superabsorbent polymer hydrogels and methods to improve their performance: A review. J. Mater. Sci. 2021, 56, 16223–16242. [Google Scholar] [CrossRef]
- Zhao, C.; Zhang, M.; Liu, Z.; Guo, Y.; Zhang, Q. Salt-tolerant superabsorbent polymer with high capacity of water-nutrient retention derived from sulfamic acid-modified starch. ACS Omega 2019, 4, 5923–5930. [Google Scholar] [CrossRef]
- Haraguchi, K.; Li, H.-J.; Matsuda, K.; Takehisa, T.; Elliott, E. Mechanism of forming organic/inorganic network structures during in-situ free-radical Polymerization in PNIPA—Clay nanocomposite hydrogels. Macromolecules 2005, 38, 3482–3490. [Google Scholar] [CrossRef]
- Zou, W.; Yu, L.; Liu, X.; Chen, L.; Zhang, X.; Qiao, D.; Zhang, R. Effects of amylose/amylopectin ratio on starch-based superabsorbent polymers. Carbohydr. Polym. 2012, 87, 1583–1588. [Google Scholar] [CrossRef]
- Song, J.; Zhao, H.; Zhao, G.; Xiang, Y.; Liu, Y. Novel Semi-IPN Nanocomposites with Functions of both Nutrient Slow-Release and Water Retention. 1. Microscopic Structure, Water Absorbency, and Degradation Performance. J. Agric. Food Chem. 2019, 67, 7587–7597. [Google Scholar] [CrossRef]
- Li, X.; Li, Q.; Su, Y.; Yue, Q.; Gao, B.; Su, Y. A novel wheat straw cellulose-based semi-IPNs superabsorbent with integration of water-retaining and controlled-release fertilizers. J. Taiwan Inst. Chem. Eng. 2015, 55, 170–179. [Google Scholar] [CrossRef]
- Zhao, C.; Zhang, L.; Zhang, Q.; Wang, J.; Wang, S.; Zhang, M.; Liu, Z. The effects of bio-based superabsorbent polymers on the water/nutrient retention characteristics and agricultural productivity of a saline soil from the Yellow River Basin, China. Agric. Water Manag. 2022, 261, 107388. [Google Scholar]
- Xiao, B.; Sun, F.; Hu, K.; Kidron, G.J. Biocrusts reduce surface soil infiltrability and impede soil water infiltration under tension and ponding conditions in dryland ecosystem. J. Hydrol. 2019, 568, 792–802. [Google Scholar] [CrossRef]
- Wang, F.; Zhang, X.; Neal, A.L.; Crawford, J.W.; Mooney, S.J.; Bacq-Labreuil, A. Evolution of the transport properties of soil aggregates and their relationship with soil organic carbon following land use changes. Soil Tillage Res. 2022, 215, 105226. [Google Scholar] [CrossRef]
- Zhu, J.; Suhaimi, F.; Lim, J.Y.; Gao, Z.; Swarup, S.; Loh, C.S.; Li, J.; Ong, C.N.; Tan, W.K. A field study on using soybean waste-derived superabsorbent hydrogel to enhance growth of vegetables. Sci. Total Environ. 2022, 851, 158141. [Google Scholar] [CrossRef]
- Bana, R.S.; Grover, M.; Singh, D.; Bamboriya, S.D.; Godara, S.; Kumar, M.; Kumar, A.; Sharma, S.; Shekhawat, P.S.; Lomte, D.; et al. Enhanced pearl millet yield stability, water use efficiency and soil microbial activity using superabsorbent polymers and crop residue recycling across diverse ecologies. Eur. J. Agron. 2023, 148, 126876. [Google Scholar] [CrossRef]
- Jnanesha, A.C.; Kumar, A.; Lal, R.K. Hydrogel application improved growth and yield in Senna (Cassia angustifolia Vahl. ). Ind. Crops Prod. 2021, 174, 114175. [Google Scholar] [CrossRef]
- Liang, J.; Shi, W.; He, Z.; Pang, L.; Zhang, Y. Effects of poly-γ-glutamic acid on water use efficiency, cotton yield, and fiber quality in the sandy soil of southern Xinjiang, China. Agric. Water Manag. 2019, 218, 48–59. [Google Scholar] [CrossRef]
- Zinivand, N.; Khodadadi-Dehkordi, D.; Kashkuli, H.A.; Asareh, A.; Egdernezhad, A. Assessment of superabsorbent polymer effect on water use efficiency of plant under water deficit conditions. Tecnol. Cienc. Agua. 2020, 11, 315–341. [Google Scholar]
- Jahan, M.; Nassiri Mahallati, M. Can Superabsorbent Polymers Improve Plants Production in Arid Regions? Adv. Polym. Technol. 2020, 2020, 7124394. [Google Scholar] [CrossRef]
- Yang, W.; Guo, S.W.; Li, P.F.; Song, R.Q.; Yu, J. Foliar antitranspirant and soil superabsorbent hydrogel affect photosynthetic gas exchange and water use efficiency of maize grown under low rainfall conditions. J. Sci. Food Agric. 2019, 99, 350–359. [Google Scholar] [CrossRef] [PubMed]
- Bo, Z.; Renkuan, L.; Yunkai, L.; Tao, G.; Peiling, Y.; Ji, F.; Weimin, X.; Zhichao, Z. Water-absorption characteristics of organic–inorganic composite superabsorbent polymers and its effect on summer maize root growth. J. Appl. Polym. Sci. 2012, 126, 423–435. [Google Scholar] [CrossRef]
- Islam, M.R.; Zeng, Z.; Mao, J.; Eneji, A.E.; Xue, X.; Hu, Y. Feasibility of summer corn (Zea mays L.) production in drought affected areas of northern China using water-saving superabsorbent polymer. Plant Soil Environ. 2011, 57, 279–285. [Google Scholar] [CrossRef]


| Application Rate (%) | Maximum Mixing Depths (cm) | |||||||||||
|---|---|---|---|---|---|---|---|---|---|---|---|---|
| Treatments | CK | 0.15 | 0.3 | 0.45 | 0.6 | 10 | 20 | 30 | 40 | 50 | ||
| Wetting front propulsion model | A | 3.611 | 1.649 | 2.032 | 2.975 | 2.756 | 0.789 | 1.693 | 2.002 | 2.094 | 2.184 | |
| B | 0.511 | 0.611 | 0.543 | 0.453 | 0.429 | 0.632 | 0.528 | 0.511 | 0.522 | 0.525 | ||
| MAE | 0.423 | 1.522 | 1.191 | 0.35 | 1.055 | 0.409 | 0.270 | 0.911 | 1.010 | 0.881 | ||
| RRMSE | 0.026 | 0.105 | 0.079 | 0.021 | 0.061 | 0.034 | 0.019 | 0.063 | 0.063 | 0.054 | ||
| CRM | 0.004 | 0.023 | 0.014 | 0.002 | 0.009 | −0.001 | 0.002 | 0.009 | 0.011 | 0.010 | ||
| CE | 0.998 | 0.979 | 0.988 | 0.999 | 0.992 | 0.999 | 0.999 | 0.993 | 0.992 | 0.994 | ||
| Cumulative infiltration model | Lewis | K | 3.347 | 3.160 | 3.697 | 4.891 | 6.067 | 8.636 | 7.631 | 5.646 | 4.812 | 3.697 |
| α | 0.361 | 0.366 | 0.322 | 0.273 | 0.234 | 0.150 | 0.162 | 0.231 | 0.267 | 0.322 | ||
| MAE | 0.511 | 0.879 | 0.989 | 1.149 | 1.284 | 0.303 | 0.472 | 0.734 | 0.933 | 0.989 | ||
| RRMSE | 0.057 | 0.084 | 0.094 | 0.092 | 0.090 | 0.034 | 0.042 | 0.061 | 0.081 | 0.094 | ||
| CRM | 0.006 | 0.010 | 0.009 | 0.007 | 0.006 | −0.001 | 0.000 | 0.003 | 0.005 | 0.009 | ||
| CE | 0.984 | 0.969 | 0.957 | 0.953 | 0.947 | 0.984 | 0.977 | 0.973 | 0.960 | 0.957 | ||
| Philip | S | 1.878 | 1.723 | 1.56 | 1.489 | 1.338 | 1.192 | 1.234 | 1.385 | 1.489 | 1.56 | |
| MAE | 0.901 | 1.238 | 1.624 | 2.262 | 2.986 | 3.085 | 2.796 | 2.185 | 1.986 | 1.624 | ||
| RRMSE | 0.098 | 0.123 | 0.153 | 0.181 | 0.21 | 0.224 | 0.225 | 0.182 | 0.173 | 0.153 | ||
| CRM | 0.03 | 0.039 | 0.052 | 0.067 | 0.082 | 0.087 | 0.084 | 0.067 | 0.061 | 0.052 | ||
| CE | 0.953 | 0.935 | 0.888 | 0.815 | 0.713 | 0.317 | 0.345 | 0.753 | 0.818 | 0.888 | ||
| Horton | a | 0.141 | 0.108 | 0.083 | 0.061 | 0.043 | 0.031 | 0.04 | 0.052 | 0.066 | 0.083 | |
| b | 6 | 6 | 5.6 | 8.4 | 10 | 9.7 | 9.2 | 8.8 | 6.6 | 5.6 | ||
| c | 1.075 | 0.996 | 0.849 | 1.003 | 1.007 | 0.858 | 0.945 | 1.004 | 0.84 | 0.849 | ||
| MAE | 1.154 | 1.098 | 1.529 | 1.81 | 2.133 | 2.541 | 2.4 | 1.723 | 1.757 | 1.529 | ||
| RRMSE | 0.148 | 0.136 | 0.168 | 0.168 | 0.177 | 0.216 | 0.219 | 0.177 | 0.177 | 0.168 | ||
| CRM | 0.004 | 0.003 | 0.007 | 0.004 | 0.004 | 0.003 | 0.005 | 0.004 | 0.006 | 0.007 | ||
| CE | 0.892 | 0.92 | 0.865 | 0.841 | 0.797 | 0.363 | 0.381 | 0.768 | 0.81 | 0.865 | ||
| Application Rate (%) | Maximum Mixing Depths (cm) | ||||||||||
|---|---|---|---|---|---|---|---|---|---|---|---|
| Treatments | CK | 0.15 | 0.3 | 0.45 | 0.6 | 10 | 20 | 30 | 40 | 50 | |
| Black | F | 5.89 | 6.7 | 6.96 | 6.06 | 5.58 | 5.8 | 6.45 | 6.27 | 7.15 | 6.96 |
| B | 5.22 | 4.62 | 4.2 | 5.23 | 6.12 | 6.29 | 5.89 | 5.16 | 4.94 | 4.2 | |
| MAE | 2.75 | 2.54 | 2.56 | 2.47 | 2.21 | 2.23 | 2.45 | 2.39 | 2.7 | 2.56 | |
| RRMSE | 0.13 | 0.13 | 0.14 | 0.12 | 0.1 | 0.1 | 0.11 | 0.12 | 0.13 | 0.14 | |
| CRM | 0 | 0 | 0 | 0 | 0 | 0 | 0 | 0 | 0 | 0 | |
| CE | 0.88 | 0.87 | 0.85 | 0.9 | 0.94 | 0.94 | 0.92 | 0.91 | 0.88 | 0.85 | |
| Rose | C | −0.63 | −0.66 | −0.67 | −0.61 | −0.57 | −0.58 | −0.64 | −0.62 | −0.7 | −0.67 |
| D | 9.69 | 9.41 | 9.15 | 9.67 | 10.21 | 10.51 | 10.56 | 9.68 | 10.07 | 9.15 | |
| MAE | 1.21 | 1.17 | 1.21 | 0.96 | 0.72 | 0.7 | 0.8 | 0.92 | 1.11 | 1.21 | |
| RRMSE | 0.07 | 0.06 | 0.07 | 0.05 | 0.04 | 0.04 | 0.05 | 0.05 | 0.06 | 0.07 | |
| CRM | −0.01 | −0.01 | −0.01 | −0.01 | −0.01 | −0.01 | −0.01 | −0.01 | −0.01 | −0.01 | |
| CE | 0.97 | 0.97 | 0.96 | 0.98 | 0.99 | 0.99 | 0.98 | 0.98 | 0.97 | 0.96 | |
| Application Rate (%) | Maximum Mixing Depths (cm) | D+ | D− | Scores | Ranking |
|---|---|---|---|---|---|
| 0.00 | 50 | 0.65 | 0.67 | 0.51 | 3 |
| 0.15 | 50 | 0.51 | 0.60 | 0.54 | 2 |
| 0.30 | 50 | 0.42 | 0.69 | 0.62 | 1 |
| 0.45 | 50 | 0.53 | 0.54 | 0.51 | 4 |
| 0.60 | 50 | 0.71 | 0.62 | 0.47 | 5 |
| 0.30 | 10 | 0.96 | 0.06 | 0.06 | 9 |
| 0.30 | 20 | 0.90 | 0.11 | 0.11 | 8 |
| 0.30 | 30 | 0.70 | 0.35 | 0.33 | 7 |
| 0.30 | 40 | 0.58 | 0.45 | 0.44 | 6 |
| 0.30 | 50 | 0.42 | 0.69 | 0.62 | 1 |
Disclaimer/Publisher’s Note: The statements, opinions and data contained in all publications are solely those of the individual author(s) and contributor(s) and not of MDPI and/or the editor(s). MDPI and/or the editor(s) disclaim responsibility for any injury to people or property resulting from any ideas, methods, instructions or products referred to in the content. |
© 2023 by the authors. Licensee MDPI, Basel, Switzerland. This article is an open access article distributed under the terms and conditions of the Creative Commons Attribution (CC BY) license (https://creativecommons.org/licenses/by/4.0/).
Share and Cite
He, Z.; Liang, J.; Lu, Y.; Yang, Q.; Lu, C.; Wu, D. Enhanced Soil Moisture Management Using Waste Green Algae-Derived Polymers: Optimization of Application Rate and Mixing Depth. Agronomy 2023, 13, 2335. https://doi.org/10.3390/agronomy13092335
He Z, Liang J, Lu Y, Yang Q, Lu C, Wu D. Enhanced Soil Moisture Management Using Waste Green Algae-Derived Polymers: Optimization of Application Rate and Mixing Depth. Agronomy. 2023; 13(9):2335. https://doi.org/10.3390/agronomy13092335
Chicago/Turabian StyleHe, Zijian, Jiaping Liang, Yanwei Lu, Qiliang Yang, Chengmei Lu, and Die Wu. 2023. "Enhanced Soil Moisture Management Using Waste Green Algae-Derived Polymers: Optimization of Application Rate and Mixing Depth" Agronomy 13, no. 9: 2335. https://doi.org/10.3390/agronomy13092335
APA StyleHe, Z., Liang, J., Lu, Y., Yang, Q., Lu, C., & Wu, D. (2023). Enhanced Soil Moisture Management Using Waste Green Algae-Derived Polymers: Optimization of Application Rate and Mixing Depth. Agronomy, 13(9), 2335. https://doi.org/10.3390/agronomy13092335