Article

Effects of Drought Hardening and Saline Water Irrigation on the Growth, Yield, and Quality of Tomato

1
College of Agricultural Science and Engineering, Hohai University, Nanjing 210098, China
2
Nanjing Water Planning and Designing Institute Co., Ltd., Nanjing 210098, China
*
Author to whom correspondence should be addressed.
Agronomy 2023, 13(9), 2351; https://doi.org/10.3390/agronomy13092351
Submission received: 12 August 2023 / Revised: 1 September 2023 / Accepted: 8 September 2023 / Published: 10 September 2023
(This article belongs to the Special Issue Saline Water Irrigation in Agriculture)

Abstract

:
Drought hardening could promote the development of plant roots, potentially improving the resistance of crops to other adversities. To investigate the response and resistance of physiological and growth characteristics induced by drought hardening to salt stress in the later stages, a greenhouse experiment was carried out from 2021 to 2022 with one blank control treatment and twelve treatments that comprised combinations of four irrigation regimes (W1 = 85%, W2 = 70%, W3 = 55%, and W4 = 40% of the field capacity) and three irrigation water salinity levels (S2, S4, and S6, referring to 2 g, 4 g, and 6 g of sodium chloride added to 1000 mL of tap water, respectively). The results show that saline water irrigation introduced a large amount of salt into the soil, resulting in the deterioration of tomato growth, physiology, yield, and water use efficiency (WUE), but had a positive, significant effect on fruit quality. When the irrigation water salinity was 2 g L−1, the W2 treatment could reduce soil salt accumulation, even at the end of the maturation stage; consequently, enhancing the increments in plant height and leaf area index during the whole growing stage. The physiological activity of tomato plants under the W2 and W3 treatments showed a promoting effect. Correspondingly, the maximum values of the fruit quality of tomato plants irrigated with the same saline water were all obtained with the W2 or W3 treatment. However, the yield and WUE of the W3 treatment were lower than that of the W2 treatment, which was the highest among the same saline water irrigation treatments, consistent with the reflection of the changing trend of the ratio of fresh weight to dry weight. Overall, drought hardening can be considered an economically viable approach to mitigate the hazards of saline water irrigation, and the W2S2 combination is recommended for tomato production due to the maximum values of yield and WUE with a higher fruit quality among the twelve saline water irrigation treatments.

1. Introduction

Faced with a sharp increase in the world’s population, the frequent occurrence of extreme weather, and unchecked environmental pollution and resource waste, the shortage of water resources has become increasingly prominent [1]. Furthermore, the continuous deepening of urbanization and industrialization has intensified the competition among industries for water use [2]. Consequently, it is difficult for existing freshwater resources to meet the water needs of agriculture, a traditional large-scale water-using industry, forcing attention to turn to opening up new available water sources, i.e., saline water, which is rich in reserves and easy to exploit and utilize. However, while saline water irrigation replenishes the soil with water, it also carries a large amount of salt into the soil [3]. Thus, a series of problems caused by a massive accumulation of soil salt at a fast speed occurs, such as soil salinization, plant physiological drought, ion toxicity, and micropopulation decline, decreasing crop yield and quality [4,5,6,7]. Therefore, how to take advantage of saline water scientifically, reasonably, efficiently, and safely to ensure drought resistance and yield increase in agriculture has become a particularly highlighted and crucial issue.
Increases in soil salinity are determined by the irrigation water salinity, irrigation frequency, and irrigation quota. From this point of view, many efforts have been made to explore rational irrigation regimes to alleviate the negative effects of saline water irrigation [8,9,10]. Typically, the method of using saline water in practical production is to mix it with freshwater to achieve the goal of reducing the salinity of water for irrigation [11]. In recent years, alternating irrigation between saline water and freshwater has been considered a better choice due to the reduced frequency of saline water irrigation and the salt-leaching effect of the subsequent freshwater irrigation [12]. Similarly, period-specific saline water irrigation has been proposed, i.e., plants are irrigated with saline water only during their relatively salt-resistant growth stage in order to further weaken the disadvantages [13]. These irrigation regimes still have a demand for freshwater resources, so some researchers have turned their attention to combining saline water irrigation with soil improvement [14], efficient water-saving irrigation technologies [15], aeration for oxygen enrichment [16], magnetization [17], and ionization activation [18]. These measures have a high cost of supporting equipment or materials, and thus, have not been widely applied. In contrast, tapping the potential resistance to adversity of crops could be an economical and effective way to improve crop yield and quality under stress due to the ability to sense external stimuli and then actively adjust the metabolism to adapt to growth in a new environment [19]. However, most of the previous studies have focused on external technical means and have neglected to reduce the toxicity of saline water irrigation from the perspective of crop anti-stress potential, which has been rarely reported to date.
Drought hardening, known as the ‘hardening of seedlings’ in cultivation practice, is one of the means used to exploit the potential of crops to resist adversity, that is, consciously controlling the water supply in the seedling stage when plants have plasticity [20]. Previous studies have proven that drought hardening could promote the development of plant roots and improve their drought resistance in the later stage while giving the crop enough time to return to normal growth and avoid reducing yield and quality [21,22,23]. Many studies have pointed out that after experiencing one kind of adversity, crops not only improve their resistance to such stress but also improve their resistance to other adversities, exhibiting the characteristics of cross-resistance [24,25,26]. Shao et al. [27] found that drought hardening enhanced the waterlogging resistance of tomato after anthesis by developing avoidance mechanisms based on the leaf water status (stomatal closure and leaf epinasty), reflected by the improvement in fruit quality and the obvious effect on tomato yield recovery. Similarly, Guo et al. [28] reported that drought hardening could induce maize’s cross-resistance to low-temperature stress. It seems that drought hardening at the seedling stage could also enhance the ability of tomatoes to resist salt stress caused by saline water irrigation.
Drought and salinity are the most common coexisting abiotic stress factors. It is generally accepted that the combined effects of drought and salinity stress are more detrimental to crop growth and yield than the separate, individual effects of each stress [29,30,31]. Compared to either salinity or drought stress conditions alone, the increased negative effects of treatments where the two stress factors were applied together were reported by Ors et al. [32] on plant growth, photosynthetic activity, nutrient element content, and chlorophyll amount in tomato seedlings. Li et al. [33] indicated that stomatal regulation was more likely to result in lower stomatal conductance than the net photosynthetic rate under appropriate reduced irrigation when subjected to salinity stress. Yang et al. [34] found that simultaneous water and salt stress aggravated a decline in yield, but mild drought at a certain salinity level can promote fruit osmotic adjustment, thereby improving tomato fruit quality. At present, many physiological studies have focused on single stress-resistant traits of crops to drought or salt [35,36,37], while research on the cross-resistance of drought and salt is relatively insufficient. In particular, the physiological and growth characteristics of drought-hardened crops are less reported on the response and resistance to salt stress. Does the stress resistance induced by drought hardening show synergistic or antagonistic effects after superposition with salt stress in the later stages? What is the mechanism of the combination of the two on yield and quality, and how can it be used to achieve outcomes of good quality and high yield as much as possible under saline water irrigation? For these questions, tomatoes cultivated in a facility were taken as the research object, and combined treatments of drought hardening at the seedling stage and saline water irrigation from flowering to harvest were set up to investigate their effects on the production of tomato, including its physiology, yield, water use efficiency (WUE), and fruit quality.

2. Materials and Methods

2.1. Experimental Site

The study was conducted in a plastic greenhouse in the water-saving park of Hohai University, Nanjing, Jiangsu Province, China (31°57′ N, 118°50′ E). The site is located in the subtropical monsoon climate zone, influenced by the East Asia Monsoon [38]. The multi-year average precipitation is 1061.1 mm, over 60% concentrating in the flood season (May to September). The annual average temperature is 15 °C, with the maximum temperature is 43 °C, and the minimum temperature is 14 °C. The mean annual sunshine duration is 2146 h, the mean annual evapotranspiration is 950.1 mm, the average wind speed is 3.5 m s−1, and the average frost-free period is 231 days.

2.2. Experimental Design

In order to evaluate the effects of drought hardening combined with saline water irrigation on tomato growth, the study was carried out over two growing seasons: 4 April to 10 July in 2021 and 30 March to 1 July in 2022. The tomato plants were grown in 39 pots (one plant in each pot) with a top and bottom diameter of 39.5 cm and 30.0 cm, respectively, and a depth of 49.5 cm. Each pot was filled with 38 kg of clay loam, taken from the surface layer (0–20 cm) of the experimental plot in the water-saving park. The bulk density, pH, porosity, and field water-holding capacity of the soil are 1.38 g cm−3, 6.97, 44.97%, and 26.40%, respectively.
Two weeks after transplanting, the tomato plants were subjected to four irrigation regimes until the end of the seedling stage: 85% (W1: well-watered), 70% (W2: light drought), 55% (W3: moderate drought), and 40% (W4: severe drought) of the field water-holding capacity (FC). From 50% of plants flowering to harvest, tomatoes were well-watered (85% FC) with water of three different salinity: 2 g L−1 (S2), 4 g L−1 (S4), and 6 g L−1 (S6) of sodium chloride (NaCl). NaCl was mixed with tap water to obtain the irrigation water with an intended level of salinity. The plants well-watered (85% FC) with tap water (no NaCl addition) during the whole growing period were set as the control treatment (CK). Consequently, the pot experiments contained 13 treatments in total (CK, W1S2, W1S4, W1S6, W2S2, W2S4, W2S6, W3S2, W3S4, W3S6, W4S2, W4S4, W4S6), using a completely randomized design with 3 replicates per treatment.

2.3. Agronomic Practices

The tomato (Lycopersicon esculentum Mill. ‘Dongfangmei’) used in the experiment is a hybrid variety of the pink tomato that grows indefinitely. The seedlings reaching the four-leaf stage were purchased from the Institute of Vegetable Science of Nanjing City; then, the ones that grew well and developed uniformly were selected to be transplanted on 4 April 2021 and 30 March 2022. To ensure the seedling establishment, a compound fertilizer NPK (15:15:15) was applied and mixed into the soil (0–10 cm) at the rate of 750 kg ha−1 in each pot following local conventional practice before transplanting; then, each tomato plant was irrigated with an appropriate and equal amount of water during two weeks after transplanting. Since the beginning of drought-hardening treatments, the tomato plants were irrigated every two days or as necessary (depending on weather and soil conditions) to compensate for the water loss determined by the weighing method [39].
The growing period of the tomato plants was divided into three stages: seedling stage (from transplanting to 50% of plants flowering), developmental stage (from 50% of plants flowering to 50% of plants fruiting), and maturation stage (from 50% of plants fruiting to harvest). During both growing seasons, apart from two main lateral branches, all new side branches were removed weekly to allow the plants to form the ‘V’ trellising shape while the central branches at the top were pinched off at the beginning of the maturation stage. A 2 m high stick penetrated 10 cm into the soil to support the tomato plants in each pot. The weeding and pest control measures were consistent with those taken by local farmers.

2.4. Measurements of Soil Salinity

For the analysis of soil salt content, soil samples were collected from depths of 0–15 cm, 15–30 cm, and 30–45 cm near crop roots for each replicate pot at the end of each growth stage during both growing seasons. The naturally air-dried soil samples were ground well to pass through a 1-mm mesh before being extracted at a soil-to-water ratio of 1:5 [40]. Electrical conductivity (EC) was assayed with the help of a conductivity meter (DDS-307A; Rex, Shanghai, China).

2.5. Measurements of Growth and Physiological Parameters

For each replicate pot, the plant height (PH), stem diameter (SD), and leaf area index (LAI) were measured once a week until the tomatoes were topped; then, their increments at each growth stage were calculated to obtain the sum. After collecting the fresh plant samples at harvest, the roots, stems, and leaves were washed and dried to obtain the fresh weight (FW). Then, they were carefully separated into a single paper bag and dried to a constant weight in an oven at 75 °C to obtain the dry weight (DW).
For the analysis of the leaf photosynthesis and chlorophyll content, a fully unfolded, well-lit, and healthy leaf was selected on a clear and cloudless morning (from 9 a.m. to 12 a.m.) in the middle of the maturation stage for measurement [35]. The photosynthetic rate (A), transpiration rate (E), stomatal conductance (Gs), and intercellular carbon dioxide (CO2) concentration (Ci) were measured by a portable photosynthesis system (Li-Cor 6800; Li-Cor Inc., Lincoln, NE, USA), while the chlorophyll content, reflected by SPAD, was assayed using a chlorophyll meter (TYS-B; TOP Cloud-Agri Ltd., Hangzhou, China).

2.6. Measurements of Yield, WUE and Quality

During the harvest seasons, the tomato fruits were picked when reaching the mature grade color following practice [41]. After each picking, the fruit number was recorded for each replicate pot, and the weight and volume of each fruit were measured by the gravity method and ‘Archimedes drainage method’, respectively [10]. Through accumulation, the fruit yield (FY) and total fruit number (FN) of each tomato plant were obtained, and then the average fruit weight (AFW) and average fruit volume (AFV) for each treatment were calculated.
Since the experiment was conducted with pot planting in a greenhouse sheltered from the rain, there was no groundwater recharge and natural precipitation during the experiment and no deep seepage occurred during the irrigation process. According to the water balance equation, the computational formula of the water consumption for tomato plants during the entire growth period (ETa) can be simplified as follows:
ETa = I + ΔW
where I and ΔW were the amount of irrigation water and soil moisture variation during the whole growth stage, respectively. Correspondingly, the WUE was calculated as the ratio of FY to ETa.
For each treatment, 10 ripe fruits were selected randomly and then homogenized by a fruit blender to measure the common tomato quality traits, including the contents of total soluble solids (TSS), total soluble sugar (TS), titratable acid (TA), and vitamin C (VC). The TSS content was measured by a portable digital refraction refractometer (ACT-1E; ATAGO CO., Ltd., Tokyo, Japan). The contents of TS, TA, and VC were assessed using the standard analytical procedures of sulfuric acid-anthrone colorimetry, sodium hydroxide titration, and 2,6-dichloroindophenol titration, respectively [42].

2.7. Statistical Analysis

The resulting data were processed using Excel 2019 (Microsoft Corporation, Washington, DC, USA), while OriginPro 9.1 (OriginLab Corporation, Northampton, MA, USA) was used for mapping. The data in the graph or table of each variable were presented as the mean of three replicates ± standard deviation (S.D.) With the help of SPSS statistics 25 (IBM, Armonk, NY, USA), the significance among the treatments was analyzed via the Least Significant Difference (LSD) test at p ≤ 0.05 and multi-way analysis of variance (ANOVA) was carried out to check the significant effects of the treatment factors and their interactions at p ≤ 0.05, 0.01 and 0.001.

3. Results

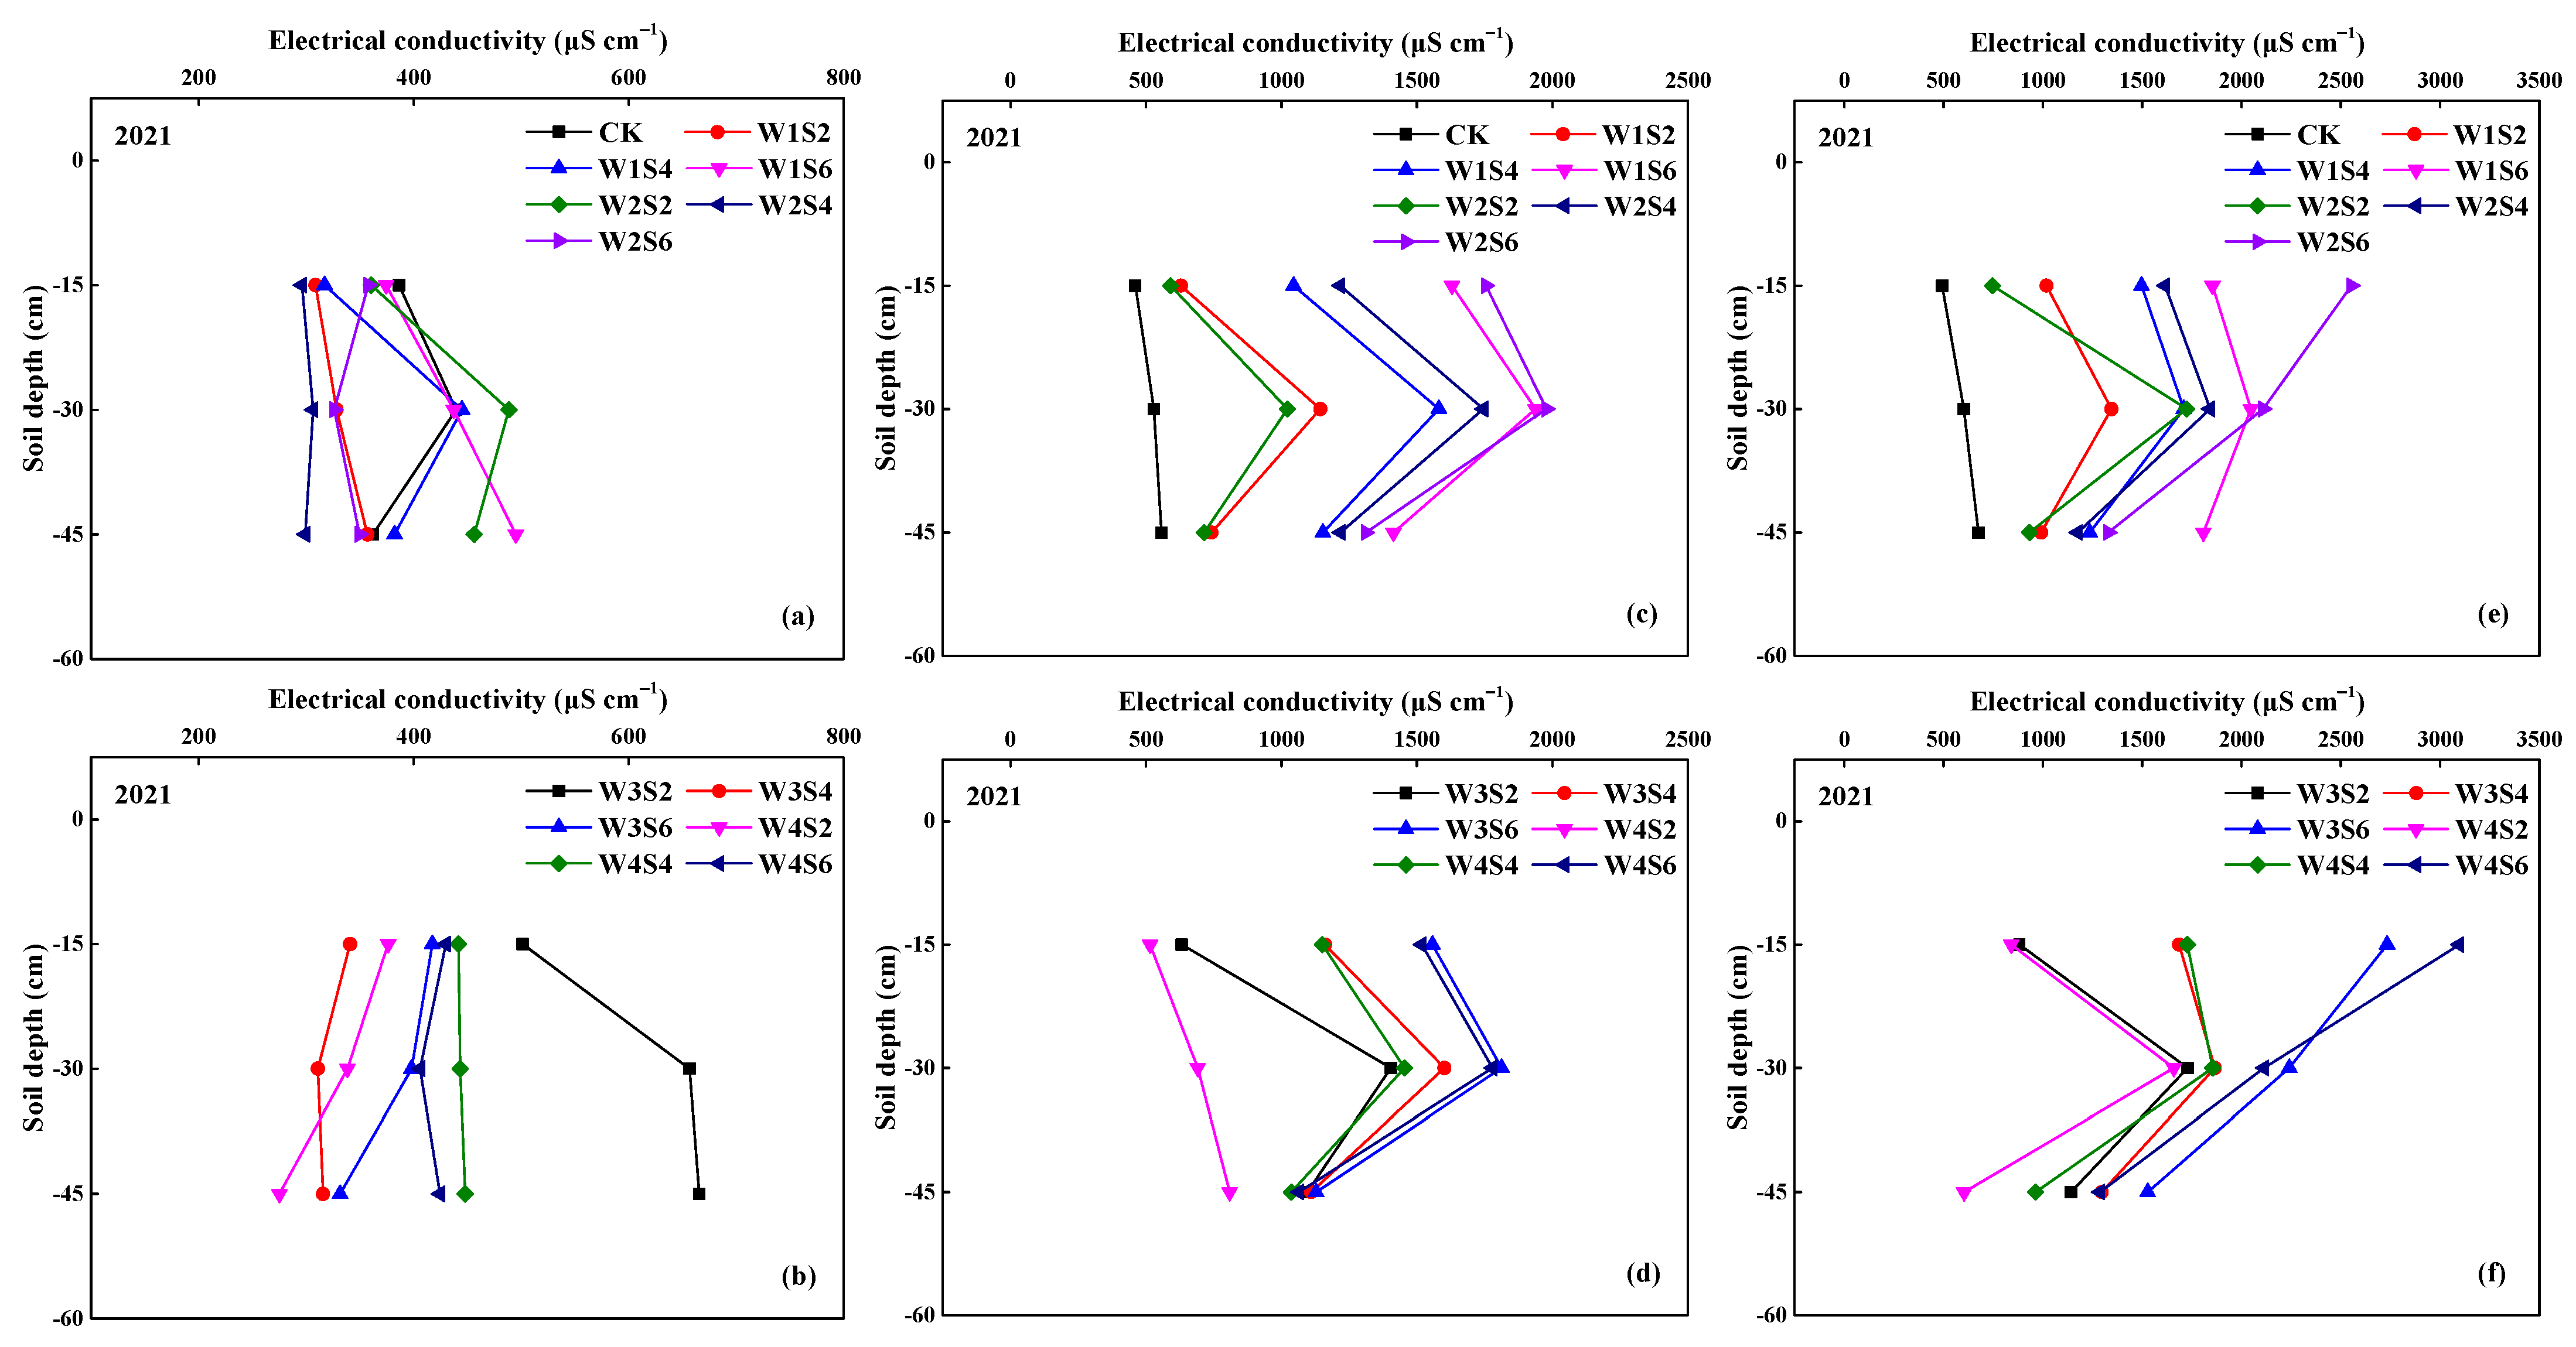
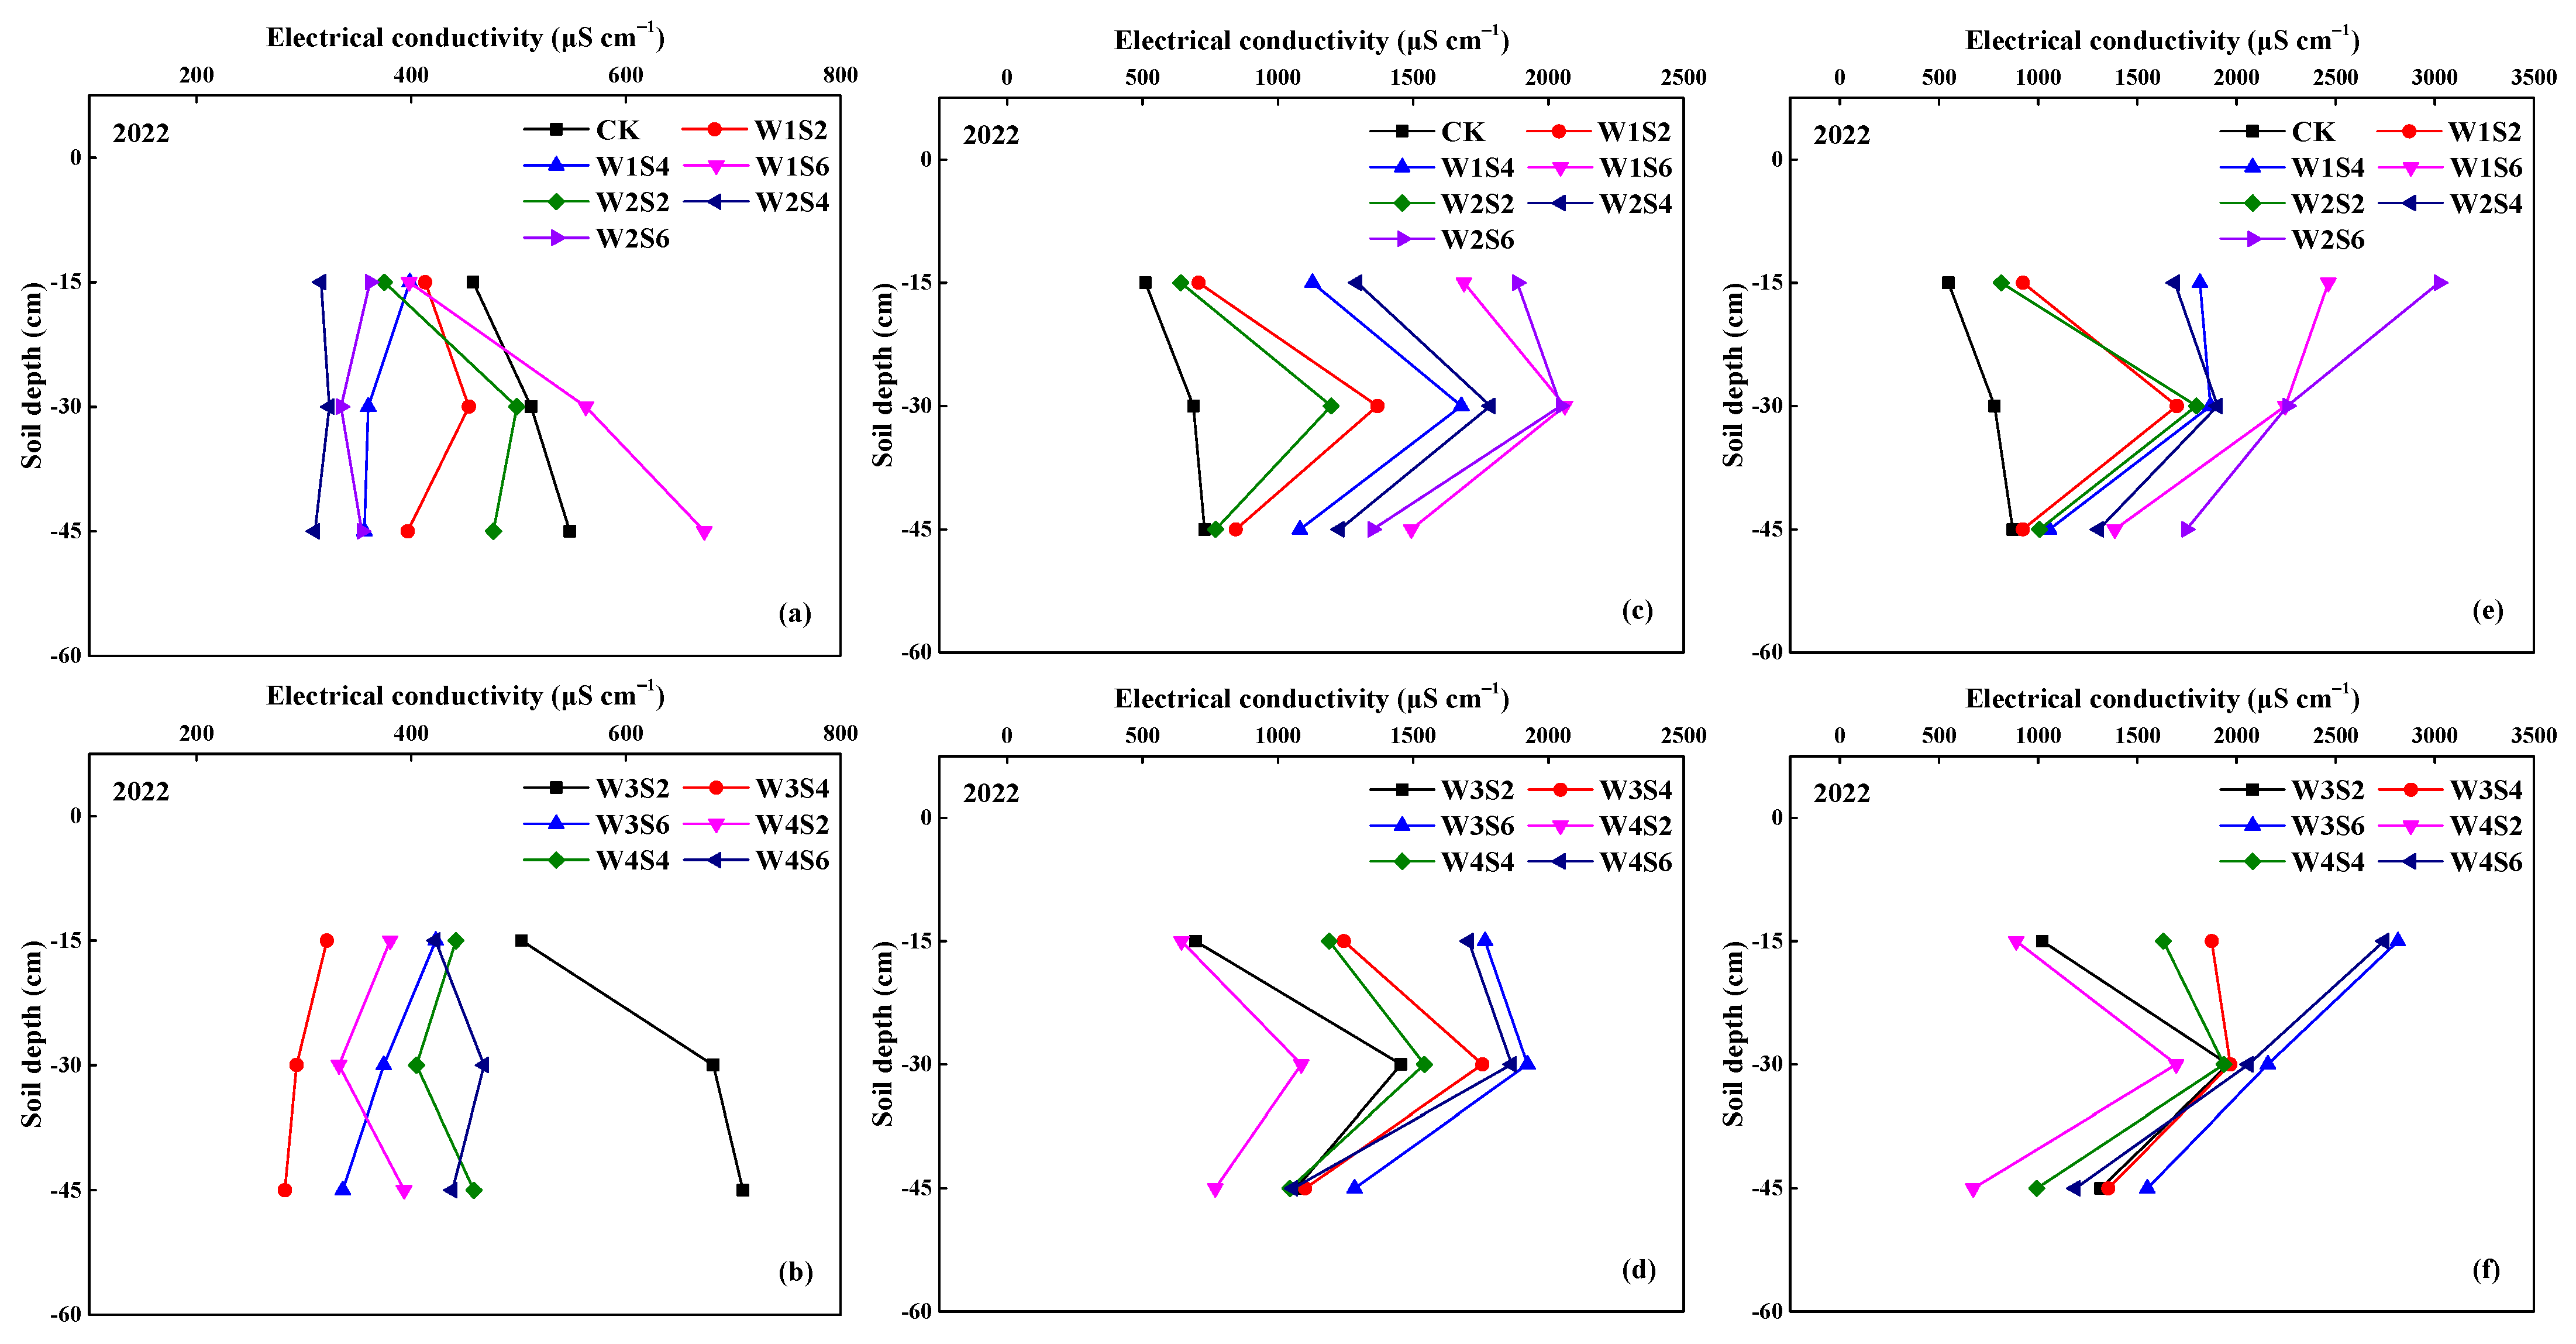
3.1. Soil Salinity (EC)

Figure 1 and Figure 2 illustrate the distribution of soil salinity (EC) in the 0–45 cm soil layer at the end of each growth stage during the growing seasons. At the end of the seedling stage, the soil EC ranged from 296.0 μS cm−1 to 665.7 μS cm−1 in 2021 and from 310.3 μS cm−1 to 709.0 μS cm−1 in 2022. There was no significant difference in the soil EC among the treatments or soil layers, indicating that drought stress had an insignificant effect on soil salt distribution at this period.
In the following the developmental stage, the tomato plants began to be irrigated with saline water, soil salinity gradually accumulated until harvest, and soil EC value increased with the increase in irrigation water salinity. Due to the upward migration of salt caused by the rapid evaporation of surface soil moisture, the EC in the 15–30 cm soil layer was 13.2% to 174.6% higher in 2021 and 29.1% to 152.0% higher in 2022 than that in the 30–45 cm soil layer. For all soil layers, when the salinity of the irrigation water was 4 g L−1, the value of soil EC under the W2 treatment was the highest at the end of the developmental stage in 2021 and 2022. However, the soil EC of the W2 treatment was smaller than that of the W1 and W3 treatment (an average decrease of 6.8% and 22.8% in 2021 and 10.2% and 17.8% in 2022, respectively), as the irrigation water salinity decreased to 2 g L−1.
Moreover, as saline water irrigation continued, the W2 treatment could still reduce the accumulation of salt in the soil. At the end of the maturation stage, when the irrigation water salinity was 2 g L−1, the result that the EC of the W2-treated soil was less than that of the W1 and W3 treatments still appeared in the 0–15 cm and 30–45 cm soil layers in 2021 and the 0–15 cm soil layer in 2022.

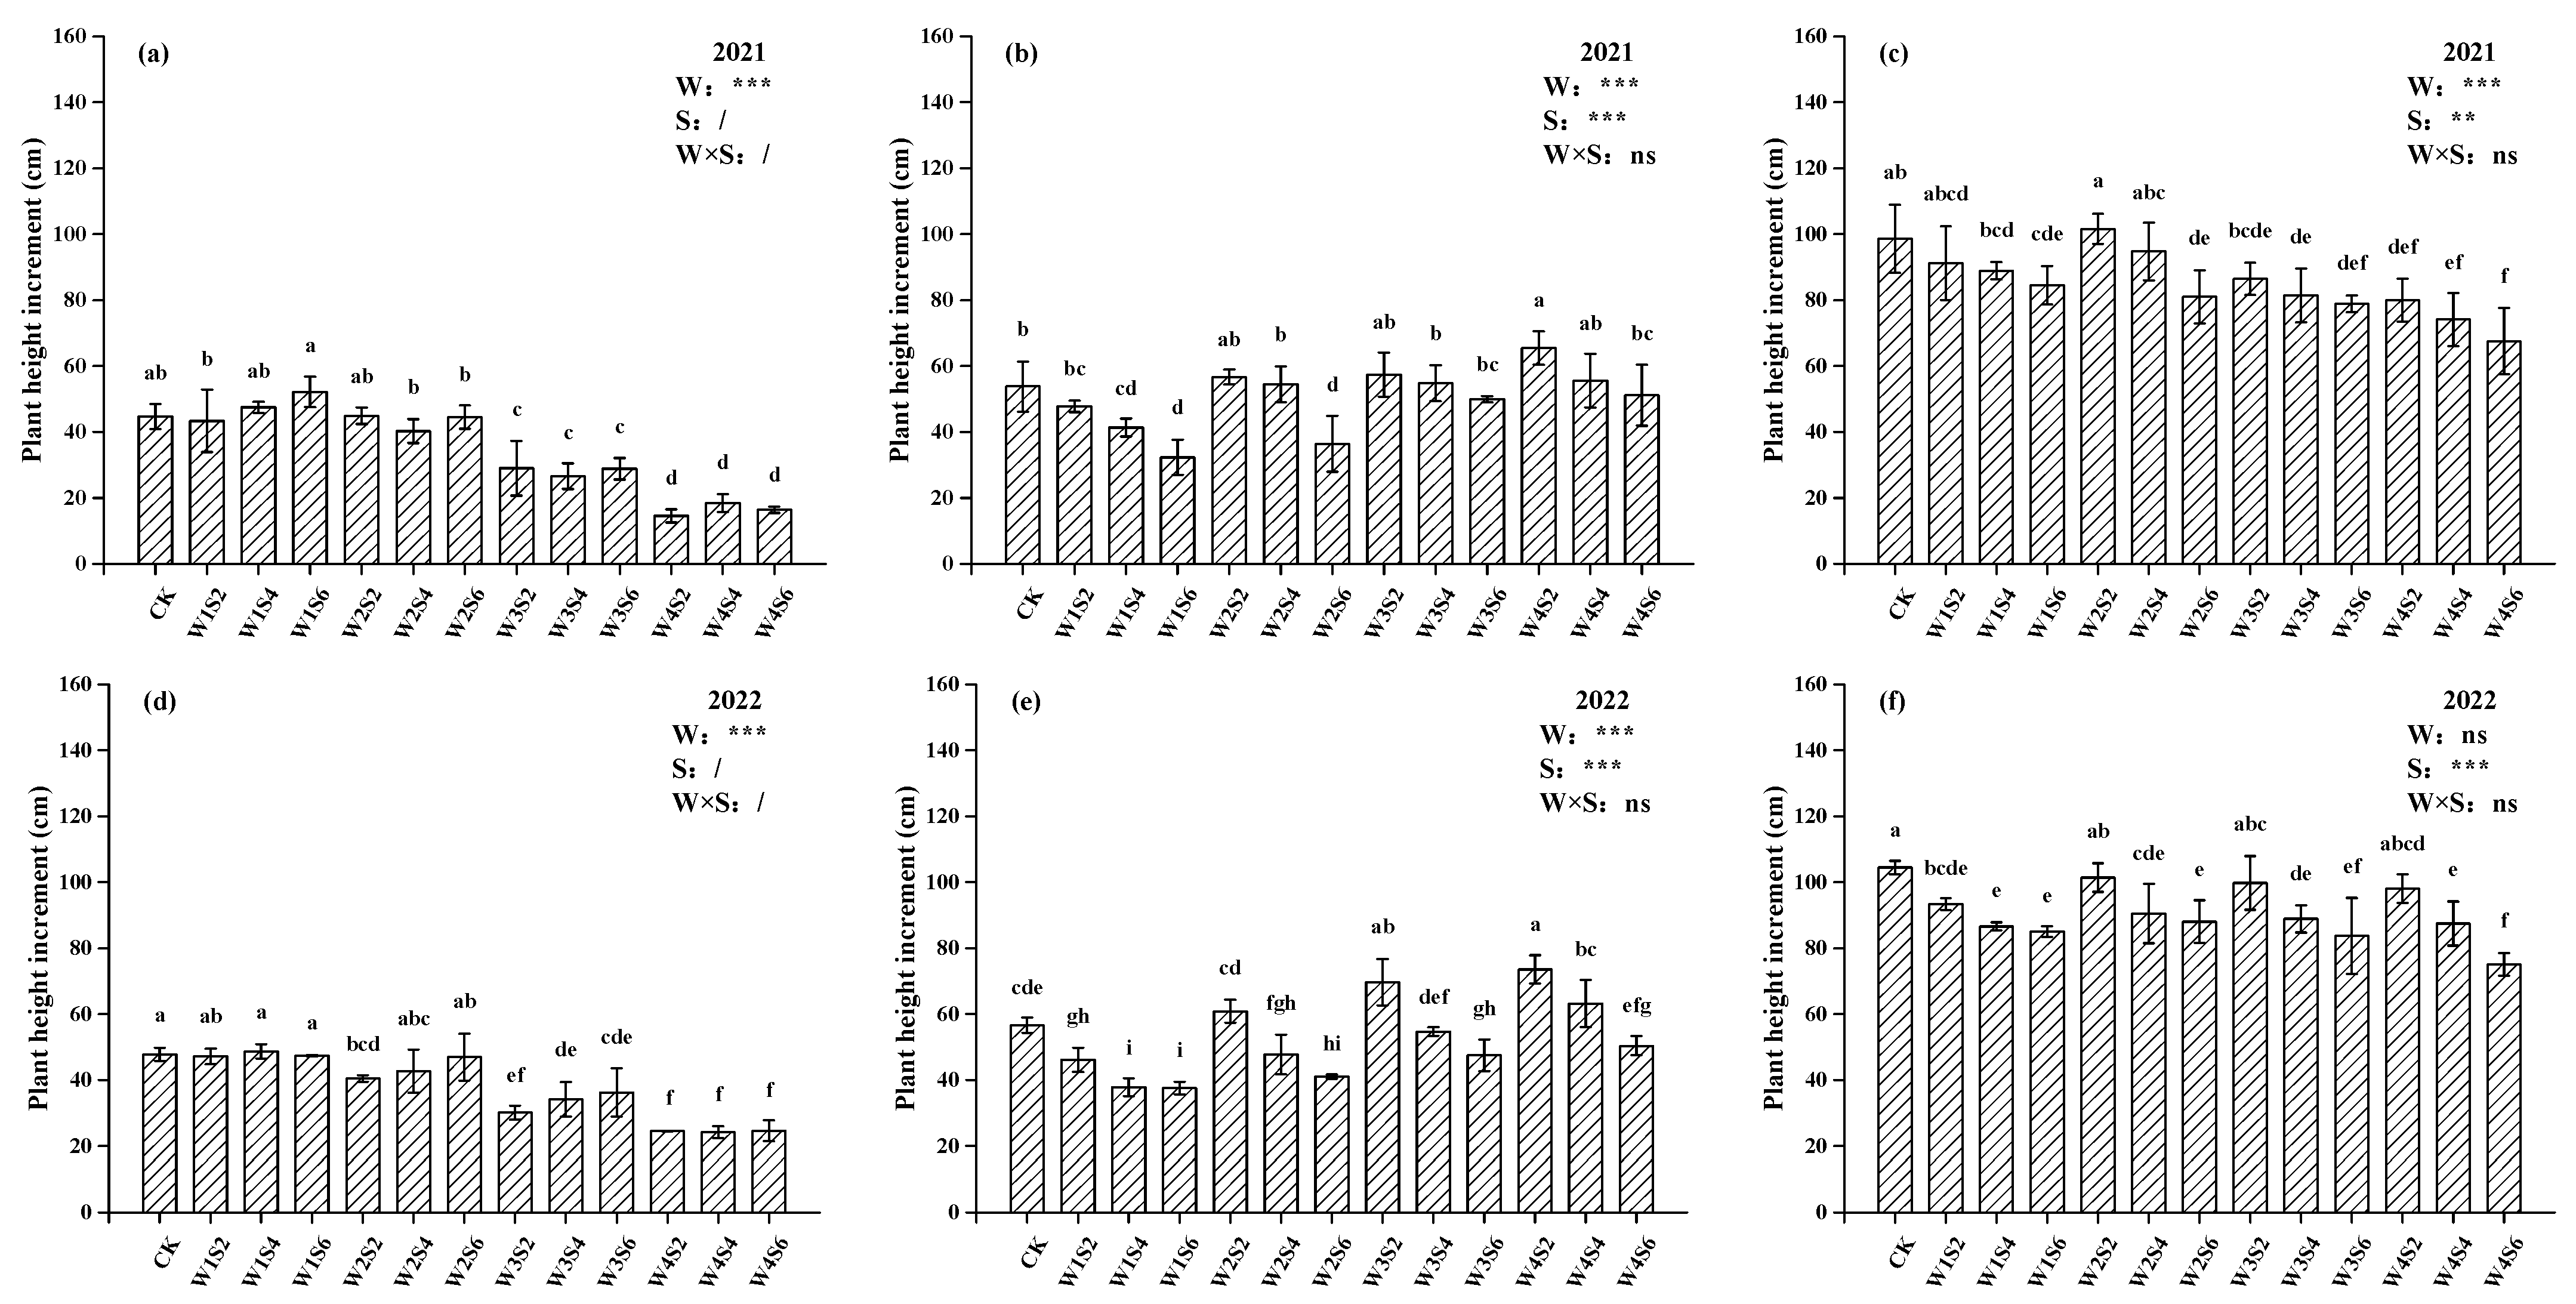
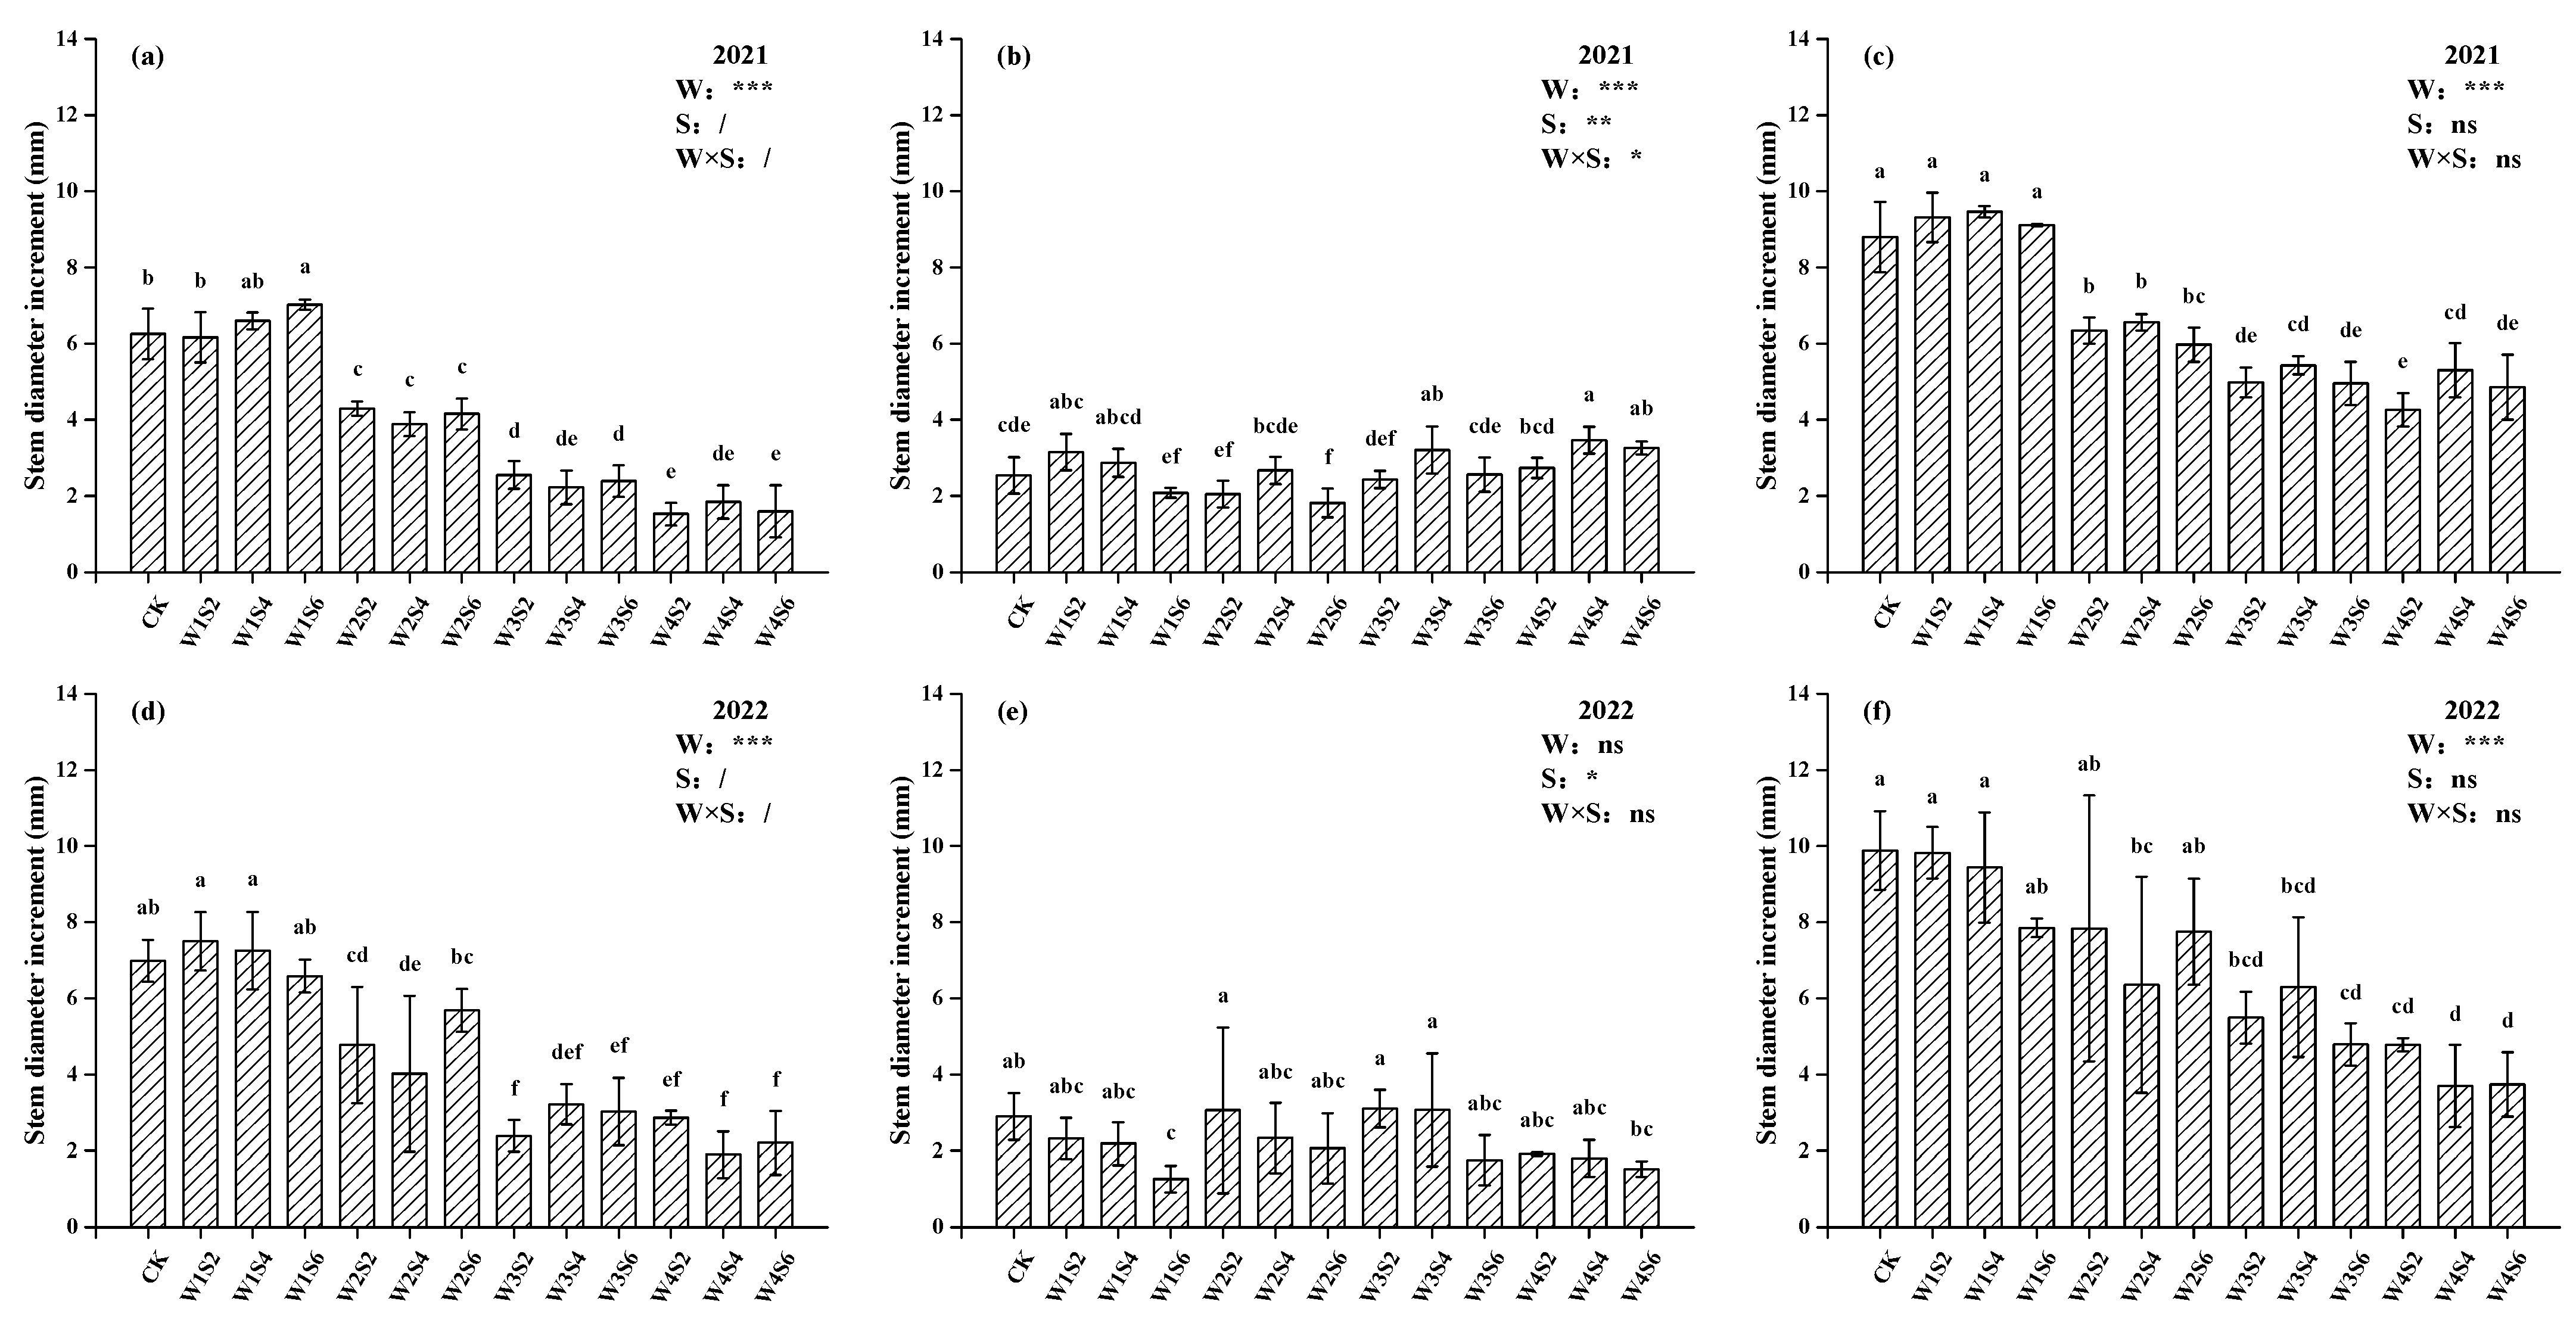
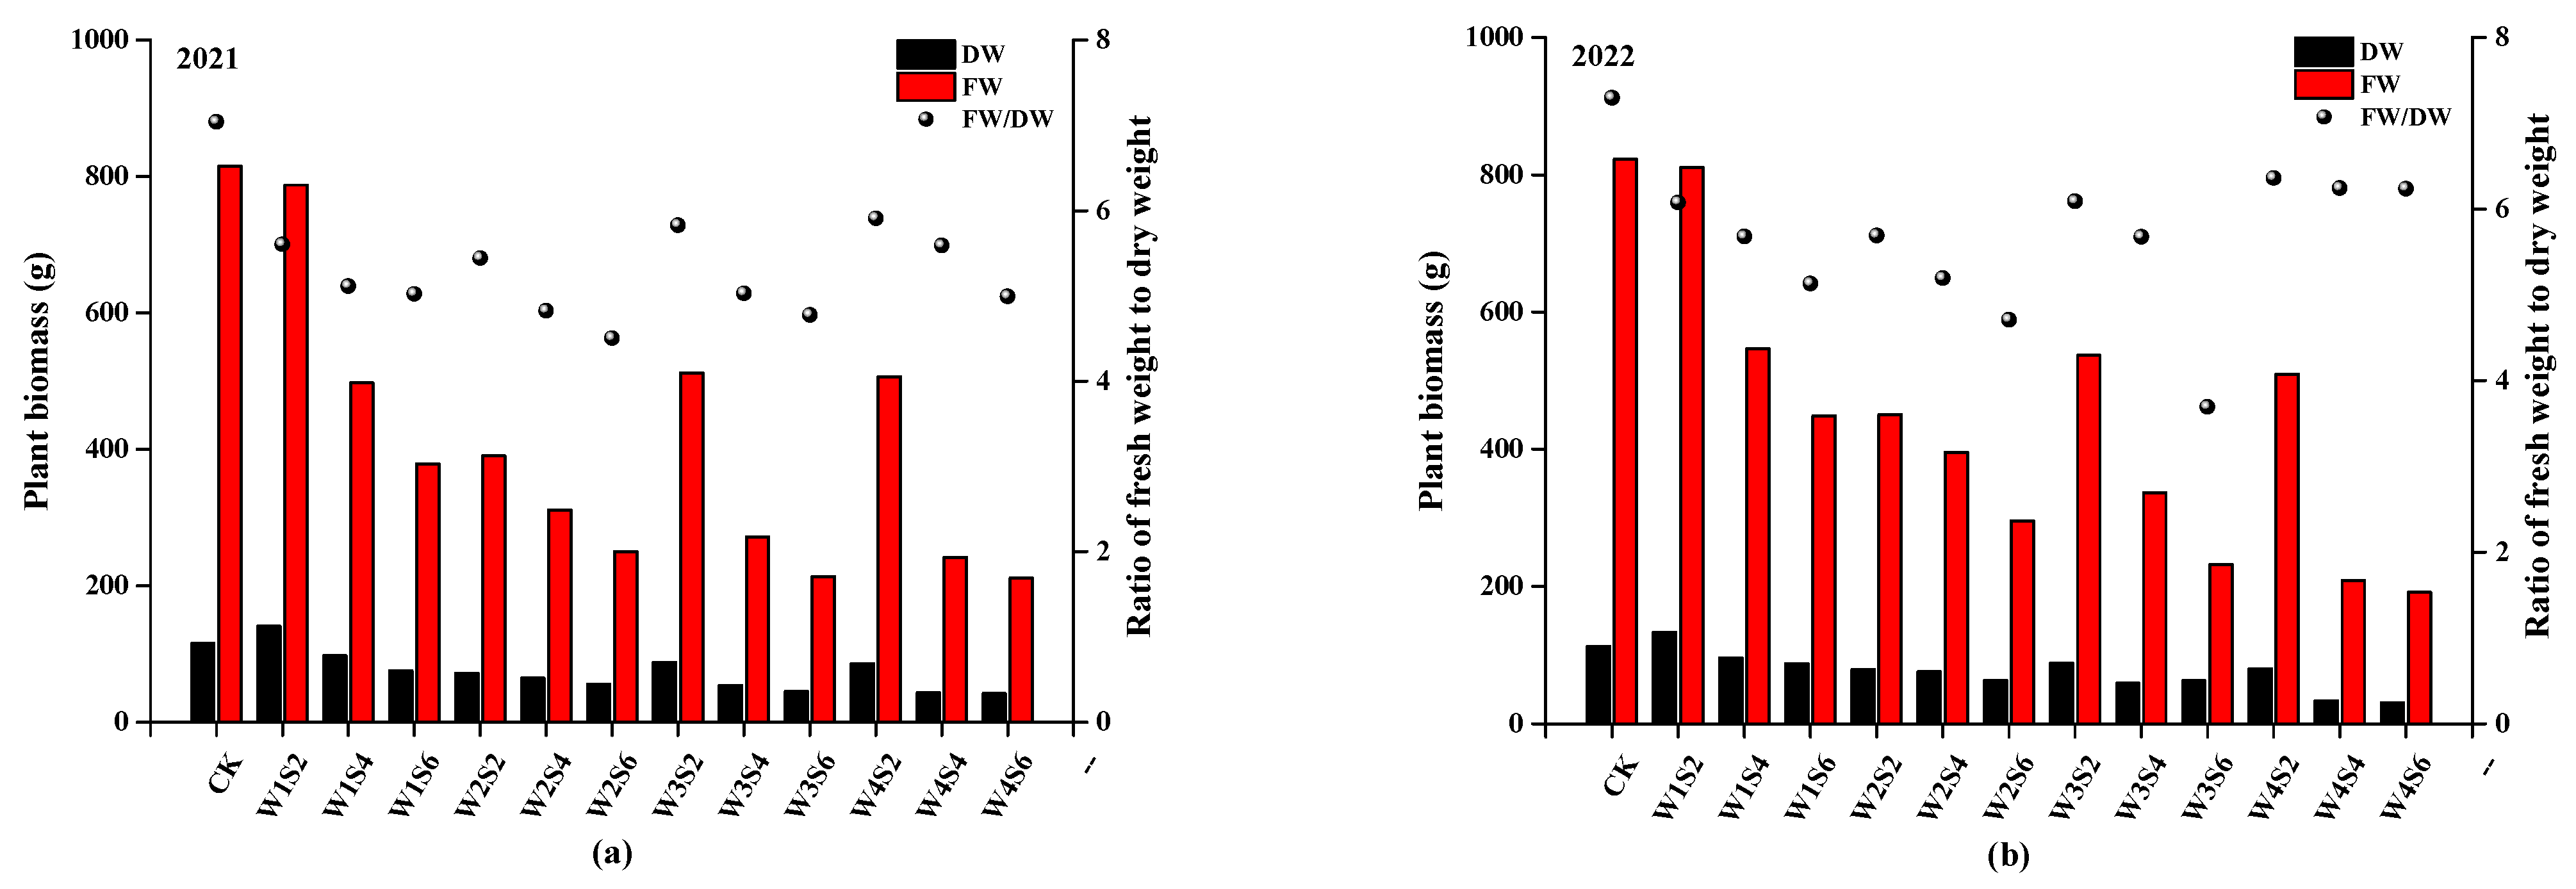
3.2. Growth Parameters

Figure 3, Figure 4 and Figure 5 show the changes in plant height (PH), stem diameter (SD), and leaf area index (LAI) of tomato plants from transplanting to pinching in 2021 and 2022. In general, drought hardening played a significant role in the performance of the increments in PH, SD, and LAI throughout the growth period. At the seedling stage, there was no significant difference among the treatments under the same drought stress, but the average increments of the same drought stress treatments decreased with the deepening of drought stress. The maximum values of the average increments (46.96 cm, 6.51 mm, and 1.17 in 2021 and 47.78 cm, 7.08 mm, and 1.69 in 2022, respectively) were obtained with the W1 treatment between the two years, which was significantly higher than that with the W2, W3, and W4 treatments in 2022, while in 2021, the difference in average increments in PH and LAI between the W1 and W2 treatments (an average decrease of 7.8% and 11.1%) was insignificant.
With the end of the drought-hardening treatments, the PH, SD, and LAI of tomato plants treated with W3 and W4 increased sharply at the developmental stage. The increase in these parameters was 1.31 to 4.48 times, 0.58 to 2.04 times, and 1.00 to 3.05 times that of the seedling stage, respectively, which was much greater than that of the W1 and W2 treatments. However, saline water irrigation at this period brought much salt into the soil, thereby inhibiting the growth of crops. Saline water irrigation showed a negative significant effect on the increments in PH, SD, and LAI. The greater the salinity of the irrigation water, the smaller increments in these growth parameters, except for the SD in 2021. In 2021, the increment in SD of the tomatoes treated with S2 was the highest under the W1 treatment (3.15 mm), while under other drought-hardening treatments, the highest increment in SD (2.67 mm, 3.21 mm, and 3.46 mm for the W2, W3, and W4 treatments, respectively) was found when tomato plants were irrigated with water with a salinity of 4 g L−1.
For the increments in PH, SD, and LAI in the whole growth stage, the coupling effects of drought hardening and saline water irrigation were insignificant, while saline water irrigation showed significant effects on PH and LAI increments, presented by that greater irrigation water salinity contributed to smaller increases. Conversely, the effect of saline water irrigation on the SD increment was insignificant between the two years. Furthermore, suffering from the same drought hardening, the highest increment in SD was achieved with the S4 treatment in 2021 (9.46 mm, 6.56 mm, 5.43 mm, and 5.30 mm for the W1, W2, W3, and W4 treatments, respectively). When the salinity of irrigation water was the same, the SD increment decreased with the deepening of drought hardening in 2021 and 2022. However, when the irrigation water salinity was 2 g L−1 or 4 g L−1, the increments in PH and LAI of the W2-treated tomato plants were the highest in 2021. Similarly, the promotional effect of the W2 treatment was found on the PH increment in 2022 (an average increase of 8.6%, 4.5%, and 3.6% compared to the W1 treatment under the S2, S4, and S6 treatment, respectively).
Figure 6 demonstrates the responses of fresh weight (FW), dry weight (DW), and their ratio (FW/DW) to drought hardening and saline water irrigation. During the growing seasons, the CK treatment had the highest FW and FW/DW, 815.45 g and 7.04 in 2021 and 822.73 g and 7.30 in 2022, respectively, while the DW reached the maximum with W1S2 treatment, which was 21.3% larger than the CK treatment in 2021 and 18.2% larger than the CK treatment in 2022. With the increase in irrigation water salinity from 2 g L−1 to 6 g L−1, the DW of tomato plants under the same drought hardening decreased, as did the FW and FW/DW. When treated with S4 and S6, the greater the degree of drought hardening, the smaller the FW and DW. However, when the irrigation water salinity was 2 g L−1, the FW and DW of the W2 treatment were smaller than those of the W3 treatment, and the reductions were 23.7% and 18.3% in 2021, 16.1% and 10.2% in 2022. Similar results were observed for the FW/DW under different drought-hardening treatments, and most FW/DW minimums were obtained with the W2 treatment when the irrigation water had the same salinity.

3.3. Physiological Properties

Table 1 and Table 2 present the effects of drought hardening and saline water irrigation on photosynthetic characteristics (A, E, Gs, and Ci) and chlorophyll content (SPAD) of tomato plant leaves. Saline water irrigation had a significant negative effect on leaves A, E, and Gs in 2021 and 2022, accompanied by a gradually decreasing trend of these parameters with the increase in irrigation water salinity, which was opposite to that of leaf Ci, while drought hardening slowed down this damage, especially in 2022 when its impact was significant. For the same saline water irrigation treatments, different from the maximum values of A, E, and Gs that were obtained with the W4 treatment in 2022 which were significantly higher than those in the W1 treatment, in 2021 the values of A, E, and Gs under the W3 treatment were the largest, and the difference with the W1 treatment was not significant. From 2021 to 2022, the response of Ci to drought hardening was like that of the A, E, and Gs in 2021, but the interaction effect of drought hardening and saline water irrigation on these parameters was insignificant except for the Ci in 2022.
For the leaf SPAD, the value ranged from 31.6 to 36.8 in 2021 and ranged from 29.6 to 35.7 in 2022, indicating that there was little difference among the 13 treatments. When the tomato plants were treated with the same drought hardening, the leaf SPAD tended to gradually decrease as the salinity of irrigation water increased from 2 g L−1 to 6 g L−1, while the difference among the saline water irrigation treatments was insignificant. Drought hardening and its coupling with saline water irrigation showed an insignificant effect on the leaf SPAD, but it usually reached a maximum with the W2 or W3 treatment when irrigated with saline water of the same salinity and the SPAD value of the W3S2 treatment was the largest among the 13 treatments between the two years.

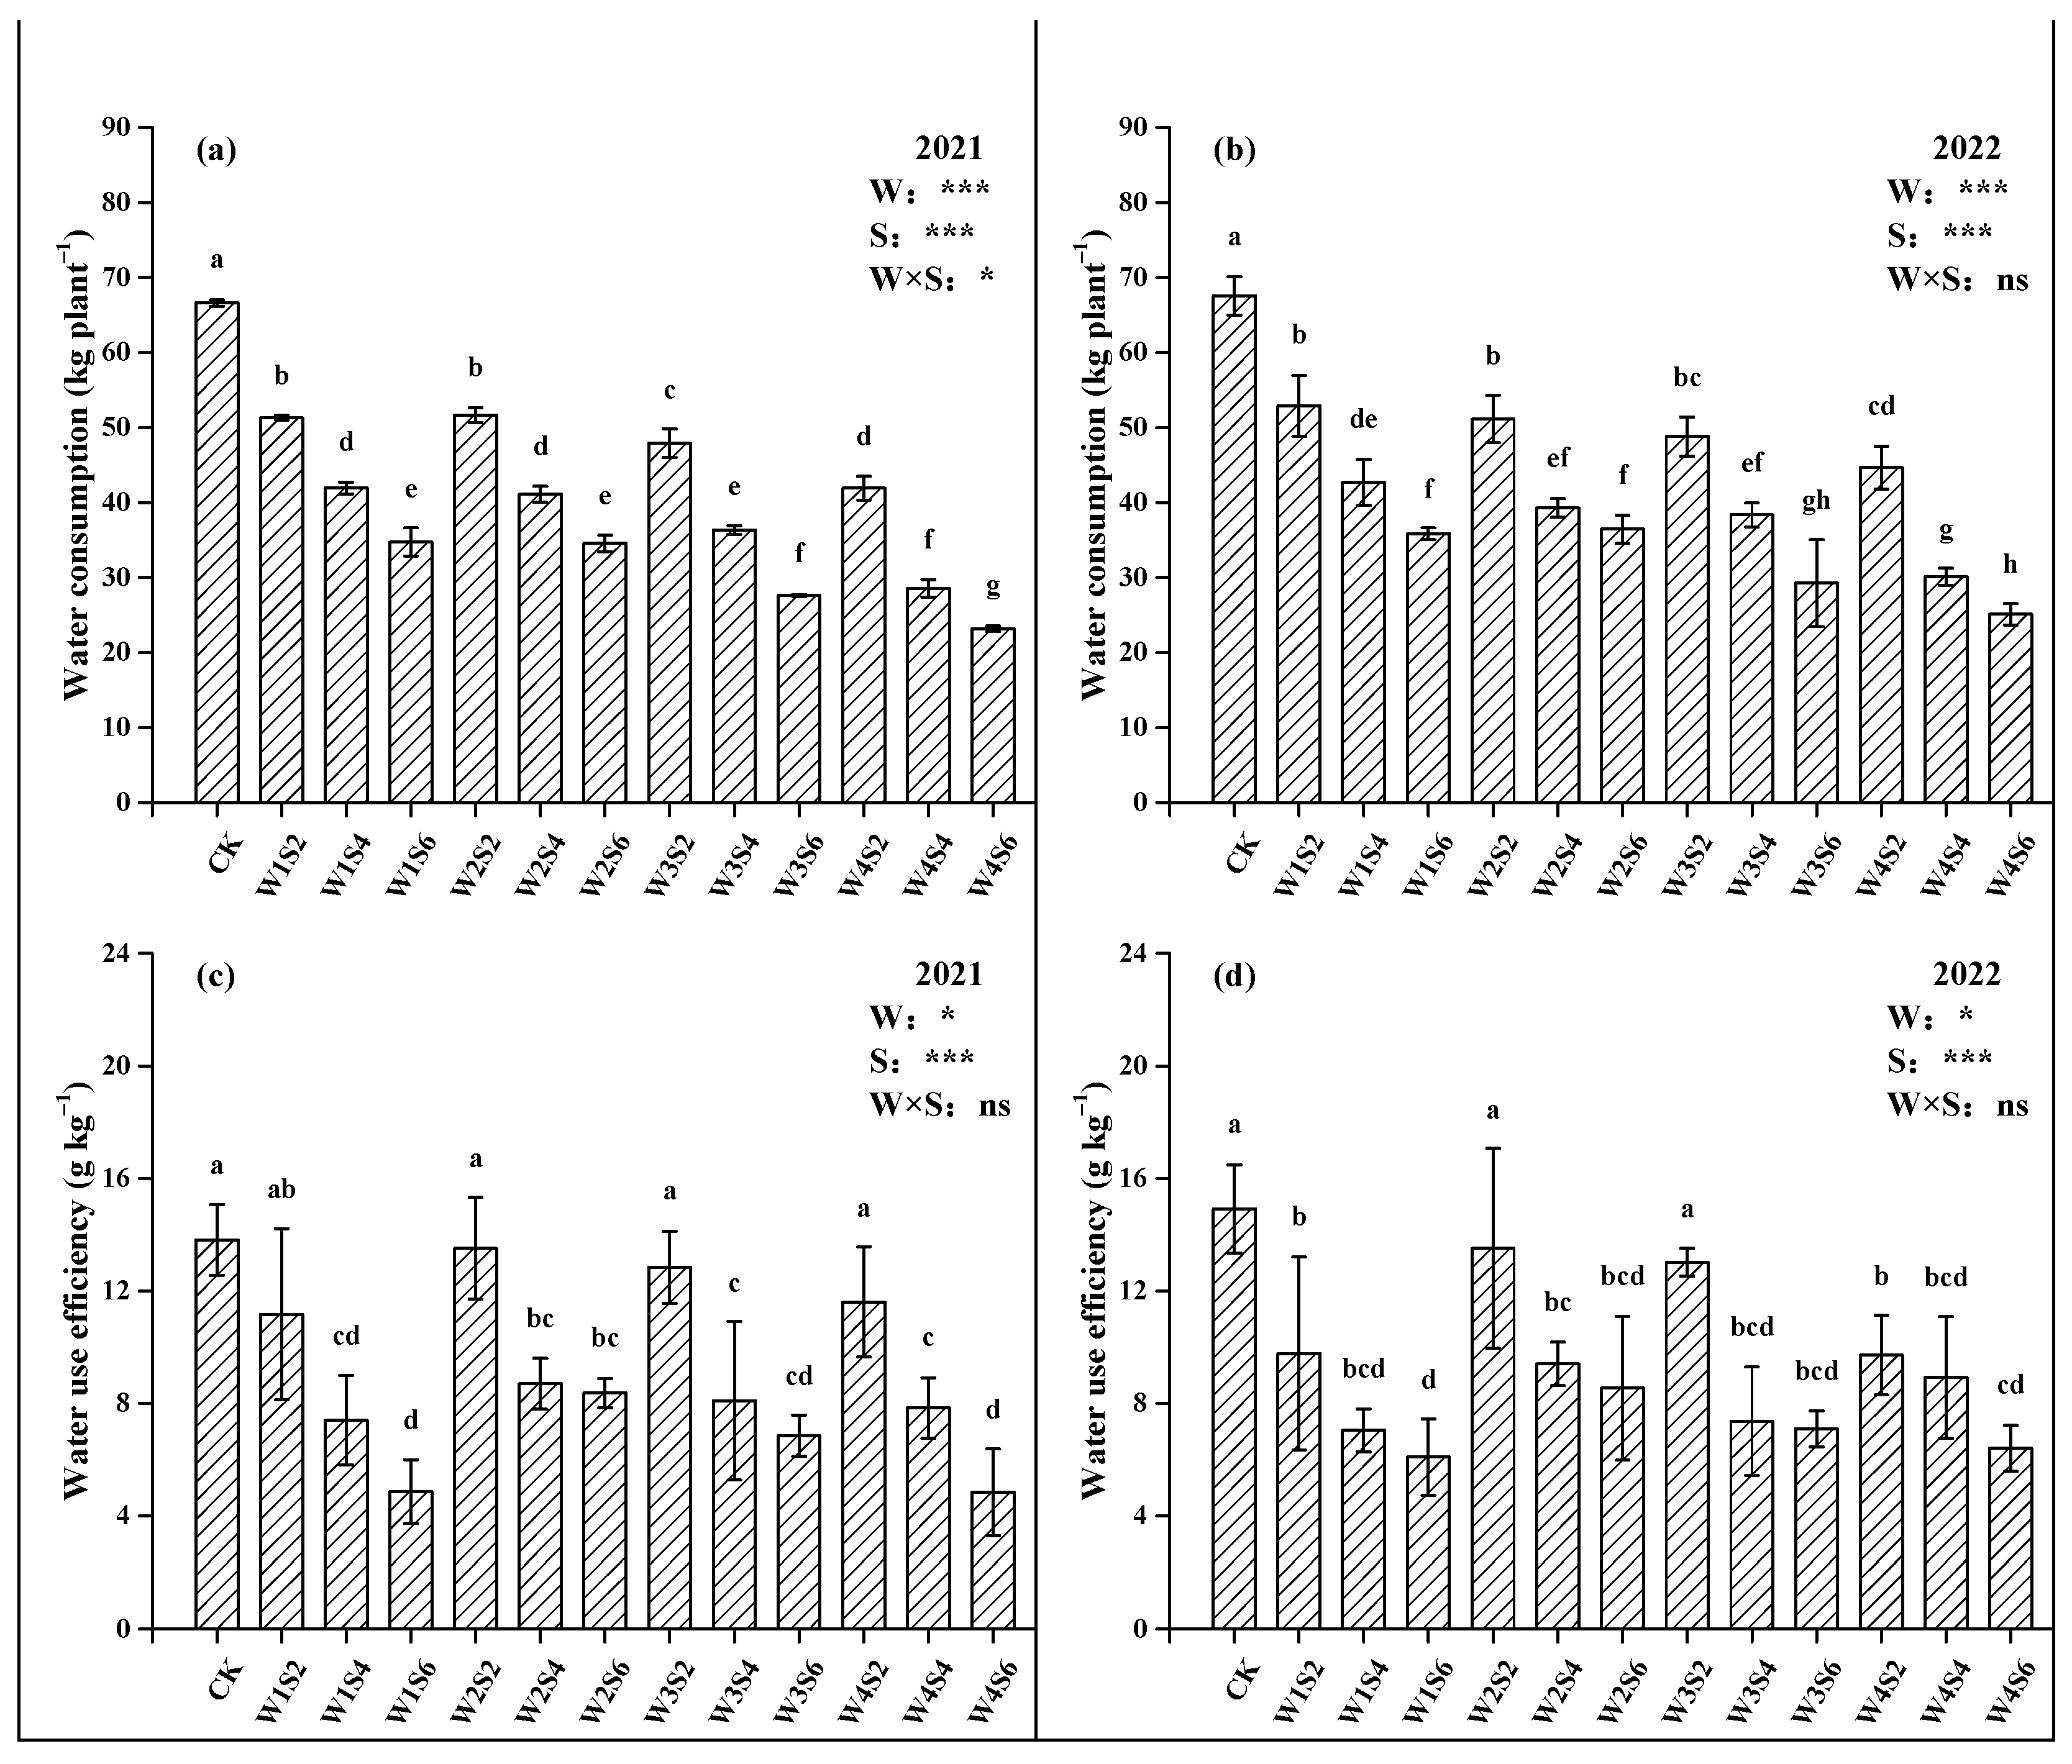
3.4. Yield Components and Water Use Efficiency (WUE)

Figure 7 shows the fruit yield (FY), fruit number (FN), average fruit weight (AFW), and average fruit volume (AFV) among treatments from 2021 to 2022. The FY, FN, AFW, and AFV all had a gradually decreasing trend with the increase in irrigation water salinity, and except for FN, there were significant differences between the S2 and S6 treatments when the tomato plants were treated with the same drought hardening. Unlike the completely negative significant effects of saline water irrigation, drought hardening presented a positive side for FY and FN. Compared to the W1 treatment, the FY and FN of the W2-treated tomato plants increased between the two years, and the increase ranged from 15.1% to 71.9% in 2021 and ranged from 37.1% to 65.5% in 2022, respectively. Among the 12 treatments irrigated with saline water, the FY of the W2S2-treated tomato plants was the highest, 699.2 g in 2021 and 684.3 g in 2022. Opposite effects of drought hardening were observed on the AFW and AFV with minimum values under the W4S6 treatment, 10.5 g and 10.9 cm3 in 2021 and 13.9 g and 14.7 cm3 in 2022, respectively. Nevertheless, the interaction effects of drought hardening and saline water irrigation on the AFW and AFV were not significant, nor were the effects on the FY and FN.
Figure 8 presents the water consumption (ETa) and water use efficiency (WUE) of tomato plants treated with different drought hardening and saline water irrigation. The CK treatment reached the maximum value of ETa (66.60 kg plant−1 in 2021 and 67.56 kg plant−1 in 2021), while the W4S6 treatment obtained the minimum ETa, which was 23.19 kg plant−1 in 2021 and 25.12 kg plant−1 in 2022. Moreover, the CK and W4S6 treatments reached the maximum and minimum WUE of 13.81 g kg−1 and 4.84 g kg−1 in 2021, respectively. Both the ETa and WUE decreased with the increasing salinity of irrigation water, especially when the irrigation water salinity reached 6 g L−1; the ETa and WUE reduced dramatically. Drought hardening also showed a negative significant effect on the ETa from 2021 to 2022 where the ETa tapered off as drought hardening intensified, especially when the tomato plants were treated with W3 and W4, the ETa significantly dropped. Differently, the W2 treatment increased the WUE by 17.6% to 71.9% in 2021 and by 33.5% to 40.2% in 2022 compared to W1 treatment. However, the coupling effects of drought hardening and saline water irrigation were insignificant on the ETa and WUE between the two years.

3.5. Fruit Quality

Table 3 and Table 4 demonstrate the performance of the fruit quality (the contents of TSS, TS, TA, and VC) under different drought hardening and saline water irrigation treatments. The contents of TSS and TS in tomato fruits significantly increased from 51.1% to 84.0%, from 46.1% to 70.1% in 2021, from 30.6% to 56.6%, and from 29.1% to 44.4% in 2022, respectively, when the irrigation water salinity increased from 2 g L−1 to 6 g L−1. Saline water irrigation also had a positive significant impact on the TA and VC. However, when subjected to the same drought hardening, the maximum value of the TA in 2021 was obtained by the S4 treatment unlike the maximum TSS and TS observed in the S6 treatment between the two years. Similarly, the S4 treatment reached the maximum value of VC from 2021 to 2022, a significant increase of 13.5% to 22.8% compared to the S2 treatment and of 11.4% to 38.6% compared to the S6 treatment.
For the content of TSS, there were significant effects of drought hardening and its interaction with saline water irrigation in both 2021 and 2022. When treated with S2, the highest value of TSS was obtained with the W3 treatment, 11.20% in 2021 and 12.07% in 2022. As the irrigation water salinity increased to 4 g L−1 and 6 g L−1, the TSS value of the W2 treatment was the largest, which was 1.1% to 11.9% greater than that of the W3 treatment between 2021 and 2022. Similarly, the maximum values of the TS, TA, and VC for tomato plants irrigated with the same saline water were all obtained in the W2 or W3 treatment, indicating the positive role of drought hardening in the changes in these parameters under saline water irrigation. However, the coupling of drought hardening and saline water irrigation had insignificant effects, except for the TA content in 2021.

4. Discussion

4.1. Effects of Drought Hardening on Tomato Seedlings

Plants grown in a good environment are higher with thicker stems, higher leaf numbers, and larger leaf area. Water is indispensable for the successful growth of crops, and previous studies have revealed that drought stress has a negative impact on the growth and development of many crops, directly manifested in the reduction in plant height, stem diameter, leaf area, and number of leaves [31,43,44]. Our results showed that at the seedling stage, the average increments in PH, SD, and LAI decreased with the increased drought stress and these average increments of the W1 treatments were significantly higher than those of the W3 and W4 treatments (Figure 3, Figure 4 and Figure 5). In line with our findings, Ors et al. [32] found the adverse effects of drought stress on the growth characteristics of tomato seedlings. Ahmed et al. [45] attributed this phenomenon to the fact that plants grown under drought conditions experience cell water loss, plasma membrane degradation, and hydrolase release, which in turn leads to cytoplasmic degradation, overall growth slowdown, and reduced turgor. Different from the significant effects on PH, SD, and LAI, drought hardening did not significantly influence the distribution of soil salinity in the soil profile and no significant difference was found in soil EC among the treatments or soil layers (Figure 1 and Figure 2). This was because at the seedling stage, the water requirement of tomato was small and the irrigation water was freshwater, although there were differences in irrigation amount among the drought-hardening treatments.

4.2. Effects of Saline Water Irrigation

Saline water irrigation is a mixed blessing, especially for regions with scarcity of freshwater resources. On the one hand, saline water irrigation could replenish water in the soil, filling the gap needed for crop growth [46,47], and even improving the qualities of fruits and vegetables via increasing the osmoregulatory capacity [9,48]. On the other hand, saline water irrigation would lead to a large amount of salt accumulation in the soil, which not only results in soil salinization and reduces soil fertility [49,50], but also inhibits the physiological and biochemical functions of plants due to salt stress [51,52]. Salt stress is a compound process that limits the content of available water through osmosis and drives the ion content to the toxicity level [31]. The major secondary effects caused by salinity are limitations in photosynthesis and potassium absorption, metabolic toxicity, and cell death due to the synthesis of reactive oxygen species, which impairs DNA, proteins, chlorophyll, and membrane function [53]. Obviously, in our study, saline water irrigation had a significant negative impact on the growth parameters, physiological properties, yield components, and water use efficiency of tomato plants by increasing soil salinity.
Irrigation water salinity is one of the determining factors in the amount of salt introduced into the soil by saline water irrigation, and therefore has an important impact on the degree of salinity stress experienced by crops [54]. The present study found that as the salinity of irrigation water increased from 2 g L−1 to 6 g L−1, the accumulation of salt in the soil increased dramatically, represented by the fact that the soil EC levels of the S6 treatment in each layer was significantly higher than that of the S2 treatment (Figure 1 and Figure 2). This meant that when the drought-hardening treatment was the same, the tomato plants treated with S6 suffered more severe salt stress than those treated with S2, thereby contributing to minimal increments in PH, SD, and LAI (Figure 3, Figure 4 and Figure 5). Sarker et al. [55] observed that the plant height, stems, and root fresh weight of cabbage decreased significantly under high salinity conditions. Sahin et al. [31] pointed out that the reason for the decrease in plant growth may be salinity toxicity and the reduced water uptake due to the elevation of the soil matrix and osmotic potential caused by salinity. Similarly, our findings showed that compared to the S2 treatment, the S6 treatment decreased the ETa and WUE from 28.7% to 44.7% and from 34.1% to 58.3% from 2021 to 2022 (Figure 8), consistent with the results reported by Li et al. [33]. The downward trend of the FW and FW/DW with the increase in irrigation water salinity (Figure 6) indicated that the water content of plants treated with S6 was lower, further proving that the inhibitory effect of the S6 treatment on plant root water uptake was greater than that of the S2 treatment. It reminds us that when developing a reasonable saline water irrigation scheduling, the reduction in water consumption of plants should be taken into account to avoid crop waterlogging caused by excessive watering.
Another reason for the slow growth of tomato plants under salinity stress was the negative effects of salinity on the plant metabolic processes [39,56]. Correspondingly, with the irrigation water salinity increasing, the A, E, Gs, and SPAD of leaves showed a downward trend (Table 1 and Table 2), implying that high salinity stress may lead to reduced photosynthesis due to stomatal restriction [57]. Salt stress reduced CO2 supply to leaves and resulted in the production of unstable reactive oxygen species, disrupting normal metabolism through oxidative damage [58]. Consistent with our results, Sanoubar et al. [58] found that the gas exchange parameters (A, E, and Gs) of cabbage leaves decreased with the increasing salt content. In contrast, the present study observed that there was an upward trend of the leaf Ci. Sahin et al. [31] attributed the decrease in plant growth to the increase in Ci value, which caused damage to plant metabolism. Photosynthesis is the main way to form dry matter, which directly affects the accumulation rate and amount of dry matter [59]. Chlorophyll is the main place for photosynthesis of crops, and the content of chlorophyll in leaves is closely related to the photosynthetic production capacity [60]. Therefore, the DW of tomato plants under the same drought hardening decreased with the increasing salinity of irrigation water (Figure 6).
For the same reason, irrigation water salinity had a significant negative impact on tomato yield, with significant differences between the S2 and S6 treatments (Figure 7), which was in line with the findings observed by Cheng et al. [61]. Our study suggested that this result may be related to the damage of saline water irrigation on the FN and AFW. The detrimental effects of salt stress induced by saline water irrigation reduced average fruit weight, flower number, and fruit setting rate during the reproductive growth period of tomato plants [34,62]. For fruit quality, saline water irrigation was found to have the opposite effects, which significantly improved the contents of TSS, TS, TA, and VC in tomato fruits. That may be because in order to weaken the harmful osmotic effects of salt, tomato plants underwent osmotic regulation, inducing a decrease in fruit water concentration, which consequently led to a certain increase in TSS, TS, TA, and VC concentrations [33,62]. In this study, the maximum values of TSS and TS was obtained with the S6 treatment, while the threshold for irrigation water salinity of VC and TA was recommended to be 4 g L−1 (Table 3 and Table 4). In summary, when saline water irrigation is applied to actual production, it is necessary to comprehensively consider the reduction in production cost caused by the substitution of saline water for freshwater, the reduction in income caused by yield reduction, and the increase in sales price caused by quality improvement. This needs to be further explored in future research to achieve the balance of the three as effectively as possible to obtain the greatest benefits.

4.3. Combined Effects of Drought Hardening and Saline Water Irrigation

The existing studies have focused on the use of external technical means, such as the implementation of alternative irrigation of saline water and freshwater [12], the application of soil amendments [14], the magnetization of saline water [17], etc., to alleviate the harm of saline water irrigation, neglecting to tap into the potential of crops to resist salt stress. Drought hardening can promote the development of plant roots [63], which could reduce the damage of salt stress to the water absorption capacity at later stages. Khan et al. [22] reported that the physiological mechanisms of antioxidant, osmoregulatory, and hormonal signaling could be activated by drought hardening during the seedling stage, which would play an important role in the process of crop resistance to the ensuing salt stress. A previous study proved that drought hardening could help mitigate the negative effects of drought stress and provide plants with drought resistance [20]. Furthermore, drought hardening has also been found to perform well under cross-stress conditions, such as promoting crop resistance to waterlogging and low temperature stress in the later stages [27,28]. Therefore, this paper attempts to explore whether drought hardening could improve the resistance of crops to the ensuing salt stress.
Prolonged drought conditions can cause permanent damage to plants, including disruption of stem and root development and reduction in leaf number and width [32]. In contrast, drought hardening only exposes crops to drought stress at the seedling stage with strong plasticity, allowing sufficient time for crops to return to normal growth [23]. Therefore, after the tomato plants were fully irrigated with saline water during the developmental stage, the maximum increments in PH, SD, and LAI occurred under the W4 treatment when the irrigation water salinity was the same while these increments of the W4 treatments were the lowest in the whole growth period (Figure 3, Figure 4 and Figure 5). Furthermore, the minimum increments occurred under the W4 treatments that decreased with the increase in irrigation water salinity, consistent with the previous study which concluded that the interaction of salt and drought stress negatively affects plant growth more than their individual effects [64]. This is due to the superposition of cytoplasmic degradation caused by drought and salt stress [45]. Sahin et al. [31] indicated that the combination of salinity and drought stress further increased the soil matrix and osmotic potential, resulting in less water uptake by plants, which may be the main reason for the slower growth of plants. Similarly, the FW and DW of tomato plants under the W4S6 treatment reached the minimum (Figure 6).
However, the W2S2 treatment promoted the increments in PH and LAI during the whole growing stage. When the irrigation water salinity was 2 g L−1 or 4 g L−1, the increments in PH and LAI of tomato plants treated with W2 were the highest in 2021 and the promotional effect of the W2 treatment was found on the PH increment in 2022 (Figure 3, Figure 4 and Figure 5). This may be because light drought hardening (W2 treatment) could reduce the accumulation of salt introduced by saline water irrigation in the soil, thereby mitigating the salt stress suffered by crop roots. The results that the soil EC of the W2 treatment was smaller than that of the W1 and W3 treatments when the irrigation water salinity was 2 g L−1 appeared at the end of the maturation stage in the 0–15 cm and 30–45 cm soil layers in 2021 and the 0–15 cm soil layer in 2022 (Figure 1 and Figure 2); thus, implying that the damage of salt stress on the water absorption capacity of tomato roots was reduced under drought hardening. Therefore, under the same salinity gradient of irrigation water, the WUE of all drought-hardening treatments was higher than that of the W1 treatment (Figure 8). When the salinity of irrigation water was low (S2 treatment), the ETa of tomato plants treated with W2 was even greater than that of the W1 treatment in 2021 (Figure 8). Salt moves with the water, so the more water the plant absorbs, the more salt is taken into the plant, and the less salt remains in the soil. For this reason, under low-salt water irrigation (S2 treatment), the soil EC of the W2 treatment, whose WUE was the highest, was smaller than that of the W1 and W3 treatments at the end of the developmental stage (an average decrease of 6.8% and 22.8% in 2021 and 10.2% and 17.8% in 2022, respectively) (Figure 1 and Figure 2).
In addition, plants subjected to drought hardening could maintain antioxidant enzyme activity, leading to reduced oxidative stress damage and higher leaf photosynthetic capacity [65]. When irrigated with saline water of the same salinity, photosynthetic characteristics (A, E, Gs, and Ci) usually reached a maximum with the W3 or W4 treatment, while leaf SPAD usually reached a maximum with the W2 or W3 treatment (Table 1 and Table 2). Due to the benefits of drought hardening in reducing soil salt accumulation and improving leaf photosynthesis, the present study showed that under saline water irrigation, light drought hardening (W2 treatment) increased tomato yield by 15.1% to 71.9% compared to the well-irrigated treatment (W1 treatment) during the growing seasons (Figure 7). This directly and strongly indicated that drought hardening can improve crop salinity resistance, which was further evidenced by the increased FY of tomato plants under moderate drought-hardening treatment (W3 treatment) relative to the W1 treatment under low-salt water irrigation (S2 treatment) (Figure 7). The increased yield of the W2 treatment compared to that of the W1 treatment was mainly due to the increase in the number of fruits, as drought hardening promoted an increase in fruit setting rate (Figure 7). A similar response was observed by Yang et al. [34]. However, the AFW and AFV both showed a gradually decreasing trend with the increased levels of drought hardening. Hou et al. [66] demonstrated that the smaller the fruit, the lower the osmotic and water potential, which could help it compete more effectively for water in cases where the ability of its roots to absorb water is impaired. Furthermore, smaller fruits were less sensitive to salinity than larger fruits [33,67].
The fruit qualities (TSS, TS, TA, and VC) of drought-hardened tomato plants irrigated with saline water were all significantly higher than those of the control treatment (Table 3 and Table 4). This may be due to the superposed effect of osmotic adjustment of plants under both drought stress and salt stress [33], but we noted that there was a limit value for the superposition of the two in this study. Under low-salt water irrigation (2 g L−1), the threshold of drought hardening was the W3 treatment, while the threshold of drought hardening for tomato plants irrigated with high-salt water (6 g L−1) was the W2 treatment. Moreover, although saline water irrigation aggravated the water stress caused by drought hardening, further impeding the water and nutrient absorption of roots, the water and nutrient allocation throughout the plant may be readjusted to prioritize water and nutrient supply to fruit under multiple severe stresses, as a protective mechanism for reproduction [33]. In summary, drought hardening can be an economical and viable method for mitigating the harm of saline water irrigation and the W2S2 treatment is the best combination among the twelve saline water irrigation treatments for the highest yield and WUE with a higher fruit quality.

4.4. Future Research Plan

The experiments between 2021 and 2022 observed the impacts of drought hardening on the growth and physiological parameters of tomato plants irrigated with saline water and preliminarily explored the possibility of drought hardening to relieve salt stress through the change in yield. There are still some underlying physiological mechanisms (antioxidant capacity and hormonal signaling) to elucidate, which could contribute to the improvement in salinity resistance. Faced with adversity stress, plant cells are harmed by the production and accumulation of a large number of biological oxygen radicals. At this time, the activity of various antioxidant enzymes in the plant enzymatic defense system is initiated to remove cell-free radicals, thereby reducing peroxidation of cell membrane lipids and allowing crops to maintain high leaf photosynthetic capacity [68]. Endogenous hormones play an important role in the growth and development of the plant and its responses to stress [69]. Drought hardening promotes cell wall expansion and adjusts cell wall structure by inducing rapid synthesis of stress hormones allowing plants to actively respond to subsequent stress [70].
Another reason for the increased salinity resistance may be due to the osmotic regulation mechanism of crops that have experienced drought hardening; consequently, contributing to the improved water absorption capacity [71]. When plants are subjected to drought stress, they can improve the osmoregulatory ability of cells and reduce cell osmotic potential by accumulating a large number of osmoregulatory substances, such as soluble sugars, soluble proteins, and proline, to maintain a relatively high plant water potential [69]. The promotion of drought hardening on the development of plant roots may also lead to the increased resistance of crops to the ensuing salt stress. The increase in root length, root tip number, root-to-shoot ratio, and root activity may enhance the ability of roots to resist salt stress [63], thereby reducing the damage of salt stress to the water absorption capacity of the root system. Therefore, we intend to study the changes at the metabolic and biochemical level and the effects on root morphology caused by drought hardening in the next step of the experiments, so that plants can better cope with salinity.

5. Conclusions

This study investigated the effects of drought hardening at the seedling stage in combination with saline water irrigation from 50% of plants flowering to harvest on tomato growth, physiology, yield, WUE, and fruit quality. Saline water irrigation significantly promoted the improvement in fruit quality (TSS, TS, TA, and VC), but played a negative role in the performance of physiological and growth characteristics of tomato plants, contributing to the decrease in yield and WUE. The W2 treatment could mitigate the hazards of saline water irrigation, especially for irrigation water with a salinity of 2 g L−1, by means of reducing the accumulation of salt in the soil. Consequently, the increments in PH and LAI of the W2S2 treatment during the whole growing stage were higher than those of the W2S1 treatment. Compared to the W1 treatment, the W2 and W3 treatments showed a greater positive effect on the leaf photosynthesis. Correspondingly, when irrigation water salinity was the same, the maximum values of fruit quality were all observed in the W2 or W3 treatment. However, the W2 treatment contributed more to the accumulation of organic matter and absorption of moisture than the W3 treatment, reflected by the trend in changes in the fresh weight to dry weight ratio, leading to an increase in yield and WUE relative to the W3 treatment. Among the twelve saline water irrigation treatments, the W2S2 treatment reached the maximum values of yield and WUE with higher fruit quality, suggested for tomato production under saline water irrigation. Any following research should be suggested to combine drought hardening with external techniques such as rotational irrigation, drip irrigation, and biochar application to maximize the benefits of saline water irrigation.

Author Contributions

Conceptualization, Y.G., G.S. and J.C.; methodology, Y.G., G.S., J.C. and J.L.; software, Y.G. and L.T.; validation, Y.G., G.S., J.C. and J.L.; formal analysis, Y.G., L.T. and E.S.; investigation, Y.G., Z.Z. and E.S.; resources, Y.G., G.S. and J.C.; data curation, Y.G. and Z.Z.; writing—original draft preparation, Y.G.; writing—review and editing, Y.G. and G.S.; visualization, Y.G.; supervision, Y.G., G.S. and J.C.; project administration, Y.G.; funding acquisition, Y.G., G.S. and J.C. All authors have read and agreed to the published version of the manuscript.

Funding

This research was funded by the Fundamental Research Funds for the Central Universities, grant number B230205040, the Postgraduate Research & Practice Innovation Program of Jiangsu Province, grant number KYCX22_0668 and the National Nature & Science Foundation of China, grant number 51879072.

Data Availability Statement

The data presented in this study are available on request from the corresponding author.

Acknowledgments

The authors extend their gratitude to the editor and anonymous reviewers for substantial comments on an earlier version of this paper.

Conflicts of Interest

The authors declare no conflict of interest.

References

  1. Gao, Y.; Shao, G.C.; Lu, J.; Zhang, K.; Wu, S.Q.; Wang, Z.Y. Effects of biochar application on crop water use efficiency depend on experimental conditions: A meta-analysis. Field Crops Res. 2020, 249, 107763. [Google Scholar] [CrossRef]
  2. Du, Y.D.; Niu, W.Q.; Gu, X.B.; Zhang, Q.; Cui, B.J.; Zhao, Y. Crop yield and water use efficiency under aerated irrigation: A meta-analysis. Agric. Water Manag. 2018, 210, 158–164. [Google Scholar] [CrossRef]
  3. Bañón, D.; Lorente, B.; Ortuño, M.F.; Bañón, S.; Sánchez-Blanco, M.J.; Alarcón, J.J. Effects of saline irrigation on the physiology and ornamental quality of Euphorbia Ascot Rainbow and its relationship with salinity indexes based on the bulk electrical conductivity. Sci. Hortic. 2022, 305, 111406. [Google Scholar] [CrossRef]
  4. Jafari, S.; Garmdareh, S.E.H. Effects of salinity on morpho-physiological, and biochemical characteristics of stock plant (Matthiola incana L.). Sci. Hortic. 2019, 257, 108731. [Google Scholar] [CrossRef]
  5. Su, H.; Sun, H.Y.; Dong, X.L.; Chen, P.; Zhang, X.J.; Tian, L.; Liu, X.J.; Wang, J.T. Did manure improve saline water irrigation threshold of winter wheat? A 3-year field investigation. Agric. Water Manag. 2021, 258, 107203. [Google Scholar] [CrossRef]
  6. Izadi, Y.; Moosavi, S.A.; Gharineh, M.H. Salinity affects eco-physiological aspects and biochemical compositions in chia (Salvia hispanica L.) during germination and seedling growth. Sci. Hortic. 2022, 306, 111461. [Google Scholar] [CrossRef]
  7. Loganathachetti, D.S.; Alhashmi, F.; Chandran, S.; Mundra, S. Irrigation water salinity structures the bacterial communities of date palm (Phoenix dactylifera)-associated bulk soil. Front. Plant Sci. 2022, 13, 944637. [Google Scholar] [CrossRef] [PubMed]
  8. Cássia Alves, R.; Medeiros, A.S.; Nicolau, M.C.M.; Assis Oliveira, F.; Lima, L.W.; Aroucha, E.M.M.; Gratão, P.L. Influence of partial root-zone saline irrigation management on tomato yield and fruit quality from a potted-plant study. Hortscience 2018, 53, 1326–1331. [Google Scholar] [CrossRef]
  9. Li, J.S.; Gao, Y.M.; Zhang, X.Y.; Tian, P.; Li, J.; Tian, Y.Q. Comprehensive comparison of different saline water irrigation strategies for tomato production: Soil properties, plant growth, fruit yield and fruit quality. Agric. Water Manag. 2019, 213, 521–533. [Google Scholar] [CrossRef]
  10. Li, J.G.; Chen, J.; He, P.R.; Chen, D.; Dai, X.P.; Jin, Q.; Su, X.Y. The optimal irrigation water salinity and salt component for high-yield and good-quality of tomato in Ningxia. Agric. Water Manag. 2022, 274, 107940. [Google Scholar] [CrossRef]
  11. Han, X.Y.; Kang, Y.H.; Wan, S.Q.; Li, X.B. Effect of salinity on oleic sunflower (Helianthus annuus Linn.) under drip irrigation in arid area of Northwest China. Agric. Water Manag. 2022, 259, 107267. [Google Scholar] [CrossRef]
  12. Zhang, Y.H.; Li, X.Y.; Šimůnek, J.; Shi, H.B.; Chen, N.; Hu, Q. Optimizing drip irrigation with alternate use of fresh and brackish waters by analyzing salt stress: The experimental and simulation approaches. Soil Tillage Res. 2022, 219, 105355. [Google Scholar] [CrossRef]
  13. Zhang, W.D.; Du, T.S. Fresh/brackish watering at growth period provided a trade-off between lettuce growth and resistance to NaCl-induced damage. Sci. Hortic. 2022, 304, 111283. [Google Scholar] [CrossRef]
  14. Song, J.S.; Zhang, H.Y.; Chang, F.D.; Yu, R.; Wang, J.; Wang, X.Q.; Li, Y.Y. If the combination of straw interlayer and irrigation water reduction maintained sunflower yield by boosting soil fertility and improving bacterial community in arid and saline areas. Agric. Water Manag. 2022, 262, 107424. [Google Scholar] [CrossRef]
  15. Li, X.B.; Kang, Y.H.; Wan, S.Q.; Chen, X.L.; Xu, J.C. Effect of drip-irrigation with saline water on Chinese rose (Rosa chinensis) during reclamation of very heavy coastal saline soil in a field trial. Sci. Hortic. 2015, 186, 163–171. [Google Scholar] [CrossRef]
  16. Zhu, M.J.; Wang, Q.J.; Sun, Y.; Zhang, J.H. Effects of oxygenated brackish water on germination and growth characteristics of wheat. Agric. Water Manag. 2021, 245, 106520. [Google Scholar] [CrossRef]
  17. Zhou, B.B.; Liang, C.F.; Chen, X.P.; Ye, S.T.; Peng, Y.; Yang, L.; Duan, M.L.; Wang, X.P. Magnetically-treated brackish water affects soil water-salt distribution and the growth of cotton with film mulch drip irrigation in Xinjiang, China. Agric. Water Manag. 2022, 263, 107487. [Google Scholar] [CrossRef]
  18. Zhao, G.Q.; Zhou, B.B.; Mu, Y.; Wang, Y.H.; Liu, Y.Q.; Wang, L. Irrigation with activated water promotes root growth and improves water use of winter wheat. Agronomy 2021, 11, 2459. [Google Scholar] [CrossRef]
  19. Ghanbari, F.; Kordi, S. Hardening pretreatment by drought and low temperature enhanced chilling stress tolerance of cucumber seedlings. Acta Sci. Pol. Hortorum Cultus 2019, 18, 29–37. [Google Scholar] [CrossRef]
  20. Khan, R.; Ma, X.H.; Shah, S.; Wu, X.Y.; Shaheen, A.; Xiao, L.X.; Wu, Y.H.; Wang, S.S. Drought-hardening improves drought tolerance in Nicotiana tabacum at physiological, biochemical, and molecular levels. BMC Plant Biol. 2020, 20, 486. [Google Scholar] [CrossRef]
  21. Yang, S.L.; Chen, K.; Wang, S.S.; Gong, M. Osmoregulation as a key factor in drought hardening-induced drought tolerance in Jatropha curcas. Biol. Plant. 2015, 59, 529–536. [Google Scholar] [CrossRef]
  22. Khan, R.; Ma, X.H.; Zhang, J.; Wu, X.Y.; Iqbal, A.; Wu, Y.H.; Zhou, L.; Wang, S.S. Circular drought-hardening confers drought tolerance via modulation of the antioxidant defense system, osmoregulation, and gene expression in tobacco. Physiol. Plant. 2021, 172, 1073–1088. [Google Scholar] [CrossRef] [PubMed]
  23. Lou, R.T.; Li, D.X.; Li, Y.B.; Bian, Z.P.; Zhu, Y.N. Effect of pre-anthesis drought hardening on post-anthesis physiological characteristics, yield and WUE in winter wheat. Phyton-Int. J. Exp. Bot. 2021, 90, 245–257. [Google Scholar] [CrossRef]
  24. Rajashekar, C.B.; Panda, M. Water stress is a component of cold acclimation process essential for inducing full freezing tolerance in strawberry. Sci. Hortic. 2014, 174, 54–59. [Google Scholar] [CrossRef]
  25. Ghanbari, F.; Sayyari, M. Controlled drought stress affects the chilling-hardening capacity of tomato seedlings as indicated by changes in phenol metabolisms, antioxidant enzymes activity, osmolytes concentration and abscisic acid accumulation. Sci. Hortic. 2018, 229, 167–174. [Google Scholar] [CrossRef]
  26. Álvarez, S.; Gómez-Bellot, M.J.; Acosta-Motos, J.R.; Sánchez-Blanco, M.J. Application of deficit irrigation in Phillyrea angustifolia for landscaping purposes. Agric. Water Manag. 2019, 218, 193–202. [Google Scholar] [CrossRef]
  27. Shao, G.C.; Cheng, X.; Liu, N.; Zhang, Z.H. Effect of drought pretreatment before anthesis and post-anthesis waterlogging on water relation, photosynthesis, and growth of tomatoes. Arch. Agron. Soil Sci. 2016, 62, 935–946. [Google Scholar] [CrossRef]
  28. Guo, Q.Q.; Li, X.; Li, N.; Jameson, P.E.; Zhou, W.B. Transcription-associated metabolomic adjustments in maize occur during combined drought and cold stress. Plant Physiol. 2021, 186, 677–695. [Google Scholar] [CrossRef]
  29. Ors, S.; Suarez, D.L. Spinach biomass yield and physiological response to interactive salinity and water stress. Agric. Water Manag. 2017, 190, 31–41. [Google Scholar] [CrossRef]
  30. Caliskan, O.; Radusiene, J.; Temizel, K.E.; Staunis, Z.; Cirak, C.; Kurt, D.; Odabas, M.S. The effects of salt and drought stress on phenolic accumulation in greenhouse-grown Hypericum pruinatum. Ital. J. Agron. 2017, 12, 271–275. [Google Scholar] [CrossRef]
  31. Sahin, U.; Ekinci, M.; Ors, S.; Turan, M.; Yildiz, S.; Yildirim, E. Effects of individual and combined effects of salinity and drought on physiological, nutritional and biochemical properties of cabbage (Brassica oleracea var. capitata). Sci. Hortic. 2018, 240, 196–204. [Google Scholar] [CrossRef]
  32. Ors, S.; Ekinci, M.; Yildirim, E.; Sahin, U.; Turan, M.; Dursun, A. Interactive effects of salinity and drought stress on photosynthetic characteristics and physiology of tomato (Lycopersicon esculentum L.) seedlings. S. Afr. J. Bot. 2021, 137, 335–339. [Google Scholar] [CrossRef]
  33. Li, H.; Hou, X.M.; Bertin, N.; Ding, R.S.; Du, T.S. Quantitative responses of tomato yield, fruit quality and water use efficiency to soil salinity under different water regimes in Northwest China. Agric. Water Manag. 2023, 277, 108134. [Google Scholar] [CrossRef]
  34. Yang, H.; Du, T.S.; Mao, X.M.; Ding, R.S.; Shukla, M.K. A comprehensive method of evaluating the impact of drought and salt stress on tomato growth and fruit quality based on EPIC growth model. Agric. Water Manag. 2019, 213, 116–127. [Google Scholar] [CrossRef]
  35. Agbna, G.H.D.; She, D.L.; Liu, Z.P.; Elshaikh, N.A.; Shao, G.C.; Timm, L.C. Effects of deficit irrigation and biochar addition on the growth, yield, and quality of tomato. Sci. Hortic. 2017, 222, 90–101. [Google Scholar] [CrossRef]
  36. Cao, Y.E.; Gao, Y.M.; Li, J.S.; Tian, Y.Q. Straw composts, gypsum and their mixtures enhance tomato yields under continuous saline water irrigation. Agric. Water Manag. 2019, 223, 105721. [Google Scholar] [CrossRef]
  37. Mahmoud, L.M.; Shalan, A.M.; El-Boray, M.S.; Vincent, C.I.; El-Kady, M.E.; Grosser, J.W.; Dutt, M. Application of silicon nanoparticles enhances oxidative stress tolerance in salt stressed ‘Valencia’ sweet orange plants. Sci. Hortic. 2022, 295, 110856. [Google Scholar] [CrossRef]
  38. Shao, G.C.; Gao, Y.; Lin, J.; Liu, Z.J.; Huang, D.D. Effects of biochar on water requirement regulation and yield of tomato under different groundwater tables. Trans. Chin. Soc. Agric. Mach. 2019, 50, 250–258. [Google Scholar]
  39. She, D.L.; Sun, X.Q.; Gamareldawla, A.H.D.; Nazar, E.A.; Hu, W.; Edith, K.; Yu, S.E. Benefits of soil biochar amendments to tomato growth under saline water irrigation. Sci. Rep. 2018, 8, 14743. [Google Scholar] [CrossRef]
  40. Li, J.G.; Chen, J.; Qu, Z.Y.; Wang, S.L.; He, P.R.; Zhang, N. Effects of alternating irrigation with fresh and saline water on the soil salt, soil nutrients, and yield of tomatoes. Water 2019, 11, 1693. [Google Scholar] [CrossRef]
  41. Graber, E.R.; Harel, Y.M.; Kolton, M.; Cytryn, E.; Silber, A.; David, D.R.; Tsechansky, L.; Borenshtein, M.; Elad, Y. Biochar impact on development and productivity of pepper and tomato grown in fertigated soilless media. Plant Soil 2010, 337, 481–496. [Google Scholar] [CrossRef]
  42. Li, B.; Shukla, M.K.; Du, T.S. Combined environmental stresses induced by drip irrigation positively affect most solar greenhouse grown tomato fruit quality. Sci. Hortic. 2021, 288, 110334. [Google Scholar] [CrossRef]
  43. Ors, S.; Ekinci, M.; Yildirim, E.; Sahin, U. Changes in gas exchange capacity and selected physiological properties of squash seedlings (Cucurbita pepo L.) under well-watered and drought stress conditions. Arch. Agron. Soil Sci. 2016, 62, 1700–1710. [Google Scholar] [CrossRef]
  44. Sahin, U.; Ekinci, M.; Kiziloglu, F.M.; Yildirim, E.; Turan, M.; Kotan, R.; Ors, S. Ameliorative effects of plant growth promoting bacteria on water-yield relationships, growth, and nutrient uptake of lettuce plants under different irrigation levels. Hortscience 2015, 50, 1379–1386. [Google Scholar] [CrossRef]
  45. Ahmed, I.M.; Dai, H.X.; Zheng, W.T.; Cao, F.B.; Zhang, G.P.; Sun, D.F.; Wu, F.B. Genotypic differences in physiological characteristics in the tolerance to drought and salinity combined stress between Tibetan wild and cultivated barley. Plant Physiol. Biochem. 2013, 63, 49–60. [Google Scholar] [CrossRef] [PubMed]
  46. Wang, Q.M.; Huo, Z.L.; Zhang, L.D.; Wang, J.H.; Zhao, Y. Impact of saline water irrigation on water use efficiency and soil salt accumulation for spring maize in arid regions of China. Agric. Water Manag. 2016, 163, 125–138. [Google Scholar] [CrossRef]
  47. Gao, H.; Fu, T.G.; Tang, S.P.; Liu, J.T. Effects of saline water irrigation on winter wheat and its safe utilization under a subsurface drainage system in coastal saline-alkali land of Hebei Province, China. Irrig. Sci. 2023, 41, 251–260. [Google Scholar] [CrossRef]
  48. Wang, X.D.; Tian, W.; Zheng, W.D.; Shah, S.; Li, J.S.; Wang, X.Z.; Zhang, X.Y. Quantitative relationships between salty water irrigation and tomato yield, quality, and irrigation water use efficiency: A meta-analysis. Agric. Water Manag. 2023, 280, 108213. [Google Scholar] [CrossRef]
  49. Yan, S.H.; Gao, Y.M.; Tian, M.J.; Tian, Y.Q.; Li, J.S. Comprehensive evaluation of effects of various carbon-rich amendments on tomato production under continuous saline water irrigation: Overall soil quality, plant nutrient uptake, crop yields and fruit quality. Agric. Water Manag. 2021, 255, 106995. [Google Scholar] [CrossRef]
  50. Trabelsi, L.; Gargouri, K.; Ayadi, M.; Mbadra, C.; Nasr, M.B.; Mbarek, H.B.; Ghrab, M.; Ahmed, G.B.; Kammoun, Y.; Loukil, E.; et al. Impact of drought and salinity on olive potential yield, oil and fruit qualities (cv. Chemlali) in an arid climate. Agric. Water Manag. 2022, 269, 107726. [Google Scholar] [CrossRef]
  51. Zhai, Y.M.; Yang, Q.; Wu, Y.Y. Soil salt distribution and tomato response to saline water irrigation under straw mulching. PLoS ONE 2016, 11, e0165985. [Google Scholar] [CrossRef]
  52. Wang, T.Y.; Xu, Z.H.; Pang, G.B. Effects of irrigating with brackish water on soil moisture, soil salinity, and the agronomic response of winter wheat in the Yellow River Delta. Sustainability 2019, 11, 5801. [Google Scholar] [CrossRef]
  53. Culha, S.; Cakırlar, H. The effect of salinity on plants and salt tolerance mechanisms. Afyon Kocatepe Univ. J. Sci. 2011, 11, 11–34. [Google Scholar]
  54. Farooq, M.; Hussain, M.; Wakeel, A.; Siddique, K.H.M. Salt stress in maize: Effects, resistance mechanisms, and management. A review. Agron. Sustain. Dev. 2015, 35, 461–481. [Google Scholar] [CrossRef]
  55. Sarker, A.; Hossain, M.I.; Kashem, M.A. Salinity (NaCl) tolerance of four vegetable crops during germination and early seedling growth. Int. J. Latest Res. Sci. Technol. 2014, 3, 91–95. [Google Scholar]
  56. Zhai, Y.M.; Yang, Q.; Hou, M.M. The effects of saline water drip irrigation on tomato yield, quality, and blossom-end rot incidence—A 3a case study in the south of China. PLoS ONE 2015, 10, e0142204. [Google Scholar] [CrossRef]
  57. Ashraf, M. Some important physiological selection criteria for salt tolerance in plants. Flora 2004, 199, 361–376. [Google Scholar] [CrossRef]
  58. Sanoubar, R.; Cellini, A.; Veroni, A.M.; Spinelli, F.; Masia, A.; Antisari, L.V.; Orsini, F.; Gianquinto, G. Salinity thresholds and genotypic variability of cabbage (Brassica oleracea L.) grown under saline stress. J. Sci. Food Agric. 2016, 96, 319–330. [Google Scholar] [CrossRef]
  59. Jiang, P.; Cai, F.; Zhao, Z.Q.; Meng, Y.; Gao, L.Y.; Zhao, T.H. Physiological and dry matter characteristics of spring maize in Northeast China under drought stress. Water 2018, 10, 1561. [Google Scholar] [CrossRef]
  60. Shiratsuchi, H.; Yamagishi, T.; Ishii, R. Leaf nitrogen distribution to maximize the canopy photosynthesis in rice. Field Crops Res. 2006, 95, 291–304. [Google Scholar] [CrossRef]
  61. Cheng, M.H.; Wang, H.D.; Fan, J.L.; Wang, X.K.; Sun, X.; Yang, L.; Zhang, S.H.; Xiang, Y.Z.; Zhang, F.C. Crop yield and water productivity under salty water irrigation: A global meta-analysis. Agric. Water Manag. 2021, 256, 107105. [Google Scholar] [CrossRef]
  62. Li, J.G.; He, P.R.; Chen, J.; Hamad, A.A.A.; Dai, X.P.; Jin, Q.; Ding, S.Y. Tomato performance and changes in soil chemistry in response to salinity and Na/Ca ratio of irrigation water. Agric. Water Manag. 2023, 285, 108363. [Google Scholar] [CrossRef]
  63. Yuan, M.; Shao, G.C.; Cui, J.T.; Guo, Y.X.; Zhu, M.R. Effect of pre-anthesis drought on fruit yield and quality of post-anthesis waterlogged tomato. J. Drain. Irrig. Mach. Eng. 2016, 34, 436–442. [Google Scholar]
  64. Álvarez, S.; Sánchez-Blanco, M.J. Comparison of individual and combined effects of salinity and deficit irrigation on physiological, nutritional and ornamental aspects of tolerance in Callistemon laevis plants. J. Plant Physiol. 2015, 185, 65–74. [Google Scholar] [CrossRef] [PubMed]
  65. Wang, X.; Vignjevic, M.; Jiang, D.; Jacobsen, S.; Wollenweber, B. Improved tolerance to drought stress after anthesis due to priming before anthesis in wheat (Triticum aestivum L.) var. Vinjett. J. Exp. Bot. 2014, 65, 6441–6456. [Google Scholar] [CrossRef]
  66. Hou, X.M.; Zhang, W.D.; Du, T.S.; Kang, S.Z.; Davies, W.J. Responses of water accumulation and solute metabolism in tomato fruit to water scarcity and implications for main fruit quality variables. J. Exp. Bot. 2020, 71, 1249–1264. [Google Scholar] [CrossRef] [PubMed]
  67. Day, B.L.H.; Carins-Murphy, M.R.; Brodribb, T.J. Reproductive water supply is prioritized during drought in tomato. Plant Cell Environ. 2022, 45, 69–79. [Google Scholar]
  68. Sewelam, N.; Kazan, K.; Schenk, P.M. Global plant stress signaling: Reactive oxygen species at the cross-road. Front. Plant Sci. 2016, 7, 187. [Google Scholar] [CrossRef] [PubMed]
  69. Shang, R.X.; Yu, X.; You, C.C.; He, H.B.; Li, J.; Wu, L.Q. Adaptation physiological mechanism of rice under dual stress of drought and high temperature in booting stage. J. Gansu Agric. Univ. 2019, 54, 39–46. [Google Scholar]
  70. Harb, A.; Krishnan, A.; Ambavaram, M.M.R.; Pereira, A. Molecular and physiological analysis of drought stress in Arabidopsis reveals early responses leading to acclimation in plant growth. Plant Physiol. 2010, 154, 1254–1271. [Google Scholar] [CrossRef]
  71. Wang, X.; Cai, J.; Zhou, Q.; Dai, T.B.; Jiang, D. Physiological mechanisms of abiotic stress priming induced the crops stress tolerance: A review. Sci. Agric. Sin. 2021, 54, 2287–2301. [Google Scholar]
Figure 1. Soil salinity (EC) distribution in soil profiles for treatments at the end of the seedling stage (a,b), developmental stage (c,d), and maturation stage (e,f) in 2021. The meanings of CK–W4S6 treatments are explained in Section 2.2. Experimental Design.
Agronomy 13 02351 g001
Figure 2. Soil salinity (EC) distribution in soil profiles for treatments at the end of the seedling stage (a,b), developmental stage (c,d), and maturation stage (e,f) in 2022. The meanings of CK–W4S6 treatments are explained in Section 2.2. Experimental Design.
Agronomy 13 02351 g002
Figure 3. Plant height (PH) increments of the seedling stage (a,d), developmental stage (b,e), and the whole growth period (c,f) for treatments in 2021 and 2022, presented as a mean ± S.D. (n = 3). The meanings of CK–W4S6 treatments are explained in Section 2.2. Experimental Design; the error bar represents the S.D. of three replicates; the letters above the error bars indicate the difference among the treatments at the 0.05 level; W, S, and W × S denote the effects of drought hardening, saline water irrigation, and their interaction, respectively; ** and *** indicate significant differences at p ≤ 0.01 and 0.001, respectively; ns means no significant difference (p > 0.05).
Agronomy 13 02351 g003
Figure 4. Stem diameter (SD) increments of the seedling stage (a,d), developmental stage (b,e), and the whole growth period (c,f) for treatments in 2021 and 2022, presented as a mean ± S.D. (n = 3). The meanings of CK–W4S6 treatments are explained in Section 2.2. Experimental Design; the error bar represents the S.D. of three replicates; the letters above the error bars indicate the difference among the treatments at the 0.05 level; W, S, and W × S denote the effects of drought hardening, saline water irrigation, and their interaction, respectively; *, **, and *** indicate significant differences at p ≤ 0.05, 0.01, and 0.001, respectively; ns means no significant difference (p > 0.05).
Agronomy 13 02351 g004
Figure 5. Leaf area index (LAI) increments of the seedling stage (a,d), developmental stage (b,e), and the whole growth period (c,f) for treatments in 2021 and 2022, presented as a mean ± S.D. (n = 3). The meanings of CK–W4S6 treatments are explained in Section 2.2. Experimental Design; the error bar represents the S.D. of three replicates; the letters above the error bars indicate the difference among the treatments at the 0.05 level; W, S, and W × S denote the effects of drought hardening, saline water irrigation, and their interaction, respectively; *, **, and *** indicate significant differences at p ≤ 0.05, 0.01, and 0.001, respectively; ns means no significant difference (p > 0.05).
Agronomy 13 02351 g005
Figure 6. Plant fresh weight (FW), dry weight (DW), and the ratio of fresh weight to dry weight (FW/DW) for treatments in 2021 (a) and 2022 (b). The meanings of CK–W4S6 treatments are explained in Section 2.2. Experimental Design.
Agronomy 13 02351 g006
Figure 7. Fruit yield (FY), fruit number (FN), average fruit weight (AFW), and average fruit volume (AFV) for treatments in 2021 and 2022, (ah) presented as a mean ± S.D. (n = 3). The meanings of CK–W4S6 treatments are explained in Section 2.2. Experimental Design; the error bar represents the S.D. of three replicates; the letters above the error bars indicate the difference among the treatments at the 0.05 level; W, S, and W × S denote the effects of drought hardening, saline water irrigation, and their interaction, respectively; *, **, and *** indicate significant differences at p ≤ 0.05, 0.01, and 0.001, respectively; ns means no significant difference (p > 0.05).
Agronomy 13 02351 g007aAgronomy 13 02351 g007b
Figure 8. Water consumption (ETa) and water use efficiency (WUE) for treatments in 2021 and 2022, (ad) presented as a mean ± S.D. (n = 3). The meanings of CK–W4S6 treatments are explained in Section 2.2. Experimental Design; the error bar represents the S.D. of three replicates; the letters above the error bars indicate the difference among the treatments at the 0.05 level; W, S, and W × S denote the effects of drought hardening, saline water irrigation, and their interaction, respectively; * and *** indicate significant differences at p ≤ 0.05 and 0.001, respectively; ns means no significant difference (p > 0.05).
Agronomy 13 02351 g008
Table 1. Photosynthetic characteristics (photosynthetic rate, A; transpiration rate, E; stomatal conductance, Gs; intercellular CO2 concentration, Ci) and SPAD value of leaves at the maturation stage for treatments in 2021, presented as a mean ± S.D. (n = 3).
Treatment2021
A (μmol m−2 s−1)E (mmol m−2 s−1)Gs (mmol m−2 s−1)Ci (μmol mol−1)SPAD
CK14.01 ± 1.15 a11.22 ± 0.81 a415.79 ± 28.66 ab354.51 ± 6.18 c34.3 ± 3.6 ab
W1S212.25 ± 1.18 abc9.28 ± 0.77b cd389.85 ± 17.12 abcd370.33 ± 28.18 bc35.6 ± 3.8 ab
W1S410.11 ± 1.50 de8.52 ± 1.33 bcde350.36 ± 27.89 cde399.17 ± 52.22 abc34.0 ± 2.4 ab
W1S69.28 ± 0.35 e7.16 ± 0.05 e347.25 ± 24.05 cde443.91 ± 67.91 abc31.9 ± 1.7 b
W2S213.33 ± 2.08 ab9.48 ± 1.81 bcd405.76 ± 35.07 abc417.21 ± 109.43 abc36.0 ± 2.9 ab
W2S411.21 ± 0.08 cd8.68 ± 1.13 bcde384.51 ± 44.24 abcd420.11 ± 59.69 abc35.4 ± 1.4 ab
W2S610.45 ± 0.50 cde7.85 ± 0.32 de363.14 ± 29.32 bcde453.79 ± 49.35 ab35.2 ± 2.8 ab
W3S213.69 ± 0.64 ab10.04 ± 1.51 ab435.92 ± 33.23 a434.43 ± 40.57 abc36.8 ± 2.1 a
W3S411.80 ± 1.83 bcd9.86 ± 0.22 abc400.35 ± 28.92 abc458.70 ± 39.39 ab34.9 ± 2.6 ab
W3S610.85 ± 0.20 cde8.42 ± 1.24 bcde334.63 ± 19.23 de484.70 ± 92.38 a32.2 ± 2.2 b
W4S212.04 ± 1.62 bc9.69 ± 1.07 abc416.18 ± 88.67 ab363.52 ± 7.00 bc33.9 ± 3.1 ab
W4S49.94 ± 0.47 de8.78 ± 0.22 bcde354.43 ± 4.48 cde398.01 ± 53.94 abc32.6 ± 2.5 ab
W4S69.23 ± 0.51 e8.23 ± 0.79 cde323.05 ± 0.79 e410.37 ± 40.26 abc31.6 ± 2.3 b
W**nsnsnsns
S*********nsns
W × Snsnsnsnsns
The meanings of CK–W4S6 treatments are explained in Section 2.2. Experimental Design; the values within columns followed by different letters are statistically significant at the 0.05 level; W, S, and W × S denote the effects of drought hardening, saline water irrigation, and their interaction, respectively; ** and *** indicate significant differences at p ≤ 0.01 and 0.001, respectively; ns means no significant difference (p > 0.05).
Table 2. Photosynthetic characteristics (photosynthetic rate, A; transpiration rate, E; stomatal conductance, Gs; intercellular CO2 concentration, Ci) and SPAD value of leaves at the maturation stage for treatments in 2022, presented as a mean ± S.D. (n = 3).
Treatment2022
A (μmol m−2 s−1)E (mmol m−2 s−1)Gs (mmol m−2 s−1)Ci (μmol mol−1)SPAD
CK12.99 ± 0.80 a9.87 ± 0.40 a385.72 ± 4.32 a311.08 ± 55.32 bc34.2 ± 0.6 ab
W1S210.26 ± 0.22 bc7.73 ± 0.28 de278.97 ± 13.07 cd344.11 ± 43.36 bc32.6 ± 0.6 abc
W1S410.07 ± 0.42 bc7.68 ± 0.22 de274.78 ± 8.68 de393.12 ± 61.63 bc30.4 ± 1.4 bc
W1S68.80 ± 0.88 e7.41 ± 0.12 e264.04 ± 4.49 e430.21 ± 53.63 bc29.6 ± 6.6 c
W2S210.40 ± 0.33 bc8.15 ± 0.18 bcd289.50 ± 9.66 bc373.62 ± 32.99 bc33.9 ± 1.9 abc
W2S410.26 ± 0.05 bc8.07 ± 0.10 cd281.39 ± 4.07 bcd422.12 ± 9.47 bc32.9 ± 2.8 abc
W2S68.99 ± 0.11 de7.47 ± 0.36 e264.11 ± 10.79 e442.63 ± 33.47 b30.0 ± 1.5 bc
W3S210.47 ± 0.23 bc8.40 ± 0.24 bc291.82 ± 7.80 bc392.71 ± 89.21 bc35.7 ± 2.2 a
W3S410.38 ± 0.84 bc8.13 ± 0.19 bcd284.32 ± 3.72 bcd593.63 ± 223.46 a33.3 ± 2.9 abc
W3S69.83 ± 0.40 cd8.12 ± 0.34 cd280.00 ± 9.28 bcd625.14 ± 30.97 a31.5 ± 2.3 abc
W4S210.80 ± 0.43 b8.62 ± 0.27 b294.09 ± 7.30 b293.66 ± 44.90 c33.5 ± 2.6 abc
W4S410.67 ± 0.47 bc8.54 ± 0.35 bc292.36 ± 9.09 bc353.94 ± 33.45 bc33.0 ± 0.2 abc
W4S610.52 ± 0.49 bc8.16 ± 0.47 bcd280.21 ± 12.58 bcd731.44 ± 160.89 a32.7 ± 0.7 abc
W*********ns
S*************
W × Snsnsns**ns
The meanings of CK–W4S6 treatments are explained in Section 2.2. Experimental Design; the values within columns followed by different letters are statistically significant at the 0.05 level; W, S, and W × S denote the effects of drought hardening, saline water irrigation, and their interaction, respectively; *, **, and *** indicate significant differences at p ≤ 0.05, 0.01, and 0.001, respectively; ns means no significant difference (p > 0.05).
Table 3. The contents of total soluble solids (TSS), total soluble sugar (TS), titratable acid (TA), and vitamin C (VC) for treatments in 2021, presented as a mean ± S.D. (n = 3).
Treatment2021
TSS (%)TS (%)TA (%)VC (mg 100g−1)
CK6.00 ± 0.43 j1.80 ± 0.39 f0.430 ± 0.030 h10.18 ± 0.71 f
W1S26.68 ± 0.26 i1.91 ± 0.02 f0.539 ± 0.071 g11.42 ± 0.47 def
W1S48.48 ± 0.05 e2.44 ± 0.32 de0.608 ± 0.035 e13.82 ± 0.48 abc
W1S69.96 ± 0.06 b2.75 ± 0.25 cd0.398 ± 0.029 h10.58 ± 0.69 ef
W2S27.15 ± 0.05 h2.14 ± 0.12 ef0.546 ± 0.009 g12.33 ± 0.73 cd
W2S49.39 ± 0.13 c2.54 ± 0.21 d0.753 ± 0.029 b15.02 ± 2.37 a
W2S611.20 ± 0.18 a2.90 ± 0.28 c0.696 ± 0.046 cd11.84 ± 1.05 de
W3S27.67 ± 0.18 g2.77 ± 0.12 cd0.602 ± 0.035 ef12.83 ± 0.89 bcd
W3S49.08 ± 0.09 d3.70 ± 0.04 ab0.868 ± 0.020 a14.78 ± 0.44 a
W3S610.01 ± 0.03 b3.81 ± 0.17 a0.652 ± 0.017 cde11.26 ± 1.20 def
W4S27.00 ± 0.02 h2.63 ± 0.09 cd0.549 ± 0.018 fg11.74 ± 0.47 def
W4S48.01 ± 0.05 f2.89 ± 0.07 c0.703 ± 0.018 bc14.37 ± 0.48 ab
W4S69.75 ± 0.05 b3.40 ± 0.17 b0.647 ± 0.022 de10.37 ± 0.53 ef
W**********
S************
W × S***ns***ns
The meanings of CK–W4S6 treatments are explained in Section 2.2. Experimental Design; the values within columns followed by different letters are statistically significant at the 0.05 level; W, S, and W × S denote the effects of drought hardening, saline water irrigation, and their interaction, respectively; * and *** indicate significant differences at p ≤ 0.05 and 0.001, respectively; ns means no significant difference (p > 0.05).
Table 4. The contents of total soluble solids (TSS), total soluble sugar (TS), titratable acid (TA), and vitamin C (VC) for treatments in 2022, presented as a mean ± S.D. (n = 3).
Treatment2022
TSS (%)TS (%)TA (%)VC (mg 100g−1)
CK5.85 ± 0.02 h1.40 ± 0.01 f0.468 ± 0.030 d11.84 ± 1.46 g
W1S26.44 ± 0.03 g1.72 ± 0.14 ef0.489 ± 0.202 cd15.01 ± 0.90 ef
W1S48.84 ± 0.27 d2.09 ± 0.07 de0.666 ± 0.009 abcd18.30 ± 0.34 ab
W1S611.85 ± 0.18 a2.84 ± 0.24 ab0.865 ± 0.062 abcd15.72 ± 0.43 de
W2S27.33 ± 0.17 f1.82 ± 0.06 ef0.692 ± 0.023 abcd15.61 ± 0.77 de
W2S410.23 ± 0.05 b2.50 ± 0.05 bcd0.874 ± 0.055 abc19.17 ± 0.40 a
W2S612.07 ± 0.32 a3.09 ± 0.50 a1.015 ± 0.823 a16.83 ± 0.85 cd
W3S27.90 ± 0.05 e1.93 ± 0.05 e0.586 ± 0.021 bcd14.67 ± 0.51 ef
W3S410.11 ± 0.03 b2.63 ± 0.49 abc0.779 ± 0.068 abcd17.50 ± 0.83 bc
W3S611.93 ± 0.10 a3.05 ± 0.67 a0.950 ± 0.037 ab15.71 ± 0.47 de
W4S27.50 ± 0.16 f1.85 ± 0.05 ef0.583 ± 0.032 bcd13.95 ± 1.30 f
W4S410.02 ± 0.01 b2.19 ± 0.08 cde0.694 ± 0.014 abcd15.84 ± 0.65 de
W4S611.87 ± 0.14 a2.70 ± 0.13 ab0.941 ± 0.056 ab12.33 ± 0.94 g
W***nsns***
S***********
W × S***nsnsns
The meanings of CK–W4S6 treatments are explained in Section 2.2. Experimental Design; the values within columns followed by different letters are statistically significant at the 0.05 level; W, S, and W × S denote the effects of drought hardening, saline water irrigation, and their interaction, respectively; ** and *** indicate significant differences at p ≤ 0.01 and 0.001, respectively; ns means no significant difference (p > 0.05).
Disclaimer/Publisher’s Note: The statements, opinions and data contained in all publications are solely those of the individual author(s) and contributor(s) and not of MDPI and/or the editor(s). MDPI and/or the editor(s) disclaim responsibility for any injury to people or property resulting from any ideas, methods, instructions or products referred to in the content.

