Article

Identification of Soybean Germplasm and Associated Molecular Markers with Resistance to Fusarium graminearum

1
Department of Botany and Plant Pathology, Purdue University, West Lafayette, IN 47907, USA
2
Department of Agronomy, Purdue University, West Lafayette, IN 47907, USA
3
Crop Production and Pest Control Research Unit, United States Department of Agriculture, West Lafayette, IN 47907, USA
*
Author to whom correspondence should be addressed.
Agronomy 2023, 13(9), 2376; https://doi.org/10.3390/agronomy13092376
Submission received: 28 July 2023 / Revised: 6 September 2023 / Accepted: 9 September 2023 / Published: 13 September 2023
(This article belongs to the Section Crop Breeding and Genetics)

Abstract

:
Soybean ranks second by total production of all crops grown in the United States. From surveys of soybean production regions in the US and Canada, seedling diseases have been consistently identified as one of the top five biotic limitations on yield for over two decades. The role of Fusarium graminearum as an aggressive member of this complex was unknown until relatively recently and, consequently, publicly and commercially available varieties with resistance to this pathogen are unavailable. To address the need for resistant germplasm and to improve our understanding of the genetic basis underlying the resistance, we screened a set of 208 accessions of soybean from the United States Department of Agriculture Soybean Germplasm Collection (USDA-SGC) under controlled greenhouse conditions. A ratio of the root weight of inoculated plants compared to mock-inoculated controls was used to evaluate the degree of resistance. A linear mixed model identified eight resistant accessions (PI 548311, PI 438500, PI 561318 A, PI 547690, PI 391577, PI 157484, PI 632418, and PI 70466 -3) with significantly higher resistance than the population mean. Previous genotyping publicly available through the SoyBase database was used in a genome-wide association study (GWAS) to determine single nucleotide polymorphism (SNP) markers associated with resistant and susceptible phenotypes. A total of five significant marker-trait associations (MTAs) were discovered on chromosomes Gm02, Gm03, Gm06, Gm07, and Gm13, each accounting for 4.8, 4.3, 3.8, 4.1, and 3.0% of the phenotypic variance, respectively. This study, thus, lays a foundation for the better dissection of germplasm resistant to F. graminearum.

1. Introduction

Seedling diseases, alternatively damping-off or seedling blights, are a broad diagnosis encompassing the symptoms of pre-emergence seed rots and post-emergence seedling decay caused by biotic pathogens [1,2]. Seedling diseases threaten yield by reducing plant stands when favorable environmental conditions for the pathogen combine with vulnerable seeds and seedlings. Soilborne pathogens in the genera Fusarium, Pythium, Phytophthora, and Rhizoctonia are often the major drivers of seedling diseases in soybean [3,4,5]. For the past two decades, soybean yield losses due to major diseases have been extensively monitored across the soybean production regions of the US and Canada by various extension services [6,7,8,9]. From the most recently published survey, soybean seedling diseases have consistently ranked as the second highest biotic yield limitation behind soybean cyst nematode [7]. Current management strategies for soybean seedling diseases primarily target prevention and include practices relating to the reduction of excess moisture at planting, planting in warm conditions, and pre-emptive deployment of fungicidal seed treatments when disease pressure is expected to be high [10]. The use of seed-applied fungicides further increases the cost of soybean production and has questionable efficacy at mitigating seedling disease-associated losses and improving yield [11]. Worse yet, evidence of the development of fungicide insensitivity raises the question of whether increased dependence on chemical control will be sustainable for managing these pathogens in the future [12,13,14,15]. Continued research into the management of seedling diseases through nonfungicidal means is, therefore, critical to prevent severe yield and profit losses.
Pythium spp., Rhizoctonia solani, and Phytophthora sojae infections of soybean have been extensively documented. Many species in the genus Fusarium are associated with seedling diseases, while a relatively newly documented soybean pathogen, Fusarium graminearum Schwabe (teleomorph Gibberella zeae (Schwein.) Petch), has now been implicated as a primary cause of Fusarium-derived seedling diseases [16]. F. graminearum has long been known in soybean production regions as a poaceous pathogen causing head blight of many cereal crops and ear and stalk rot of maize. In 2004, its pathogenic association with soybean was demonstrated conclusively for the first time [16]. Since 2007, reports from around the United States of highly pathogenic F. graminearum isolates from soybean seedlings have been increasing [3,13,17,18]. In South Dakota, F. graminearum was recently identified as the primary Fusarium species from a survey of seedling disease samples taken from across the state [19]. F. graminearum is a predominant driver of soybean seedling diseases, especially in the Midwest, and should be targeted to reduce the incidence and severity of disease.
Genetic resistance offers a reliable and affordable option for growers to help manage losses caused by F. graminearum infections. Several resistant accessions and quantitative trait loci (QTL) have been reported to confer partial resistance and tolerance to F. graminearum. Zhang et al. reported cultivar differences shortly after F. graminearum pathogenicity on soybean was confirmed in North America [20]. Ellis et al. reported resistance from accession PI 525453 and identified four QTL conferring resistance, each accounting for approximately 3 to 11% of the phenotypic variation observed in their experiments [21]. A follow-up attempt at fine-mapping using recombinant inbred lines (RILs) descended from PI 525453 identified three QTL conferring 3.1–8.6% of the phenotypic variation of the resistance, only one of which was previously identified in PI 525453 in the original study [21,22]. Several other accessions, including PI 424354, were identified with greater resistance to F. graminearum than PI 525453 in the first study by Ellis et al.; however, they were not included in the QTL mapping studies [21]. Acharya et al. identified two QTL from PI 567301 B accounting for 38.5 and 8.1% of the phenotypic variation under the conditions of their experiments [23]. A follow-up study fine-mapped the major QTL and predicted candidate genes related to seed coat properties [24]. When the seed coat of PI 567301 B was mechanically removed, the resistant phenotype was lost, suggesting a potential role of seed coat properties in soybean resistance to F. graminearum. Cheng et al. also identified a major QTL from PI 567516 C accounting for 40.2% of the phenotypic variation in F. graminearum resistance on the same chromosome as the major QTL discovered by Acharya et al.; however, it was concluded that they were distinct from one another [23,25]. Zhang et al. conducted a GWAS on a panel of 314 accessions from the Chinese National Soybean GeneBank and found 12 significant marker-trait associations (MTAs) explaining 5.5–14.7% of the phenotypic variation [26]. A follow-up QTL mapping study identified seven QTL underlying resistance in a cross between ‘Hefeng-25’ and PI 525453 [27]. The lack of consensus among the loci reported between studies and the small effect sizes of many of the QTL indicate that resistance to F. graminearum in soybean is complex and likely controlled by multiple loci across different genetic backgrounds.
Despite knowledge of genetic loci conferring resistance to F. graminearum, no commercial or public varieties with resistance have been developed. An alternative approach to breeding for major genes and QTL is to use marker-assisted selection to select for multiple MTAs at once. This may result in cumulative effects that are large enough to warrant the breeding efforts. Therefore, it is important to continue improving our knowledge of genetic resistance against F. graminearum by identifying resistant germplasm and the markers linked to resistance loci. With the overall purpose of trying to increase the availability of resources for soybean resistance to F. graminearum, the objectives of this study were to (a) screen a diverse panel of soybean accessions of diverse international origin, including land races, cultivars, and elite varieties (hereafter referred to as accessions) from maturity groups 0-VI adapted to the North Central USA for phenotypic resistance to F. graminearum and to (b) perform a GWAS to identify molecular markers associated with the observed F. graminearum resistance. In this study, we screened a panel of 208 soybean accessions for resistance against two soybean-derived F. graminearum isolates using a greenhouse assay and then performed a GWAS by integrating our phenotypic data with previously curated and publicly available genotypic data from SoyBase (www.soybase.org accessed on 8 February 2023).

2. Materials and Methods

2.1. Preparation of Inoculum

Two isolates of Fusarium graminearum, Fay11 and AC7T1-1, collected from soybean hosts, were obtained for use in resistance screening. Fay11 was collected in Ohio for a previous study [14], whereas isolate AC7T1-1 was obtained from a field scouting for soybean seedling disease samples in Indiana in 2019 [28] and was used for the first time in this study. The isolates were preserved for long-term storage in 20% glycerol both in liquid nitrogen and within a −80 °C freezer and regularly maintained on potato dextrose agar (PDA) on the benchtop (21 °C ± 2°).
Subcultures of the isolates were grown on 100 × 15 mm PDA plates for 7 days before transferring to a rice medium for inoculum increase. To a 12 L mycological spawn bag (0.44 µm filter), parboiled brown rice and distilled water were added at a 1:1 ratio. The rice and water were autoclaved twice for 40 min each at 121 °C with a 24 h period in between sterilizations. For every 700 g of rice, one fully colonized PDA plate was aseptically cut into approximately 1 cm2 pieces and added to the sterile rice medium in a biological safety cabinet. For the control treatments, sterile PDA plates were added to the rice medium instead. The inoculums were grown for 14 days on the benchtop and shaken every other day to ensure even colonization. Prior to plant inoculation, spawn bags were bulked for each treatment to ensure uniformity of the inoculum.

2.2. Plant Material

A total of 207 Glycine max and a single Glycine soja accession were selected from the USDA-SGC based on their adaptation to the North Central USA growing region (maturity groups 0-VI) and obtained through the USDA-ARS Germplasm Resources Information Network (GRIN) (Table 1). All 208 accessions were grown at the Purdue University Agronomy Center for Research and Education (ACRE) in 2020 and harvested using a single plant belt thresher with thorough cleanings between each threshing. These accessions were previously genotyped using the SoySNP50K BeadChip [29] and the corresponding SNP data are publicly available through the SoyBase database. Two of these accessions, PI 525453 and PI 424354, which were previously identified as resistant to F. graminearum [21], served as benchmarks throughout the analysis to compare their relative resistance under our experimental conditions. PI 548631 (cv. ‘Williams’) had previously been identified as susceptible in the same study and served as the susceptible check throughout our experiments [21]. Other resistant accessions referenced in the introduction were unavailable from GRIN at the time of this study.

2.3. Phenotyping

Phenotyping was conducted in a greenhouse in the spring of 2021 using a previously described procedure [30]. Seeds were selected from each accession that were uniform in size and color, as well as free from visible damage or disease symptoms. Resistance screening was performed in 53 × 27 cm plastic greenhouse flats with 48-cell inserts, with each cell measuring 3.8 × 6 × 5.8 cm. The trays were filled with twice steam-sterilized, fine-grade vermiculite and placed on flood benches filled with tap water to a height of 2 cm. A planting hole was placed 4 cm in depth and filled with 1.5 mL of either inoculated or mock-inoculated rice medium. Six seeds per accession were placed individually into separate cells of both treatments in direct contact with the inoculum and covered with sterile vermiculite. The accessions were arranged according to a randomized block design. The experiment was conducted three times between January and March 2021. The temperature was maintained at 24–28 °C with a 16:8 photoperiod with overhead lighting. The water level was maintained at 2 cm throughout the duration of each experiment.
Measurements were made 14 days after planting (DAP) and included the fresh root weight and stand count of each accession in both treatments. The ratio of root weight (RRW) score, proposed by Lin et al., was selected to detect small effect differences in root rot severity, which are difficult to discern visually [30]. Furthermore, this score incorporates the stand count and root weight data in a single unified disease measure thereby reducing the number of input phenotype variables in our GWAS (i.e., in the case of running a GWAS separately on stand counts and root weight). Briefly, the baseline germination of each accession was first estimated as the average stand count across all mock-inoculated control treatments. Then, the RRW scores for each accession in each replicate were calculated as follows:
RRW = Total   fresh   root   weight   of   the   inoculated   replicate Baseline   germination   of   all   three   controls   Total   fresh   root   weight   of   the   control   replicate Stand   count   of   the   same   control   replicate
To test if the RRW, as a unified disease measure, was an accurate reflection of an accession’s resistance to F. graminearum, correlations were tested between the RRW and two previously validated disease indices for seedling diseases, adjusted stand count, and standardized root weight [31,32]. The adjusted stand count was calculated by taking the number of germinated seeds in an inoculated replicate divided by the number of seeds germinated in its matched control. Seeds were considered to have germinated if their cotyledons were fully emerged above the surface of the vermiculite. The standardized root weight was calculated by dividing the fresh root weight of an inoculated replicate by the fresh root weight of its matched mock-inoculated control. Pearson’s correlation coefficients were calculated between the averages of the RRW scores, adjusted stand count, and standardized root weight measures using ‘cor.test’ in base R [33]
All accessions were tested first against isolate AC7T1-1 collected in Indiana. A subset of the accessions with the top 30 highest RRW scores and bottom 10 RRW scores, as well as the resistant checks, were then screened against Fay11 using the same procedures as above.

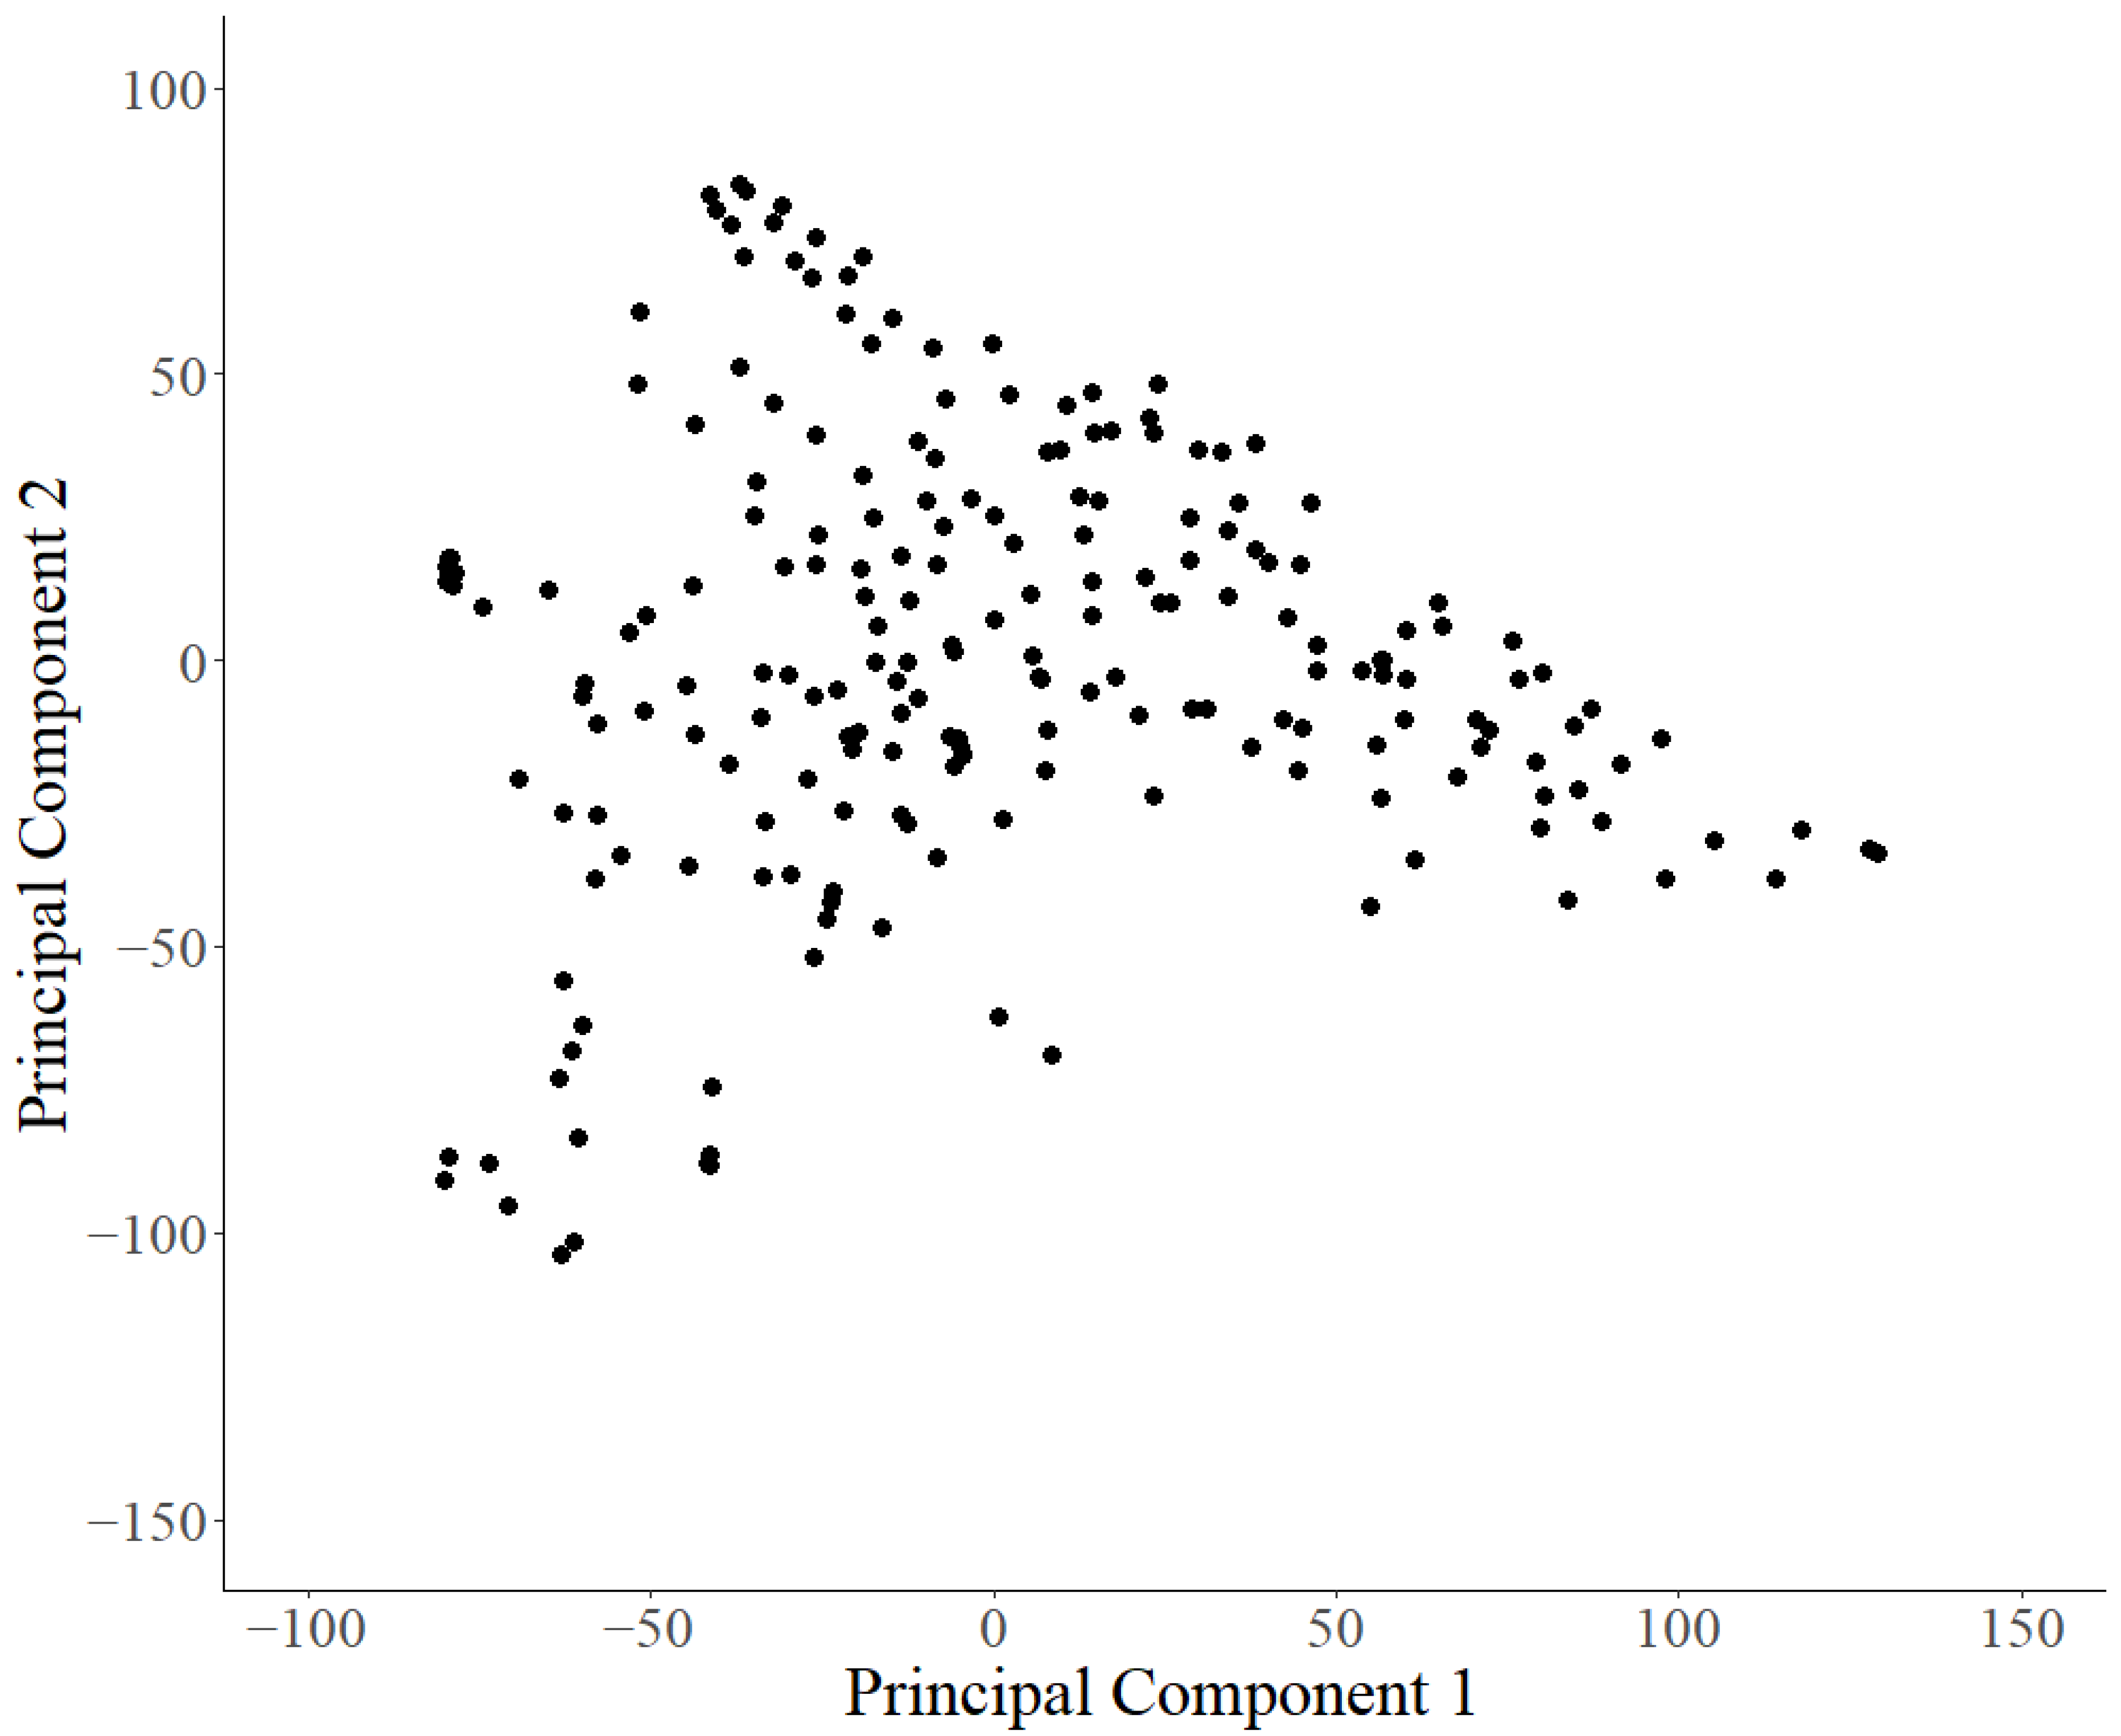
2.4. Genome-Wide Association Study

The SNP files were downloaded from SoyBase for each of the 208 accessions. A GWAS was performed using the GAPIT3 (version 3.1.0) package in R with the statistical procedure ‘BLINK’ [34,35]. Pedigree data for this population are largely unknown, since the majority of the accessions screened here were land races. Principal component analysis (PCA) was performed on the SNP data using the function ‘prcomp’ in base R to identify the population structure among our accessions. Principal components explaining more than 5% of the variance of the SNPs inherited by each of the 208 accessions were included in the GWAS to control for population stratification [33]. The mean RRW score for each accession across all three replicates was used as the phenotype.

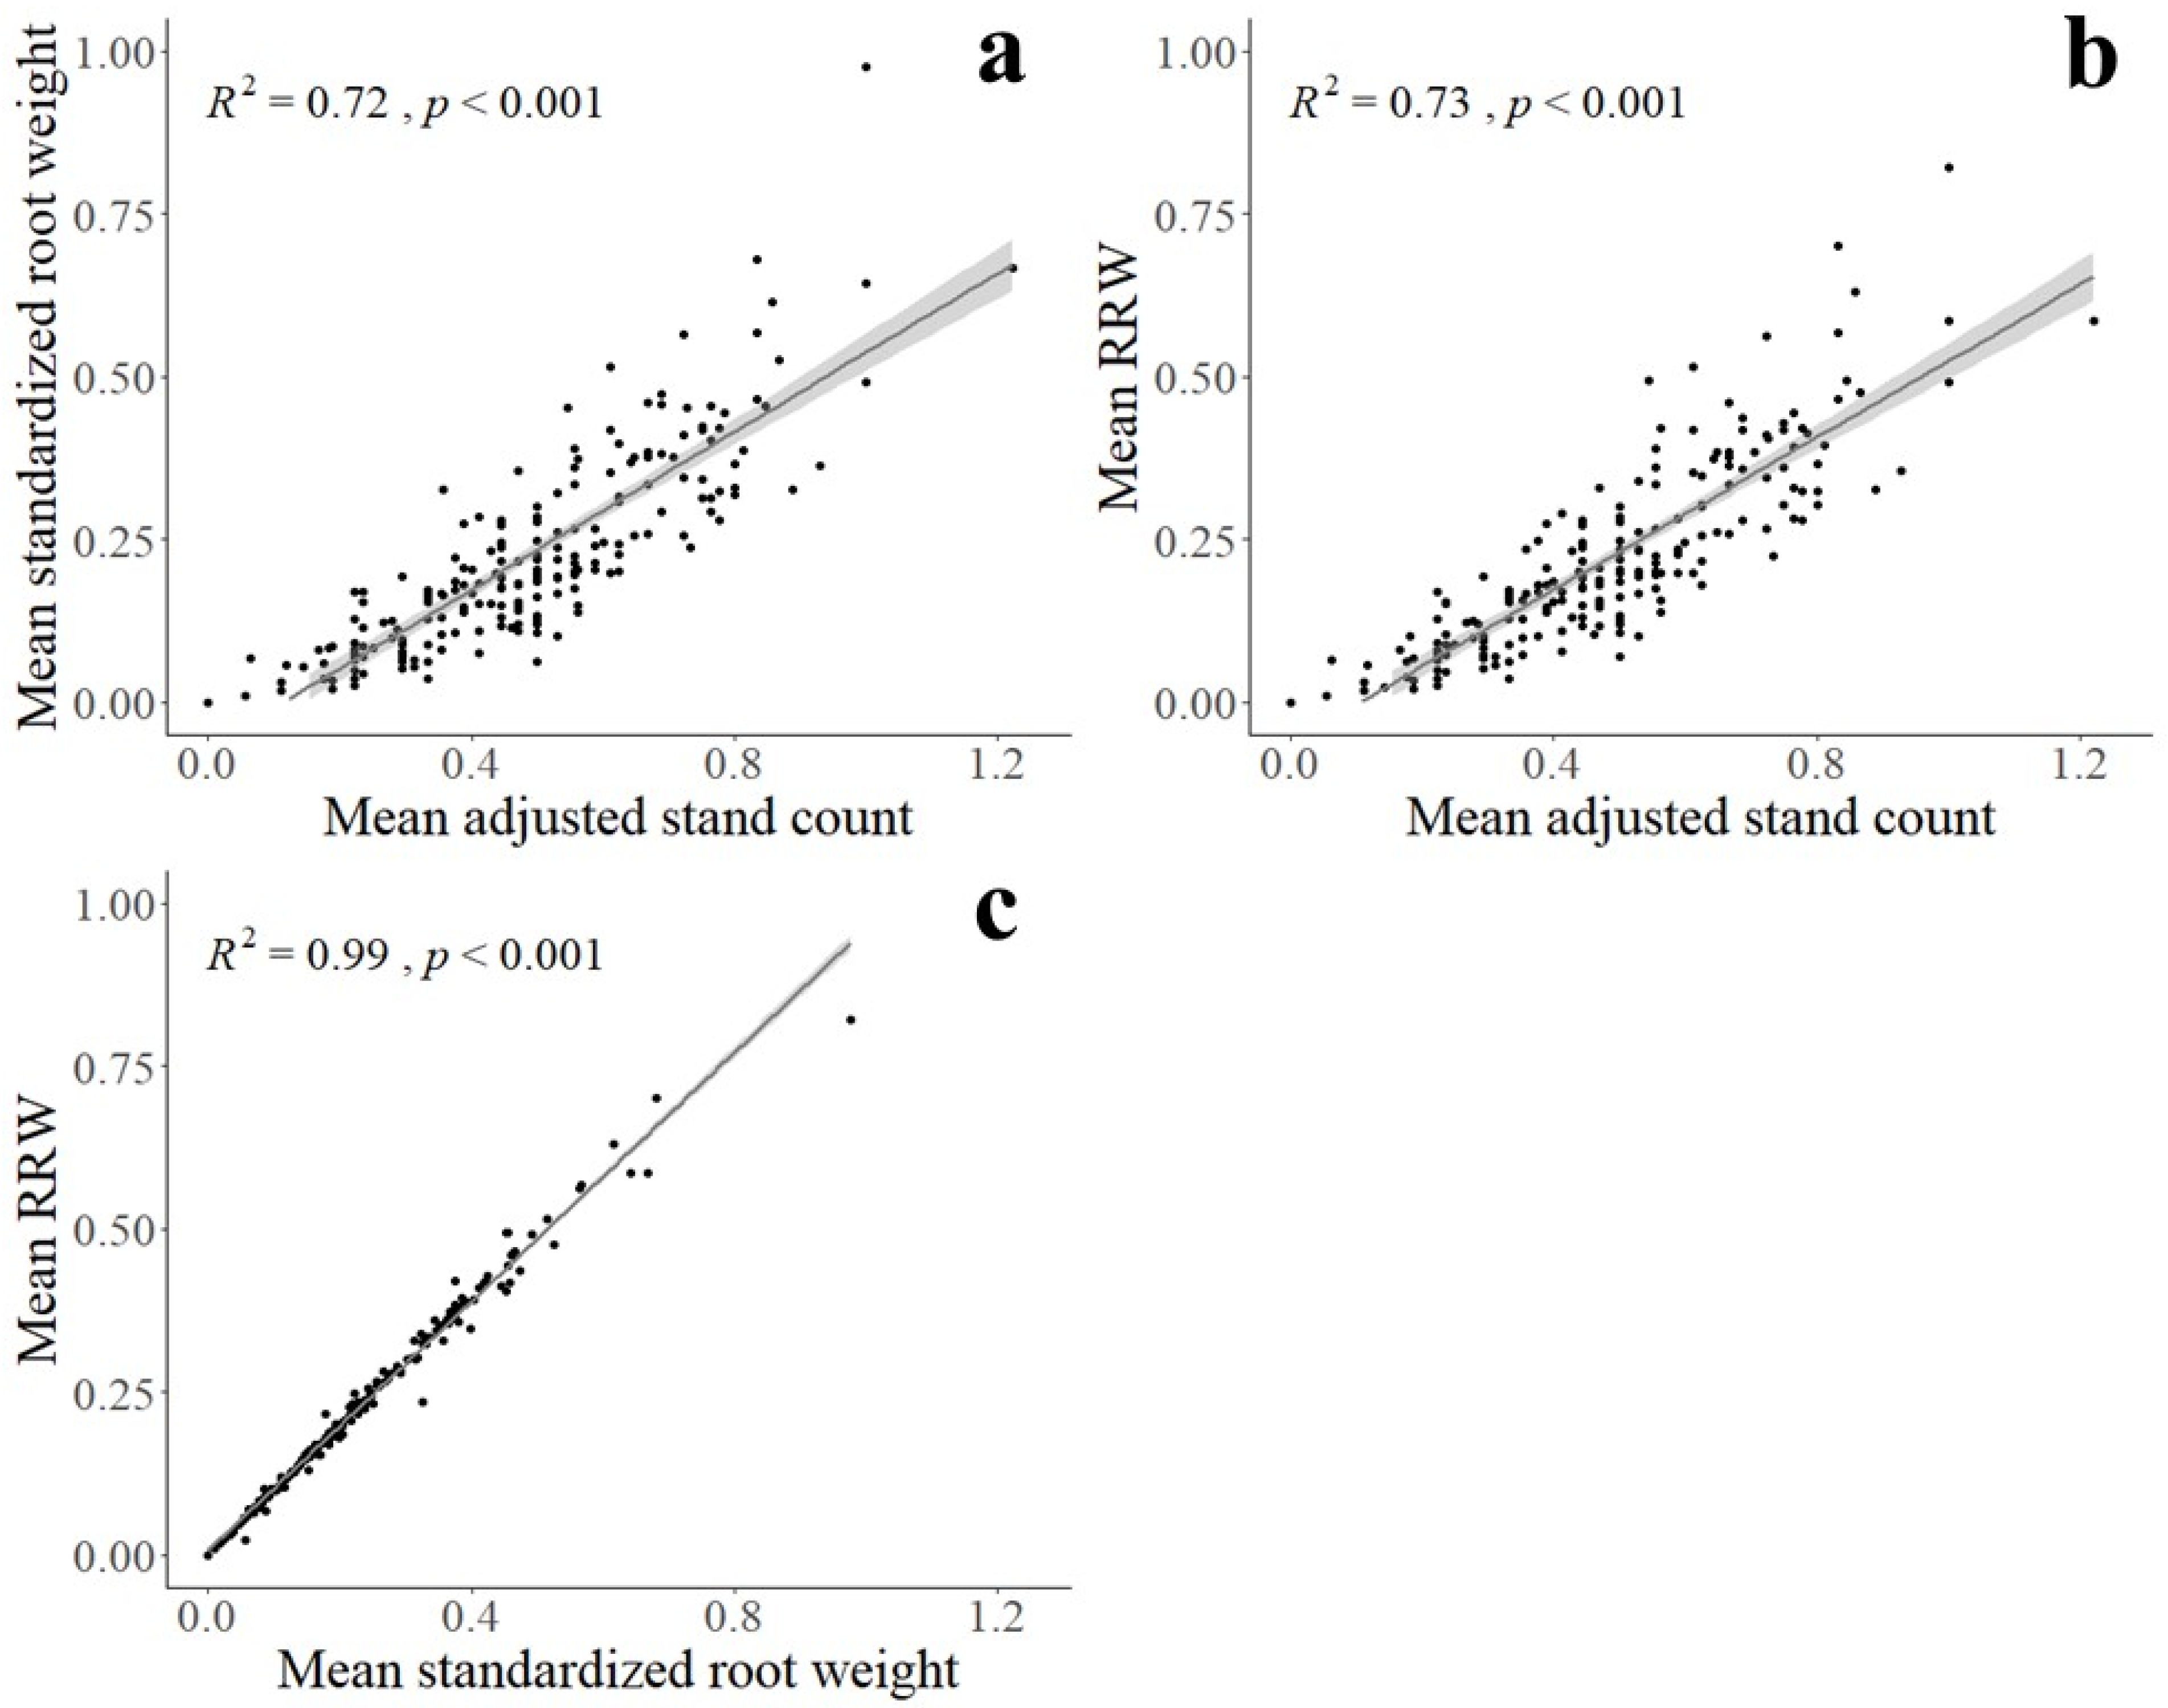
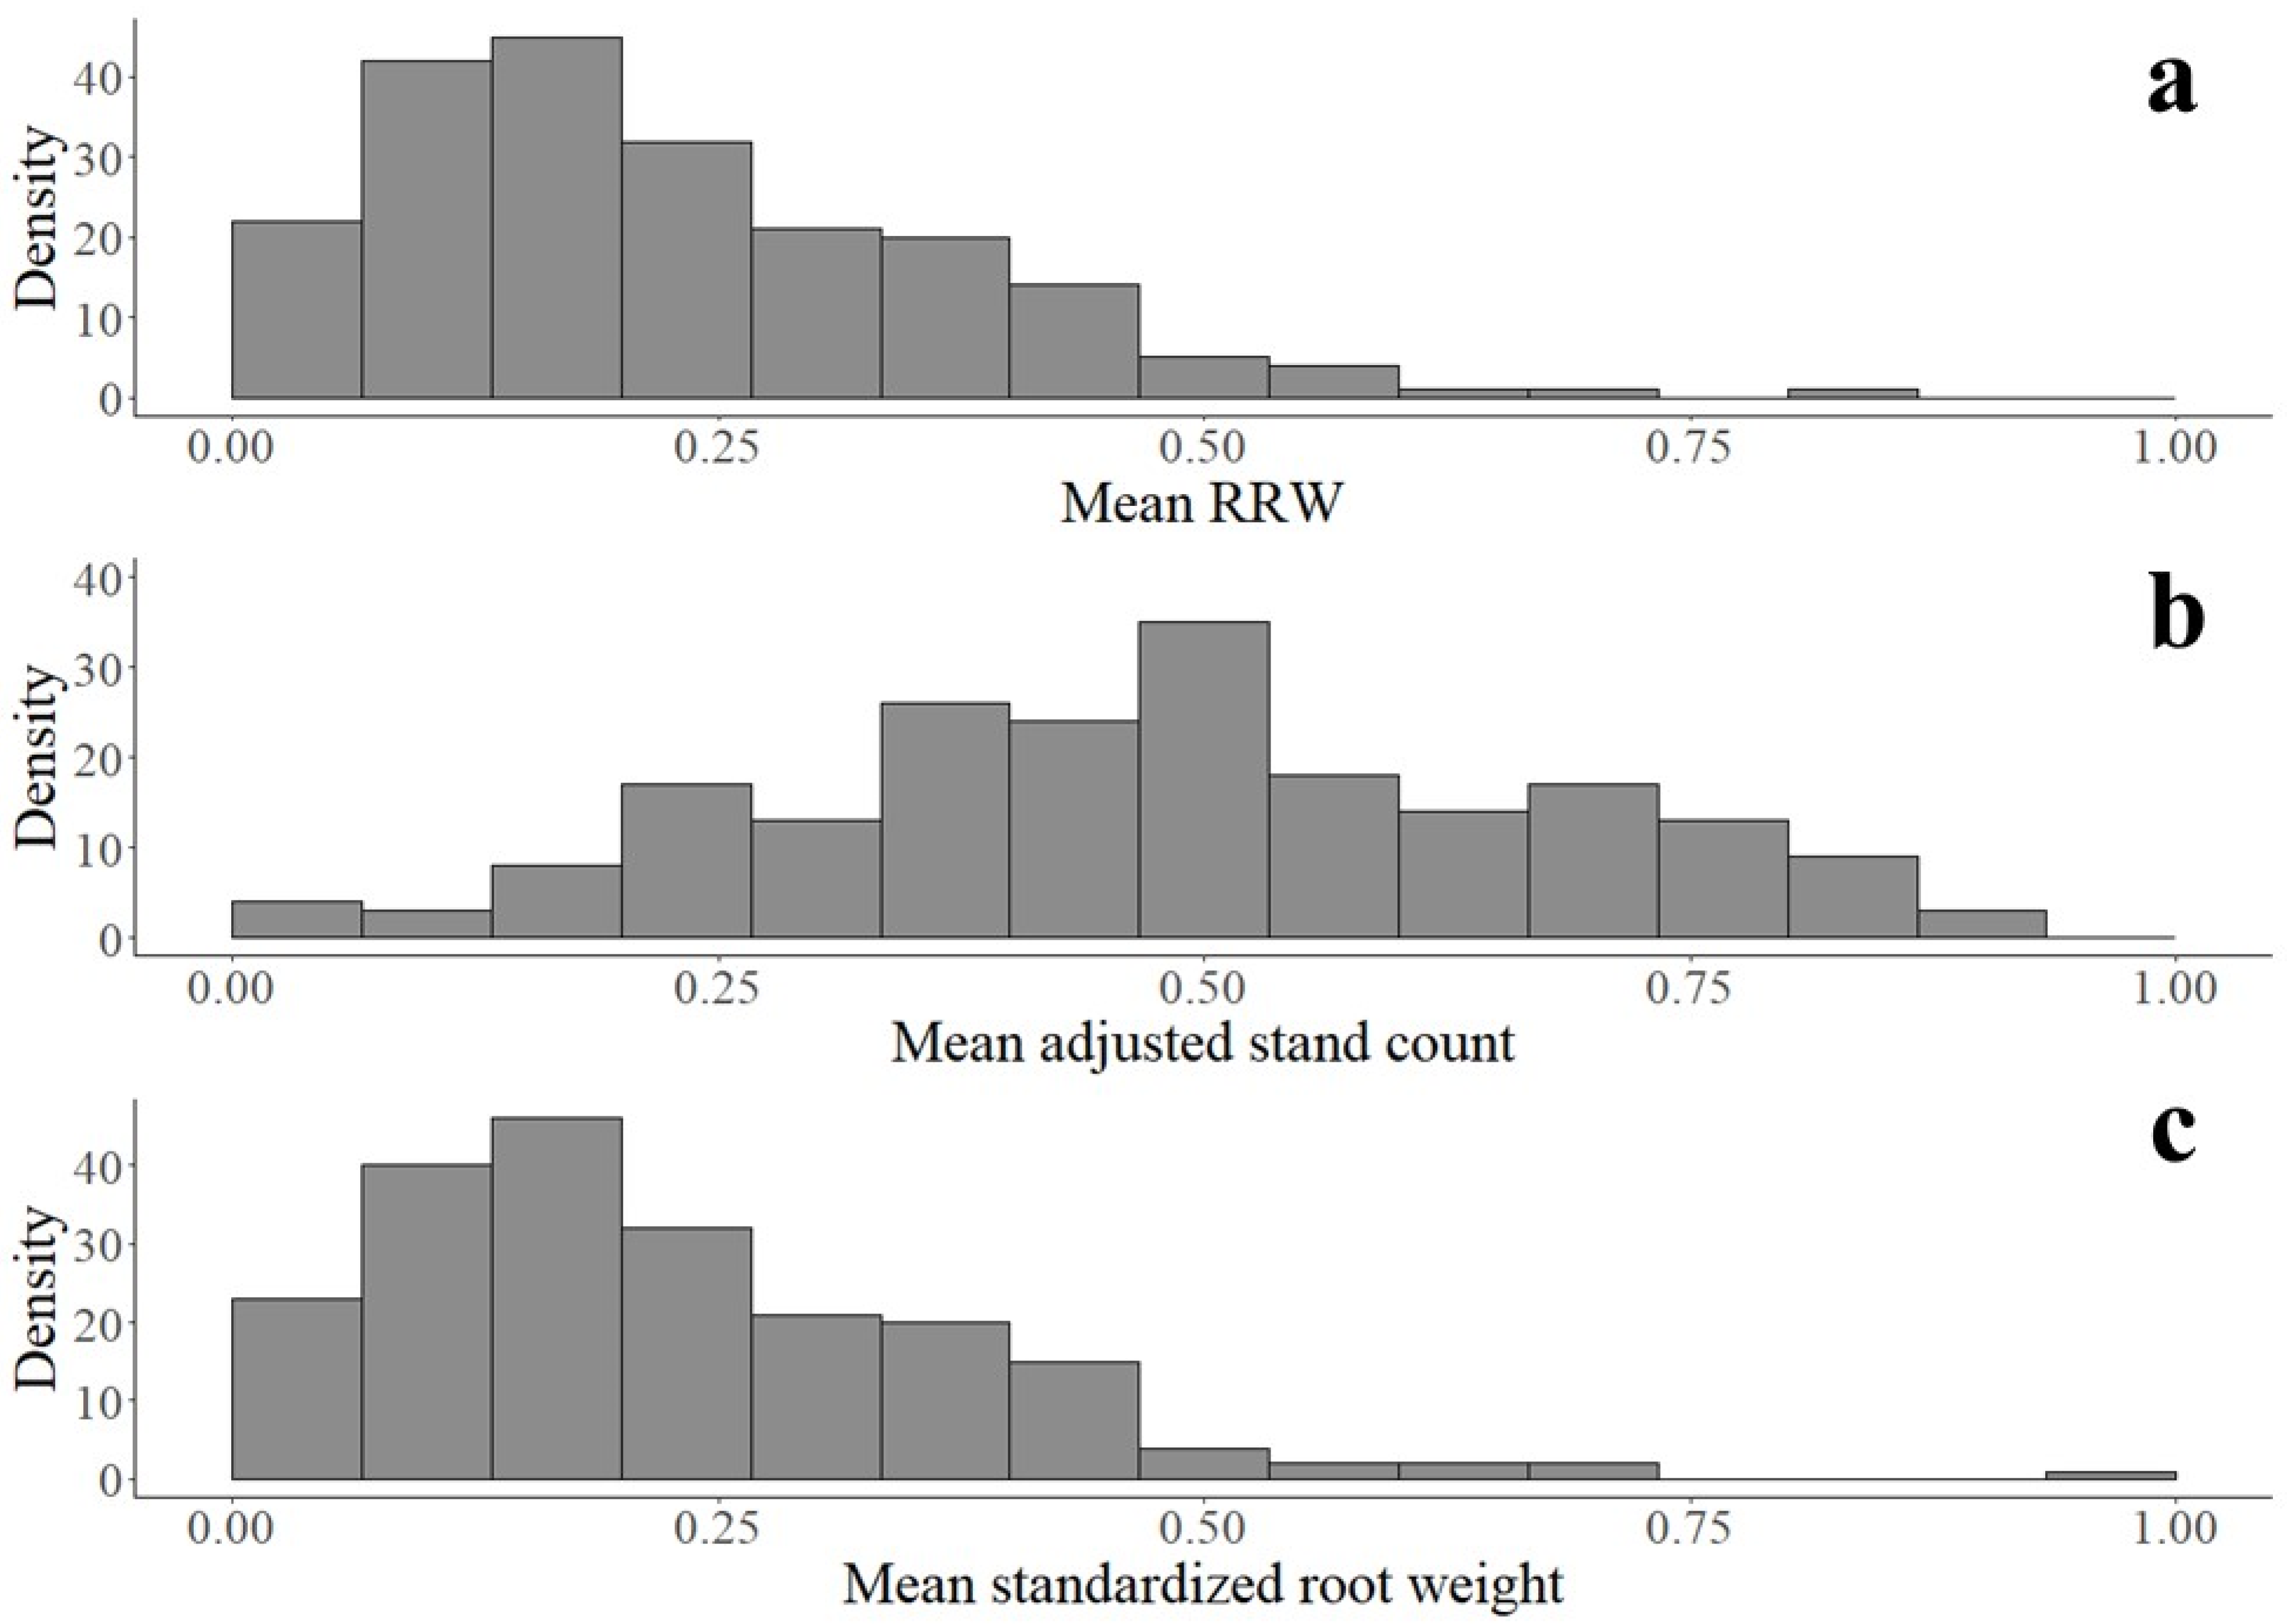
2.5. Statistical Analysis

A linear mixed model was fit with accessions set as fixed effect and replicates assigned as random effect using the package ‘lme4′ [36] in R as follows:
Yij = µ + Acci + Repj + εij
where Yij is the observed RRW score of the ith accession in the jth replicate, µ is the intercept and estimated baseline mean before any effects, Acci is the ith accessional fixed effect, Repj is the jth replicate random effect, and εij is the residual variance associated with the observation of the ith accession in the jth replicate. The p-values for each genotype’s estimated effect were calculated using ‘lmerTest’ with Satterthwaite’s approximation of degrees of freedom at an alpha of 0.05 [37]. Variance components were generated by decomposing the above model with both accession and replicate as random effects to calculate broad-sense heritability (H2) as follows:
H 2 = σ g 2 σ g 2 + σ e 2 r
where σ g 2 is the genotypic variance, σ e 2 is the error variance, and r is the number of replicates.

3. Results

3.1. Soybean Accessions Resistant to Fusarium graminearum

The panel of soybean accessions tested represent diverse geographic origins and are all of suitable maturity groups for growth in various locations of the North Central USA where most soybeans are produced (Table 1). A mixture of seed coat colors was included, although no correlation was found between significantly resistant accessions and the seed coat color trait. The symptoms of seedling diseases, including damping-off, root discoloration, necrotic lesions, and root system stunting, compared to the mock-inoculated controls were abundantly evident in the inoculated treatments by 14 DAP. No accession showed a symptomless immune-type reaction to inoculation, but visual differences in disease severity for the symptoms listed above were clear across accessions.
Isolate Fay11, which was reported to be highly virulent in previous publications [14,21,22,23,38,39] showed reduced virulence across all replicates, even in the susceptible check PI 548631 (Supplementary Materials Figure S1). As such, data from this isolate were excluded, and all statistical analyses were performed using only the three replicates inoculated with the AC7T1-1 isolate. Pearson’s correlation tests indicated that the RRW score was significantly correlated with both standardized root weight and adjusted stand count (p < 0.001) but more closely for the standardized root weight (Figure 1). The accessions showed a continuous distribution of the mean RRW scores ranging from 0 to 0.823 (Table 1). The mean RRW scores were left-skewed, with most accessions scoring below 0.50 (Figure 2). The mean RRW score was 0.224, with a standard deviation of 0.14 across accessions. The two resistant check accessions, PI 525453 and PI 424354, had average RRW scores of 0.118 and 0.102, respectively, which were lower but nonsignificantly than the population average. The susceptible check had a mean RRW of 0.066 and was the 22nd most susceptible accession of the 208. The adjusted stand counts followed a normal distribution (Figure 2) with a mean of 0.488 and standard deviation of 0.21. Only one accession, PI 548162, failed to germinate even a single seed after inoculation, despite an average control germination of 5.333 seeds.
A linear mixed model was fitted to reduce the variance introduced by replicate differences through introducing replicates as random effect. The estimated variance for replicate was 0.013. The model’s intercept was estimated at an RRW score of 0.224 prior to introducing accessional effects. The estimated accessional fixed effects ranged from −0.225 to 0.598 in this population. The accession effects were found to be significantly correlated with the RRW score as a dependent measure (p < 0.001) (Table 2). PI 548311, PI 438500, PI 561318 A, PI 547690, PI 391577, PI 157484, PI 632418, and PI 70466 -3 all had significant positive estimated effects on the model’s mean (Table 3). Their mean RRW scores ranged from 0.495 to 0.823, while the population’s mean was 0.224. PI 525453 and PI 424354, which were previously reported as resistant, had nonsignificant but negative estimated effects on the mean, indicating that they were not resistant under the conditions of our experiment. No accessions were identified as significantly more susceptible than the mean. The full random model estimated the genotypic variance to be 0.011 and the error variance to be 0.028, and the heritability of the RRW score was calculated to be 54.1%.

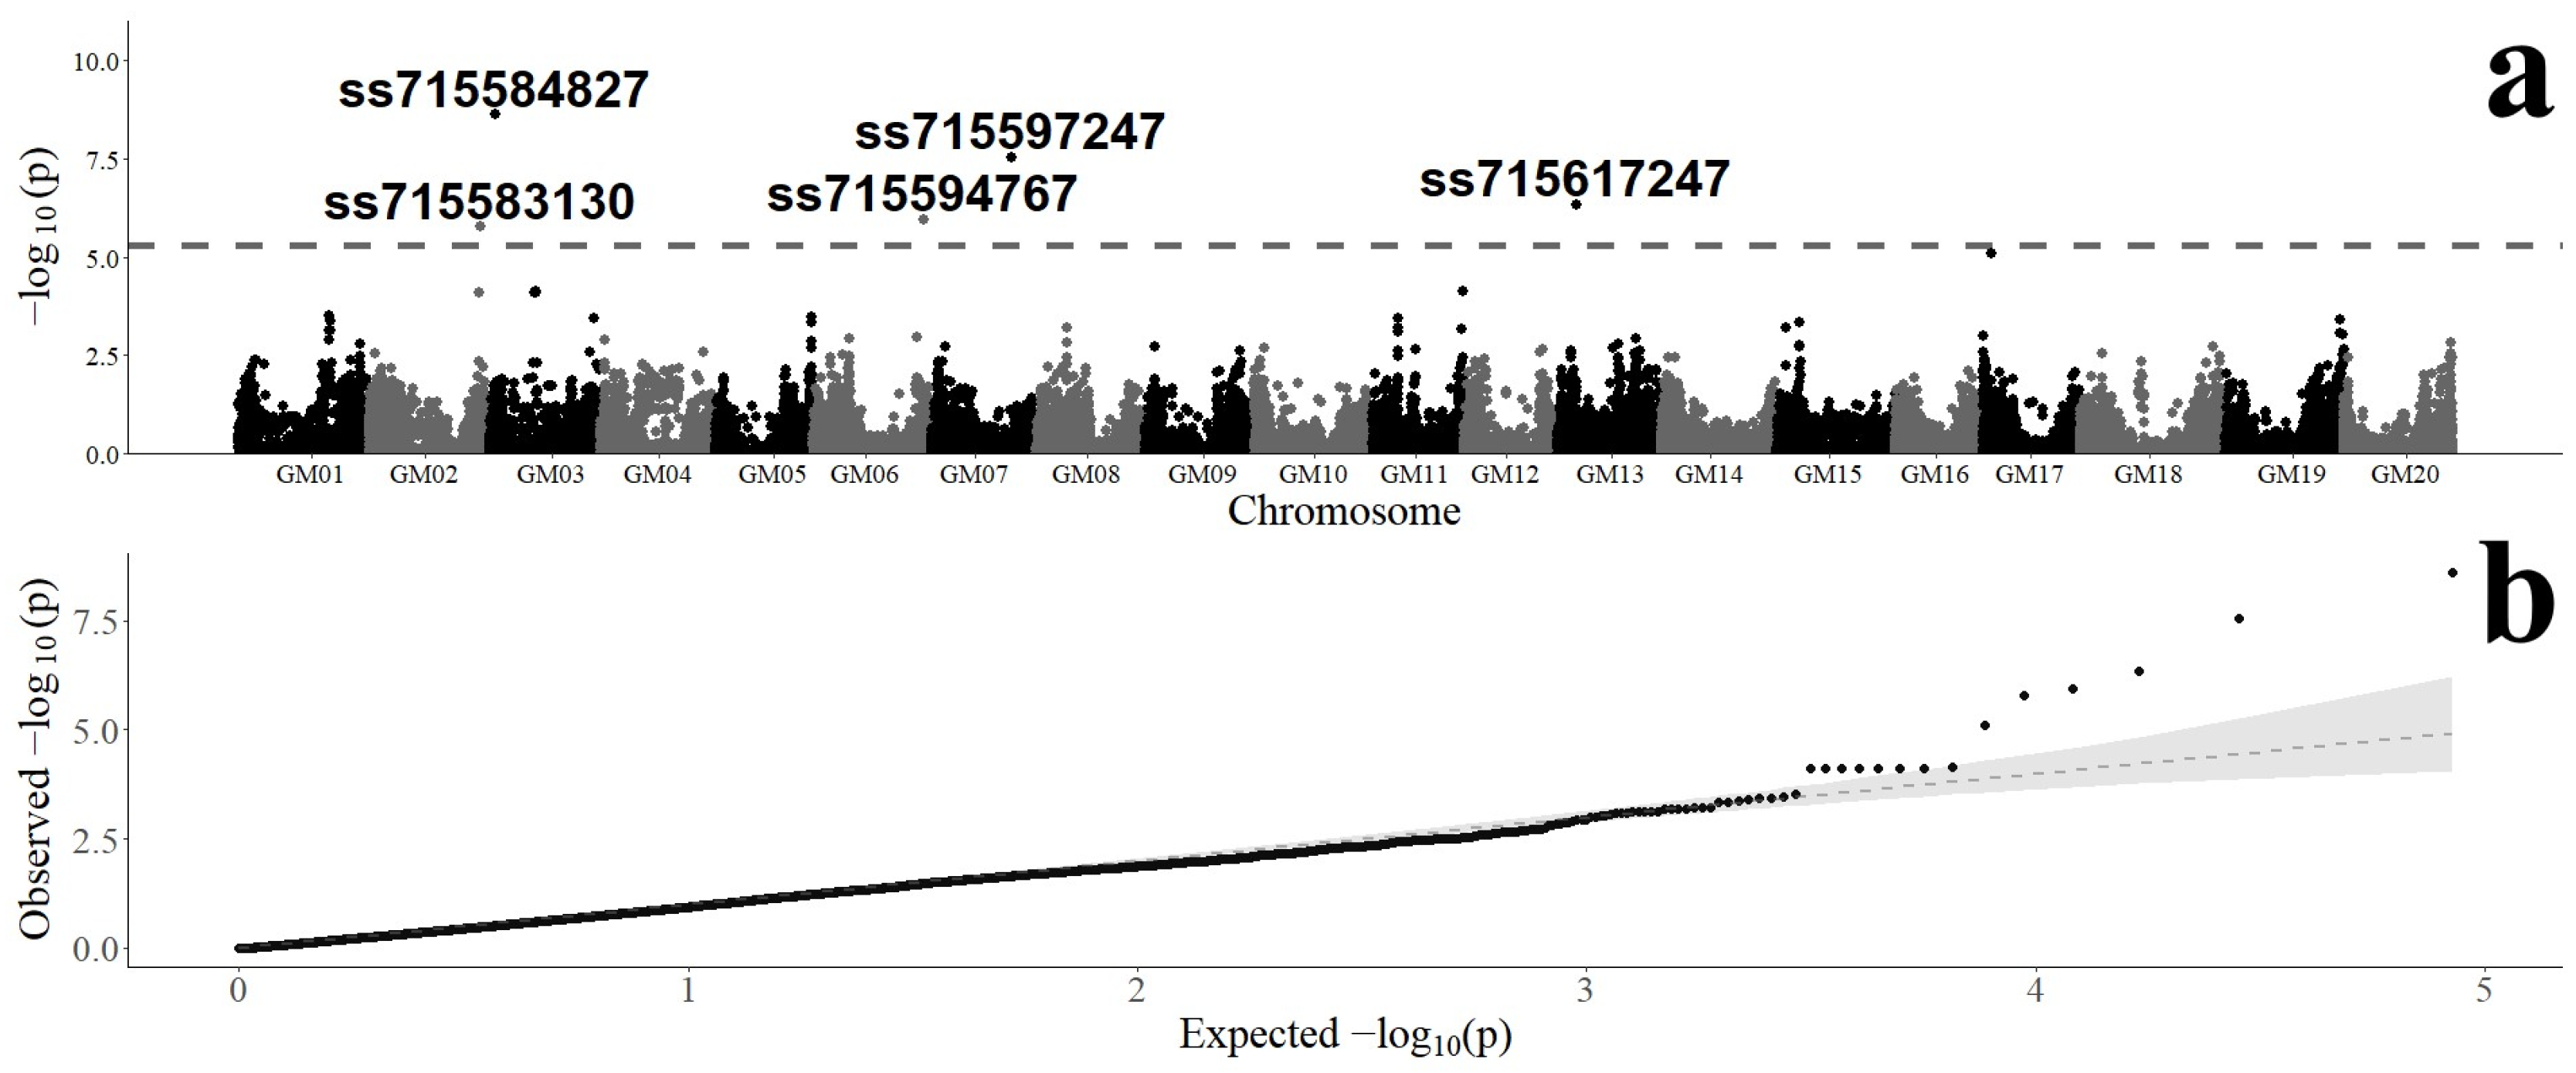
3.2. Genome-Wide Association of SNP Markers with Fusarium graminearum Resistance

PCA was used to estimate the relatedness among accessions, and two components contributing more than 5% of the variance in the SNP data for the population were identified (Figure 3). Component 1 explained 15.78% of the variance, and component 2 explained 6.14%. The number of principal components called in the subsequent GWAS was correspondingly set to two.
Five significant (false discovery rate (FDR)-adjusted p-value < 0.05) MTAs were discovered on chromosomes Gm02, Gm03, Gm06, Gm07, and Gm13 (Figure 4). Each MTA contributed between 3.0 and 4.8% of the variance in the mean RRW score, with an average effect size of 3.7% per locus (Table 4). The minor allele variant of each MTA was responsible for positive effects on chromosomes Gm02, Gm06, and Gm13 and negative effects on Gm03 and Gm13. The lowest minor allele frequency observed across these significant associations was 0.24. The ranked RRW scores and estimated effects in the model of the eight resistant accessions closely mirrored the estimated cumulative allelic effects for each accession at the five significant MTA loci (Table 5). PI 438500 was the exception to this trend, having the lowest estimated allelic effects but having the second highest mean RRW score and estimated effect in the model. Additionally, 29 markers were identified as associated with the RRW score before applying the FDR adjustment but failed to reach the significance threshold after adjustment (Supplementary Materials Table S1).

4. Conclusions and Discussion

In this study, a total of 208 soybean accessions from the USDA-SGC were evaluated for resistance to Fusarium graminearum. Eight accessions were identified as significantly resistant to the pathogen based on a unified RRW score encompassing quantitative measures of fresh root weight and stand count. A GWAS revealed five significantly associated markers underlying the phenotypic resistance. These findings and the corresponding MTAs underlying the phenotypes of the examined accessions contribute valuable knowledge and genetic resources for resistance to F. graminearum that are potentially useful for researchers, breeders, and growers.
The eight resistant accessions identified in this study are of immediate utility for further genetic dissection, including for mapping of the QTL detected by our GWAS. Two of the accessions (PI 548311 and PI 632418) are improved cultivars bred for desirable agronomic performance, making them particularly useful for breeders looking to perform introgression of F. graminearum resistance with minimal or no drag of undesirable agronomic qualities. Five of the accessions (PI 157484, PI 391577, PI 438500, PI 70466 -3, and PI 561318 A) are collections of land races with unknown improvement status, suggesting that soybean varieties grown in the past may have had better genetic resistance to F. graminearum. This could help to explain F. graminearum’s relatively unknown role in soybean disease until 2004. However, a much more comprehensive screening would be needed to confirm this trend. The remaining resistant accession (PI 547690) is a progeny line from a genetic cross of ‘Harosoy (6)’ x PI 548195. Neither parent was tested for resistance in this screening. Future work should include evaluating these two parental lines, as well as other accessions from their pedigree, to identify the donor of the resistance found here.
Variation in the standard error across the replicates among the eight resistant accessions was observed. This could indicate that factors underlying some of the phenotypic resistance may be sensitive to discrete environmental variation not fully controlled in a greenhouse environment. This is consistent with previous findings that quantitative resistance is much more likely to show sensitivity to environmental factors than major R-gene-mediated resistance [1]. It is unknown what role confounding and discrete environmental factors may play in the efficacy of resistance of the eight accessions or any other accession carrying the resistance markers uncovered here. As with all greenhouse findings, field trials under typical soybean growing conditions should be conducted to confirm the durability of the sources of resistance discovered here.
The eight accessions identified as resistant for the first time by this study were significantly more resistant than two previously reported accessions (PI 525453 and PI 424354) when screened under the conditions of our experiment [14]. This could suggest that either the accessions screened in this study are more resistant than the two previously reported accessions included as checks or that resistance may be isolate specific. Additionally, the differences in our germplasm assay procedures and measurements versus the original procedures under which resistance was first identified may have led to the nonsignificant performance of the two check accessions. In the case of the first hypothesis, there is now evidence that germplasm more resistant to F. graminearum exists in the USDA-SGC that may have a larger phenotypic effect than previously reported resistant accessions. Therefore, it is justified to continue screening germplasm from the collection, as more highly resistant accessions may still be uncovered.
Because of the inability of Fay11 to infect even strongly susceptible accessions from this population, we were unable to compare our resistance to the check accessions using the isolate they were originally screened against. The pathogenicity of Fay11 has been confirmed on Petri plate assays and rolled towel assays in numerous publications since its isolation in 2007 [14,22,23,38,39]. Whether the hypovirulence was due to our specific screening procedure (i.e., infested layer versus rolled towel assay) or due to a loss of virulence during repeated subculturing is unknown. Regardless, data were excluded from all replicates inoculated with Fay11, and resistance is only confidently reported here against isolate AC7T1_1. Further work is needed to confirm the presence of isolate-specific resistance in any of the accessions reported so far.
Seed coat properties, such as permeability and pigments indicating high flavonoid concentrations, have previously been linked to resistance against seed rot pathogens, particularly in soybean [24]. The eight significantly resistant accessions included a mixture of four yellow, one brown, one greenish brown, one light green, and one black seed coat accessions. While the seed coat color could play a role in some of the resistance discovered here, there was no obvious trend between resistance to the isolate AC7T1_1 and seed coat color that would implicate it as a primary factor in the resistance of the accessions reported here.
To the best of our knowledge, the five significant SNP markers and their association with F. graminearum resistance have not been reported elsewhere. Despite being detected from a different population of soybean accessions, several of the markers were near MTAs and QTL reported in other studies. The marker on chromosome 2 is 4.6 mega base pairs (mbp) away from an MTA correlated with F. graminearum resistance uncovered in another study that is currently in press [38]. These separate detections may corroborate the same resistance loci in the same genomic region or represent two unique loci on the same chromosome. Interestingly both the marker from this study and that reported by Okello et al. are not within the only other reported QTL associated with F. graminearum resistance on chromosome 2 [27]. Both markers lie more than 10 mbp away from the nearest flanking marker of the QTL and are separated by multiple recombination hot spots [40]. The MTA detected on chromosome 13 lies roughly 4.1 mbp from the QTL for F. graminearum resistance independently identified in two different studies [21,22]. The MTA also lies within the F. graminearum resistance QTL reported by Zhang et al.; however, the marker interval is reported to span over 28 mbp, which may encompass regions well beyond the true QTL responsible for the observed resistance [27]. The MTAs on chromosomes 6 and 7 appear to represent novel QTL and are over a minimum of 19 mbp and 79 mbp, respectively, from any reported QTL or MTA on those chromosomes [23,25,26,27]. Additionally, several markers were in genomic regions reportedly carrying resistance loci to other root rot pathogens. The marker on chromosome 6 was within a region believed to contain the independently validated F. virguliforme quantitative resistance locus qRfv06-01, the marker on chromosome 7 was within the region reported for a putative QTL for Pythium ultimum var. ultimum resistance, and the marker on chromosome 13 was within a region for partial resistance to Phytophthora sojae containing the qRps13-01 locus. Additionally, the marker on chromosome 3 was 600 kbp away from the major R gene Rps9 governing P. sojae resistance [41,42].
Many more markers tentatively associated to F. graminearum resistance were eliminated in the FDR-adjustment of the p-values. FDR adjustments significantly reduce the number of type I errors (i.e., false positives) but simultaneously increase the chance of type II errors (i.e., false negatives). Our heritability estimate indicated a 54.1% heritability of the variation in the RRW score, but our five significant loci had a combined estimated effect explaining only 20.2% of the variation (Table 5). Furthermore, one accession (PI 438500) contained the fewest of our significant MTAs but had the second-best resistance of the eight significantly resistant accessions. One or several more markers responsible for the missing heritability in this study may have been lost as false negatives. Interestingly, a marker on chromosome 17 nearly made the FDR-adjusted cutoff (FDR-adjusted p = 0.0564) and is within 5 and 6 mbp of two predicted defense genes annotated on that chromosome in the ‘Williams82’ reference genome, which were identified through a meta-analysis of GWAS and transcriptome data [43]. It is also only 3.7 mbp away from another MTA, detected by Zhang et al. [26]. The marginally nonsignificant MTA on chromosome 17 could be a detection of one or both of the predicted loci reported by Almeida-Silva and Venancio or the same region linked to the MTA identified by Zhang et al. However, the predicted effect size of the MTA on chromosome 17 does not fully explain the missing percentage of the heritability calculation. Other loci affecting F. graminearum resistance may or may not be present in conjunction with this potentially false negative (Supplementary Materials Table S1).

Supplementary Materials

The following supporting information can be downloaded at: https://www.mdpi.com/article/10.3390/agronomy13092376/s1, Figure S1: Mean RRW scores ± standard error after inoculation with Fay11 of the 30 highest and 10 lowest RRW scoring accessions identified after inoculation with AC7T1_1.; Table S1: SNP markers associated with susceptible and resistant phenotypes to Fusarium graminearum before FDR-adjustment.

Author Contributions

Conceptualization: G.C.; methodology: G.C. and C.D; investigation: C.D. and G.C.; analysis: C.D. and G.C.; writing—original draft preparation: C.D.; writing—review and editing: G.C. and J.M.; project administration: G.C.; funding acquisition: G.C. and J.M. All authors have read and agreed to the published version of the manuscript.

Funding

This work was supported by the Indiana Soybean Alliance of the United States of America.

Data Availability Statement

Not applicable.

Acknowledgments

The authors would like to thank Anne Dorrance of the Ohio State University and her lab group for providing the isolate Fay11 for use in this study. We would like to thank Steven R. Scofield of ARS, USDA, for reviewing and commenting on this manuscript.

Conflicts of Interest

The authors declare no conflict of interest.

References

  1. Agrios, G.N. Plant Pathology, 5th ed.; Elsevier Academic Press: Burlington, MA, USA, 2005. [Google Scholar]
  2. Lamichhane, J.R.; Dürr, C.; Schwanck, A.A.; Robin, M.-H.; Sarthou, J.-P.; Cellier, V.; Messéan, A.; Aubertot, J.-N. Integrated management of damping-off diseases. A review. Agron. Sustain. Dev. 2017, 37, 10. [Google Scholar] [CrossRef]
  3. Pimentel, M.F.; Srour, A.Y.; Warner, A.J.; Bond, J.P.; Bradley, C.A.; Rupe, J.; Chilvers, M.I.; Rojas, J.A.; Jacobs, J.L.; Little, C.R.; et al. Ecology and diversity of culturable fungal species associated with soybean seedling diseases in the Midwestern United States. J. Appl. Microbiol. 2022, 132, 3797–3811. [Google Scholar] [CrossRef] [PubMed]
  4. Rojas, J.A.; Jacobs, J.L.; Napieralski, S.; Karaj, B.; Bradley, C.A.; Chase, T.; Esker, P.D.; Giesler, L.J.; Jardine, D.J.; Malvick, D.K.; et al. Oomycete species associated with soybean seedlings in North America—Part I: Identification and pathogenicity characterization. Phytopathology 2017, 107, 280–292. [Google Scholar] [CrossRef] [PubMed]
  5. Rojas, J.A.; Jacobs, J.L.; Napieralski, S.; Karaj, B.; Bradley, C.A.; Chase, T.; Esker, P.D.; Giesler, L.J.; Jardine, D.J.; Malvick, D.K.; et al. Oomycete species associated with soybean seedlings in North America-part II: Diversity and ecology in relation to environmental and edaphic factors. Phytopathology 2017, 107, 293–304. [Google Scholar] [CrossRef] [PubMed]
  6. Allen, T.W.; Bradley, C.A.; Sisson, A.J.; Byamukama, E.; Chilvers, M.I.; Coker, C.M.; Collins, A.A.; Damicone, J.P.; Dorrance, A.E.; Dufault, N.S.; et al. Soybean yield loss estimates due to diseases in the United States and Ontario, Canada, from 2010 to 2014. Plant Health Prog. 2017, 18, 19–27. [Google Scholar] [CrossRef]
  7. Bradley, C.A.; Allen, T.W.; Sisson, A.J.; Bergstrom, G.C.; Bissonnette, K.M.; Bond, J.; Byamukama, E.; Chilvers, M.I.; Collins, A.A.; Damicone, J.P.; et al. Soybean yield loss estimates due to diseases in the United States and Ontario, Canada, from 2015 to 2019. Plant Health Prog. 2021, 22, 483–495. [Google Scholar] [CrossRef]
  8. Koenning, S.R.; Wrather, J.A. Suppression of soybean yield potential in the continental United States by plant diseases from 2006 to 2009. Plant Health Prog. 2010, 11, 5. [Google Scholar] [CrossRef]
  9. Wrather, J.A.; Koenning, S.R. Estimates of disease effects on soybean yields in the United States 2003 to 2005. J. Nematol. 2006, 38, 173–180. [Google Scholar]
  10. Winsor, S. Keep your eyes open for these wet-season soybean diseases. Crops Soils Mag. 2020, 53, 16–23. [Google Scholar] [CrossRef]
  11. Bandara, A.Y.; Weerasooriya, D.K.; Conley, S.P.; Allen, T.W.; Esker, P.D. Modeling the relationship between estimated fungicide use and disease-associated yield losses of soybean in the United States II: Seed-applied fungicides vs. seedling diseases. PLoS ONE 2020, 15, e0244424. [Google Scholar] [CrossRef]
  12. Becher, R.; Hettwer, U.; Karlovsky, P.; Deising, H.B.; Wirsel, S.G.R. Adaptation of Fusarium graminearum to tebuconazole yielded descendants diverging for levels of fitness, fungicide resistance, virulence, and mycotoxin production. Phytopathology 2010, 100, 444–453. [Google Scholar] [CrossRef] [PubMed]
  13. Broders, K.D.; Lipps, P.E.; Paul, P.A.; Dorrance, A.E. Evaluation of Fusarium graminearum associated with corn and soybean seed and seedling disease in Ohio. Plant Dis. 2007, 91, 1155–1160. [Google Scholar] [CrossRef] [PubMed]
  14. Ellis, M.L.; Broders, K.D.; Paul, P.A.; Dorrance, A.E. Infection of soybean seed by Fusarium graminearum and effect of seed treatments on disease under controlled conditions. Plant Dis. 2011, 95, 401–407. [Google Scholar] [CrossRef]
  15. Talas, F.; McDonald, B.A. Significant variation in sensitivity to a DMI fungicide in field populations of Fusarium graminearum. Plant Pathol. 2015, 64, 664–670. [Google Scholar] [CrossRef]
  16. Pioli, R.N.; Mozzoni, L.; Morandi, E.N. First report of pathogenic association between Fusarium graminearum and soybean. Plant Dis. 2004, 88, 220. [Google Scholar] [CrossRef] [PubMed]
  17. Díaz Arias, M.M.; Munkvold, G.P.; Ellis, M.L.; Leandro, L.F.S. Distribution and frequency of Fusarium species associated with soybean roots in Iowa. Plant Dis. 2013, 97, 1557–1562. [Google Scholar] [CrossRef]
  18. Díaz Arias, M.M.; Leandro, L.F.; Munkvold, G.P. Aggressiveness of Fusarium species and impact of root infection on growth and yield of soybeans. Phytopathology 2013, 103, 822–832. [Google Scholar] [CrossRef]
  19. Okello, P.N.; Petrovic, K.; Singh, A.K.; Kontz, B.; Mathew, F.M. Characterization of species of Fusarium causing root rot of Soybean (Glycine max L.) in South Dakota, USA. Can. J. Plant Pathol. 2020, 42, 560–571. [Google Scholar] [CrossRef]
  20. Zhang, J.X.; Xue, A.G.; Zhang, H.J.; Nagasawa, A.E.; Tambong, J.T. Response of soybean cultivars to root rot caused by Fusarium species. Can. J. Plant Sci. 2010, 90, 767–776. [Google Scholar] [CrossRef]
  21. Ellis, M.L.; Wang, H.; Paul, P.A.; St. Martin, S.K.; McHale, L.K. Identification of soybean genotypes resistant to Fusarium graminearum and genetic mapping of resistance quantitative trait loci in the cultivar conrad. Crop Sci. 2012, 52, 2224–2233. [Google Scholar] [CrossRef]
  22. Stasko, A.K.; Wickramasinghe, D.; Nauth, B.J.; Acharya, B.; Ellis, M.L.; Taylor, C.G.; McHale, L.K.; Dorrance, A.E. High-Density mapping of resistance QTL toward Phytophthora sojae, Pythium irregulare, and Fusarium graminearum in the same soybean population. Crop Sci. 2016, 56, 2476–2492. [Google Scholar] [CrossRef]
  23. Acharya, B.; Lee, S.; Rouf Mian, M.A.; Jun, T.-H.; McHale, L.K.; Michel, A.P.; Dorrance, A.E. Identification and mapping of quantitative trait loci (QTL) conferring resistance to Fusarium graminearum from soybean PI 567301B. Theor. Appl. Genet. 2015, 128, 827–838. [Google Scholar] [CrossRef]
  24. Million, C.R.; Wijeratne, S.; Cassone, B.J.; Lee, S.; Rouf Mian, M.A.; McHale, L.K.; Dorrance, A.E. Hybrid genome assembly of a major quantitative disease resistance locus in soybean toward Fusarium graminearum. Plant Genome 2019, 12, 180102. [Google Scholar] [CrossRef]
  25. Cheng, P.; Gedling, C.R.; Patil, G.; Vuong, T.D.; Shannon, J.G.; Dorrance, A.E.; Nguyen, H.T. Genetic mapping and haplotype analysis of a locus for quantitative resistance to Fusarium graminearum in soybean accession PI 567516C. Theor. Appl. Genet. 2017, 130, 999–1010. [Google Scholar] [CrossRef] [PubMed]
  26. Zhang, C.; Zhao, X.; Qu, Y.; Teng, W.; Qiu, L.; Zheng, H.; Wang, Z.; Han, Y.; Li, W. Loci and candidate genes in soybean that confer resistance to Fusarium graminearum. Theor. Appl. Genet. 2019, 132, 431–441. [Google Scholar] [CrossRef]
  27. Zhang, C.; Han, Y.; Qu, Y.; Teng, W.; Zhao, X.; Morris, B. Identification of quantitative trait loci underlying resistance of soybean to Fusarium graminearum. Plant Breed. 2020, 139, 141–147. [Google Scholar] [CrossRef]
  28. Detranaltes, C.; Cai, G. First report of Mycoleptodiscus terrestris causing root rot of soybean in Indiana. Plant Dis. 2021, 105, 1194. [Google Scholar] [CrossRef]
  29. Song, Q.; Hyten, D.L.; Jia, G.; Quigley, C.V.; Fickus, E.W.; Nelson, R.L.; Cregan, P.B. Fingerprinting Soybean Germplasm and Its Utility in Genomic Research. G3 Genes Genomes Genet. 2015, 5, 1999–2006. [Google Scholar] [CrossRef] [PubMed]
  30. Lin, F.; Wani, S.H.; Collins, P.J.; Wen, Z.; Gu, C.; Chilvers, M.I.; Wang, D. Mapping quantitative trait loci for tolerance to Pythium irregulare in soybean (Glycine max L.). G3 Genes Genomes Genet 2018, 8, 3155–3161. [Google Scholar] [CrossRef]
  31. Ellis, M.L.; McHale, L.K.; Paul, P.A.; St. Martin, S.K.; Dorrance, A.E. Soybean germplasm resistant to Pythium irregulare and molecular mapping of resistance quantitative trait loci derived from the soybean accession PI 424354. Crop Sci. 2013, 53, 1008–1021. [Google Scholar] [CrossRef]
  32. Paul, C.; Walker, D.R. Aggressiveness of isolates of five Pythium species on seeds and seedlings of six North American soybean cultivars. Can. J. Plant Pathol. 2022, 44, 596–614. [Google Scholar] [CrossRef]
  33. R Core Team. R: A Language and Environment for Statistical Computing; Version 4.2.1; R Foundation for Statistical Computing: Vienna, Austria, 2022. [Google Scholar]
  34. Huang, M.; Liu, X.; Zhou, Y.; Summers, R.M.; Zhang, Z. BLINK: A package for the next level of genome-wide association studies with both individuals and markers in the millions. Gigascience 2019, 8, giy154. [Google Scholar] [CrossRef] [PubMed]
  35. Wang, J.; Zhang, Z. GAPIT version 3: Boosting power and accuracy for genomic association and prediction. Genom. Proteom. Bioinform. 2021, 19, 629–640. [Google Scholar] [CrossRef] [PubMed]
  36. Bates, D.; Mächler, M.; Bolker, B.; Walker, S. Fitting linear mixed-effects models using lme4. J. Stat. Softw. 2015, 67, 48. [Google Scholar] [CrossRef]
  37. Kuznetsova, A.; Brockhoff, P.B.; Christensen, R.H.B. lmerTest package: Tests in linear mixed effects models. J. Stat. Softw. 2017, 82, 1–26. [Google Scholar] [CrossRef]
  38. Okello, P.N.; Solanki, S.; Rafi, N.; Mathew, F. Sources of resistance, effect of maturity groups and marker-trait associations associated with Fusarium graminearum causing root rot of soybean (Glycine max). Plant Health Prog. 2023. [Google Scholar] [CrossRef]
  39. Bolanos-Carriel, C.; Balk, C.; Wickramasinghe, D.; Acharya, B.; Dorrance, A.E. Screening the soybean nested association mapping (SoyNAM) parents for resistance towards isolates of Phytophthora sojae, Fusarium graminearum, and species of Globisporangium. Plant Health Prog. 2023, in press. [CrossRef]
  40. McConaughy, S.; Amundsen, K.; Song, Q.; Pantalone, V.; Hyten, D. Recombination hotspots in soybean [Glycine max (L.) Merr.]. G3 Genes Genomes Genet. 2023, 13, jkad075. [Google Scholar] [CrossRef]
  41. Lin, F.; Chhapekar, S.S.; Vieira, C.C.; Da Silva, M.P.; Rojas, A.; Lee, D.; Liu, N.; Pardo, E.M.; Lee, Y.-C.; Dong, Z.; et al. Breeding for disease resistance in soybean: A global perspective. Theor. Appl. Genet. 2022, 135, 3773–3872. [Google Scholar] [CrossRef]
  42. Scott, K.; Balk, C.; Veney, D.; McHale, L.K.; Dorrance, A.E. Quantitative Disease Resistance Loci towards Phytophthora sojae and Three Species of Pythium in Six Soybean Nested Association Mapping Populations. Crop Sci. 2019, 59, 605–623. [Google Scholar] [CrossRef]
  43. Almeida-Silva, F.; Venancio, T.M. Integration of genome-wide association studies and gene coexpression networks unveils promising soybean resistance genes against five common fungal pathogens. Sci. Rep. 2021, 11, 24453. [Google Scholar] [CrossRef] [PubMed]
Figure 1. Correlation plots of phenotypic measures for a fitted linear regression model and 95% confidence intervals in gray for (a) mean standardized root weight versus mean adjusted stand count; (b) mean RRW versus mean adjusted stand count; (c) mean RRW versus mean standardized root weight.
Agronomy 13 02376 g001
Figure 2. Frequency histograms of the mean phenotypic responses: (a) mean RRW score; (b) mean-adjusted stand count; (c) mean standardized root weight.
Agronomy 13 02376 g002
Figure 3. Principal component analysis plot showing all 208 accessions across two dimensions of the SNP-based relatedness.
Agronomy 13 02376 g003
Figure 4. (a) Genome-wide Manhattan plot of the SNP marker associations with Fusarium graminearum resistance with five significant marker names annotated with a dashed line representing the significance threshold for SNP-trait associations, and a(b) Q–Q plot of the p-values from the association tests of each SNP marker with 95% confidence intervals of the relationship between expected and observed p-values in gray.
Agronomy 13 02376 g004
Table 1. Mean RRW and stand counts of the soybean accessions after inoculation with Fusarium graminearum isolate AC7T1-1.
Variety aRRW bStand Count cSeed Coat Color dOrigin d
PI 548311 0.823 ± 0.461 ± 0.16YellowOntario, Canada
PI 438500 0.7 ± 0.130.833 ± 0.08Greenish brownUnited States
PI 561318 A0.631 ± 0.270.857 ± 0.06BlackBeijing city, China
PI 547690 0.587 ± 0.051.222 ± 0.14YellowIllinois, United States
PI 391577 0.586 ± 0.111 ± 0.13BrownJilin Province, China
PI 157484 0.568 ± 0.170.833 ± 0.08Light greenSouth Korea
PI 632418 0.564 ± 00.722 ± 0.12YellowMaryland, United States
PI 70466 -30.515 ± 0.10.611 ± 0.12YellowJilin Province, China
PI 54615 -10.495 ± 0.220.545 ± 0.31YellowHeilongjiang Province, China
PI 549040 0.494 ± 0.190.846 ± 0.11GreenLiaoning Province, China
PI 81785 0.492 ± 0.131 ± 0BrownHokkaidô, Japan
PI 603420 0.476 ± 0.010.867 ± 0.27BlackChina
PI 578375 B0.465 ± 0.080.833 ± 0BlackChina
PI 378680 E0.46 ± 0.190.667 ± 0.27YellowRussian Federation
PI 594451 0.46 ± 0.120.667 ± 0.14YellowSichuan Province, China
PI 639528 B0.444 ± 0.110.765 ± 0.04BrownPrimorsky krai, Russian Federation
PI 89005 -50.437 ± 0.120.688 ± 0.12YellowChina
PI 547779 0.429 ± 0.140.75 ± 0.15YellowIllinois, United States
PI 548540 0.422 ± 0.130.778 ± 0.12YellowIowa, United States
PI 592937 0.422 ± 0.190.563 ± 0.21YellowChina
PI 567262 A0.419 ± 0.170.611 ± 0.18YellowFujian Province, China
PI 458505 0.419 ± 0.020.75 ± 0.19YellowLiaoning Province, China
PI 507088 0.418 ± 0.150.688 ± 0.23YellowJapan
PI 567,685 0.412 ± 0.080.786 ± 0.08YellowHenan Province, China
PI 518750 0.41 ± 0.150.722 ± 0.05YellowFormer Serbia and Montenegro
PI 68604 -10.405 ± 0.10.727 ± 0.24YellowChina
PI 567361 0.395 ± 0.110.813 ± 0.01YellowNingxia Hui Autonomous Region, China
PI 548634 0.391 ± 0.110.765 ± 0.12YellowOhio, United States
PI 518751 0.391 ± 0.250.556 ± 0.09YellowFormer Serbia and Montenegro
PI 84987 A0.385 ± 0.10.647 ± 0.17YellowSaitama, Japan
PI 594301 0.385 ± 0.120.667 ± 0.14YellowJapan
PI 594777 0.384 ± 0.070.706 ± 0.14YellowYunnan Province, China
PI 84987 0.376 ± 0.130.667 ± 0.21YellowSaitama, Japan
PI 154189 0.373 ± 0.050.643 ± 0.07YellowNetherlands
PI 603424 A0.367 ± 0.10.8 ± 0YellowChina
PI 567353 0.362 ± 0.040.667 ± 0.12BrownGansu Province, China
PI 514671 0.362 ± 0.190.556 ± 0.12YellowHeilongjiang Province, China
PI 567346 0.361 ± 0.140.75 ± 0.12YellowGansu Province, China
PI 567558 0.357 ± 0.150.688 ± 0.3YellowShandong Province, China
PI 639543 0.356 ± 0.040.929 ± 0.05Greenish brownPrimorsky krai, Russian Federation
PI 603399 0.353 ± 0.160.611 ± 0.25YellowChina
PI 437991 B0.347 ± 0.140.625 ± 0.21YellowChina
PI 475820 0.346 ± 0.120.722 ± 0.16YellowXinjiang Uygur Autonomous Region, China
PI 567604 A0.339 ± 0.160.529 ± 0.13YellowShandong Province, China
PI 437110 A0.336 ± 0.130.667 ± 0.21BrownRussian Federation
PI 479735 0.333 ± 0.160.556 ± 0.24YellowJilin Province, China
PI 437505 0.33 ± 0.130.765 ± 0.22BlackPrimorsky krai, Russian Federation
PI 603494 0.33 ± 0.150.471 ± 0.13Greenish brownChina
PI 605765 B0.326 ± 0.040.889 ± 0.05Greenish brownTuyên Quang, Vietnam
PI 437169 B0.325 ± 0.10.778 ± 0.12YellowKrasnodar, Russian Federation
PI 603426 G0.323 ± 0.060.8 ± 0.17YellowChina
PI 567418 A0.304 ± 0.020.625 ± 0.02YellowShanxi Province, China
PI 171451 0.303 ± 0.020.8 ± 0.28YellowKanagawa, Japan
PI 603442 0.303 ± 0.10.75 ± 0.1BlackChina
PI 567416 0.302 ± 0.20.5 ± 0.21YellowShanxi Province, China
PI 591431 0.301 ± 0.120.625 ± 0.15YellowOntario, Canada
PI 157421 0.291 ± 0.170.412 ± 0.2BlackSouth Korea
PI 547460 0.285 ± 0.110.5 ± 0.14YellowIllinois, United States
PI 438239 B0.283 ± 0.060.765 ± 0.09BrownChina
PI 437776 0.281 ± 0.120.588 ± 0.24YellowChina
PI 548512 0.28 ± 0.090.444 ± 0.12YellowIndiana, United States
PI 424391 0.28 ± 0.120.688 ± 0.16Light greenJeollabuk-do, South Korea
PI 437788 A0.279 ± 0.030.778 ± 0.05BlackChina
PI 209334 0.277 ± 0.120.5 ± 0.21BrownHokkaidô, Japan
PI 507681 B0.275 ± 0.120.389 ± 0.16YellowUzbekistan
PI 548561 0.273 ± 0.090.444 ± 0.12YellowMinnesota, United States
PI 437160 0.268 ± 0.110.556 ± 0.2YellowKrasnodar, Russian Federation
PI 483464 A0.265 ± 0.010.722 ± 0.05BlackNingxia Hui Autonomous Region, China
PI 437485 0.262 ± 0.060.647 ± 0.1GreenPrimorsky krai, Russian Federation
PI 398296 0.26 ± 0.070.529 ± 0.06YellowKyonggi, South Korea
PI 603345 0.258 ± 0.030.667 ± 0.08YellowChina
PI 378663 0.256 ± 0.170.625 ± 0.32Greenish brownRussian Federation
PI 438323 0.249 ± 0.140.375 ± 0.16YellowFrance
PI 87620 0.248 ± 0.080.5 ± 0.14YellowHamkyeongpukto, North Korea
PI 438112 B0.247 ± 0.080.6 ± 0.16YellowChina
PI 91160 0.246 ± 0.110.444 ± 0.2YellowLiaoning Province, China
PI 603290 0.238 ± 0.090.444 ± 0.12YellowChina
PI 591432 0.236 ± 0.090.5 ± 0.12YellowOntario, Canada
PI 437653 0.236 ± 0.080.529 ± 0.16YellowChina
PI 561701 0.235 ± 0.120.357 ± 0.12YellowGeorgia, United States
PI 468408 B0.235 ± 0.10.588 ± 0.25YellowChina
PI 561389 B0.234 ± 0.040.429 ± 0.08YellowJapan
PI 437695 A0.233 ± 0.10.529 ± 0.21YellowChina
PI 567525 0.231 ± 0.080.5 ± 0.08YellowShandong Province, China
PI 548182 0.228 ± 0.090.588 ± 0.23Imperfect blackIllinois, United States
PI 548198 0.225 ± 0.090.556 ± 0.16GrayIllinois, United States
PI 548427 0.225 ± 0.060.733 ± 0.27BlackLiaoning Province, China
PI 578493 0.22 ± 0.080.5 ± 0.16YellowChina
PI 88479 0.217 ± 0.110.444 ± 0.18YellowJilin Province, China
PI 548356 0.217 ± 0.060.625 ± 0.21YellowPyongyang, North Korea
PI 490766 0.216 ± 0.120.444 ± 0.2BlackHebei Province, China
PI 591541 0.215 ± 0.030.556 ± 0.16YellowIllinois, United States
PI 639559 B0.206 ± 0.040.389 ± 0.05BlackUkraine
PI 567298 0.206 ± 0.090.471 ± 0.24YellowGansu Province, China
PI 416751 0.204 ± 0.080.5 ± 0.21YellowJapan
PI 567293 0.202 ± 0.040.438 ± 0.03YellowGansu Province, China
PI 89138 0.201 ± 0.080.5 ± 0.21YellowHamkyeongpukto, North Korea
PI 567780 B0.201 ± 0.080.529 ± 0.13YellowJiangsu Province, China
PI 467343 0.2 ± 0.10.556 ± 0.23YellowJilin Province, China
PI 88468 0.199 ± 0.040.563 ± 0.11BlackLiaoning Province, China
PI 508083 0.199 ± 0.030.588 ± 0.04YellowMinnesota, United States
PI 567258 0.198 ± 0.070.5 ± 0.16BrownJiangxi Province, China
PI 597464 0.198 ± 0.070.611 ± 0.18YellowZhejiang Province, China
PI 542403 0.196 ± 0.080.556 ± 0.12YellowMinnesota, United States
PI 548402 S0.194 ± 0.080.294 ± 0.09BlackBeijing city, China
PI 54614 0.193 ± 0.080.444 ± 0.2YellowJilin Province, China
PI 567439 0.193 ± 0.070.529 ± 0.06YellowShanxi Province, China
PI 603549 0.191 ± 0.050.444 ± 0.16BlackChina
PI 81041 -10.187 ± 0.110.471 ± 0.06Reddish brownHokkaidô, Japan
PI 603389 0.187 ± 0.080.5 ± 0.21YellowChina
PI 548402 0.187 ± 0.050.4 ± 0.14BlackBeijing city, China
PI 291310 C0.185 ± 0.030.5 ± 0.06YellowHeilongjiang Province, China
PI 506933 0.181 ± 0.070.471 ± 0.13YellowJapan
PI 507467 0.18 ± 0.10.375 ± 0.15YellowJapan
PI 438309 0.18 ± 0.050.625 ± 0.14YellowChina
PI 548298 0.179 ± 0.090.389 ± 0.2YellowChina
PI 103088 0.177 ± 0.080.444 ± 0.18YellowHenan Province, China
PI 476352 B0.176 ± 0.120.444 ± 0.24YellowKyrgyzstan
PI 438230 A0.175 ± 0.070.556 ± 0.24YellowChina
PI 438019 B0.173 ± 0.070.333 ± 0.16YellowChina
PI 404188 A0.17 ± 0.070.222 ± 0.09YellowChina
PI 84631 0.17 ± 0.080.375 ± 0.15GreenKyonggi, South Korea
PI 548521 0.17 ± 0.080.412 ± 0.11YellowIowa, United States
PI 612730 0.169 ± 0.060.333 ± 0.08YellowChina
PI 603675 0.167 ± 0.090.529 ± 0.24YellowChina
PI 81041 0.167 ± 0.120.357 ± 0.17YellowHokkaidô, Japan
PI 549021 A0.162 ± 0.050.333 ± 0.04BlackLiaoning Province, China
PI 86904 -10.161 ± 0.070.5 ± 0.21YellowChungcheongbuk-do, South Korea
PI 417398 0.16 ± 0.120.333 ± 0.21YellowChina
PI 68521 -10.157 ± 0.110.412 ± 0.2YellowChina
PI 547686 0.157 ± 0.070.353 ± 0.15YellowIllinois, United States
PI 84946 -20.157 ± 0.090.471 ± 0.2YellowBusan-gwangyeoksi, South Korea
PI 437793 0.155 ± 0.060.563 ± 0.15YellowChina
PI 88313 0.155 ± 0.090.235 ± 0.15YellowChina
PI 567395 0.155 ± 0.080.4 ± 0.2Grayish greenShaanxi Province, China
PI 497953 0.155 ± 0.030.333 ± 0.08YellowBihar, India
PI 548391 0.154 ± 0.070.471 ± 0.2YellowLiaoning Province, China
PI 404182 0.153 ± 0.070.333 ± 0.16YellowChina
PI 592960 0.151 ± 0.020.235 ± 0.06YellowHeilongjiang Province, China
PI 62203 0.148 ± 0.060.444 ± 0.12YellowHebei Province, China
PI 567782 0.146 ± 0.040.471 ± 0.11YellowOntario, Canada
PI 548411 0.146 ± 0.070.389 ± 0.16YellowChina
PI 438496 C0.139 ± 0.050.389 ± 0.12BlackUnited States
PI 567225 0.138 ± 0.060.563 ± 0.24YellowMoldova
FC 33243 -10.132 ± 0.050.5 ± 0.21YellowUnknown
PI 547716 0.13 ± 0.050.444 ± 0.2YellowIllinois, United States
PI 54591 0.13 ± 0.070.429 ± 0.2YellowLiaoning Province, China
PI 548360 0.129 ± 0.050.333 ± 0.08YellowNorth Korea
PI 547459 0.129 ± 0.050.333 ± 0.08YellowIllinois, United States
PI 548571 0.128 ± 0.050.353 ± 0.15YellowOntario, Canada
PI 592940 0.127 ± 0.060.222 ± 0.12YellowChina
PI 548193 0.127 ± 0.020.5 ± 0.14YellowIowa, United States
PI 437685 D0.126 ± 0.060.278 ± 0.12YellowChina
PI 437814 A0.123 ± 0.060.267 ± 0.11YellowChina
PI 253661 B0.12 ± 0.040.5 ± 0.16YellowChina
PI 417381 0.119 ± 0.080.286 ± 0.14YellowHokkaidô, Japan
PI 58955 0.118 ± 0.050.444 ± 0.18YellowShandong Province, China
PI 525453 0.118 ± 0.010.471 ± 0.15YellowIowa, United States
PI 86024 0.116 ± 0.050.471 ± 0.2Grayish greenHokkaidô, Japan
PI 464896 0.109 ± 0.050.412 ± 0.17YellowJilin Province, China
PI 567698 A0.108 ± 0.020.5 ± 0.16YellowAnhui Province, China
PI 438498 0.105 ± 0.030.462 ± 0.2BlackUnited States
PI 533655 0.103 ± 0.070.235 ± 0.1YellowIllinois, United States
PI 291294 0.102 ± 0.020.375 ± 0.1YellowHeilongjiang Province, China
PI 424354 0.102 ± 0.040.182 ± 0.06BlackChungcheongnam-do, South Korea
PI 603463 0.101 ± 0.030.529 ± 0.06YellowChina
PI 464912 0.101 ± 0.040.294 ± 0.16GreenLiaoning Province, China
PI 507293 B0.099 ± 0.040.278 ± 0.09YellowJapan
PI 68732 -10.098 ± 0.040.353 ± 0.15YellowHeilongjiang Province, China
PI 587588 A0.095 ± 0.060.294 ± 0.12YellowJiangsu Province, China
PI 437127 A0.091 ± 0.050.222 ± 0.12YellowGeorgia
PI 407701 0.09 ± 0.050.25 ± 0.12YellowChina
PI 361066 B0.089 ± 0.030.333 ± 0.14YellowRomania
PI 83881 A0.088 ± 0.030.235 ± 0.04YellowKangweonto, North Korea
PI 54608 -10.082 ± 0.060.294 ± 0.16YellowLiaoning Province, China
PI 90479 P0.082 ± 0.060.167 ± 0.08YellowChina
PI 548362 0.081 ± 0.060.222 ± 0.12YellowIllinois, United States
PI 594456 A0.078 ± 0.020.412 ± 0.18YellowSichuan Province, China
PI 437265 D0.074 ± 0.050.294 ± 0.16YellowMoldova
PI 417242 0.074 ± 0.040.353 ± 0.16GreenChina
PI 578503 0.074 ± 0.030.235 ± 0.12YellowChina
PI 417479 0.073 ± 0.060.222 ± 0.18YellowJapan
PI 437838 0.071 ± 0.050.313 ± 0.16YellowRussian Federation
PI 587804 0.07 ± 0.040.5 ± 0.18YellowHubei Province, China
PI 407716 0.067 ± 0.010.222 ± 0.05YellowJilin Province, China
PI 232992 0.067 ± 0.050.188 ± 0.12BlackSaga, Japan
PI 548631 0.066 ± 0.040.294 ± 0.12YellowIllinois, United States
PI 391583 0.064 ± 0.050.063 ± 0.05YellowJilin Province, China
FC 29333 0.064 ± 0.030.222 ± 0.09YellowUnknown
PI 438083 0.061 ± 0.030.333 ± 0.16YellowChina
PI 464923 0.061 ± 0.030.176 ± 0.09YellowLiaoning Province, China
PI 79862 -10.058 ± 0.030.118 ± 0.05YellowChina
PI 548190 0.056 ± 0.010.313 ± 0.08YellowIllinois, United States
PI 592954 0.051 ± 0.020.294 ± 0.12YellowChina
PI 578412 0.049 ± 0.030.222 ± 0.12YellowChina
PI 548520 0.048 ± 0.030.235 ± 0.12YellowIowa, United States
PI 398881 0.039 ± 0.030.176 ± 0.14YellowKyonggi, South Korea
PI 548565 0.037 ± 0.010.222 ± 0.05YellowOhio, United States
PI 567532 0.036 ± 0.020.333 ± 0.16YellowShandong Province, China
PI 594880 0.035 ± 0.020.188 ± 0.09Reddish brownYunnan Province, China
PI 506942 0.032 ± 0.030.111 ± 0.09YellowJapan
PI 458510 0.025 ± 0.010.222 ± 0.09YellowLiaoning Province, China
PI 567307 0.024 ± 0.020.143 ± 0.27BlackGansu Province, China
PI 83881 0.02 ± 0.010.188 ± 0.08BlackKangweonto, North Korea
PI 591511 0.019 ± 0.010.111 ± 0.05YellowIllinois, United States
PI 567722 0.01 ± 0.010.056 ± 0.05YellowAnhui Province, China
PI 548348 0.01 ± 0.010.056 ± 0.05YellowChina
PI 548162 0 ± 00 ± 0YellowIllinois, United States
a Accession identifier in the USDA-ARS-GRIN database. b Mean RRW score of the accession across three replicates ± standard error. c Mean adjusted stand count of the accession across three replicates ± standard error. d Accession data retrieved from the USDA-ARS-GRIN database (www.ars-grin.gov accessed on 8 February 2023).
Table 2. One-way analysis of variance (ANOVA) table for the RRW score by accession.
PredictorSSMSNumerator DFDenominator DFF-Valuep-Value a
Accession12.890.0622712074142.18749.06 × 10−12 *
a p-Values calculated using Satterthwaite’s approximation of the denominator degrees of freedom. Estimated effects significantly (p < 0.05) greater than zero are marked with an asterisk.
Table 3. Summary table for the linear mixed model regression of the RRW scores by accession for the accessions with statistically significant (p < 0.05) estimated effects.
EstimatorEstimated EffectT-Valuep-Value a
Intercept0.2251.91157.07 × 10−2
PI 5483110.5984.33951.80 × 10−5 *
PI 4385000.4693.40587.24 × 10−4 *
PI 561318 A0.4062.94923.37 × 10−3 *
PI 547690 0.3622.62728.93 × 10−3 *
PI 391577 0.3622.62478.99 × 10−3 *
PI 157484 0.3432.48981.32 × 10−2 *
PI 632418 0.3392.46331.42 × 10−2 *
PI 70466 -30.2912.10963.55 × 10−2 *
a p-Values calculated using Satterthwaite’s approximation of the denominator degrees of freedom. Estimated effects significantly (p < 0.05) greater than zero are marked with an asterisk.
Table 4. SNP markers associated with the RRW score to Fusarium graminearum, genome position, and their estimated effects.
SNP MarkerChromosomePosition (bp) aVariantsMinor AlleleMAF bB&H p-Value cEffect d
ss715583130246,379,738A/G G0.481.41 × 10−2 0.0301
ss71558482732,309,023A/G G0.391.05 × 10−4 −0.0484
ss715594767647,356,804C/A A0.241.18 × 10−2 0.0418
ss715597247734,593,871C/T T0.376.15 × 10−4 −0.0431
ss7156172471312,663,715C/A A0.346.60 × 10−3 0.0381
a Williams 82 version 4 reference genome. b MAF, minor allele frequency. c B&H p-value, FDR-adjusted p-value using the Benjamini and Hochberg method. d Estimated effect size of the minor allele variant.
Table 5. Summary of the favorable SNP marker alleles for each of the five significant markers and alleles present in each of the eight significantly resistant accessions. Favorable alleles present in each accession are in bold and underlined.
SNP MarkerFavorable AlleleEffectPI 548311PI 438500PI 561318API 547690PI 391577PI 157484PI 632418PI 70466-3
ss715583130G3.00%GGGAGAAG
ss715584827A4.80%AAAAAAAA
ss715594767A4.20%ACAACCAA
ss715597247C4.30%CTCCCCCC
ss715617247A3.80%AAAAAACC
Sum of allelic effects: 20.20%20.2%11.7%20.2%17.1%16.0%13.0%13.3%16.3%
Mean RRW score: -0.8230.70.6310.5870.5860.5680.5640.515
Disclaimer/Publisher’s Note: The statements, opinions and data contained in all publications are solely those of the individual author(s) and contributor(s) and not of MDPI and/or the editor(s). MDPI and/or the editor(s) disclaim responsibility for any injury to people or property resulting from any ideas, methods, instructions or products referred to in the content.

