Article

Soil Organic Carbon Sequestration after 20-Year Afforestation of Mangrove Plantations on Qi’ao Island, Southern China

1
Key Laboratory of Vegetation Restoration and Management of Degraded Ecosystems, South China Botanical Garden, Chinese Academy of Sciences, Guangzhou 510650, China
2
Guangdong Provincial Key Laboratory of Applied Botany, South China Botanical Garden, Chinese Academy of Sciences, Guangzhou 510650, China
3
University of Chinese Academy of Sciences, Beijing 100039, China
4
Department of Biological Sciences, Tennessee State University, Nashville, TN 37209, USA
*
Author to whom correspondence should be addressed.
Agronomy 2023, 13(9), 2389; https://doi.org/10.3390/agronomy13092389
Submission received: 18 August 2023 / Revised: 8 September 2023 / Accepted: 13 September 2023 / Published: 15 September 2023
(This article belongs to the Section Soil and Plant Nutrition)

Abstract

:
Mangrove afforestation is considered an important measure in the “natural-based solution” for mitigating climate warming through sequestering massive carbon (C) into vegetation biomass, yet how the planted mangrove species facilitate soil C sequestration remains unclear. Here, we investigated the stock, source, and fraction of soil organic carbon (SOC) over 1 m depth after 20-year afforestation of five mangrove pure plantations (Acrostichum aureum, Acanthus ilicifolius, Aegiceras corniculatum, Kandelia obovate, and Excoecaria agallocha) on Qi’ao Island, South China. The results showed that SOC stocks did not significantly differ among the five plantations, with an average value of 16.7 kg C m−2. Based on the two-end-member mixing model with plant–soil C stable isotope signatures, the autochthonous (mangrove-derived) C source accounted for 20.2–34.1% of SOC but varied significantly among the plantations. The SOC stock in particulate fraction (1.2–2.0 g C kg−1) and mineral-associated fraction (14.3–16.0 g C kg−1) also significantly differed among the plantations. The similar SOC stock but different source contributions and C fractions among the plantations observed here may have important implications for mangrove afforestation to optimize stand structure and maximize C sequestration.

1. Introduction

Mangroves are highly biodiverse and productive, regarded as one of the most carbon (C)-dense ecosystems in terrestrial and coastal lands. However, because of deforestation, more than one-third of the world’s mangrove ecosystems disappeared in the past few decades, with continued loss at a rate of about 0.2% per year [1]. To relieve this trend, many countries have implemented mangrove afforestation programs with the aim of enhancing ecosystem C storage [2,3]. For example, the area of mangroves in China increased from 22,024.9 ha in 2000 to 34,472.1 ha in 2013 [4]. With the establishment and growth of mangroves, vegetation biomass increases rapidly owing to the high rate of photosynthesis [5,6]. In mangrove ecosystems, soil organic carbon (SOC) represents ~75% of the total C stored in the ecosystems [7]. However, the effects of mangrove afforestation on belowground C processes have received less attention, and little is known about how the planted mangrove species facilitate SOC sequestration.
Compared to other terrestrial ecosystems, SOC accumulation in mangrove ecosystems may be more complicated [8]. In general, plant residual inputs constitute the principal pathway of SOC formation in terrestrial ecosystems, but in mangrove soils, the C inputs consist of autochthonous inputs by mangrove residuals and allochthonous inputs by tidal and/or fluvial sediment [9,10]. The presence of mangrove plants facilitates suspended matter deposition by retarding tidal energy with stems [11] and numerous aerial roots and capturing suspended particles, which adhere to the plant surface [12]. Despite this recognition, previous studies revealed that the majority of SOC in mangroves comes primarily from autochthonous sources, as determined by stable carbon (δ13C) isotope signatures [13,14,15]. Differences in the naturally stable C isotope signatures between mangrove species (δ13C signature ranging from −32‰ to −21‰) and tidal sediment such as seagrass and algae (δ13C signature ranging from −25‰ to −8‰) allow for quantifying the relative contributions of autochthonous vs. allochthonous sources to the SOC pool via mass balance. However, most of these studies have been performed in natural and mature mangrove ecosystems [16,17,18]. Forest SOC formation could be influenced by climatic and soil conditions and also tree species [19]. For example, shifting cultivation in the forestland has been reported to significantly alter the dynamics of SOC [20]. So far, there have been very few studies partitioning the contributions of autochthonous vs. allochthonous sources to SOC accumulation in mangrove plantations.
In addition to C inputs, SOC accumulation also depends on its turnover rate, which represents how long the stored SOC can be sequestered. Not all SOC has the same long-term sequestration potential. In a broad sense, SOC is often split into particulate organic carbon (POC) that can be unprotected or occluded within aggregates [21,22], and mineral-associated organic carbon (MAOC) in which organic matter is sorbed onto mineral surfaces or complexed with metals [23,24]. For example, SOC in mangroves favors bounding minerals, such as iron-bound OC, which is able to defend against microbial attack, and this is considered a reason why mangrove SOC could be stored for decades or hundreds of years [25,26,27]. The salinization and anaerobic environment during tidal inundation in mangrove soils could also inhibit microbial activity, slowing SOC decomposition [28,29,30]. Mangrove afforestation may alter the soil environment such as water, salinity, and mineral activation which controls MAOC formation and preservation [31], which in turn influences total SOC stock [32,33]. Therefore, investigating the MAOC dynamics as well as their relationships with soil properties may have important implications for long-term SOC sequestration in mangrove plantations.
Here, we conducted a field experiment in the Qi’ao Island Mangrove Wetland Nature Reserve, located in the northwest of Qi’ao Island, Zhuhai, Guangdong Province. Mangroves cover an area of 700 hectares in this reserve, which is the largest restored mangrove ecosystem in China, made by planting various mangrove species. In this study, we selected five pure mangrove plantations, and the species include Acrostichum aureum (AA), Acanthus ilicifolius (AI), Aegiceras corniculatum (AC), Kandelia obovate (KO), and Excoecaria agallocha (EA), which are widespread and commonly planted for mangrove rehabilitation in China. Because of the similar soil conditions and climate settings prior to planting, changes in soil C sequestration performance could be attributed to the plantations with different mangrove species. The aim of this study is to investigate the changes in SOC stocks, sources, and fractions, as well as soil properties among the five plantations. In order to quantify the relative contributions of autochthonous vs. allochthonous sources to the SOC pool in mangrove plantations, we also investigated the δ13C signature and fractions of SOC in mudflat (MF), where SOC formation has been generally considered a good proxy of non-mangrove sources (mostly seagrass and algae). We tried to answer the following questions: (1) Did SOC stock differ among the five plantations? (2) What were the differences between autochthonous and allochthonous sources contributing to the SOC pool? (3) How did the planted mangrove species affect SOC fractions (light and heavy)?

2. Materials and Methods

2.1. Site Description

This study was conducted at the Qi’ao mangrove natural reserve on Qi’ao Island, Zhuhai, China (22.39°~22.64° N, 113.61°~113.65° E). This area is characterized by a southern subtropical maritime monsoon climate, with a mean annual temperature of 22.4 °C (monthly range 2.5–18 °C) and mean annual precipitation of 1964.4 mm (1700–2200 mm). The mean seawater salinity is 18.2%, and the soil type is fine-grained clayey silt and silty clay [34]. Mangrove wetlands cover an area of more than 400 hectares on this island. Avicennia marina, Kandelia obovata, and Aegiceras corniculatum are dominant species in the history of this site [35]. However, natural mangroves on Qi’ao Island were severely destroyed, and large-scale plantations with various mangrove species have been established since 1999 [36].

2.2. Experimental Design and Sampling

In January 2020, five pure mangrove plantations of Acrostichum aureum (AA), Acanthus ilicifolius (AI), Aegiceras corniculatum (AC), Kandelia obovate (KO), and Excoecaria agallocha (EA) were selected, which are widespread and commonly planted in the rehabilitated mangroves on Qi’ao Island (Figure 1). The mangrove species were planted in 1999 without any fertilization at a similar tide level. Each mangrove plantation is about 1 ha, in which we randomly selected four plots (20 m × 20 m). Accordingly, four plots of mudflat (MF) without vegetation were selected in order to quantify the relative contributions of autochthonous vs. allochthonous sources to the SOC pool in mangrove plantations.
Sediment samples were collected by using a semi-open corer (5 cm diameter and 100 cm length), with four cores per plot during low tide. Sediment cores were divided into depth intervals of 0–20, 20–40, 40–60, and 60–100 cm. For each depth, one subsample was filled into a 100 cm3 round aluminum cutting ring to measure bulk density. All of the soil samples were transported to the laboratory. The soil was cleaned of any observably large particles (such as roots, stones, and shells), and it was then put through a 2 mm seive and split into two sections. One part was kept at 4 °C for measuring microbial biomass carbon. The other part was air-dried at room temperature to measure its physical and chemical properties. Microbial biomass carbon was assayed with fresh soil stored at 4 °C for <2 weeks.
The fresh leaves of AA, AI, AC, KO, and EA were taken directly from the trees and homogenized to measure the stable carbon isotope composition. Fine roots < 0.5 mm in diameter were collected with soil sampling at the same time and homogenized for the measurement of the stable carbon isotope composition. Plant tissue samples were transported to the laboratory and air-dried before analysis.

2.3. Soil Properties Measurements

Bulk density (BD, g cm−3) was determined using the cutting ring method (100 cm3).
Soil pH and the salinity of the fresh soil were measured using a multiple-parameter water analyzer after the samples were extracted by distilled water (water soil of 2.5:1 for pH and 5:1 for salinity). Soil water content (SWC, %) with fresh soil was measured by drying the soil samples at 105 °C for 24 h. Microbial biomass carbon (MBC, mg kg−1) [37] was determined by the fumigation–extraction method with a total TOC analyzer (TOC-VCSH, Shimadzu Co., Ltd., Hongkong, China).
Air-dried soil samples were passed through 0.15 mm mesh for the measurement of the concentration of C and iron (Fe) oxides and the stable carbon isotope signature. Plant tissue samples were passed through 0.15 mm mesh for the measurement of the stable carbon isotope signature. In order to remove washed-out carbonates, soil samples (about 0.50 g) were acidified by using 1.0 M HCl (20 mL) and then washed three to four times with distilled water until the pH increased to a neutral reaction. The organic carbon concentration was measured using a Vario ELIII Elemental Analyzer (Elementar Co., Ltd., Frankfurt, Germany) and connected to an isotope ratio mass spectrometer (IsoPrime 100, Elementar Co., Ltd., Frankfurt, Germany) to obtain the stable C isotope composition (δ13C ratio, ‰) of soil and plant tissue samples. The values of δ13C were expressed in parts per thousand (‰) relative to PDB (Pee Dee Belemnite), with the following equation:
δ ( ) = ( R s a m p l e R s t a n d a r d 1 ) × 1000
where Rsample and Rstandard are the ratios of 13C to 12C of the sample and standard, respectively.
Total Fe concentration (Fet) in soil was extracted with HNO3-HF-HClO4 and measured with ICP-OES (PerkinElmer Co., Ltd., Shanghai, China) [38]. The non-crystalline inorganic form of Fe (Feo) was measured by the acid NH4-oxalate method [39]. Organic complexed Fe (Fep) was measured by the acid sodium pyrophosphate method [39]. The reactive phase of Fe (FeR) was measured by dithionite–citrate–bicarbonate method [40]. Based on FeR and the SOC concentration in bulk soil, the molar ratios of metals to SOC (molar SOC/FeR, OCFeR) were calculated to represent the potential of SOC associated with solid reactive iron phases.

2.4. Density Fractionations

Using a density fractionation technique, each soil sample (20 g dried soil sample) was separated into operationally defined soil fractions: a light fraction (LF) and a heavy fraction (HF) that often represent POC and MOAC, respectively. Given that the soils used in this study were rich in clay, the LF was separated by flotation after immersing soils in NaI solution at a density of 1.85 g cm−3 [41]. The residual soil consisted of the remaining mineral-associated organic matter. The separated soil fractions were dried in an oven at 80 °C and then ground to a homogenized fine powder for organic C analysis. The concentrations of POC and MAOC were measured using a Vario ELIII Elemental Analyzer (Elementar Scientific Instruments).

2.5. Calculation of Autochthonous and Allochthonous Sources

On Qi’ao Island, the mangrove plantations are separated from land by the sea wall and receive no direct input of fluvial sediment. The present study thus defined autochthonous mangrove litter and allochthonous tidal sediment as the two sources of the SOC pool. In general, the tidal suspended matter has great spatiotemporal variability [42]. However, the accretion of mudflat soil results mainly from the sedimentation of suspended matter in tidal waters [43]. In this situation, mudflat sediment is a good proxy of allochthonous sources for complex organic matter sources. The present study assumed the mixture of leaves and roots as the autochthonous source [44] and mudflat sediment as the allochthonous source [45]. Thus, the relative contributions of autochthonous and allochthonous sources to mangrove SOC were calculated with the two-source mixing model [15]. The equations of the model are
δ13Cmangrove-soil = fautochthonous × δ13Cautochthonous + fallochthonous × δ13Callochthonous
1 = fautochthonous + fallochthonous
fautochthonous (%) = (1 − fallochthonous) × 100%
fautochthonous, fallochthonous, δ13Cmangrove-soil, δ13Cautochthonous, and δ13Callochthonous are the fraction contributions of autochthonous C and allochthonous C, and the stable C isotope compositions of mangrove soil, average mangrove plant tissues (including roots and leaves), and mudflat soil, respectively [45].

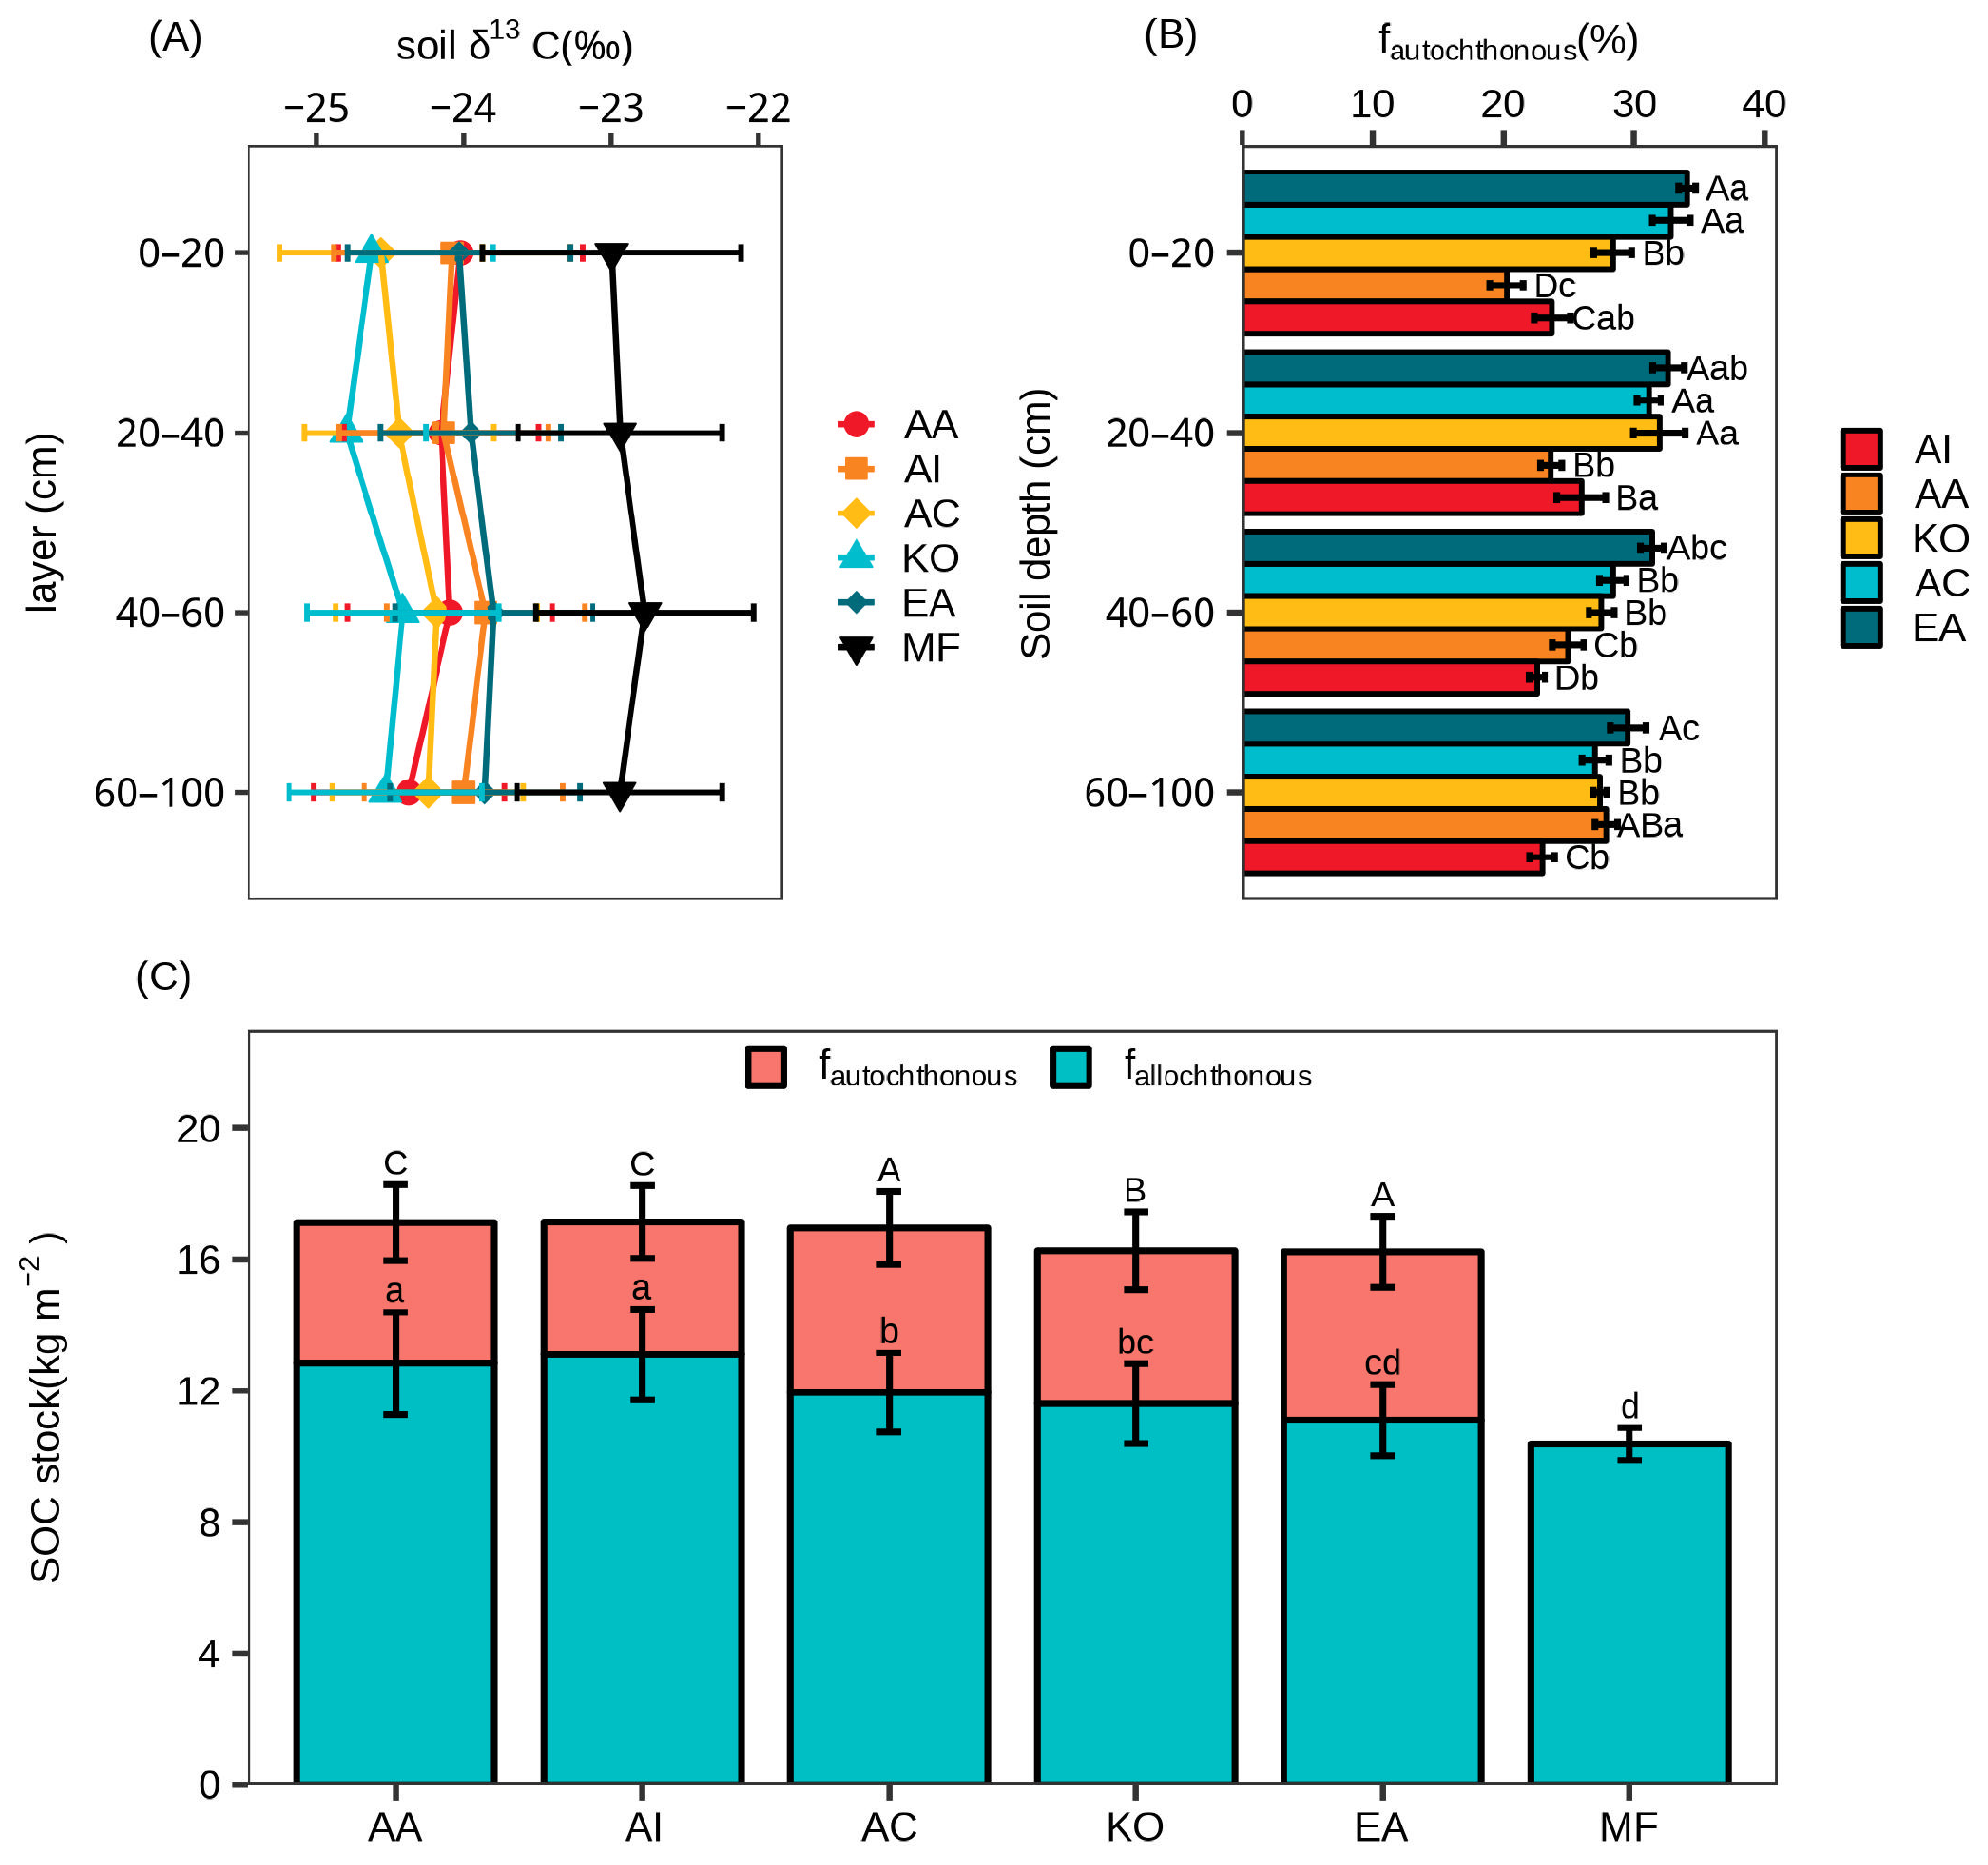
2.6. Calculations of Soil Organic Carbon Stock

Soil organic carbon stock was calculated as SOC concentration multiplied by soil bulk density. The equation of the model is
S C S = S O C c × B D × D 100
where D is the thickness of soil (cm), BD is the soil bulk density, SOCC is the concentration of SOC, and SCS is the stock of SOC (kg m−2).

2.7. Statistical Analyses

All statistical analyses were performed using R (version, 4.2.2, https://www.r-project.org, accessed on 1 October 2022). Analysis of variance (ANOVA) was used to determine the statistical significance (α = 0.05) of the mangrove species, soil layer, and their interactive effects on bulk SOC and its density fractions, sources, and Fe oxides. Tukey’s multiple comparison test was conducted to determine whether significant effects of different mangrove species or soil layers were found. Pearson correlations were used to reveal the relationships between sediment physicochemical properties and MAOC. To assess the relative significance of factors influencing the impact of afforestation on MAOC concentration, we used the random forest model. The explanatory factors in this study consist of indicators from 9 properties, while the response variable is the concentration of MAOC. A random forest model was constructed using ten influencing factors: MBC, OC:FeR, Fet, FeR, Fep, Feo, SWC, pH, salinity, and soil layer. The statistical analysis involved the estimation of the impact of each explanatory variable on MAOC using the “randomForest” and “rfPermute” packages in R. In the model calibration, the number of trees (ntree) was set to 1000. Additionally, the relative importance of the explanatory factors was determined by ranking them based on the percentage increase in mean squared error (%IncMSM). The performance of the model was measured with R-squared (R2).

3. Results

3.1. Soil Properties

In this study, soil bulk density (BD), SWC, and pH were generally higher (p < 0.01) in the MF than the plantations, whereas the salinity was significantly lower (p < 0.01) in the MF than the plantations (Table 1 and Table S2). The BD, SWC, and salinity significantly differed among the five plantations, ranging from 0.9 g cm−3 to 1.2 g cm−3, from 34.3% to 51.3%, and from 8.9‰ to 12.8‰, respectively (Table 1 and Table S2). The soil pH varied from 6.2 to 7.5 and increased with the depth of the soil layer (Table 1 and Table S2). Soil pH values also significantly differed among the plantations, except for the 0–20 cm soil layer (Table 1). The MBC varied from 667.8 mg kg−1 to 1706.2 mg kg−1 (Table 1). Except for AA, MBC in other sites decreased significantly (p < 0.001) with the depth of soil layers (Table S2).

3.2. Soil Organic Carbon Concentration and Stock

The SOC concentrations were significantly higher (p < 0.001) at the plantations compared to the MF (Figure 2A). The SOC concentrations at the plantations varied significantly (p < 0.01) with mangrove species and soil layers, ranging from 8.7 g kg−1 to 19.4 g kg−1 (Figure 2A). The SOC stocks at the plantations were also significantly higher (p < 0.001) than in the MF (Figure 2B). However, because of the contrasting pattern between BD and SOC concentration, the SOC stocks did not significantly differ among the plantations, with an average value of 16.7 kg C m−2 (Figure 2B).

3.3. Soil Organic Carbon Sources

Soil δ13C values were significantly lower (p < 0.001) at the plantations compared to the mudflat (Figure 3A). Soil δ13C values did not change with soil layers (Figure 3A and Table S2). In addition to the 0–20 cm soil layer, soil δ13C values varied significantly (p < 0.001) among plantations, ranging from −24.79‰ to −23.80‰ (Figure 3A). The average plant δ13C values varied from −28.7‰ to −26.0‰ in different mangrove tissues (Table S1). Based on the two-end-member mixing model, the proportion of autochthonous source (fautochthonous) of SOC ranged from 20.2% to 34.1% and varied significantly (p < 0.001) among the plantations (Figure 3B). Thus, the proportion of allochthonous source (fallochthonous) in SOC ranged from 65.9% to 79.8% and also varied significantly (p < 0.001) among the plantations (Figure 3B). Accordingly, the autochthonous C stocks ranged from 4.0 kg C m−2 to 5.1 kg C m−2, and the allochthonous C stocks ranged from 10.4 kg C m−2 to 13.1 kg C m−2, which both varied significantly (p < 0.001) among the plantations (Figure 4C).

3.4. Soil Organic Carbon Fractions

Soil MAOC and POC concentrations were significantly higher (p < 0.001) at the plantations than at the MF (Table S2). The concentrations of MAOC and POC at the plantations varied significantly (p < 0.001) with mangrove species and soil layers (Table S2), ranging from 11.9 g kg−1 to 16.5 g kg−1 and from 24.2 g kg−1 to 35.8 g kg−1, respectively (Figure 4A,B). The proportions of MAOC and POC varied significantly (p < 0.001) among the plantations (Table S2), ranging from 84.9% to 93.0% and from 7.0% to 15.1%, respectively (Figure 4C). The MAOC stocks ranged from 14.3 kg C m−2 to 16.0 kg C m−2 and varied significantly (p < 0.001) among the plantations (Figure 4D). The POC stocks ranged from 1.4 kg C m−2 to 2.0 kg C m−2, and also varied significantly (p < 0.001) among the plantations (Figure 4D).

3.5. Soil Iron Phases

The concentrations of Fet, FeR, and FeO differed significantly (p < 0.001) among the plantations, ranging from 54.1 g kg−1 to 64.0 g kg−1, from 30.5 g kg−1 to 34.8 g kg−1, and from 15.9 g kg−1 to 17.3 g kg−1, respectively (Table 2). The FeO concentrations were generally lower (p < 0.01) at the plantations than the MF, whereas the FeR concentrations were higher (p < 0.001) at the plantations than the MF (Table 2). There was no significant difference in the Fep concentration (0.7–1.3 g kg−1, Table 2) among plantations, except at the 60–100 cm soil depth. The ratio of OC:FeR (1.5 to 2.6, Table 2) also significantly differed among plantations and decreased with the depth of the soil layer (Table 2 and Table S2).

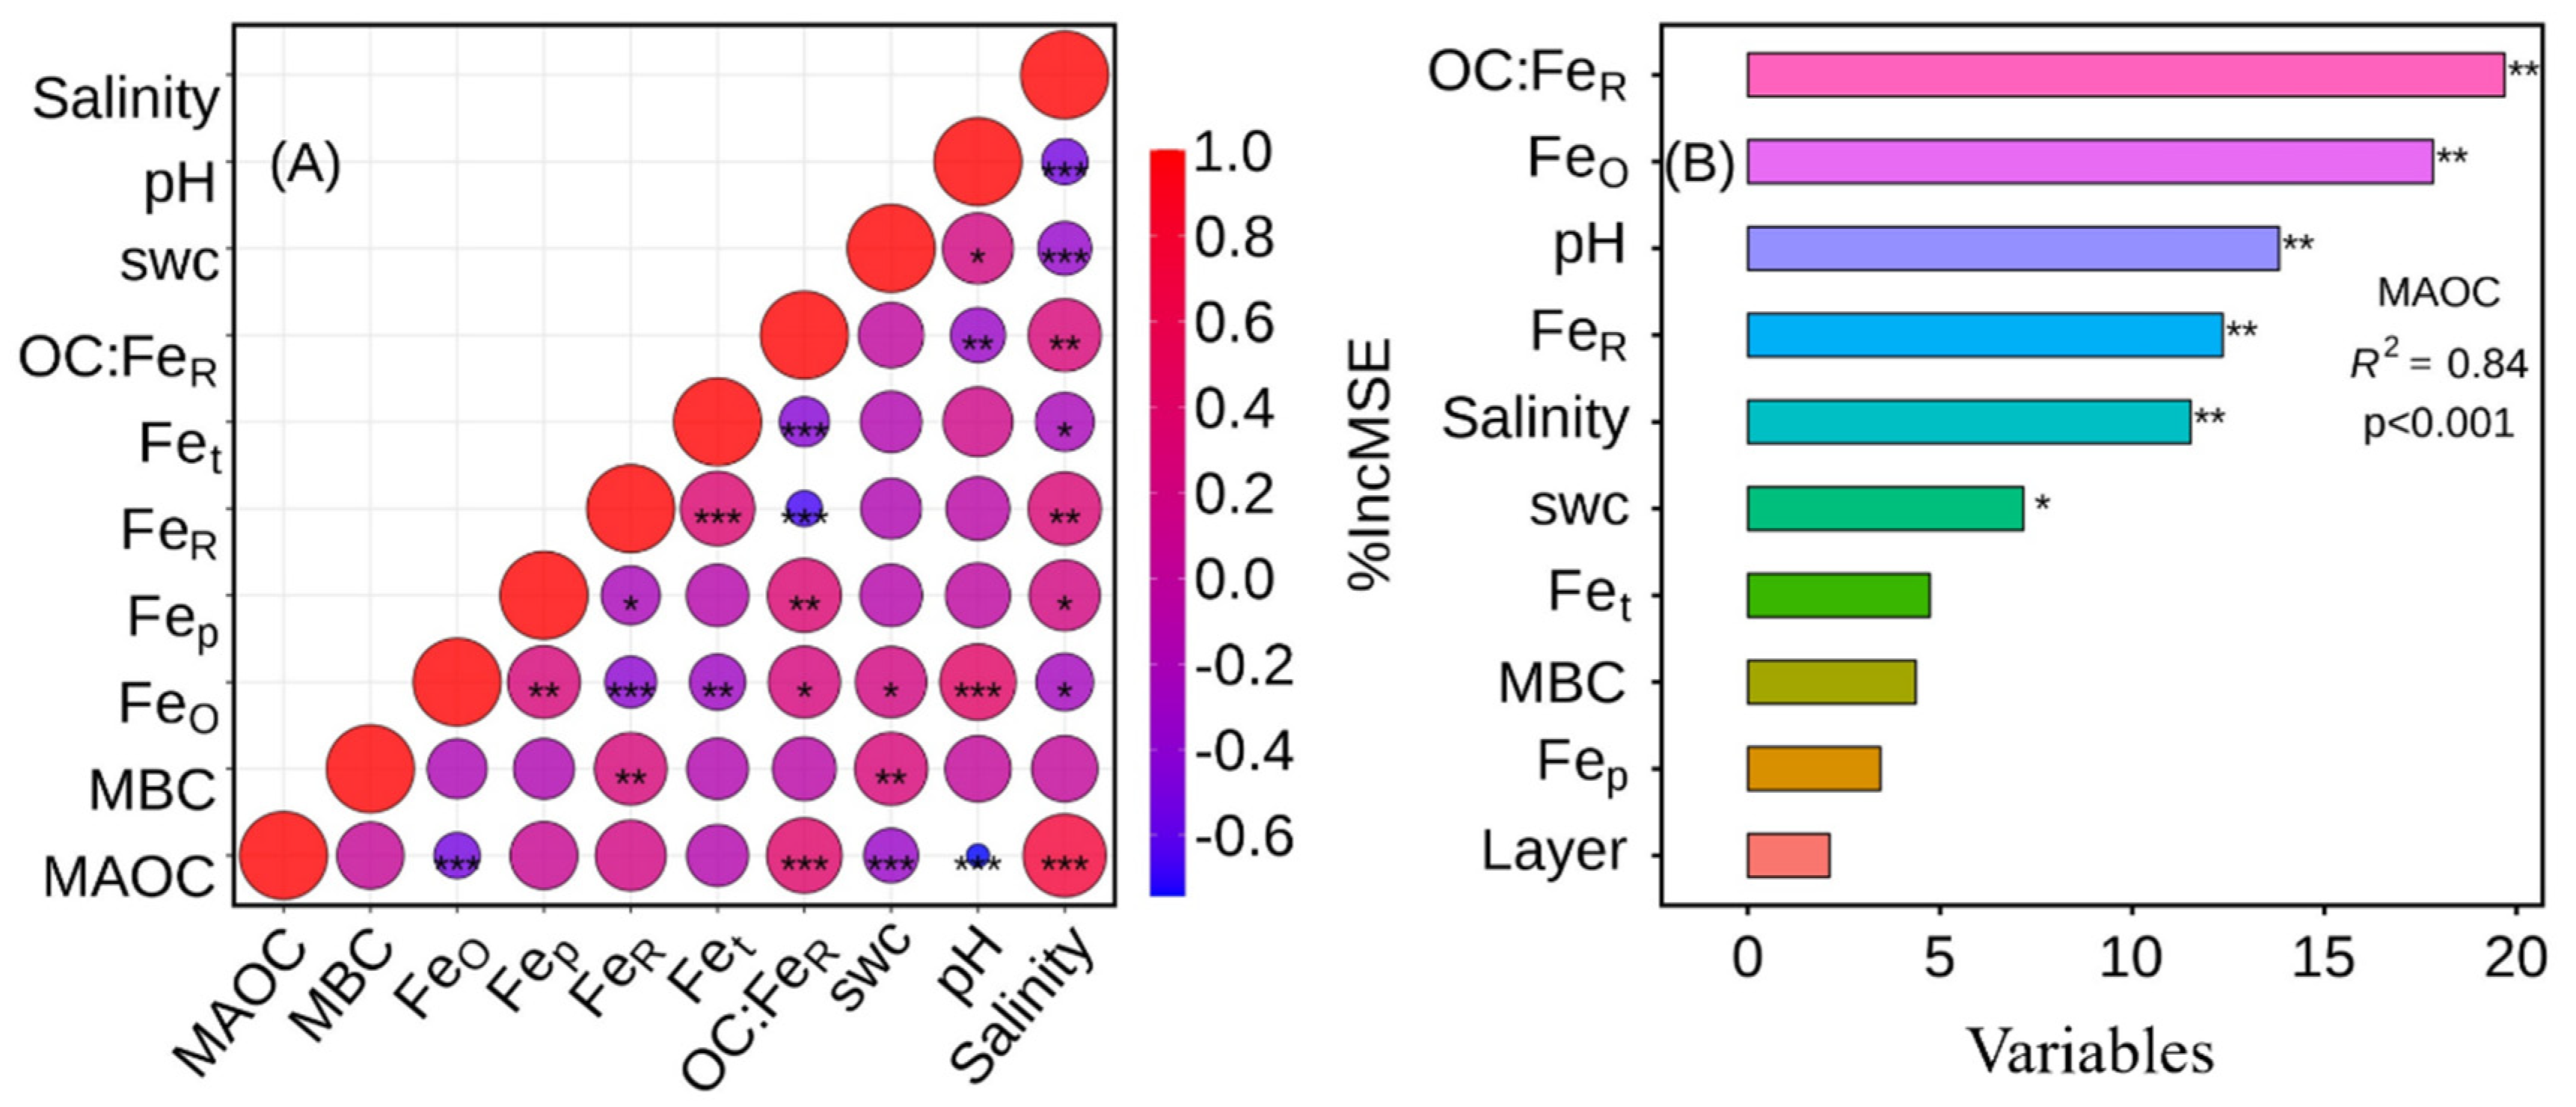
3.6. Drivers of MAOC in Afforestation Mangrove

The Pearson correlations showed that the MAOC concentration was positively associated with OC:FeR, SWC, and salinity (p < 0.001, Figure 5A) but negatively associated with FeO and pH among mangrove species (p < 0.001, Figure 5A). The random forest model indicated that soil minerals (OC:FeR, FeR, and FeO) explained a much more significant portion of the variance (from 9.95% to 20.73%) in MAOC concentration than soil physicochemical parameters (pH, SWC, and salinity, from 5.42% to 11.71%) (Figure 5B).

4. Discussion

Our results show that SOC stocks across 1 m depth were generally higher in mangrove plantations when compared to the MF (Figure 2). These results align with previous studies around the coastal zone [46,47,48], probably due to the inputs derived from mangrove residuals. Compared to shrub-grass species, arbor species typically had faster growth rates and higher above-ground biomass that usually represents more significant litter inputs [49,50,51]. Interestingly, the increased SOC stock after mangrove afforestation did not differ among species (Figure 2). This suggests that allochthonous source inputs and/or SOC decomposition rate may also affect SOC formation in different plantations.
With the two-source mixing model [52,53,54], we indeed found that the autochthonous sources varied significantly among plantations, being generally higher (p < 0.01) in arbors (EA, AC, and KO, 80.97% on average) than shrub-grass (AA and AI, 61.71% on average). This suggests that the contribution of the allochthonous sources to SOC accumulation cannot be ignored during afforestation, given the similar SOC stock among species. Due to the higher-density frequency dominance index of shrub-grass species (AA, AI, about 42.9–49.4%) than arbor species (EA, AC, and KO, 2.0–15.7%) [55], we speculate that the shrub-grass species may have more substantial wave attenuation and hence greater net sediment deposition [56,57].
Our results also showed that SOC fractions differed among plantations. More interestingly, we found that changes in POC and the proportion of autochthonous source (fautochthonouse) in SOC showed similar patterns among the plantations. This is not surprising, as POC is often considered a plant C source that has not yet been fully decomposed by microorganisms. The autochthonous C source before it reaches plantation sites is often partly decomposed into necromass or DOC, which are both easily adsorbed onto mineral-associated soil fractions. Thus, changes in MAOC were similar to the proportion of autochthonous source (fautochthonous) among the plantations. Other factors may also influence the differences in MAOC among plantations. First, soil Fe oxides in coastal mangrove zones are highly activated due to periodical seawater intrusion [58,59,60,61], which would favor bounding more DOC via adsorption and co-precipitation [62]. This is supported by the positive relationship between MAOC and OC:FeR. Second, the lower soil pH and higher salinity would suppress microbial activity and the decomposition of soil organic matter [63]. The slowing decomposition of soil organic matter may provide more C sources for mineral adsorption [64]. Accordingly, we found a negative relationship between MAOC and MBC among the plantations. Therefore, future climate change and/or environmental pollution could change soil pH, salinity, Fe oxides, and SWC, which may have significant impacts on soil C sequestration in mangrove plantations.

5. Conclusions

In this study, we collected soil samples from five monoculture plantations afforested for 20 years and investigated their SOC stock, source, and fraction over 1 m depth. We showed that mangrove plantations generally had higher SOC stock and stability compared to the MF. However, SOC stock among the five plantations did not differ. In contrast, we found that the sources and fractions of SOC varied significantly among plantations, which may be associated with multiple environmental factors such as soil pH, salinity, Fe oxides, and SWC. Our results suggest that while mangrove arbors may have great advantages in vegetation C accumulation in soil as POC fraction, planting shrub-grass mangrove species seemed to favor the accumulation of allochthonous C sources as MAOC fraction. These findings could provide governments and policy makers with valuable information to optimize stand structure and maximize C sequestration during mangrove afforestation.

Supplementary Materials

The following supporting information can be downloaded at: https://www.mdpi.com/2073-4395/13/9/2389/s1, Table S1. The value of δ13C (‰) in different tissues of different plant types. Table S2. Two-way or one-way analysis of variance (ANOVA) of soil physical and chemical parameters among the sites and soil layers.

Author Contributions

Q.D. conceived the study; G.C., M.Z., Y.Z., Y.H. and J.C. collected the field data; G.C. and Q.D. conducted the analysis; G.C. and Q.D. wrote the first draft; X.Y., J.L. and D.H. contributed critically to the drafts. All authors have read and agreed to the published version of the manuscript.

Funding

This work was supported by the Science and Technology Planning Project of Guangdong Province (No. 2021B1212110004 and 2021A1515011471), the Guangdong Forestry Science and Technology Innovation Project (No. 2023KJCX001), the National Key R&D Program of China (No. 2021YFC3100402), the “Hundred Talent Program” of South China Botanical Garden at the Chinese Academy of Sciences (No. Y761031001), the “Young Top-notch Talent” in the Pearl River Talent Plan of Guangdong Province (No. 2019QN01L763), and the National Natural Science Foundation of China (No. 32201372 and 31870461). Dr. Hui was supported by the US National Science Foundation and USDA projects.

Data Availability Statement

The authors confirm that the data supporting the findings of this study are available within the article and its Supplementary Materials.

Conflicts of Interest

The authors declare no conflict of interest.

Correction Statement

This article has been republished with a minor correction to the Funding statement. This change does not affect the scientific content of the article.

References

  1. Hamilton, S.E.; Friess, D.A. Global carbon stocks and potential emissions due to mangrove deforestation from 2000 to 2012. Nat. Clim. Chang. 2018, 8, 240–244. [Google Scholar] [CrossRef]
  2. Sasmito, S.D.; Taillardat, P.; Clendenning, J.N.; Cameron, C.; Friess, D.A.; Murdiyarso, D.; Hutley, L.B. Effect of land-use and land-cover change on mangrove blue carbon: A systematic review. Glob. Chang. Biol. 2019, 25, 4291–4302. [Google Scholar] [CrossRef] [PubMed]
  3. Dan, X.; Liao, B.; Wu, Z.; Wu, H.; Bao, D.; Dan, W.; Liu, S. Resources, Conservation Status and Main Threats of Mangrove Wetlands in China. Ecol. Environ Sci. 2016, 25, 1237–1243. [Google Scholar]
  4. Song, S.; Ding, Y.; Li, W.; Meng, Y.; Zhou, J.; Gou, R.; Zhang, C.; Ye, S.; Saintilan, N.; Krauss, K.W.; et al. Mangrove reforestation provides greater blue carbon benefit than afforestation for mitigating global climate change. Nat. Commun. 2023, 14, 756. [Google Scholar] [CrossRef] [PubMed]
  5. Charles, S.P.; Kominoski, J.S.; Armitage, A.R.; Guo, H.; Weaver, C.A.; Pennings, S.C. Quantifying how changing mangrove cover affects ecosystem carbon storage in coastal wetlands. Ecology 2020, 101, e02916. [Google Scholar] [CrossRef] [PubMed]
  6. Lovelock, C.E. Soil respiration and belowground carbon allocation in mangrove forests. Ecosystems 2008, 11, 342–354. [Google Scholar] [CrossRef]
  7. Alongi, D.M. Carbon Balance in Salt Marsh and Mangrove Ecosystems: A Global Synthesis. J. Mar. Sci. Eng. 2020, 8, 767. [Google Scholar] [CrossRef]
  8. Twilley, R.R.; Chen, R.H.; Hargis, T. Carbon sinks in mangroves and their implications to carbon budget of tropical coastal ecosystems. Water Air Soil Pollut. 1992, 64, 265–288. [Google Scholar] [CrossRef]
  9. Kida, M.; Fujitake, N. Organic Carbon Stabilization Mechanisms in Mangrove Soils: A Review. Forests 2020, 11, 981. [Google Scholar] [CrossRef]
  10. Sasmito, S.D.; Kuzyakov, Y.; Lubis, A.A.; Murdiyarso, D.; Hutley, L.B.; Bachri, S.; Friess, D.A.; Martius, C.; Borchard, N. Organic carbon burial and sources in soils of coastal mudflat and mangrove ecosystems. Catena 2020, 187, 104414. [Google Scholar] [CrossRef]
  11. Tanaka, N.; Sasaki, Y.; Mowjood, M.I.M.; Jinadasa, K.B.S.N.; Homchuen, S. Coastal vegetation structures and their functions in tsunami protection: Experience of the recent Indian Ocean tsunami. Landsc. Ecol. Eng. 2007, 3, 33–45. [Google Scholar] [CrossRef]
  12. Furukawa, K.; Wolanski, E.; Mueller, H. Currents and sediment transport in mangrove forests. Estuar. Coast Shelf Sci. 1997, 44, 301–310. [Google Scholar] [CrossRef]
  13. Bouillon, S.; Borges, A.V.; Castaneda-Moya, E.; Diele, K.; Dittmar, T.; Duke, N.C.; Kristensen, E.; Lee, S.Y.; Marchand, C.; Middelburg, J.J.; et al. Mangrove production and carbon sinks: A revision of global budget estimates. Global Biogeochem. Cycles 2008, 22, GB2013. [Google Scholar] [CrossRef]
  14. He, S.; Lin, J.; Liu, X.; Jia, S.; Chen, S. Cordgrass Spartina alterniflora acts as a key carbon source to support macrozoobenthos in the salt marsh and nearby mudflat communities. Ecol. Indic. 2023, 148, 110052. [Google Scholar] [CrossRef]
  15. Ranjan, R.K.; Routh, J.; Ramanathan, A.L.; Klump, J.V. Elemental and stable isotope records of organic matter input and its fate in the Pichavaram mangrove-estuarine sediments (Tamil Nadu, India). Mar. Chem. 2011, 126, 163–172. [Google Scholar] [CrossRef]
  16. Wang, G.; Zhang, Y.; Guan, D.; Xiao, L.; Singh, M. The potential of mature Sonneratia apetala plantations to enhance carbon stocks in the Zhanjiang Mangrove National Nature Reserve. Ecol. Indic. 2021, 133, 108415. [Google Scholar] [CrossRef]
  17. Sreelekshmi, S.; Harikrishnan, M.; Nandan, S.B.; Kaimal, V.S.; Hershey, N.R. Ecosystem Carbon Stock and Stable Isotopic Signatures of Soil Organic Carbon Sources Across the Mangrove Ecosystems of Kerala, Southern India. Wetlands 2022, 42, 29. [Google Scholar] [CrossRef]
  18. Suello, R.H.; Hernandez, S.L.; Bouillon, S.; Belliard, J.-P.; Dominguez-Granda, L.; Van de Broek, M.; Rosado Moncayo, A.M.; Ramos Veliz, J.; Pollette Ramirez, K.; Govers, G.; et al. Mangrove sediment organic carbon storage and sources in relation to forest age and position along a deltaic salinity gradient. Biogeosciences 2022, 19, 1571–1585. [Google Scholar] [CrossRef]
  19. Dias Rodrigues, C.I.; Brito, L.M.; Nunes, L.J.R. Soil carbon sequestration in the context of climate change mitigation: A review. Soil Syst. 2023, 7, 64. [Google Scholar] [CrossRef]
  20. Arunrat, N.; Sereenonchai, S.; Kongsurakan, P.; Yuttitham, M.; Hatano, R. Variations of soil properties and soil surface loss after fire in rotational shifting cultivation in Northern Thailand. Front. Environ. Sci. 2023, 7, 1213181. [Google Scholar] [CrossRef]
  21. Six, J.; Conant, R.T.; Paul, E.A.; Paustian, K. Stabilization mechanisms of soil organic matter: Implications for C-saturation of soils. Plant Soil 2002, 241, 155–176. [Google Scholar] [CrossRef]
  22. Sun, H.; Jiang, J.; Cui, L.; Feng, W.; Wang, Y.; Zhang, J. Soil organic carbon stabilization mechanisms in a subtropical mangrove and salt marsh ecosystems. Sci. Total Environ. 2019, 673, 502–510. [Google Scholar] [CrossRef] [PubMed]
  23. Lavallee, J.M.; Soong, J.L.; Cotrufo, M.F. Conceptualizing soil organic matter into particulate and mineral-associated forms to address global change in the 21st century. Glob. Chang. Biol. 2020, 26, 261–273. [Google Scholar] [CrossRef] [PubMed]
  24. Rogers, K.; Kelleway, J.J.; Saintilan, N.; Megonigal, J.P.; Adams, J.B.; Holmquist, J.R.; Lu, M.; Schile-Beers, L.; Zawadzki, A.; Mazumder, D.; et al. Wetland carbon storage controlled by millennial-scale variation in relative sea-level rise. Nature 2019, 567, 91–95. [Google Scholar] [CrossRef] [PubMed]
  25. Swales, A.; Bentley, S.J., Sr.; Lovelock, C.E. Mangrove-forest evolution in a sediment-rich estuarine system: Opportunists or agents of geomorphic change? Earth Sur. Process Landf. 2015, 40, 1672–1687. [Google Scholar] [CrossRef]
  26. Conrad, S.R.; Santos, I.R.; White, S.A.; Holloway, C.J.; Brown, D.R.; Wadnerkar, P.D.; Correa, R.E.; Woodrow, R.L.; Sanders, C.J. Land use change increases contaminant sequestration in blue carbon sediments. Sci. Total Environ. 2023, 873, 162175. [Google Scholar] [CrossRef] [PubMed]
  27. Jupin, J.L.J.; Ruiz-Fernandez, A.C.; Sifeddine, A.; Sanchez-Cabeza, J.A.; Perez-Bernal, L.H.; Cardoso-Mohedano, J.G.; Gomez-Ponce, M.A.; Flores-Trujillo, J.G. Anthropogenic drivers of increasing sediment accumulation in contrasting Mexican mangrove ecosystems. Catena 2023, 226, 107037. [Google Scholar] [CrossRef]
  28. Kristensen, E.; Bouillon, S.; Dittmar, T.; Marchand, C. Organic carbon dynamics in mangrove ecosystems: A review. Aquat. Bot. 2008, 89, 201–219. [Google Scholar] [CrossRef]
  29. Nobrega, M.S.; Silva, B.S.; Tschoeke, D.A.; Appolinario, L.R.; Calegario, G.; Venas, T.M.; Macedo, L.; Asp, N.; Cherene, B.; Marques, J.S.J.; et al. Mangrove microbiome reveals importance of sulfur metabolism in tropical coastal waters. Sci. Total Environ. 2022, 813, 151889. [Google Scholar] [CrossRef]
  30. Pupin, B.; Nahas, E. Microbial populations and activities of mangrove, restinga and Atlantic forest soils from Cardoso Island, Brazil. J. Appl. Microbiol. 2014, 116, 851–864. [Google Scholar] [CrossRef]
  31. Kinjo, K.; Tokashiki, Y.; Sato, K.; Kitou, M.; Shimo, M. Characteristics of surface sediments along a creek in a mangrove forest. Soil Sci. Plant Nutr. 2005, 51, 809–817. [Google Scholar] [CrossRef]
  32. Hemingway, J.D.; Rothman, D.H.; Grant, K.E.; Rosengard, S.Z.; Eglinton, T.I.; Derry, L.A.; Galy, V.V. Mineral protection regulates long-term global preservation of natural organic carbon. Nature 2019, 570, 228–231. [Google Scholar] [CrossRef] [PubMed]
  33. Osland, M.J.; Spivak, A.C.; Nestlerode, J.A.; Lessmann, J.M.; Almario, A.E.; Heitmuller, P.T.; Russell, M.J.; Krauss, K.W.; Alvarez, F.; Dantin, D.D.; et al. Ecosystem Development After Mangrove Wetland Creation: Plant-Soil Change Across a 20-Year Chronosequence. Ecosystems 2012, 15, 848–866. [Google Scholar] [CrossRef]
  34. Wu, Z.; Zhou, H.; Ren, D.; Gao, H.; Li, J. Processes controlling the seasonal and spatial variations in sulfate profiles in the pore water of the sediments surrounding Qi’ao Island, Pearl River Estuary, Southern China. Cont. Shelf Res. 2015, 98, 26–35. [Google Scholar] [CrossRef]
  35. Zhu, Y.; Liu, K.; Liu, L.; Wang, S.; Liu, H. Retrieval of Mangrove Aboveground Biomass at the Individual Species Level with WorldView-2 Images. Remote Sens. 2015, 7, 12192–12214. [Google Scholar] [CrossRef]
  36. Zhou, T.; Liu, S.; Feng, Z.; Liu, G.; Gan, Q.; Peng, S. Use of exotic plants to control Spartina alterniflora invasion and promote mangrove restoration. Sci. Rep. 2015, 5, 12980. [Google Scholar] [CrossRef] [PubMed]
  37. Vance, E.D.; Brookes, P.C.; Jenkinson, D.S. An extraction method for measuring soil microbial biomass-C. Soil Biol. Biochem. 1987, 19, 703–707. [Google Scholar] [CrossRef]
  38. Tuzen, M. Determination of heavy metals in soil, mushroom and plant samples by atomic absorption spectrometry. Microchem. J. 2003, 74, 289–297. [Google Scholar] [CrossRef]
  39. Chen, J.; Hu, Y.; Hall, S.J.; Hui, D.; Li, J.; Chen, G.; Sun, L.; Zhang, D.; Deng, Q. Increased interactions between iron oxides and organic carbon under acid deposition drive large increases in soil organic carbon in a tropical forest in southern China. Biogeochemistry 2022, 158, 287–301. [Google Scholar] [CrossRef]
  40. Dicen, G.P.; Navarrete, I.A.; Rallos, R.V.; Salmo, S.G., III; Garcia, M.C.A. Garcia MCA (2019) The role of reactive iron in long-term carbon sequestration in mangrove sediments. J. Soils Sediments 2019, 19, 501–510. [Google Scholar] [CrossRef]
  41. Vieira, F.C.B.; Bayer, C.; Zanatta, J.A.; Dieckow, J.; Mielniczuk, J.; He, Z.L. Carbon management index based on physical fractionation of soil organic matter in an Acrisol under long-term no-till cropping systems. Soil Tillage Res. 2007, 96, 195–204. [Google Scholar] [CrossRef]
  42. Ye, F.; Guo, W.; Wei, G.; Jia, G. The Sources and Transformations of Dissolved Organic Matter in the Pearl River Estuary, China, as Revealed by Stable Isotopes. J. Geophys. Res. Oceans 2018, 123, 6893–6908. [Google Scholar] [CrossRef]
  43. Chmura, G.L.; Aharon, P. Stable carbon-isotope signatures of sedimentary carbon in coastal wetlands as indicators of salinity regime. J. Coastal Res. 1995, 11, 124–135. [Google Scholar]
  44. Chen, J.; Huang, Y.; Chen, G.; Ye, Y. Effects of simulated sea level rise on stocks and sources of soil organic carbon in Kandelia obovata mangrove forests. For. Ecol. Manag. 2020, 460, 117898. [Google Scholar] [CrossRef]
  45. Xiong, Y.; Liao, B.; Wang, F. Mangrove vegetation enhances soil carbon storage primarily through in situ inputs rather than increasing allochthonous sediments. Mar. Pollut. Bull. 2018, 131, 378–385. [Google Scholar] [CrossRef] [PubMed]
  46. Feng, J.; Cui, X.; Zhou, J.; Wang, L.; Zhu, X.; Lin, G. Effects of exotic and native mangrove forests plantation on soil organic carbon, nitrogen, and phosphorus contents and pools in Leizhou, China. Catena 2019, 180, 1–7. [Google Scholar] [CrossRef]
  47. He, Z.; Peng, Y.; Guan, D.; Hu, Z.; Chen, Y.; Lee, S.Y. Appearance can be deceptive: Shrubby native mangrove species contributes more to soil carbon sequestration than fast-growing exotic species. Plant Soil 2018, 432, 425–436. [Google Scholar] [CrossRef]
  48. Yu, C.; Feng, J.; Yue, W.; Wei, L.; Ma, Y.; Huang, X.; Ling, J.; Dong, J. The role of blue carbon stocks becomes more labile with mangrove development. Ecol. Indic. 2023, 154, 110634. [Google Scholar] [CrossRef]
  49. Hoque, M.M.; Kamal, A.H.M.; Idris, M.H.; Ahmed, O.H.; Hoque, A.T.M.R.; Billah, M.M. Litterfall production in a tropical mangrove of Sarawak, Malaysia. Zool. Ecol. 2015, 25, 157–165. [Google Scholar] [CrossRef]
  50. Zhang, Y.; Xiao, L.; Guan, D.; Chen, Y.; Motelica-Heino, M.; Peng, Y.; Lee, S.Y. The role of mangrove fine root production and decomposition on soil organic carbon component ratios. Ecol. Indic. 2021, 125, 107525. [Google Scholar] [CrossRef]
  51. Li, S.-B.; Chen, P.-H.; Huang, J.-S.; Hsueh, M.-L.; Hsieh, L.-Y.; Lee, C.-L.; Lin, H.-J. Factors regulating carbon sinks in mangrove ecosystems. Glob. Chang. Biol. 2018, 24, 4195–4210. [Google Scholar] [CrossRef] [PubMed]
  52. Chen, G.; Gao, M.; Pang, B.; Chen, S.; Ye, Y. Top-meter soil organic carbon stocks and sources in restored mangrove forests of different ages. For. Ecol. Manag. 2018, 422, 87–94. [Google Scholar] [CrossRef]
  53. Tian, Y.; Yan, C.; Wang, Q.; Ma, W.; Yang, D.; Liu, J.; Lu, H. Glomalin-related soil protein enriched in δ13C and δ15N excels at storing blue carbon in mangrove wetlands. Sci. Total Environ. 2020, 732, 138327. [Google Scholar] [CrossRef] [PubMed]
  54. Hu, J.; Loh, P.S.; Pradit, S.; Le, T.P.Q.; Oeurng, C.; Mohamed, C.A.R.; Lee, C.W.; Lu, X.; Anshari, G.Z.; Kandasamy, S.; et al. Assessing the Effect of Age and Geomorphic Setting on Organic Carbon Accumulation in High-Latitude Human-Planted Mangroves. Forests 2022, 13, 105. [Google Scholar] [CrossRef]
  55. Qiu, N.; Xu, S.; Qiu, P.; Yang, W.; Yang, X.; Yang, Q. Community Distribution and Landscape Pattern of the Mangrove on the Qiao Island, Zhuhai. Sci. Silvae Sin. 2019, 55, 1–10. [Google Scholar]
  56. Horstman, E.M.; Dohmen-Janssen, C.M.; Narra, P.M.F.; van den Berg, N.J.F.; Siemerink, M.; Hulscher, S.J.M.H. Wave attenuation in mangroves: A quantitative approach to field observations. Coasta. Eng. 2014, 94, 47–62. [Google Scholar] [CrossRef]
  57. Lee, W.K.; Tay, S.H.X.; Ooi, S.K.; Friess, D.A. Potential short wave attenuation function of disturbed mangroves. Estuar. Coast Shelf Sci. 2021, 248, 106747. [Google Scholar] [CrossRef]
  58. Bai, J.; Xiao, R.; Cui, B.; Zhang, K.; Wang, Q.; Liu, X.; Gao, H.; Huang, L. Assessment: Of heavy metal pollution in wetland soils from the young and old reclaimed regions in the Pearl River Estuary, South China. Environ. Pollut. 2011, 159, 817–824. [Google Scholar] [CrossRef]
  59. Qiao, Y.; Yang, Y.; Gu, J.; Zhao, J. Distribution and geochemical speciation of heavy metals in sediments from coastal area suffered rapid urbanization, a case study of Shantou Bay, China. Mar. Pollut. Bull. 2013, 68, 140–146. [Google Scholar] [CrossRef]
  60. Poulton, S.W.; Raiswell, R. The low-temperature geochemical cycle of iron: From continental fluxes to marine sediment deposition. Am. J. Sci. 2002, 302, 774–805. [Google Scholar] [CrossRef]
  61. Zhu, M.-X.; Hao, X.-C.; Shi, X.-N.; Yang, G.-P.; Li, T. Speciation and spatial distribution of solid-phase iron in surface sediments of the East China Sea continental shelf. Appl. Geochem. 2012, 27, 892–905. [Google Scholar] [CrossRef]
  62. Bhattacharyya, A.; Campbell, A.N.; Tfaily, M.M.; Lin, Y.; Kukkadapu, R.K.; Silver, W.L.; Nico, P.S.; Pett-Ridge, J. Redox Fluctuations Control the Coupled Cycling of Iron and Carbon in Tropical Forest Soils. Environ. Sci. Technol. 2018, 52, 14129–14139. [Google Scholar] [CrossRef]
  63. Liu, J.; Lai, D.Y.F. Subtropical mangrove wetland is a stronger carbon dioxide sink in the dry than wet seasons. Agric. For. Meteorol. 2019, 278, 107644. [Google Scholar] [CrossRef]
  64. Han, L.; Sun, K.; Jin, J.; Xing, B. Some concepts of soil organic carbon characteristics and mineral interaction from a review of literature. Soil Biol. Biochem. 2016, 94, 107–121. [Google Scholar] [CrossRef]
Figure 1. Sampling locations map of the study area. AA, Acrostichum aureum; AI, Acanthus ilicifolius; AC, Aegiceras corniculatum; KO, Kandelia obovate; EA, Excoecaria agallocha; MF, mudflat.
Agronomy 13 02389 g001
Figure 2. Soil organic carbon (SOC) concentration (A) and stock (B) at depth of 0–100 cm in different study sites. Data are shown as mean ± SD, n = 4. AA, Acrostichum aureum; AI, Acanthus ilicifolius; AC, Aegiceras corniculatum; KO, Kandelia obovate; EA, Excoecaria agallocha; MF, mudflat. Capital letters represent significant differences in same layer among study sites and lower-case letters represent significant differences between layers at the same study site (p < 0.05) according to one-way ANOVA followed by Tukey’s HSD test.
Agronomy 13 02389 g002
Figure 3. Soil δ13C values (A) and soil organic carbon source proportion (B) and contributions at 0–100 cm depth in different study sites. Data are shown as mean ± SD, n = 4. Capital letters represent significant differences in the same layer among the study sites and lower-case letters represent significant differences between layers at the same study site (p < 0.05) according to one-way ANOVA followed by Tukey’s HSD test. Uppercase letters indicate the autochthonous source of the 0–100 cm depth between different sites, while lowercase letters indicate the allochthonous source of the 0–100 cm depth between different sites in (C) according to one-way ANOVA followed by Tukey’s HSD test. AA, Acrostichum aureum; AI, Acanthus ilicifolius; AC, Aegiceras corniculatum; KO, Kandelia obovate; EA, Excoecaria agallocha; MF, mudflat.
Agronomy 13 02389 g003
Figure 4. Concentrations (A,B), proportions (C), and stocks (D) of soil mineral-associated organic carbon (MAOC) and particulate organic carbon (POC), respectively, at a depth of 0–100 cm in different study sites. Data are shown as mean ± SD, n = 4. Capital letters represent significant differences in the same layer among the study sites and lower-case letters represent significant differences between layers at the same study sites (p < 0.05) in (A,B) according to one-way ANOVA followed by Tukey’s HSD test. Uppercase letters indicate represent significant differences in POC proportion and stock at the 0–100 cm depth among the study sites, while lowercase letters represent significant differences in MAOC proportion and stock at 0–100 cm depth among the study sites according to one-way ANOVA followed by Tukey’s HSD test. AA, Acrostichum aureum; AI, Acanthus ilicifolius; AC, Aegiceras corniculatum; KO, Kandelia obovate; EA, Excoecaria agallocha; MF, mudflat.
Agronomy 13 02389 g004
Figure 5. Environmental controls of mineral-associated organic carbon (MAOC), across the five plantations, with Pearson correlation coefficient (A) and random forest model (B). R2 represents the variance of MAOC explained by the random forest model. OCFeR, OC:FeR molar ratio; Layer, different layers; MBC, microbial biomass carbon; Fet, total Fe; FeO, oxalate extracted iron; Fep, pyrophosphate extracted iron; FeR, dithionite extracted iron; SWC, soil water content. Asterisks indicate the significance of each predictor, with one, two and three asterisks indicating p < 0.05, p < 0.01 and p <0.001, respectively.
Agronomy 13 02389 g005
Table 1. Basic soil physio-chemical properties of different sampling sites in different sediment depths (Mean ± SE, n = 4). AA, Acrostichum aureum; AI, Acanthus ilicifolius; AC, Aegiceras corniculatum; KO, Kandelia obovate; EA, Excoecaria agallocha; MF, mudflat. Capital letters represent significant differences among study sites at the same soil layer (p < 0.05); lower-case letters represent significant differences among soil layers in each study site (p < 0.05).
LayerSpeciesBulk Density (g cm−3)SWC (%)pHSalinity (‰)MBC (mg kg−1)
0–20AA0.9 ± 0.0 Dc39.7 ± 1.1 Bab6.6 ± 0.1 Bb11.9 ± 0.1 Ca781.9 ± 88.6 Dd
AI1.0 ± 0.0 Cc50.3 ± 1.1 Aa6.6 ± 0.3 Ba12.6 ± 0.2 Aa782.3 ± 59.6 Dd
AC0.9 ± 0.0 Dc34.3 ± 2.1 Dc6.5 ± 0.1 Ba12.8 ± 0.1 Aa768.4 ± 95.6 Dd
KO1.2 ± 0.0 Ab35.2 ± 0.4 CDd6.8 ± 0.2 Bb8.9 ± 0.1 Ec733.3 ± 51.4 Dd
EA1.2 ± 0.0 Ba38.4 ± 1.0 BCb6.8 ± 0.2 Bb12.2 ± 0.1 Ba1706.2 ± 45.2 Aa
MF1.2 ± 0.0 ABbc47.7 ± 2.6 Aa7.7 ± 0.1 Aa9.2 ± 0.0 Da1538.6 ± 64.8 Aa
20–40AA1.0 ± 0.0 Eb41.1 ± 0.9 Ba7.1 ± 0.1 Ba11.4 ± 0.4 Ba1282.3 ± 76.6 Aa
AI1.1 ± 0.0 Da42.3 ± 0.6 Bc6.7 ± 0.1 CDa12.7 ± 0.2 Aa1179.4 ± 55.3 Bb
AC1.0 ± 0.1 Fb47.7 ± 1.9 Aa6.4 ± 0.3 Da10.8 ± 0.1 Cc667.8 ± 69.4 Dd
KO1.2 ± 0.0 Bb51.3 ± 0.8 Aa6.8 ± 0.1 BCb9.2 ± 0.0 Db675.1 ± 82.6 Dd
EA1.1 ± 0.0 Cb41.7 ± 1.2 Ba6.8 ± 0.1 Cb10.7 ± 0.1 Cd900.7 ± 76.7 CDcd
MF1.3 ± 0.0 Aa47.9 ± 3.3 Aa7.5 ± 0.2 Aa8.9 ± 0.0 Db1435.6 ± 96.8 Aa
40–60AA1.1 ± 0.1 Cb37.2 ± 0.7 Bb6.72 ± 0.1 Bb11.8 ± 0.1 Aa1338.8 ± 92.7 Bb
AI1.1 ± 0.0 Cb47.3 ± 0.7 Ab6.88 ± 0.1 Ba11.8 ± 0.1 Ab1090.1 ± 91.5 Cc
AC0.9 ± 0.0 Dd37.0 ± 0.7 Bc6.22 ± 0.3 Ca11.3 ± 0.1 Bb1221.4 ± 63.2 ABab
KO1.2 ± 0.0 Aa39.3 ± 0.3 Bc6.64 ± 0.1 BCb9.3 ± 0.1 Cb1109.7 ± 80.2 BCbc
EA1.2 ± 0.0 Ba39.6 ± 0.8 Bb6.83 ± 0.3 Bb11.2 ± 0.0 Bc1417.2 ± 87.4 Bb
MF1.2 ± 0.0 ABc46.5 ± 3.2 Aa7.52 ± 0.2 Aa8.7 ± 0.0 Dc1263.7 ± 73.5 Bb
60–100AA1.2 ± 0.0 Ba30.3 ± 1.8 Cc6.69 ± 0.0 BCb11.7 ± 0.3 Ba1058.6 ± 80.0 BCbc
AI1.0 ± 0.0 Dd39.1 ± 0.8 Bd6.91 ± 0.2 Ba12.0 ± 0.1 Ab1180.5 ± 74.2 Bb
AC1.1 ± 0.0 Ca43.2 ± 2.7 Ab6.32 ± 0.2 Ca11.4 ± 0.1 Cb1161.6 ± 48.6 Cc
KO1.2 ± 0.1 Bc42.1 ± 0.8 ABb7.52 ± 0.2 Aa10.4 ± 0.1 Da993.9 ± 41.5 Cc
EA1.1 ± 0.0 BCc33.2 ± 0.8 Cc7.34 ± 0.3 Aa11.5 ± 0.0 BCb1201.7 ± 57.6 ABab
MF1.3 ± 0.1 Aab45.7 ± 2.2 Aa7.61 ± 0.2 Aa8.8 ± 0.0 Eb1017.5 ± 44.0 Cc
Table 2. Fe phase of different sampling sites at different sediment depths. AA, Acrostichum aureum; AI, Acanthus ilicifolius; AC, Aegiceras corniculatum; KO, Kandelia obovate; EA, Excoecaria agallocha. Capital letters represent significant differences among study sites at the same soil layer; lower-case letters represent significant differences among soil layers in each study site (p < 0.05).
LayerSpeciesFet (g kg−1)FeR (g kg−1)Fep (g kg−1)Feo (g kg−1)OC:FeR (m:m)
0–20AA61.5 ± 0.7 Aa37.3 ± 1.5 Aa1.1 ± 0.1 Aa12.2 ± 0.8 Ca2.0 ± 0.2 Cb
AI56.9 ± 1.1 BCb37.4 ± 1.5 Aa1.1 ± 0.1 Aa12.8 ± 0.3 Ca2.4 ± 0.1 ABa
AC54.1 ± 1.4 Cb31.6 ± 1.0 BCa1.2 ± 0.1 Aa15.1 ± 0.6 Ba2.5 ± 0.2 Aab
KO59.2 ± 0.9 ABb34.8 ± 1.0 ABa0.9 ± 0.2 Aa10.8 ± 0.3 Dab2.0 ± 0.1 Ca
EA60.4 ± 2.4 Aa37.6 ± 2.1 Aa1.1 ± 0.0 Aab10.6 ± 0.5 Db2.1 ± 0.1 BCa
MF60.3 ± 0.9 Aa31.2 ± 1.4 Cb1.1 ± 0.3 Aa16.4 ± 0.4 Abc2.2 ± 0.2 ABCa
20–40AA62.9 ± 1.1 Aa33.5 ± 1.5 BCb1.2 ± 0.3 Aa10.8 ± 0.5 Bb2.4 ± 0.2 Aa
AI58.5 ± 1.1 Bab36.4 ± 0.9 ABa1.2 ± 0.2 ABa10.8 ± 0.5 Bb2.2 ± 0.1 Aab
AC60.9 ± 1.2 ABa33.8 ± 0.9 BCa1.2 ± 0.1 Aa15.2 ± 0.4 Aa2.3 ± 0.2 Ab
KO63.1 ± 2.5 Aa36.8 ± 2.3 ABa0.9 ± 0.2 ABa9.7 ± 0.8 Bbc1.5 ± 0.2 Bb
EA63.4 ± 2.2 Aa39.1 ± 1.6 Aa0.7 ± 0.2 Bc10.2 ± 0.4 Bbc1.8 ± 0.1 Bb
MF60.1 ± 2.2 ABa30.5 ± 1.5 Cb1.1 ± 0.2 ABa15.9 ± 0.5 Ac2.2 ± 0.3 Aa
40–60AA62.2 ± 1.8 Aa34.2 ± 0.9 Bab1.3 ± 0.1 Aa10.8 ± 0.3 Cb2.2 ± 0.1 Bab
AI57.7 ± 2.9 Bab36.0 ± 0.9 ABa1.2 ± 0.2 Aa12.1 ± 0.4 Ba2.1 ± 0.1 BCb
AC61.0 ± 1.0 ABa33.0 ± 1.5 Ba1.2 ± 0.2 Aa12.8 ± 0.6 Bb2.6 ± 0.2 Aa
KO62.3 ± 1.3 Aab34.0 ± 2.7 Ba1.2 ± 0.3 Aa8.8 ± 0.7 Dc1.9 ± 0.2 Ca
EA63.4 ± 2.1 Aa39.8 ± 2.4 Aa0.9 ± 0.1 Abc9.3 ± 0.5 Dc1.5 ± 0.2 Db
MF60.6 ± 1.9 ABa34.8 ± 1.2 Ba1.2 ± 0.1 Aa17.3 ± 0.4 Aa2.0 ± 0.1 BCa
60–100AA62.2 ± 3.0 Aa35.0 ± 2.0 BCab1.1 ± 0.1 ABa12.4 ± 0.7 CDa2.1 ± 0.1 Bab
AI61. ± 1.4 Aa37.0 ± 1.4 ABa1.3 ± 0.1 Aa12.8 ± 0.5 Ca1.9 ± 0.1 BCc
AC62.1 ± 2.6 Aa32.9 ± 0.5 Ca1.1 ± 0.0 ABa13.3 ± 0.3 Cb2.5 ± 0.1 Aab
KO64.0 ± 1.8 Aa37.2 ± 2.4 ABa1.0 ± 0.1 Ba11.4 ± 0.7 Da1.7 ± 0.2 CDab
EA63.4 ± 2.4 Aa40.6 ± 2.4 Aa1.2 ± 0.1 ABa15.2 ± 0.6 Ba1.6 ± 0.1 Db
MF59.1 ± 1.6 Aa32.1 ± 1.3 Cab1.1 ± 0.2 ABa17.1 ± 0.3 Aab2.1 ± 0.0 Ba
Disclaimer/Publisher’s Note: The statements, opinions and data contained in all publications are solely those of the individual author(s) and contributor(s) and not of MDPI and/or the editor(s). MDPI and/or the editor(s) disclaim responsibility for any injury to people or property resulting from any ideas, methods, instructions or products referred to in the content.

