Article

Designing Management Strategies for Sheep Production and Bees in Dryland Pastures

1
Department of Animal and Rangeland Sciences, Oregon State University, Corvallis, OR 97331-5503, USA
2
Department of Horticulture, Oregon State University, Corvallis, OR 97331-5503, USA
*
Author to whom correspondence should be addressed.
Agronomy 2024, 14(1), 24; https://doi.org/10.3390/agronomy14010024
Submission received: 8 November 2023 / Revised: 5 December 2023 / Accepted: 15 December 2023 / Published: 21 December 2023

Abstract

:
Novel grazing management practices for livestock and bee health are becoming increasingly crucial in pasture-based farming systems. The effect of pasture type and spring closing dates on lamb liveweight gain, pasture production, botanical composition, bloom density and bee visitation was monitored over 2 years. Total annual dry matter yield (DMY) of diverse pastures in 2020/2021 was 8.8 t DM ha−1. This yield was greater than the DMY obtained from both simple (7.6 t DM ha−1) and legume pastures (6.6 t DM ha−1). In 2021/2022, the total annual DMY of simple (8.6 t DM ha−1) and diverse pastures (9.0 t DM ha−1) was similar. However, the legume pastures produced 27–30% less than simple and diverse pastures. In successive years, lambs grew faster in legume pastures (287, 215 g per head d−1) than diverse (207, 151 g per head d−1) and simple pastures (204, 132 g per head d−1). However, spring liveweight production (kg ha−1 day−1) from pastures did not differ due to the lower stocking density of legume pastures as compared to the other two pasture mixtures. Bloom density (flower/m2) and bee visitation (bees/min−1 m2) were 16 and 40 times greater with legume rather than simple pastures. Bloom density for diverse pastures was also relatively lower than for the legume pastures. Our findings indicated that the diversification of pastures greatly increased pasture productivity, while legume pastures provided the highest bee benefit without penalizing lamb liveweight production in spring.

1. Introduction

Demand for sustainable management of pasture-based animal production has been increasing in recent years due to rising consumer trends seeking natural and healthier food sources [1]. As a result, there has been a growing emphasis on pasture-based systems that deliver not only greater animal production but also offer broader benefits to the ecosystem and the environment. The main goal when choosing pasture mixtures for a given environment is to ensure persistent and productive stands that provide high-quality forages without causing any detrimental effects to the health of grazing animals. Diverse pastures containing a variety of herbs provide high-quality forage for both grazing animals and pollinating insects, which can help in creating a pasture system that can improve livestock production and health while providing a number of ecosystem benefits. The diversification of pastures has been shown to provide greater benefits to both grazing animals [2,3] and pollinators [4,5].
The Pacific Northwest (PNW) region encompassing the states of Washington, Oregon, and Idaho between the Rocky Mountains to the east and the Cascade Range to the west [6] has a total of 11,680,118 hectares of pasturelands and rangelands [7,8,9], and is home to a wide variety of native bee species (approximately 900) [10]. This diverse bee community provides valuable pollination services, benefitting the region immensely [11,12,13]. The region is also one of the largest stocks of honey bee (Apis mellifera L.) for the pollination of California almonds, which is the most valued agricultural crop pollination service in the United States [14]. The physical and climatic characteristics of the PNW are highly conducive to establish honey bee pasture and pollinator habitat conservation. However, the PNW has lagged behind other regions (such as the Great Plains) in its efforts for pollinator habitat conservation [15]. Additionally, a combination of changing land-use away from nectar- and pollen-bearing field crops (e.g., clover seed) towards crops that do not provide these resources (e.g., wine grapes, and hazelnut) and hotter and drier summers are decreasing the extent summer bee forage, which is strongly linked the success of many bee species [16,17,18]. Thus, there is a need to investigate management practices to promote pollinators in pastures by incorporating multiple plant species and shifting from simple pastures to diversified pastures without reducing grazing animals’ forage quality and quantity [19,20]. With the diversified and legume pastures proving to be beneficial to lamb growth and bee health, creating a dual-use pasture system that benefits them both is of great need. Even small improvements in grassland diversity enhance the delivery of pollination services [4]. Thus, it is possible to design pasture mixtures and manage them for high animal production and pasture persistence, as well as nectar and pollen for bees.
Notable examples of plant species suitable for the PNW with the potential to benefit pollinators as well as grazing animals include Trifolium repens (white clover), Medicago sativa (alfalfa) Lotus corniculatus (birdsfoot trefoil), Trifolium michelianum (balansa clover), Trifolium pratense (red clover) as well as Cichorium intybus (chicory) [21]. The combination of these species has the potential to increase forage production, animal liveweight gain, antiparasitic properties [3,22] as well as a nectar and pollen source [23]. Furthermore, pasture management can be adjusted to promote bee abundance and diversity without compromising animal production [24]. For instance, applying intermediate grazing intensity or closing pastures from grazing in late spring (stockpiling) can improve the floral bloom density and consequently bee visitations when the nectar source is most needed in summer [25]. Earlier closing can also help the regeneration of cool season annual legumes in dryland pastures [26,27].
Thus, in this study, we investigated the effects of pasture diversification and spring pasture closing dates on pasture production, lamb growth, bloom density and bee visitations utilizing pasture species with the potential to benefit pollinators as well as grazing animals. We hypothesized that diversified and legume pastures will provide greater lamb growth rates and increase pollen and nectar availability in summer as compared to simple pastures; and that the early closing of pastures will increase the abundance of blooms and therefore promote greater bee visitations.

2. Materials and Methods

2.1. Site

This study was conducted at Oregon State University Farm in Corvallis, Oregon (44°34′ N, 123°18′ W 78 m a.s.l.), in 2021 and 2022. All procedures were approved by the Institutional Animal Care and Use Committee (ACUP 0152). The soil in the site was primarily Amity silt loam with 0–3% slopes [28]. Soil tests conducted by Oregon State University Soils Health Laboratory indicated the site had the following conditions: organic matter, 6.4%; available P (Bray), 113 ppm; Ca, 12.5 meq/100 g; Mg, 4.5 meq/100 g; K, 280 ppm; and soil pH(w), 5.3.

2.2. Meteorological Conditions

Overall, the mean air temperature followed a similar trend with long-term means (LTMs) except the mean monthly air temperatures were higher than usual in fall 2020 and colder in spring 2022 (Table 1). The rainfall was 65% less than long-term means in spring 2021, while it was 47% greater than usual in spring 2022.

2.3. Pasture Establishment and Experimental Design

Pasture treatments were established in a 1.332 ha plot on October 1 in 2020. Prior to establishment, pasture paddocks were divided into four equal blocks to serve as replicates for the experiment. Each block was divided into 3 subplots, which were randomly allocated to a combination of (1) simple, (2) diverse and (3) legume pastures, giving a total of 12 plots, each covering an area of 0.111 hectares (30 m × 37 m.). Pastures were further divided into three equal subplots (12.3 m × 30 m.) to apply rotational grazing. These subplots also served as different closing date (early, mid and late) treatments in both years (see Section 2.4).
The experimental design was a split plot design where the pasture mixtures were the main plot and the closing dates were the subplot treatments. Pasture mixtures were sown with a no-till seeder (Land Pride, Great Plain Manufacturing, Salina, KS, USA). All the legumes were inoculated with appropriate Rhizobia strains. The species sown and the seeding rates (kg ha−1) of each pasture mixture are presented in Table 2. Urea (46-0-0) fertilizer was applied at a rate of 50 kg N ha−1 at sowing in fall of 2020. In spring 2021 and 2022, prior to the commencement of grazing, urea sulfate (Ureasul, Wilco © Wilco-Winfield LLC, Mt. Angel, OR, USA) fertilizer (33-0-0-12) was applied at 50 kg N ha−1. In January 2020 and December 2021, post-emergence, grass-specific herbicide (26.4—Clethodim) was applied at a 443 mL ha−1 ai. rate in legume pastures to kill the volunteer grass weeds.

2.4. Grazing Management

Weaned, 2.5-month-old Polypay lambs (mixed sex) were blocked by weight (21.4 ± 4.04 kg) in 2021 and (25 ± 4.53 kg) in 2022, and by sex, and then randomly assigned to treatments. A put-and-take grazing system was implemented, allowing regulator animals to move between treatment plots and be removed as needed with the changing supply of forage [29]. Each treatment had a core group of 3–6 weaned lambs (testers) with 3 spare lambs (regulators) used in a put-and-take grazing system to match feed demand with fluctuating supply. Lambs had free access to forage, mineral blocks, and clean water in troughs connected to a water supply.
All pasture mixtures were rotationally grazed with a flock of lambs in each plot grazing one subplot while the other two subplots were rested. Stocking density of the plots was dependent on the availability and growth rates of forages within the plot and ranged from 27.0 to 63.1 lambs per hectare. In 2021, sixty-five lambs grazed beginning in the simple and diverse pastures on 12 April, the legume plots were delayed due to a slower forage growth, and once sufficient, began grazing on 27 April. Lambs were moved between their respective subplots every 7–10 days depending on forage availability in the subplot currently being grazed, and the availability in the subplot the lambs were intended to move into. To quantify the effect of the stockpiling strategy on the nectar production of pastures in June-August and potential of self-regeneration of annual legumes, pastures were closed on 12–14 May, 26–28 May or 8 June. Following spring grazing, pastures were destocked for stockpiling the forages and providing forage for bees until Mid-July-August. Stockpiled pastures were grazed by dry ewes in August before the fall rains activated the pasture growth and germination of self-regenerating annual legumes. In spring 2022, grazing started on 28 March and ran through 16 June. The closing dates were 27 May, 6 June, and 16 June.

2.5. Management of Plots Outside Spring Experimental Period

Two groups of 30 mature Polypay ewes were turned onto pasture plots where each plot was only grazed one time, with simple and diverse pasture plots being grazed for two days at a time, and legume plots grazed one day at a time before moving to the next plot from 9 August and 19 August 2021. In Fall 2021, forty mature Polypay ewes were placed into simple and diverse pastures (five in each plot) and grazed until 12 November 2021. Legume plots were not grazed at this time due to a lack of forage availability. Plots were mown in summer 2022, while they were spelt in fall due to lack of forage growth.

2.6. Measurements

2.6.1. Pasture Dry Matter (DM) Production

Pasture dry matter (DM) was measured using 1 m2 exclosure cages during active growth in spring, summer, and fall. No samples were collected in the winter months as there was minimal pasture growth due to cold temperatures and heavy rains. Forage growth was harvested from under each cage using a rectangular 0.25 m2 quadrat and electric clippers to cut the forage to a stubble height of 3 cm. After cutting the forage, a new area of each subplot was mowed to a stubble 3 cm height and the exclosure cage was placed there for the next growing period. Forage cuts obtained from under the cages were then sub-sampled and sorted into their respective botanical species before being dried in an oven at 65 °C for 48 h and then weighed. Total DM production (kg DM ha−1) was divided by the number of days elapsed since the previous harvest to determine the mean daily growth rates (kg DM ha−1 day−1).

2.6.2. Lamb Production

To determine LWG (g head−1 day−1), individual tester animals were weighed prior to and following each grazing period. LWG was determined by the change in weight between each live weight measurement date. Further, liveweight production (LWP) (kg ha−1 d−1) was determined by taking the liveweight gain per head of tester lambs, multiplied by the number of testers plus regulator lambs per hectare.

2.6.3. Pasture Mass on Offer

Pre- and post-grazing pasture mass (kg DM ha−1) was measured using a rising plate meter (PM; Jenquip, Feilding, New Zealand). Walking in a zig-zag pattern, 30 measurements were collected in subplots prior to lambs entering the subplots during rotation to obtain the pre-grazing pasture mass. Additionally, 30 measurements were taken in the subplots after lambs rotated out of them to obtain the post-grazing pasture mass. Rising plate meter measurements were calibrated by regression against the herbage mass using 0.25 m2 quadrats. Calibrations of herbage pasture mass were performed initially on 6 April 2021, with 1 quadrat in each simple and diverse subplot for a total of 24 data points. In 2022, calibration cuts were performed on 22 March with 1 quadrat in each plot for a total of 12 data points. Calibration cuts were repeated 6 July, and 27 July with 2 quadrats in each subplot for a total of 72 data points.

2.6.4. Botanical Composition and Nutritive Value of Pasture on Offer

A total of 30–50 pluck samples, representative of the forage available to the lambs, were hand collected in a random pattern across the subplots prior to moving the lambs into them. Pluck samples were sorted into subsamples and sorted into their respective botanical species (i.e., grass, legume, herb, weed, and dead material) and dried in an oven at 65 °C for 48 h. Dry weights of the pluck sample and botanical species were then used to calculate the percentage botanical composition of the samples. A well-mixed bulk sample was ground in a Wiley mill using a 1 mm stainless steel screen (Thomas/Wiley, Swedesboro, NJ, USA) for chemical analyses using the Association of Official Analytical Chemists methods [30]. The ground sample was used to perform chemical analyses. NDF and ADF were performed following the methods described by Van Soest et al. [31] using an Ankom200 Fiber Analyzer (ANKOM Technology Corp., Macedon, NY, USA). Crude protein (CP) was analyzed using a LECO N analyzer (LECO FP828, MI, USA). Ash was analyzed (method 942.05), and ether extract (EE) was analyzed (method 920.39). Total digestible nutrients (TDN%) was calculated using the following formula: TDN% = 82.38 − (0.7515 × ADF).

2.6.5. Fecal Egg Counts

Individual fecal samples (~10 g) were taken from the rectum of each lamb using a powder-free latex examination glove. Fecal egg counts (Strongyle) were obtained at random from test animals in each treatment at the start of the trial on 12 April 2021, and 28 March 2022. Previously, tested animals were then sampled again at the conclusion of the trial on 6 June 2021, and 18 June 2022. Samples were taken to the Oregon State University Veterinary Diagnostic Lab and viewed for eggs per gram (EPG).

2.6.6. Bloom Density and Bee Visitations

Bloom density was measured using a rectangular 0.25 m2 quadrat. Subplots were divided into numbered areas and a number randomizer was used to determine each placement. The quadrat was placed in each subplot three times and each flower in bloom was counted and organized into its respective species. In 2021, measurements were taken in each subplot weekly starting on 23 April and concluding on 27 July. In 2022, measurements were taken weekly in each subplot starting on 5 May and concluding on 3 August. Bee visitations were measured using a variable transect walk [32] in five- or ten-minute increments by walking back and forth in the subplots for the appointed time and counting bumble bees and honey bees when seen visiting a flower (five minutes with two people and 10 min with one person). In 2021, bee visitations were measured on a weekly basis in each closing date subplot, starting on 23 April and concluding on 27 July. In 2022, visitations were measured on a weekly basis in each legume subplot and rotating through simple and diverse subplots weekly. In 2022, bee visit observations started on 16 May and concluded on 3 August.

2.6.7. Seedling Numbers

As an indicator of the effects of spring grazing management on persistence of balansa and subterranean clover, seedling numbers were counted in three randomly placed 0.01 m2 quadrats in each closing date plot in all three pasture types on 4 November 2020, 1 November 2021 and 1 October 2022.

2.7. Statistical Analysis

Annual DM production was analyzed by ANOVA in a completely randomized design with four replicates (block). Pasture growth rates, botanical composition, LWG of lambs per head (g hd−1 d−1) and per hectare (kg ha−1 d−1) were analyzed by one-way ANOVA with four replicates for every measurement period. Pasture nutritive value and herbage mass on offer values were averaged across each rotation and analyzed in a complete randomized design with four replicates. Fecal EPG values were analyzed in a complete randomized design with four replicates (block), using pastures as the experimental unit. Bloom density, bee visitations and seedling numbers were analyzed in a split–split plot design where pasture mixtures were the main plot, closing dates were the sub-plot and the sampling period was sub-subplot. No statistical analysis was performed for the bloom composition since the comparison among treatments was not possible. This was because the blooming species were not common to each treatment. Significant differences among treatment means were compared by Fisher’s protected least significant difference at p < 0.05. The computations were conducted using GENSTAT statistical software (v. 22).

3. Results

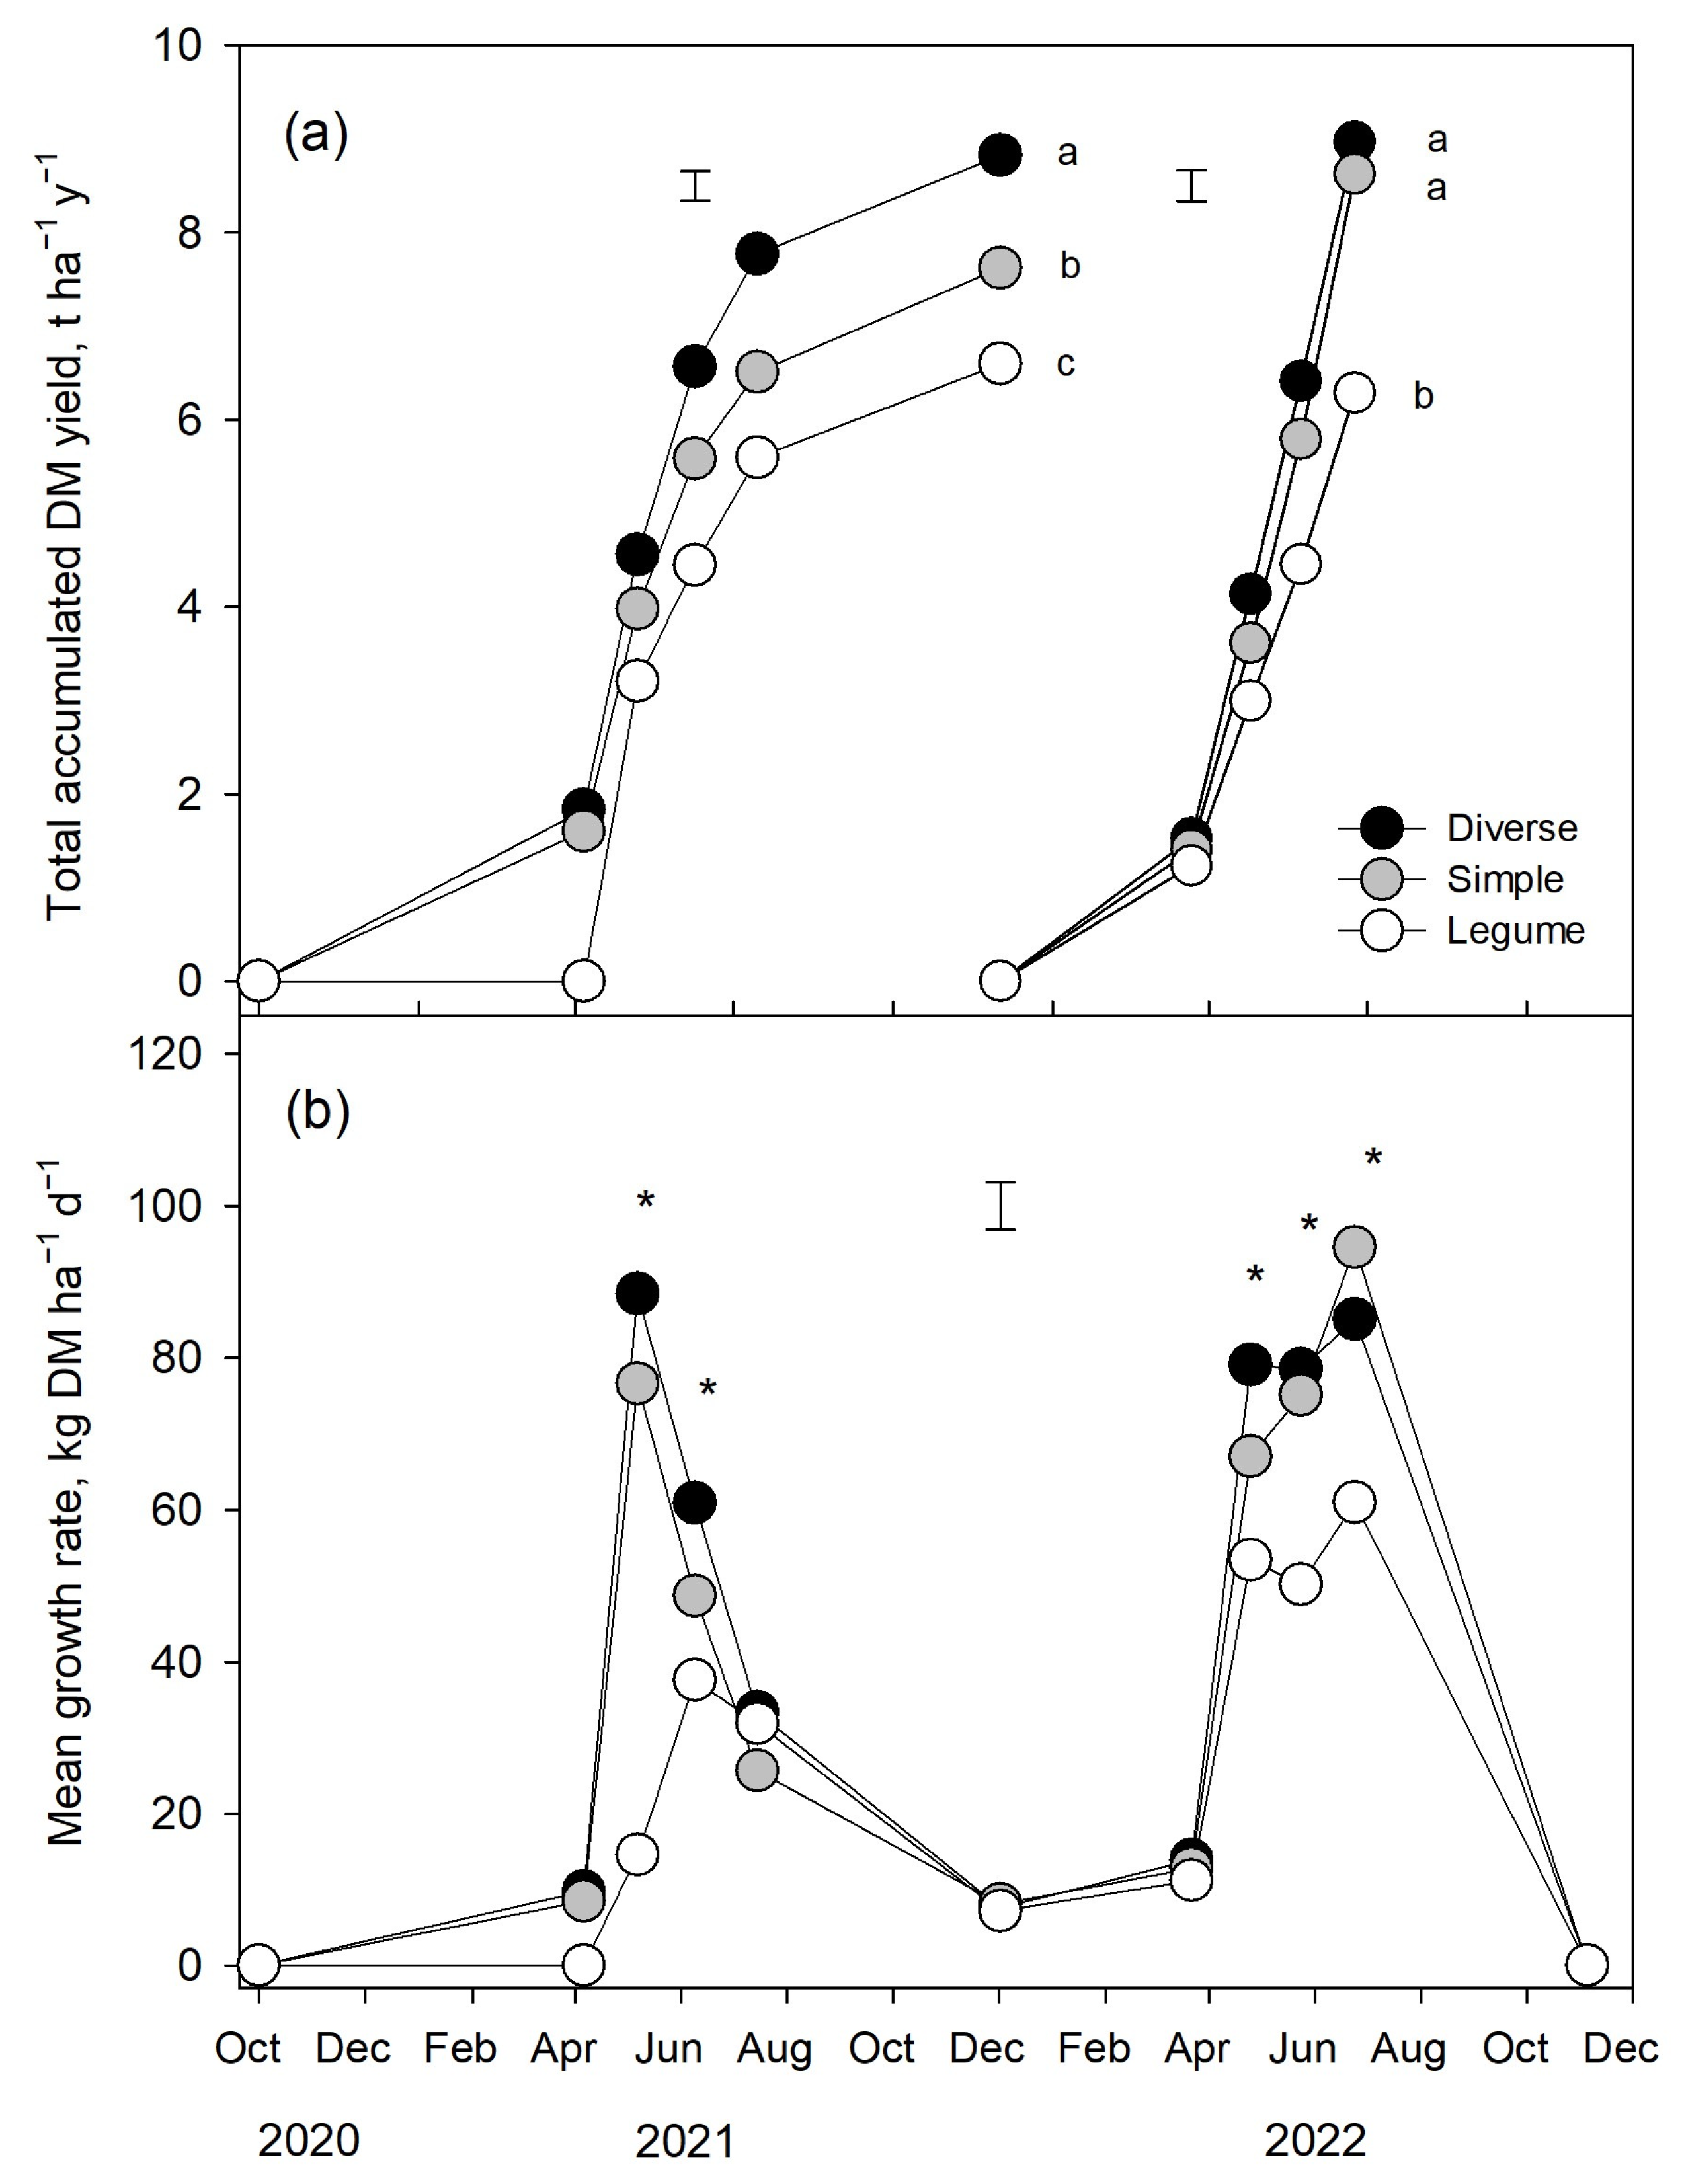
3.1. Pasture Dry Matter (DM) Production

In the 2020/2021 growing season, the total annual dry matter yield (DMY) of diverse pastures was greater (p < 0.01) than the DMY of simple grass-dominated, and legume pastures (Figure 1a). In the 2021/2022 growing season, the total annual DMY of simple and diverse pastures were similar. However, the legume pastures produced 27–30% less than simple and diverse pastures.
In 2021, the herbage growth rates (kg ha−1 d−1) displayed a sharp increase at the beginning of April with diverse pastures being the greatest (10.1 kg ha−1 d−1) followed by simple pastures (8.8 kg ha−1 d−1) and no growth for legumes due to the delay of growth (p < 0.01; Figure 1b). In early May, the trend continues with diverse pastures having the greatest growth (80.5 kg ha−1 d−1) followed by simple pastures (76.6 kg ha−1 d−1) and then legume pastures (15.1 kg ha−1 d−1) (p < 0.01). Through the rest of the year until early December, the herbage growth continued to decline, However, the amounts per treatment were insignificant (p > 0.01). In 2022, from late March until late May, there was an increase in herbage growth among all treatments, but the total growth between treatment types was insignificant (p > 0.01). However, beginning in late May, differences between treatment types were significant (p < 0.01) where diverse pastures were greater than simple pastures, followed by legume pastures (78.5, 75.1 and 50.2 kg ha−1 d−1), respectively. In late June, herbage growth continued to increase with simple pastures having the greatest growth, followed by diverse pastures, and then legume pastures (91.5, 82.4, and 59.1 kg ha−1 d−1), respectively (p < 0.01).
Percentage of legumes, sown grasses, total forbs (legumes and herbs), dead material, and weeds for each pasture type for both 2021, and 2022 are presented in Figure 2a–e. Percentage of legumes in both the diverse and simple pasture remained similar across both years (Figure 2a), while the percentage of sown grass in the diverse and simple pasture also remained similar across both years (all p > 0.05; Figure 2c). The percentage of total forbs in the diverse and simple pastures remained similar through 2021 and up until April of 2022 when there was an increase (p < 0.05) in the forb content of the diverse pastures. Total forbs remained highest across both years in the legume pasture and had a gradual decline from May of 2021 until July of 2022. Dead material was similar across all treatment types through both years (all p > 0.05; Figure 2e). The percentage of weeds did not differ between simple and diverse pastures, but legume pastures had the greatest (p < 0.05) percentage of weeds which stayed constant through May of 2022 before peaking to its highest point in July of 2022.

3.2. Lamb Production

In both years, the lamb growth rates (g hd−1 d−1) from legume pastures were greater (p < 0.01) than the other pasture types (Table 3). However, the LWP (kg ha−1 d−1) from all three pasture types were comparable (p = 0.23). Lambs grew faster in the first half of spring in both years. Their growth rates reduced as the season progressed. The diverse pastures provided greater (p < 0.01) lamb total liveweight production than simple pastures and legume pastures by 38 and 220 kg ha−1, respectively, in spring 2021. While the total lamb liveweight gains were 745, 628 and 581 kg ha-1 for diverse, simple and legume pastures, respectively, in 2022, the difference was not significant (p = 0.20).

3.3. Pasture Mass, Botanical Composition and Nutritive Value of Pasture on Offer

Pre-grazing pasture mass (kg DM ha−1) in spring of 2021 and 2022 is presented in Figure 3a,b. In 2021, pre-grazing herbage mass of pasture mixtures ranged from 1812 kg DM ha−1 to 2802 kg DM ha−1 and was comparable across pasture types at each rotation (all p > 0.05). In 2022, simple and diverse pastures had a similar pre-grazing herbage mass, ranging from 1740 to 1976 kg DM ha−1. However, legume pastures had approximately 300 kg DM ha−1 less (p < 0.0) herbage on offer than grass-based pastures throughout the grazing period.
The proportion of forbs (legume + herbs) in herbage on offer in spring of 2021 and 2022 are presented in Figure 3c,d. In 2021, the forb content of diverse pasture was greater (p < 0.05) than that of simple pastures during rotations 1 and 3 but similar (25.7 vs. 14.5%) in rotation 2. Legume pastures had a substantially greater (p < 0.01) forb content than other pastures, ranging from 81.8% in rotation 2 to 65.3% in rotation 3. In spring 2022, the forb content of simple pastures was negligible (>2%), while diverse pastures had over 40% forb content in rotation 1. Legume pastures had the highest forb content during the same rotation period. The forb content of the simple pastures went up to 10% in the second rotation, but this was still substantially lower (p < 0.01) than the forb content in diverse and legume pastures. In rotation 3, the forb content of the legume and diverse pastures was comparable (51.1% vs. 59.4%) but greater than simple pastures which had only a 15.4% forb content.
In 2021, TDN content (%) of pasture on offer remained similar (all p > 0.05) across treatment types through all rotations, except for the diverse pasture which showed a decrease in TDN in the third rotation (Figure 3e,f). In 2022, the TDN content of pastures ranged from 62.5 to 68.2% and it was relatively stable across the rotations. The TDN content of legume pastures tended to be greater than simple pastures in rotation 1 (p = 0.05) and rotation 2 (p = 0.07). All pastures had a similar (p = 0.72) TDN content in rotation 3.

3.4. Fecal Egg Counts

In 2021, EPG counts did not differ among the three pasture mixtures (all p > 0.05) (Table 4). In 2022, EPG counts were lower (p < 0.05) for lambs grazing diverse pastures than simple pastures at the end of the grazing trial.

3.5. Bloom Density and Bee Visitations

Averaged across the entire grazing period, bloom density of pastures was 1.9, 8.7 and 50.4 flowers per m2 for simple, diverse, and legume pastures, respectively, in 2021 (Figure 4a,b). A pasture treatment × period interaction (p < 0.01) was detected as the bloom density for simple pastures was low and relatively stagnant as compared to diverse and legume pastures. In both 2021 and 2022, simple and diverse pastures had a similar trend for bloom density. In 2021, legume pastures had a high bloom density at the beginning of the season and began to gradually decline starting in late May until terminating in July.
In 2022, the bloom density in legume pastures remained somewhat constant throughout, aside from mid-June and mid-July, where bloom density decreased (Figure 4c,d). There was a three-way interaction (p < 0.01) among pasture treatment, closing date, and period for bloom density for the grazing period following the first closing date. Neither the closing date, nor the period had any effect on simple grass pastures for bloom density. Earlier closing of legume pastures led to greater bloom density as compared to mid and late closing dates, but the difference in bloom density induced by closing dates disappeared after the first week of July.
Bee visitation across 2021 was similar between simple and diverse pastures, with the highest (p < 0.01) visitations being displayed in the legume pastures (Figure 5a,b). A three-way interaction (p < 0.01) was detected among pasture treatment, closing date, and period for bee visitations. Bee visitations in legume pastures had a peak in early May and began to decrease sharply starting in mid-May until they were comparable to simple and diverse pastures in early July. The closing date treatments did not have any effect on the bee visitations for simple and diverse pastures, but bee visitations were higher with earlier closing (first) then mid (second) and late (third) closing for legume pastures. In 2022, bee visitations were similar (p > 0.05) across treatments, with legume pastures showing a slightly higher number of visitations (Figure 5c). In 2022, no discernable differences among closing dates were observed for the bee visitations (Figure 5d).
In 2021, balansa clover dominated the legume and diverse pastures through mid-June (Figure 6a). In the legume pastures, there was then a shift to white and berseem clover beginning to dominate the pasture, and in late July, weeds and red clover made an appearance. In the diverse pastures, white clover was the main component of the blooming flowers. In mid-June until mid-July, plantain and chicory bloom predominated. In the simple pasture, sub clover dominated through mid-May, when white clover then took over through mid-July. In 2022, balansa clover was the prominent clover in the legume pastures through mid-June, where there was then a shift to white clover until mid-July when weeds took over. However, the broadleaved weeds (predominantly Crepis spp. and Rumex crispus) were also a major component of the blooming plants ranging approximately from 20 to 40%. Toward the end of July, broadleaved weeds were the plants that predominantly contributed to the blooms.

3.6. Closing Date Effect on Persistence of Annual Legumes

The number of established sub clover plants on 4 November 2020 was 100, 146 and 208 plants per m2 in diverse, legume and simple pastures, respectively, whereas the number of established balansa clover numbers was 96 and 104 in diverse and legume pastures, respectively (Table 5). The subterranean clover seedling numbers were similar in legume and diverse pastures, but they were lower (p < 0.01) than simple pastures on 1 November 2021. Early and mid-closing dates resulted in a similar number of seedlings, but late closing resulted in a fewer (p < 0.05) number of established sub clover seedlings. While the closing dates in previous spring did not affect (p = 0.90) the established number of balansa clover seedlings, the legume pasture had a substantially greater (p < 0.01) number of seedlings than diverse pastures. In fall 2022, the effect of pasture type on subterranean clover seedlings was not significant, while closing earlier on 27 May resulted in a greater (p < 0.05) than established number of seedlings than closing on 16 June. The number of established balansa clover seedlings was virtually none in diverse pastures. The effect of closing date on balansa clover seedling in legume pastures was not significant (p = 0.93).

4. Discussion

4.1. Forage Production

Total annual forage production was strongly influenced by the erratic weather conditions over the two-year study period. Specifically, in spring of 2021, there was a 65% decrease in rainfall when compared to the LTM. In contrast, in spring of 2022, there were wetter conditions, with a 46% increase in rainfall when compared to the LTM. Furthermore, slightly warmer and wetter conditions in fall of 2021 induced favorable conditions for germination and growth for the self-regenerating annual legumes. This in turn helped legumes with higher forage production in early spring compared to the previous year, allowing for the earlier commencement of the grazing season. In contrast, the late onset of rainfall in fall of 2022 resulted in negligible forage growth for that season and could not support fall grazing.
The value of diversification of pastures using pasture forbs was particularly highlighted in the drier-than-usual spring conditions of 2021. However, the same benefit was not as obvious in a wet spring when simple and diverse pastures had a similar DMY in 2022. This was possibly due to the greater summer growth potential of forbs with deep tap roots, in particular when the soil moisture was limiting. A number of studies have noted the same value of diversification. For example, Woodward et al. [33] indicated that when simple grass pastures were diversified with other plants such as clovers, chicory, and plantain, there was a greater DM production through the warmer summer months as the forb species grew better than the grasses alone. Similar to the findings of the current study, Daly et al. [34] also reported that annual forage production in diverse pastures containing chicory, plantain, small burnet (Sanguisorba minor L.) and yarrow were significantly and consistently greater than that of the ryegrass–white clover pasture. The greater total production was also attributed to higher summer growth in diverse than grass pastures. However, the value of diversification of pastures may not only be limited to dryland conditions. It is of note that Black et al. [35] recorded greater forage production from diverse rather than simple pastures in irrigated conditions in New Zealand as well, indicating that aside from the availability of water, other factors such as botanical composition, temperature, and soil conditions play a major role.
A further reason for diverse pastures not exhibiting their comparative advantage in spring 2022 may be due to the cooler temperatures and adverse soil conditions caused by excess rain. It is probable that forbs, in particular, chicory, is known for a lack of tolerance for waterlogged soil conditions [36]. It is of note that the colder, wetter conditions of spring also led to decreased legume production by nearly 1000 kg ha−1 in comparison to the previous year. Overall, DM production of legume pastures was substantially lower than both simple and diverse pastures. This is a common instance and can also be observed in other studies comparing different legume mixtures [37] and as cold conditions reduce growth and yield of legumes [38] as well as shade [39]. Along with legumes having difficulty tolerating waterlogging (except balansa clover), legume plants spend a significant amount of energy to fix N rather than increasing yield [40]. In 2022, the legume pastures became heavily intruded by broadleaf weeds, which can be attributed to having less competition with the legumes due to them struggling under the waterlogging conditions, and also the more acidic soil conditions (pH 5.1). Additionally, Campbell and Grice [41] have reported that weed species are strongly competitive for resources, and that the grazing of palatable pasture species reduces competition for the weeds. Reduced competition for weeds due to grazing of palatable species was also observed in the study by Andrew [39]. However, balansa clover tended to perform better than the other clovers in both years and could be attributed to its capability of long-term persistence in pastures [42]. Additionally, it has broad environmental adaptation, and does well in a large range of soil pH, including more acidic soils down to pH 5.0. Lastly, balansa clover does well tolerating waterlogging, and has even been observed to increase root growth in some waterlogging [42,43]. In contrast, birdsfoot trefoil had a minimal appearance in 2021, and had no appearance in 2022 despite it being highly tolerant to waterlogged soil conditions. However, it is highly probable that birdsfoot trefoil was outcompeted by other forage species, due to its typical slow establishment.
In contrast to its success in mixed legume pastures, balansa clover populations in diverse pastures declined dramatically over the two-year grazing study. The decline in balansa clover presence in diverse pastures can be attributed primarily to its poor competitiveness when sown alongside grasses, possibly because of its small seedling size. Associated with grazing management, the regrowth of balansa clover faces significant challenges when there is insufficient space for seeds to germinate in the fall. Ref. [44] reported a substantial decrease in balansa clover seedling populations during the second growing season in tall fescue-based hill country pastures. This drop was attributed to competition with grasses and the smaller seed size of balansa clover in comparison to the initially sown seed size, resulting in a smaller seedling size. Ref. [45] reported similar findings in New Zealand dryland pastures, suggesting that balansa clover might need to be overseeded every three years to keep its populations at desirable levels.

4.2. Livestock Production

Overall, diverse pastures provided a greater LWP (kg ha−1) when compared to simple grass–clover pastures. This was also reported by Andrew [39] in an agrivoltaic pasture system where lambs grazing diverse pastures had a greater LWG than those grazing simple grass pastures. Previous reports from Golding et al. [3] indicated that legumes and pastures containing herbs provide greater feeding values for animals when compared to simple grass pastures. Further, lambs grazing legume pastures had the highest LWG over both simple and diverse pastures in both years, even when the legume pastures had a high percentage of weeds in 2022, which points to selective grazing of the lambs on legume pastures in those weedy conditions. The superior growth of lambs grazing legumes can be attributed to the high voluntary intake of legumes, as well as the high protein content that legumes provide [46]. Similarly, Speijers et al. [47] reported that lambs grazing legume pastures grew faster than those grazing perennial ryegrass pastures and required fewer days to reach the slaughter weight. Similar benefits of legume pastures for promoting greater animal performance were also reported with dairy cows where cows grazing legume pastures provided greater milk yield than grass pastures [48].
Comparing overall lamb performance between both years, 2022 showed a decreased performance both in LWG and LWP. The decreased production in year two can be attributed to fact that lambs were likely spending more energy staying warm in the cold temperatures experienced in year two rather than spending the energy on growing. This was found in a UK-based study where the survival rates of lambs and yearlings were decreased when the weather was colder, and windier, as well as cold weather causing stress to the lambs [49,50]. Another factor the lambs faced in 2022 were higher rates of parasite burdens, likely attributed to the wet conditions of the pastures. Younie et al. [51] discusses that, in northern temperate conditions, larvae and eggs can overwinter in forages and be ingested when grazing occurs at the beginning of the growing season, and typically have a higher incidence in wet conditions.
When looking at parasite loads across all pasture types, the diverse pastures were successful in decreasing parasite loads across both years. The diverse pastures contained chicory which is known for its bioactive compounds and anthelmintic effects on grazing animals. Athanasiadou et al. [52] looked at ewes grazing on grass compared to ewes grazing on chicory and the effects on parasite loads. What they found was those lambs grazing on chicory had a significantly lower fecal egg count, as well as higher liveweight gains than ewes grazing on grass [52]. Ref. [53] also looked into various pasture types consisting of ryegrass only, a ryegrass mix with legumes, and a mix including grasses, clovers, and chicory and plantain, and reported that the ewes and lambs grazing the diverse mix had greater body condition scores and LWG, as well as having a decreased parasite load and requiring less anthelmintics than the ewes and lambs grazing the grasses.

4.3. Bloom Diversity and Bee Visitation

In both years, the legumes were able to provide nectar and pollen for the bees into mid-July. In 2021, there was a greater percentage of legumes throughout the season, whereas in 2022, although there were some legumes, the weeds became more prevalent in the beginning of July in the legume plots. Especially through June, in both the legume plots and the diverse plots, balansa clover was the most prevalent clover available for the bees to forage on. What is of most importance is finding a way to provide forage for bees in the late challenging summer months, where the bees have less forage availability, at a lower quality, and have increased competition for already scarce resources [54]. However, the cool season legumes used here in both the diverse and legume pastures were not effective in providing forage into the late summer months of July and August. This is of particular importance for the pollinator health because if bees can access floral resources from May to October, they will have higher reproductive rates and better winter survival [18,55]. To combat the decline of bee populations, an increase in floral diversity that allows for habitat and forage for the bees is needed. These findings indicate the need for late blooming perennial legumes in dryland pastures for a greater benefit to bees. For instance, a study conducted in Missouri field plots found that birdsfoot trefoil was able to grow and provide forage from early July until October when it was killed by cold frost [56]. Additionally, they found through frequent clipping of the plants that birdsfoot trefoil was able to withstand frequent defoliation, such as would occur from grazing animals [56]. Perhaps, the strategy to provide late summer forage for bees could be achieved through a planting of balansa clover at a low seeding rate, and birdsfoot trefoil paired with a vigorous weed management plan. Balansa clover has already been proven to bloom through spring and into July, and at a low seeding rate would be of minimal competition for the birdsfoot trefoil to establish itself as a summer nectar source. Particularly in the first year of the current study, bloom density was greater in the diverse pastures than the simple ones, where it was found that bee visitation was higher in diverse pastures than simple pastures also. This is similar to a European study on the relationships between bees and floral diversity, where it was reported that increasing habitat richness had a positive effect on both functional diversity and species richness of bees, and that bee functional diversity was also positively affected by species richness and diversity of the plants [57].
Lastly, when looking at the effects of closing dates on bloom density and bee visitations, it seemed as though it did not have much effect. In 2021, there was a brief period of positive effects seen in both bloom density, and bee visitations in legume pastures at the earlier closing date until mid-June. In 2022, the effects of different closing dates had similar results for both bloom density and bee visitations. This could be due to the fact that after year one, the most prevalent clover, balansa clover, had completed its lifecycle and died, thus not regenerating as much for year two. Additionally, closing dates are also important for pasture quality and forage stockpiling. Devantier et al. [58] states that one management tool for increased pasture quality is to use a deferred grazing method, utilizing certain areas of pasture while other areas rest, which additionally allows for the utilization of pasture during grazing time, and maintaining net pasture production over the following seasons. While the current study found an earlier closing date to be beneficial for pollinators in the first year, the study by Devantier et al. [58] on hillside pastures in New Zealand found that earlier closing dates resulted in a decreased pasture quality due to an increase in weeds and reproductive stem material, whereas later closing dates reduced those effects.

4.4. Effect on Closing Date on Regeneration of Annual Legumes

Overall, the earlier closing in pastures resulted in a greater than established number of seedlings in fall and this effect was more profound in simple and diverse pastures. A study on dryland pastures in New Zealand looked at the effect of both stocking rates and closing dates during spring grazing on established subterranean clover seedling numbers the following years [58]. What they found was that earlier closing dates provided greater established seedling numbers in the following years compared to pastures grazed later, and therefore a greater DM production in the fall, and that stocking rate of ewes and lambs had minimal effects. Based on the findings of the current study, in addition to the findings of Ates et al. [26] and Devantier et al. [54], perhaps the most viable option is to choose pasture paddocks with a low annual legume content and close earlier to increase the soil seed bank. However, this option may provide limited benefit to the pollinators if the forb components of pastures are too low (<10%).

5. Conclusions

The findings of this study determined that legume pastures provided the greatest benefit for LWG of grazing animals and floral bloom available for bees, while diverse pastures displayed a greater benefit for LWP. Potentially, legume pastures can only be used for grazing for one to two years before overseeding them with grasses or establishing them at a higher seeding rate and broadcasting seeds between years. Additionally, diversification of the pastures allowed for the utilization of different growing strategies, providing bloom through mid-summer for pollinators, where balansa clover was the most prevalent of legume species in the current study across both years. Lastly, the closing date had minimal effects on bloom density and bee visitations in this study, therefore proposing further research needed in that area, in particular using the perennial forb species with late blooming characteristics.

Author Contributions

Conceptualization, S.A. and A.M.; methodology, S.A. and A.M.; software, S.A.; validation, S.A. and A.M.; formal analysis, S.A. and M.C.; investigation, M.C., D.E.P.-T., S.A.T. and M.S.; resources, S.A. and A.M.; data curation, M.C., S.A.T. and S.A.; writing—original draft preparation, M.C. and S.A.; writing—review and editing, M.C., S.A., D.E.P.-T. and A.M.; visualization, S.A. and M.C.; supervision, S.A. and A.M.; project administration, S.A. and A.M.; funding acquisition, S.A. and A.M. All authors have read and agreed to the published version of the manuscript.

Funding

This research was partly funded by the National Honey Board (6542) and USDA—Natural Resources Conservation Service, grant number NR203A750008G004.

Data Availability Statement

Data are contained within the article.

Acknowledgments

The authors express their appreciation to Jordan Anderson and Alyssa Andrew for helping with fieldwork and undergraduate students for their help with monitoring bee visits and bloom counts.

Conflicts of Interest

The authors declare no conflict of interest.

References

  1. Stampa, E.; Schipmann-Schwarze, C.; Hamm, U. Consumer perceptions, preferences, and behavior regarding pasture-raised livestock products: A review. Food Qual. Prefer. 2020, 82, 103872. [Google Scholar] [CrossRef]
  2. Fraser, T.J.; Rowarth, J.S. Legumes, herbs or grass for lamb performance? Proc. N. Z. Grassl. Assoc. 1996, 58, 49–52. [Google Scholar] [CrossRef]
  3. Golding, K.P.; Wilson, E.D.; Kemp, P.D.; Pain, S.J.; Kenyon, P.R.; Morris, S.T.; Hutton, P.G. Mixed herb and legume pasture improves the growth of lambs post-weaning. Anim. Prod. Sci. 2011, 51, 717–723. [Google Scholar] [CrossRef]
  4. Orford, K.A.; Murray, P.J.; Vaughan, I.P.; Memmott, J. Modest enhancements to conventional grassland diversity improve the provision of pollination services. J. Appl. Ecol. 2016, 53, 906–915. [Google Scholar] [CrossRef] [PubMed]
  5. Wagner, J.; Ghajar, S.; O’rourke, M.; Tracy, B. Bee-Friendly Beef: Developing Biodiverse Pastures to Increase Ecosystem Services. In XXIV International Grassland Congress Proceedings 2021, Nairobi, Kenya, 25–29 October 2021; University of Kentucky: Lexington, KY, USA, 2021; pp. 1–5. [Google Scholar]
  6. USDA. National Agricultural Statistics Service. 2020. Available online: https://www.nass.usda.gov/Statistics_by_State/Idaho/Publications/Livestock_Press_Releases (accessed on 1 June 2023).
  7. Idaho Data and Statistics. 2020. Available online: https://farmlandinfo.org/statistics/idaho-statistics/ (accessed on 1 June 2023).
  8. Oregon Data and Statistics. FIC. 2020. Available online: https://farmlandinfo.org/statistics/oregon-statistics/ (accessed on 1 June 2023).
  9. Washington Data and Statistics. FIC. 2020. Available online: https://farmlandinfo.org/statistics/washington-statistics/ (accessed on 1 June 2023).
  10. Stephen, W.P.; Bohart, G.E.; Torchio, P.F. The Biology and External Morphology of Bees with a Synopsis of the Genera of North-Western America; Oregon State University Agriculture Extension Station: Corvallis, OR, USA, 1969. [Google Scholar]
  11. Broussard, M.; Rao, S.; Stephen, W.P.; White, L. Native bees, honeybees, and pollination in Oregon cranberries. HortScience 2011, 46, 885–888. [Google Scholar] [CrossRef]
  12. Calderone, N.W. Insect pollinated crops, insect pollinators and US agriculture: Trend analysis of aggregate data for the period 1992–2009. PLoS ONE 2012, 7, e37235. [Google Scholar] [CrossRef]
  13. Rao, S.; Stephen, W.P. Bumble bee pollinators in red clover seed production. Crop Sci. 2009, 49, 2207. [Google Scholar] [CrossRef]
  14. Goodrich, B. Economic Outlook for the 2019 Almond Pollination Season. West Coast Nut. 2019. Available online: https://www.wcngg.com/2019/02/05/economic-outlook-for-the-2019-almond-pollination-season/ (accessed on 1 June 2023).
  15. Otto, C.R.; Zheng, H.; Gallant, A.L.; Iovanna, R.; Carlson, B.L.; Smart, M.D.; Hyberg, S. Past role and future outlook of the Conservation Reserve Program for supporting Honey Bees in the Great Plains. Proc. Natl. Acad. Sci. USA 2018, 115, 7629–7634. [Google Scholar] [CrossRef]
  16. Switanek, M.; Crailsheim, K.; Truhetz, H.; Brodschneider, R. Modelling seasonal effects of temperature and precipitation on honey bee winter mortality in a temperate climate. Sci. Total Environ. 2017, 579, 1581–1587. [Google Scholar] [CrossRef]
  17. Thomson, D.M. Local bumble bee decline linked to recovery of honey bees, drought effects on floral resources. Ecol. Lett. 2016, 19, 1247–1255. [Google Scholar] [CrossRef] [PubMed]
  18. Ricigliano, V.A.; Mott, B.M.; Maes, P.W.; Floyd, A.S.; Fitz, W.; Copeland, D.C.; Meikle, W.G.; Anderson, K.E. Honey bee colony performance and health are enhanced by apiary proximity to US Conservation Reserve Program (CRP) lands. Sci. Rep. 2019, 9, 4894. [Google Scholar] [CrossRef] [PubMed]
  19. Shuler, R.E.; Roulston, T.H.; Farris, G.E. Farming practices influence wild pollinator populations on squash and pumpkin. J. Econ. Entomol. 2005, 98, 790–795. [Google Scholar] [CrossRef] [PubMed]
  20. Decourtye, A.; Mader, E.; Desneux, N. Landscape enhancement of floral resources for honey bees in agro-ecosystems. Apidologie 2010, 41, 264–277. [Google Scholar] [CrossRef]
  21. Seeno, E.; MacAdam, J.W.; Melathopoulos, A.; Filley, S.J.; Ates, S. Management of perennial forbs sown with or without self-regenerating annual clovers for forage and nectar sources in a low-input dryland production system. Grass Forage Sci. 2023, in press. [Google Scholar] [CrossRef]
  22. Moot, D.J.; Smith, M.C.; Mills, A. Liveweight production, dry matter yield and seasonal composition from dryland lucerne and lucerne/grass mixes over five years. N. Z. J. Agric. 2020, 63, 272–300. [Google Scholar] [CrossRef]
  23. Kohler, F.; Verhulst, J.; Van Klink, R.; Kleijn, D. At what spatial scale do high-quality habitats enhance the diversity of forbs and pollinators in intensively farmed landscapes? J. Appl. Ecol. 2008, 45, 753–762. [Google Scholar] [CrossRef]
  24. Kimoto, C.; DeBano, S.J.; Thorp, R.W.; Taylor, R.V.; Schmalz, H.; DelCurto, T.; Johnson, T.; Kennedy, P.L.; Rao, S. Short-term responses of native bees to livestock and implications for managing ecosystem services in grasslands. Ecosphere 2012, 3, 1–19. [Google Scholar] [CrossRef]
  25. Lazaro, A.; Tscheulin, T.; Devalez, J.; Nakas, G.; Petanidou, T. Effects of grazing intensity on pollinator abundance and diversity, and on pollination services. Ecol. Entomol. 2016, 41, 400–412. [Google Scholar] [CrossRef]
  26. Ates, S.; Lucas, R.J.; Edwards, G.R. Effects of stocking rate and closing date on subterranean clover populations and dry matter production in dryland sheep pastures. N. Z. J. Agric 2013, 56, 22–36. [Google Scholar] [CrossRef]
  27. Macfarlane, M.J.; Crofoot, E.W.; Muir, P.D. Effects of closing date on seeding and hardseededness of balansa, gland, Persian and arrowleaf clovers on East Coast dryland. J. N. Z. Grassl. 2015, 77, 219–226. [Google Scholar] [CrossRef]
  28. USDA Web Soil Survey. 2022. Available online: https://websoilsurvey.sc.egov.usda.gov/App/WebSoilSurvey.aspx (accessed on 1 June 2023).
  29. Bransby, D.I. Compromises in the design and conduct of grazing experiments. Grazing Res. Des. Methodol. Anal. 1989, 16, 53–67. [Google Scholar]
  30. AOAC. Official Methods of Analysis of AOAC International, 20th ed.; AOAC International: Gaithersburg, MD, USA, 2016. [Google Scholar]
  31. Van Soest, P.J.; Robertson, J.B.; Lewis, B.A. Methods for dietary fiber, neutral detergent fiber, and nonstarch polysaccharides in relation to animal nutrition. J. Dairy Sci. 1991, 74, 3583–3597. [Google Scholar] [CrossRef] [PubMed]
  32. Westphal, C.; Bommarco, R.; Carré, G.; Lamborn, E.; Morison, N.; Petanidou, T.; Potts, S.G.; Roberts, S.P.; Szentgyörgyi, H.; Tscheulin, T.; et al. Measuring bee diversity in different European habitats and biogeographical regions. Ecol. Monogr. 2008, 78, 653–671. [Google Scholar] [CrossRef]
  33. Woodward, S.L.; Waugh, C.D.; Roach, C.G.; Fynn, D.; Phillips, J. Are diverse species mixtures better pastures for dairy farming? Proc. N. Z. Grassl. Assoc. 2013, 75, 79–84. [Google Scholar] [CrossRef]
  34. Daly, M.J.; Hunter, R.M.; Green, G.N.; Hunt, L. A comparison of multi-species pasture with ryegrass-white clover pasture under dryland conditions. Proc. N. Z. Grassl. Assoc. 1996, 58, 53–58. [Google Scholar] [CrossRef]
  35. Black, A.D.; Anderson, S.; Dalgety, S.K. Identification of pasture mixtures that maximize dry matter yield. J. N. Z. Grassl. 2017, 79, 103–109. [Google Scholar] [CrossRef]
  36. Li, G.D.; Kemp, P.D. Forage chicory Cichorium intybus L.: A review of its agronomy and animal production. Adv. Agron. 2005, 88, 187–222. [Google Scholar]
  37. Tejera, M.; Speranza, P.; Astigarraga, L.; Picasso, V. Forage biomass, soil cover, stability, and competition in perennial grass–legume pastures with different P aspalum species. Grass Forage Sci. 2016, 71, 575–583. [Google Scholar] [CrossRef]
  38. Thurston, C.L.; Grossman, J.M.; Fudge, R.; Maul, J.E.; Mirsky, S.; Wiering, N. Cold stress reduces nodulation and symbiotic nitrogen fixation in winter annual legume cover crops. Plant Soil 2022, 481, 661–676. [Google Scholar] [CrossRef]
  39. Andrew, A.C. Lamb Growth and Seasonal Herbage Production from Simple, Diverse, and Legume Pastures in an Agrivoltaic System. Master’s Thesis, Oregon State University, Corvallis, OR, USA, 2022. [Google Scholar]
  40. Lindemann, W.C.; Clover, C.R. Nitrogen Fixation by Legumes. Available online: https://pubs.nmsu.edu/_a/A129/ (accessed on 1 June 2023).
  41. Campbell, S.D.; Grice, A.C. Weed biology: A foundation for weed management. Trop. Grassl. 2000, 34, 271–279. [Google Scholar]
  42. Craig, A.D.; Ballard, R.A. Balansa clover (Trifolium michelianum)—A forage legume for temperate pastures. Cah. Options Mediterr. 2000, 45, 177–180. [Google Scholar]
  43. Rogers, M.E.; West, D. The effects of root zone salinity and hypoxia on shoot and root growth in Trifolium species. Ann. Bot. 1993, 72, 503–509. [Google Scholar] [CrossRef]
  44. Gultekin, Y.; Filley, S.J.; Smallman, M.A.; Hannaway, D.B.; Ates, S. Pasture production, persistence of legumes and lamb growth in summer-dry hill pastures. Grass Forage Sci. 2021, 76, 159–172. [Google Scholar] [CrossRef]
  45. Monks, D.P.; Moot, D.J.; Smith, M.C.; Lucas, R.J. Grazing management for regeneration of balansa clover in a cocksfoot pasture. Proc. N. Z. Grassl. Assoc. 2008, 70, 233–238. [Google Scholar] [CrossRef]
  46. Phelan, A.P.; Moloney, E.J.; McGeough, J.; Humphreys, J.; Bertilsson, E.G.; O’Kiely, P. Forage Legumes for Grazing and Conserving in Ruminant Production Systems. Crit. Rev. Plant Sci. 2015, 34, 281–326. [Google Scholar] [CrossRef]
  47. Speijers, M.H.M.; Fraser, M.D.; Theobald, V.J.; Haresign, W. The effects of grazing forage legumes on the performance of finishing lambs. J. Agric. Sci. 2004, 142, 483–493. [Google Scholar] [CrossRef]
  48. Wilson, R.L.; Bionaz, M.; MacAdam, J.W.; Beauchemin, K.A.; Naumann, H.D.; Ates, S. Milk production, nitrogen utilization, and methane emissions of dairy cows grazing grass, forb, and legume-based pastures. J. Anim. Sci. 2020, 98, 220. [Google Scholar] [CrossRef]
  49. Coulson, T.; Catchpole, E.A.; Albon, S.D.; Morgan, B.J.; Pemberton, J.M.; Clutton-Brock, T.H.; Crawley, M.J.; Grenfell, B.T. Age, sex, density, winter weather, and population crashes in Soay Sheep. Science 2001, 292, 1528–1531. [Google Scholar] [CrossRef]
  50. Taylor, M.A. Emerging parasitic diseases of sheep. Vet. Parasitol. 2012, 189, 2–7. [Google Scholar] [CrossRef]
  51. Younie, D.; Thamsborg, S.M.; Ambrosini, F.; Roderick, S. Grassland Management and Parasite Control. In Animal Health and Welfare in Organic Agriculture; CABI Publishing: Wallingford, UK, 2004; pp. 308–328. [Google Scholar]
  52. Athanasiadou, S.; Gray, D.; Younie, D.; Tzamaloukas, O.; Jackson, F.; Kyriazakis, I. The use of chicory for parasite control in organic ewes and their lambs. Parasitology 2007, 134, 299–307. [Google Scholar] [CrossRef]
  53. Grace, C.; Lynch, M.; Sheridan, H.; Lott, S.; Fritch, R.; Boland, T. Grazing multispecies swards improves ewe and lamb performance. Animal 2019, 13, 1721–1729. [Google Scholar] [CrossRef] [PubMed]
  54. Couvillon, M.J.; Riddell Pearce, F.C.; Accleton, C.; Fensome, K.A.; Quah, S.K.; Taylor, E.L.; Ratnieks, F.L. Honey bee foraging distance depends on month and forage type. Apidologie 2015, 46, 61–70. [Google Scholar] [CrossRef]
  55. Quinlan, G.M.; Milbrath, M.O.; Otto, C.R.V.; Isaacs, R. Farmland in U.S. conservation reserve program has unique floral composition that promotes bee summer foraging. Basic Appl. Ecol. 2021, 56, 358–368. [Google Scholar] [CrossRef]
  56. Kallenbach, R.L.; McGraw, R.L.; Beuselinck, P.R.; Roberts, C.A. Summer and Autumn Growth of Rhizomatous Birdsfoot Trefoil. Crop Sci. 2001, 41, 149–156. [Google Scholar] [CrossRef]
  57. Papanikolaou, A.D.; Kühn, I.; Frenzel, M.; Schweiger, O. Semi-natural habitats mitigate the effects of temperature rise on wild bees. J. Appl. Ecol. 2017, 54, 527–536. [Google Scholar] [CrossRef]
  58. Devantier, B.P.; Stevens, D.; Rennie, G.M.; Tozer, K. The effect of deferred grazing in spring and early summer pastures on pasture growth rate and feed quality. J. N. Z. Grassl. 2017, 79, 189–196. [Google Scholar] [CrossRef]
Figure 1. Total annual accumulated dry matter (DM) production (a) (t ha−1 y−1) and herbage growth rates (b) (kg ha−1 d−1) for simple, diverse and legume pastures from 2010 to 2022. Bars represent standard error mean (SEM). Different letters show significant differences among pasture treatments (p < 0.05) (a). * = when ANOVA was significant (p < 0.05) (b).
Agronomy 14 00024 g001
Figure 2. Botanical composition (%) of pastures showing contributions from (a) legumes, (b) total forbs (legumes + herbs), (c) sown grasses, (d) weeds and (e) dead material in simple, diverse and legume pastures from 2021 to 2022. Error bars represent maximum SEM.
Agronomy 14 00024 g002
Figure 3. Pre-grazing pasture mass (a,b) and forb (legume + herb) content (c,d) and total digestible nutrients (TDN) (e,f) of pasture on offer in three rotations in spring 2021 and 2022. Error bars represent SEM.
Agronomy 14 00024 g003
Figure 4. Bloom density as affected by pasture type (a,c) and closing date (b,d) (CD). Bars represent SEM for pasture × closing date × period interaction.
Agronomy 14 00024 g004
Figure 5. Honey bee visits as affected by pasture type (a,c) and closing date (b,d) (CD; (b,d)). Bars represent SEM for pasture × closing date × period interaction.
Agronomy 14 00024 g005
Figure 6. Bloom composition (%) of legume (a,d), diverse (b) and simple pastures (c). Bloom composition was only monitored in legume pastures in 2022. B. weeds = broadleaved weeds; BFT = birdsfoot trefoil.
Agronomy 14 00024 g006
Table 1. Monthly rainfall and mean daily air temperatures over two growing seasons.
MonthsAir Temperature (°C)Rainfall (mm)
2020/20212021/2022LTM *2020/20212021/2022LTM *
September17.917.416.8507234
October12.411.311.9467081
November6.89.36.7181127174
December5.54.84.5180269194
January6.14.44.7211119160
February5.55.06.216039133
March6.78.68.255111111
April10.98.010.11314679
May13.312.013.12211360
June19.316.716.1446036
July21.1-19.30-14
August20.8-19.40-13
* LTM: Long-term means of air temperature and rainfall are for the period 1997–2018.
Table 2. Species grown in each treatment type and seeding rates used (kg ha−1) in the experiment.
SpeciesScientific NamesVarietySowing Rate kg ha−1
SimpleDiverseLegume
Perennial Ryegrass (G)Lolium perenneAlbion1510
Festulolium (G)FestuloliumPerseus55
Orchard Grass (G)Dactylis glomerataQuickdraw53
White Clover (L)Trifolium repensDomino423
Subterranean Clover (L)Trifolium subterraneumCampeda and
Denmark
201010
Red Clover (L)Trifolium pratenseDynamite 3
Balansa Clover (L)Trifolium michelianum SaviParadana 22
Berseem Clover (L)Trifolium alexandrinumFrosty 25
Birdsfoot Trefoil (L)Lotus corniculatusBruce 53.5
Bigleaf Trefoil (L)Lotus pedunculatusNot Specified 3.5
White Sweet CloverMelilotus albaHubam 1
Chicory (H)Cichorium intybusAntler 2
Plantain (H)Plantago lanceolataBoston 4
Yarrow (H)Achillea millefoliumNot Specified 0.2
Phacelia (H)Phacelia tanacetifoliaAngelia 1
TOTAL 4946.231
G = Grass; L = Legume; H = Herbs.
Table 3. Mean liveweight gain (g hd−1 d−1) and production (kg ha−1 d−1) of lambs from simple, diverse and legume pastures over three grazing periods in 2021 and two grazing periods in 2022.
YearPeriodSimpleDiverseLegumeSEMp
Liveweight gain (g hd−1 d−1)
12–27 April220235-6.30.19
202127 April–10 May22425231621.40.05
10 May–8 June172 b174 b259 a14.30.01
202228 March–6 May181 c220 b291 a10.60.01
6 May–16 June827914021.60.15
Liveweight production (kg ha−1 d−1)
12–27 April11.912.7-0.350.19
202127 April–10 May12.113.612.11.660.76
10 May–8 June9.39.49.90.800.83
202228 March–6 May11.013.911.81.090.24
6 May–16 June5.05.04.00.960.69
Total liveweight production (kg ha−1)
202112 April–8 June666 b704 a446 c38.70.01
202228 March–16 June62874558158.70.20
LWG = liveweight gain; LWP = Liveweight production (kg/hectare/day) LWG × stocking rate (number of animals per hectare); Total LWP = LWP × grazing duration (days); Different letters within rows show significant differences (p < 0.05). SEM = Standard error of means.
Table 4. Total egg counts (Strongyle) of lambs grazing simple, diverse and legume pastures in spring 2021 and in 2022.
DatesDiverseSimpleLegumeSEMp
12 April 202121228812991.90.51
6 June 20219213811529.60.58
28 March 20226221030331285.50.29
18 June 2022289 a1247 b621 ab197.20.05
Different letters within rows show significant differences (p < 0.05).
Table 5. Effects of closing dates on seedling numbers (plant m2) of subterranean and balansa clover in subsequent fall 2021 and in 2022.
Subterranean Clover
YearClosing DateSimpleDiverseLegumeSEMp Values 1
TRTCDTRT × CD
12–14 May 558217500
202126–28 May 1142425650128.40.010.01 0.43
8 June 908500617
27 May 250300313
20226 June 13118820669.90.230.050.54
16 June 15050269
Balansa Clover
12–14 May -1672300
202126–28 May -1252531215.30.010.900.80
8 June -1962406
27 May - 413
20226 June - 45697.5 0.93
16 June - 456
1 TRT = Treatments; SEM = Standard error of means; CD = Closing dates.
Disclaimer/Publisher’s Note: The statements, opinions and data contained in all publications are solely those of the individual author(s) and contributor(s) and not of MDPI and/or the editor(s). MDPI and/or the editor(s) disclaim responsibility for any injury to people or property resulting from any ideas, methods, instructions or products referred to in the content.

