Article

Agronomic and Phytochemical Characterization of Chickpea Local Genetic Resources for the Agroecological Transition and Sustainable Food Systems

by
Lara Abou Chehade
1,2,
Silvia Tavarini
2,3,*,
Maria Francesca Bozzini
2,
Gilbert Koskey
4,
Lisa Caturegli
2,
Daniele Antichi
2 and
Luciana G. Angelini
2,3
1
CMCC Foundation-Euro-Mediterranean Center on Climate Change, Via Enrico de Nicola 9, 07100 Sassari, Italy
2
Department of Agriculture, Food and Environment, University of Pisa, Via del Borghetto 80, 56124 Pisa, Italy
3
Interdepartmental Research Centre “Nutraceuticals and Food for Health”, University of Pisa, Via del Borghetto 80, 56124 Pisa, Italy
4
Scuola Superiore Sant’ Anna, Center of Plant Sciences, Group of Agroecology, Piazza Martiri della Libertà, 33, 56127 Pisa, Italy
*
Author to whom correspondence should be addressed.
Agronomy 2024, 14(10), 2229; https://doi.org/10.3390/agronomy14102229
Submission received: 31 July 2024 / Revised: 23 September 2024 / Accepted: 24 September 2024 / Published: 27 September 2024
(This article belongs to the Topic Mediterranean Biodiversity)

Abstract

:
Legume crops play a key role in hastening both the agroecological and protein transition and improving the sustainability of cropping systems. Among legumes, chickpea (Cicer arietinum L.) is a valuable source of protein, fibers, and nutraceutical compounds, providing important agri-environmental effects. Nevertheless, few studies have explored the effect of genetic characteristics on production and quality traits in chickpea. Chickpea landraces seem particularly interesting for their positive agronomic and quality characteristics, opening the door for innovation in sustainable food systems. Thus, the present study aimed to characterize two chickpea Tuscan landraces (Rugoso della Maremma and Cappuccio della Valtiberina) in comparison with widely distributed commercial chickpea varieties (Ares, Maragià, Pascià, Principe, Reale, Sultano, and Vittoria). Our findings highlighted positive agronomic traits of landraces in terms of seed yield and yield components, demonstrating performance that is either superior or comparable to commercial varieties. Notably, Cappuccio della Valtiberina showed the highest 1000-seed weight (425.50 g), followed by Maragià (432.92 g), Principe (392.32 g), and Reale (382.79 g), and the highest harvest index (0.55), similar to Reale (0.55). Overall, landraces achieved 18.75% higher yields than commercial varieties. Regarding chickpea quality, landraces exhibited profiles comparable to those of commercial genotypes in terms of protein and oil content, as well as nutraceuticals. Interestingly, the two landraces had the most favorable ω-6/ω-3 ratios (Cappuccio della Valtiberina, 12.45; Rugoso della Maremma, 13.71) among the genotypes except for Maragià (11.78), indicating better nutritional quality compared to commercial varieties (>14.00). These results demonstrated that landraces could offer promising prospects for future chickpea breeding programs, aiding in the selection of genotypes capable of adapting to changing growing conditions and supporting the development of sustainable food systems.

1. Introduction

In recent years, growing attention has been directed towards the environmental impact of animal-based protein production in response to their substantial contribution to greenhouse gas (GHG) emissions, land use and degradation, water use, and nutrient pollution (e.g., acidification and eutrophication) [1]. Within this context, pulses emerge as a promising source of high-quality dietary plant-based proteins, providing a viable alternative to meat yet relatively underutilized [2,3]. Another notable attribute is the lower fat content of pulses. This is related to the growing awareness of consumers towards healthy food, obtained with environmentally friendly production methods, for which they are willing to pay more [4,5,6].
Over time, agronomic research and breeding have paid little attention to legumes, resulting in their current limited distribution. The situation for local legume landraces is even worse, with many varieties facing the threat of extinction. This neglect has posed significant challenges to their cultivation, such as reduced genetic diversity, lower yields, and decreased resilience to pests and diseases. In European countries, for example, these crops occupy a niche of crop rotations, although the situation is slightly better under organic farming [7]. Recently, attempts have been made to define prospects for greater development of legume crops with a view to sustainability. Incorporating legumes into diversified farming systems and crop rotations represents, in fact, a good opportunity for addressing many problems associated with short rotations or monocultures, contributing to improving soil fertility, and pest management while providing market opportunities for farmers and related sectors [8,9,10]. Furthermore, the valorisation of these essential minor crops is foreseen, as pulses play a key role in the farm-to-fork (F2F) supply chain and in the EU protein strategy, fully aligning with the sustainable goals of the European Green Deal (EGD) [11], by enhancing biodiversity, agricultural resilience, and climate adaptation in response to environmental challenges [12,13].
Chickpea (Cicer arietinum L.) is currently the world’s third most important pulse, after bean and pea. The global land area devoted to chickpea cultivation covers approximately 14 million hectares, with the majority of production concentrated in India [14]. Chickpea acreage in Italy has declined to less than 3500 hectares, with almost all located in southern regions [15].
From a nutritional point of view, chickpea represents a rich and affordable source of protein, with a high bioavailability, good digestibility, and a suitable balance of amino acids. Chickpea oil content varies from 4% to 10%, with a notable concentration of unsaturated fatty acids, mainly linoleic and oleic. The dry seeds are also a good source of carbohydrates (60–70%), dietary fibers, microelements, and group B vitamins [16].
Moreover, chickpea is characterized by numerous bioactive phytochemicals with beneficial health effects. Among them, phenolic compounds are notably represented by biochanin A and formononetin isoflavones, mainly concentrated in the seed coat, with a proven oxygen radical adsorption capacity and an antiproliferation potential. Chickpea seeds are also rich in carotenoids, including β-carotene, lutein, zeaxanthin, β-cryptoxanthin, lycopene, and α-carotene [17]. In addition, protein hydrolysis has shown a wide range of chickpea polypeptides, exhibiting relevant functional biological effects, such as antioxidant, immune-enhancing, hypoglycaemic, hypotensive, and hypolipidemic properties [18].
However, only a few studies have explored the effect of genetic characteristics on production and quality traits in chickpea. The local chickpea varieties seem particularly interesting for their positive agronomic and quality characteristics, opening the door for innovation in sustainable food systems. These varieties have generally evolved under conditions of low agronomic inputs, and their genetic diversity is extremely useful for a quicker and more adequate response, both to extreme environmental events and changes in selection criteria. This is why they can be effectively employed in organic farming systems [10]. Characterization of these genetic resources and the evaluation of their interaction with agroecological practices are also needed to hasten the agroecological transition. Moreover, identifying and highlighting the quality peculiarities, i.e., biotechnological, nutritional, and organoleptic, of these resources may represent an added value that could respond to market demands and target changing dietary habits.
Therefore, the present study aimed to characterize, from an agronomic (phenological, morphological, and productive traits) and quality (crude protein and oil content, fatty acid composition, and phytochemical characteristics, such as total phenols and antioxidant activity) point of view, two local Tuscan varieties of chickpea (Rugoso della Maremma and Cappuccio della Valtiberina, namely Rugoso and Cappuccio, respectively). The local varieties were compared to common commercial varieties (Ares, Maragià, Pascià, Principe, Reale, Sultano, and Vittoria) in a field experiment carried out under the Mediterranean environment of central Italy.

2. Materials and Methods

2.1. Plant Material, Experimental Setup and Site Characteristics

A field experiment was set up in the 2022 growing season at the Centre for Agri-environmental Research Enrico Avanzi (CiRAA) of the University of Pisa (Pisa, Italy, 43°40′ N; 10°19′ E; 1 m elevation). The area’s climate is typical of the North Mediterranean region, featuring a long-term average annual rainfall of 907 mm, primarily in spring and fall. The yearly average temperature is 15.5 °C.
In the present trial, nine cream-colored Kabuli chickpea genotypes (Table 1) were involved, including seven commercial varieties and two local Tuscan (Italy) genotypes. All genotypes except Sultano, Ares, and Vittoria have rough seed surface texture. The experiment followed a randomized complete block design with three replications. In total, 27 plots were established, each measuring 3 m × 2.5 m (six rows of 2.5 m in length, spaced 50 cm apart).
The chickpea genotypes were sown on 10 March 2022, following mouldboard plowing at 30 cm in February and subsequent seedbed preparation. A target plant density of 33.3 plants m−2 was adopted. The physical and chemical characteristics of the soil, determined on samples collected at a depth of 0–30 cm at the beginning of the experiment, are reported in Table 2. The soil was sandy loam, according to the United States Department of Agriculture (USDA) soil texture classification, with a sub-alkaline reaction, good soil organic matter (SOM) content, and a low level of total nitrogen. Soil pH was determined using a 1:2.5 soil water suspension following the McLean procedure [19]. Electrical conductivity was measured at 20 °C using a GLP-31 Crison conductometer (52.93 electrode) (Montepaone s.r.l., San Mauro Torinese, Torino, Italy). Total nitrogen was assessed using the macro-Kjeldahl digestion procedure [20], nitrate (NO3-N) concentration was determined by ion-exchange chromatography (Dionex ICS 45001; AS4A column), the available phosphorus by colorimetric analysis using the Olsen method [21], and the exchangeable K using the Thomas method [22]. SOM was calculated by multiplying the soil organic carbon concentration, measured using the modified Walkley–Black wet combustion method [23], by 1.724. For the evaluation of active CaCO3, the ammonium oxalate-titration method was used. The cation exchange capacity followed the Mehlich method [24]. The trial was managed following organic farming practices (Regulation (EU) 2018/848). Chickpea genotypes were cultivated in rainfed conditions, and no fertilizers were applied before or during the growing season. Weed control was conducted by two inter-row cultivation interventions during the early growth stages of the plants. Seeds were harvested between 7 and 18 July 2022, when genotypes reached physiological maturity (90% of pods turned yellow).
Temperature and rainfall data for the study period were collected from a meteorological station near the experimental site. Following sowing, the monthly maximum and minimum air temperatures gradually increased (Figure 1), reaching a monthly maximum temperature of 37.7 °C in July. The total rainfall recorded between February and August 2022 was 243.5 mm, with the majority occurring in March and April. July was the driest month, with no rainfall at all.

2.2. Sampling and Measurements

At full maturity (90% of pods have turned golden yellow), ten plants were selected from the two central rows of each plot for morphological and yield component evaluation. For each selected plant, the height of the plant and first pod, the number of primary and secondary branches per plant, the number of pods per plant, and the seed number per pod were determined. Seed production per plant and plant density were assessed within a central area of 1 m2 in each plot.
Subsequently, all plants were separated into different organs (seeds, pods, straw) using a fixed-point thresher to determine the fresh and dry weight (DW). DWs were measured after oven-drying at 60 °C until constant weight.
The thousand-seed weight (TSW) was measured on representative seed samples from each plot following the international rules for seed testing [25]. The Harvest Index (HI) was calculated as the ratio of seed dry weight to the total dry aboveground biomass. The total nitrogen content in chickpea seeds was determined by combustion using an elemental analyzer (Eurovector) and gas chromatography. During the chickpea growing season, key phenological stages were recorded, including the number of days from sowing to emergence, full flowering (when 50% of plants had at least one open flower), and maturity (when 90% of pods have turned golden yellow). Growing degree days (GDD) were afterwards calculated using the following formula:
GDD = ∑(Tm − Tb)
where Tm is the daily average temperature (°C), and Tb is the base temperature for chickpea considered 0 °C, as specified in Rocchetti et al. [26].

2.3. Phytochemical Analyses

2.3.1. Chemicals

Folin–Ciocalteu reagent, sodium carbonate, DPPH (2,2-diphenyl-1-picrylhydrazyl), TPTZ (2,4,6-tri(2-pyridyl)-triazine), ferric chloride, sodium acetate trihydrate, gallic acid monohydrate (3,4,5-trihydroxybenzoic acid), and Trolox (6-hydroxy-2,5,7,8-tetramethylchroman-2-carboxylic acid) were obtained from Sigma-Aldrich Chemical Co. (Milan, Italy). All chemicals and solvents used in the present study were of analytical grade.

2.3.2. Protein, Oil Content, and Fatty Acids Composition

Seed oil and protein contents were evaluated on representative samples from each plot.
Seed oil content was determined following the procedure described by Clemente et al. [27] using a Soxhlet extractor apparatus (mod. R 306) from Behr Labor-Technik (Düsseldorf, Germany). Fatty acid (FA) profiles were determined through direct esterification following the method previously reported by Christie [28]. In summary, internal standard and 3 mL of methanolic HCl (10%) were added to 200 mg of finely ground seeds. After vigorous shaking, the samples were left for incubation at 50 °C overnight. Subsequently, 1 mL of n-hexane and 10 mL of 6% K2CO3 were added, and the mixture was vortexed and centrifuged at 5000 rpm at 4 °C for 10 min. The organic phase was separated, washed, and dried under nitrogen flux before gas chromatography analysis, performed with a GC2010 Shimadzu gas chromatograph (Shimadzu, Columbia, MD, USA) equipped with a flame-ionization detector and a high polar fused-silica capillary column (Chrompack CP-Sil88 Varian, 152 Middelburg, The Netherlands; 100 m, 0.25 mm i.d.; film thickness 0.20 µm). The analytical parameters were set as follows: The initial oven temperature was 40 °C, gradually increasing to 163 °C at a rate of 2 °C min−1, where it was maintained for 10 min. Afterwards, the temperature was raised to 180 °C at 1.5 °C min−1, held for 7 min, followed by an increase to 187 °C at a rate of 2 °C min−1. Finally, the temperature reached 220 °C at a rate of 3 °C min−1, held for 25 min. The injector and detector temperatures were set at 270 °C and 300 °C, respectively, with hydrogen as the carrier gas at 1 mL min−1. The injection volume was 1 µL, with a split ratio of 1:40. Individual FA methyl esters were identified by comparison with a standard mixture of 52 Component FAME Mix (Nu-Chek Prep Inc., Elysian, MN, USA). The FA composition was reported as a relative percentage of the total peak area.
Seed crude protein content was calculated by multiplying the total nitrogen percentage by 6.25.

2.3.3. Sample Extraction and Total Phenolic and Antioxidant Activity Analyses

Chickpea seeds were ground into fine powder, and then a portion of 0.2 g was extracted with 2 mL of 80% (v/v) methanol. The mixture was sonicated for 30 min and centrifuged (135,00 rpm for 10 min). The supernatant was filtered with a syringe filter (Ø 0.45 µm), and the obtained extracts were stored at −20 °C until subsequent analyses.
Total phenols were determined using the Folin–Ciocalteu colorimetric method according to Dewanto et al. [29] and expressed as gallic acid equivalents (mg GAE g−1 DW).
For the investigation of the antioxidant activity, the ferric-reducing antioxidant power of methanolic extracts was determined following Benzie and Strain [30], and the free radical-scavenging activity was evaluated by the DPPH (2,2-diphenyl-1-picrylhydrazil radical) scavenging method, according to Brand-Williams et al. [31]. Trolox was used as a standard for constructing calibration curves, and the antioxidant capacity was expressed as μmol Trolox equivalents (TE) per gram sample DW (μmol TE g−1 DW).
The spectrophotometric assays were carried out by UV–Vis spectrophotometer (Varian Cary 1E, Palo Alto, CA, USA).

2.4. Color Characterization

Chickpea flour color determination was performed by means of a tristimulus colorimeter (Eoptis, Mod. CLM-196 Benchtop, Trento, Italy) according to the CIE L*a*b* color system. A glass cell filled with chickpea flour samples and covered with a white plate was placed above the light source. Chromatic coordinates L*, a*, and b* were determined, indicating lightness, green-red, and blue-yellow components, respectively. The color differences among samples (ΔE*ab) were calculated by applying the following equation:
Δ E ab = Δ L 2 + Δ a 2 + Δ b 2

2.5. Statistical Analysis

Data on chickpea morphological and agronomic traits were checked for normality by the Shapiro-Wilk test and heteroskedasticity by Levene’s test before analysis. If the assumptions of linear mixed models were violated, data were fit to generalized linear mixed models with the best-fit family and link function (verified visually and with Akaike information criterion). Genotype was considered a fixed factor and block as a random one in the models fitted. Tukey’s test at p < 0.05 was used to determine significant differences among predicted trait means of the genotypes. T-tests at p < 0.05 compared the marginal means between commercial and local genotypes. Pearson’s correlation coefficient and statistical significance were calculated to trace the relationship between the yield and yield component variables.
Concerning the phytochemical analyses and the color determination, a one-way ANOVA was performed using the JMP® Pro 17.0.0 software package (SAS Institute, Cary, NC, USA). Averages were separated by Tukey’s post hoc test. p < 0.05 was used to assess significant differences between means. The fatty acid composition data were analyzed using multivariate statistical techniques, namely principal component analysis (PCA) and hierarchical cluster analysis (HCA). The PCA was conducted on the covariance matrix (dimension 9 × 23), selecting the two highest PCs derived from the linear regressions, accounting for a total explained variance of 84.1%. HCA was carried out using Ward’s method, with squared Euclidean distances as the measure of similarity.

3. Results and Discussion

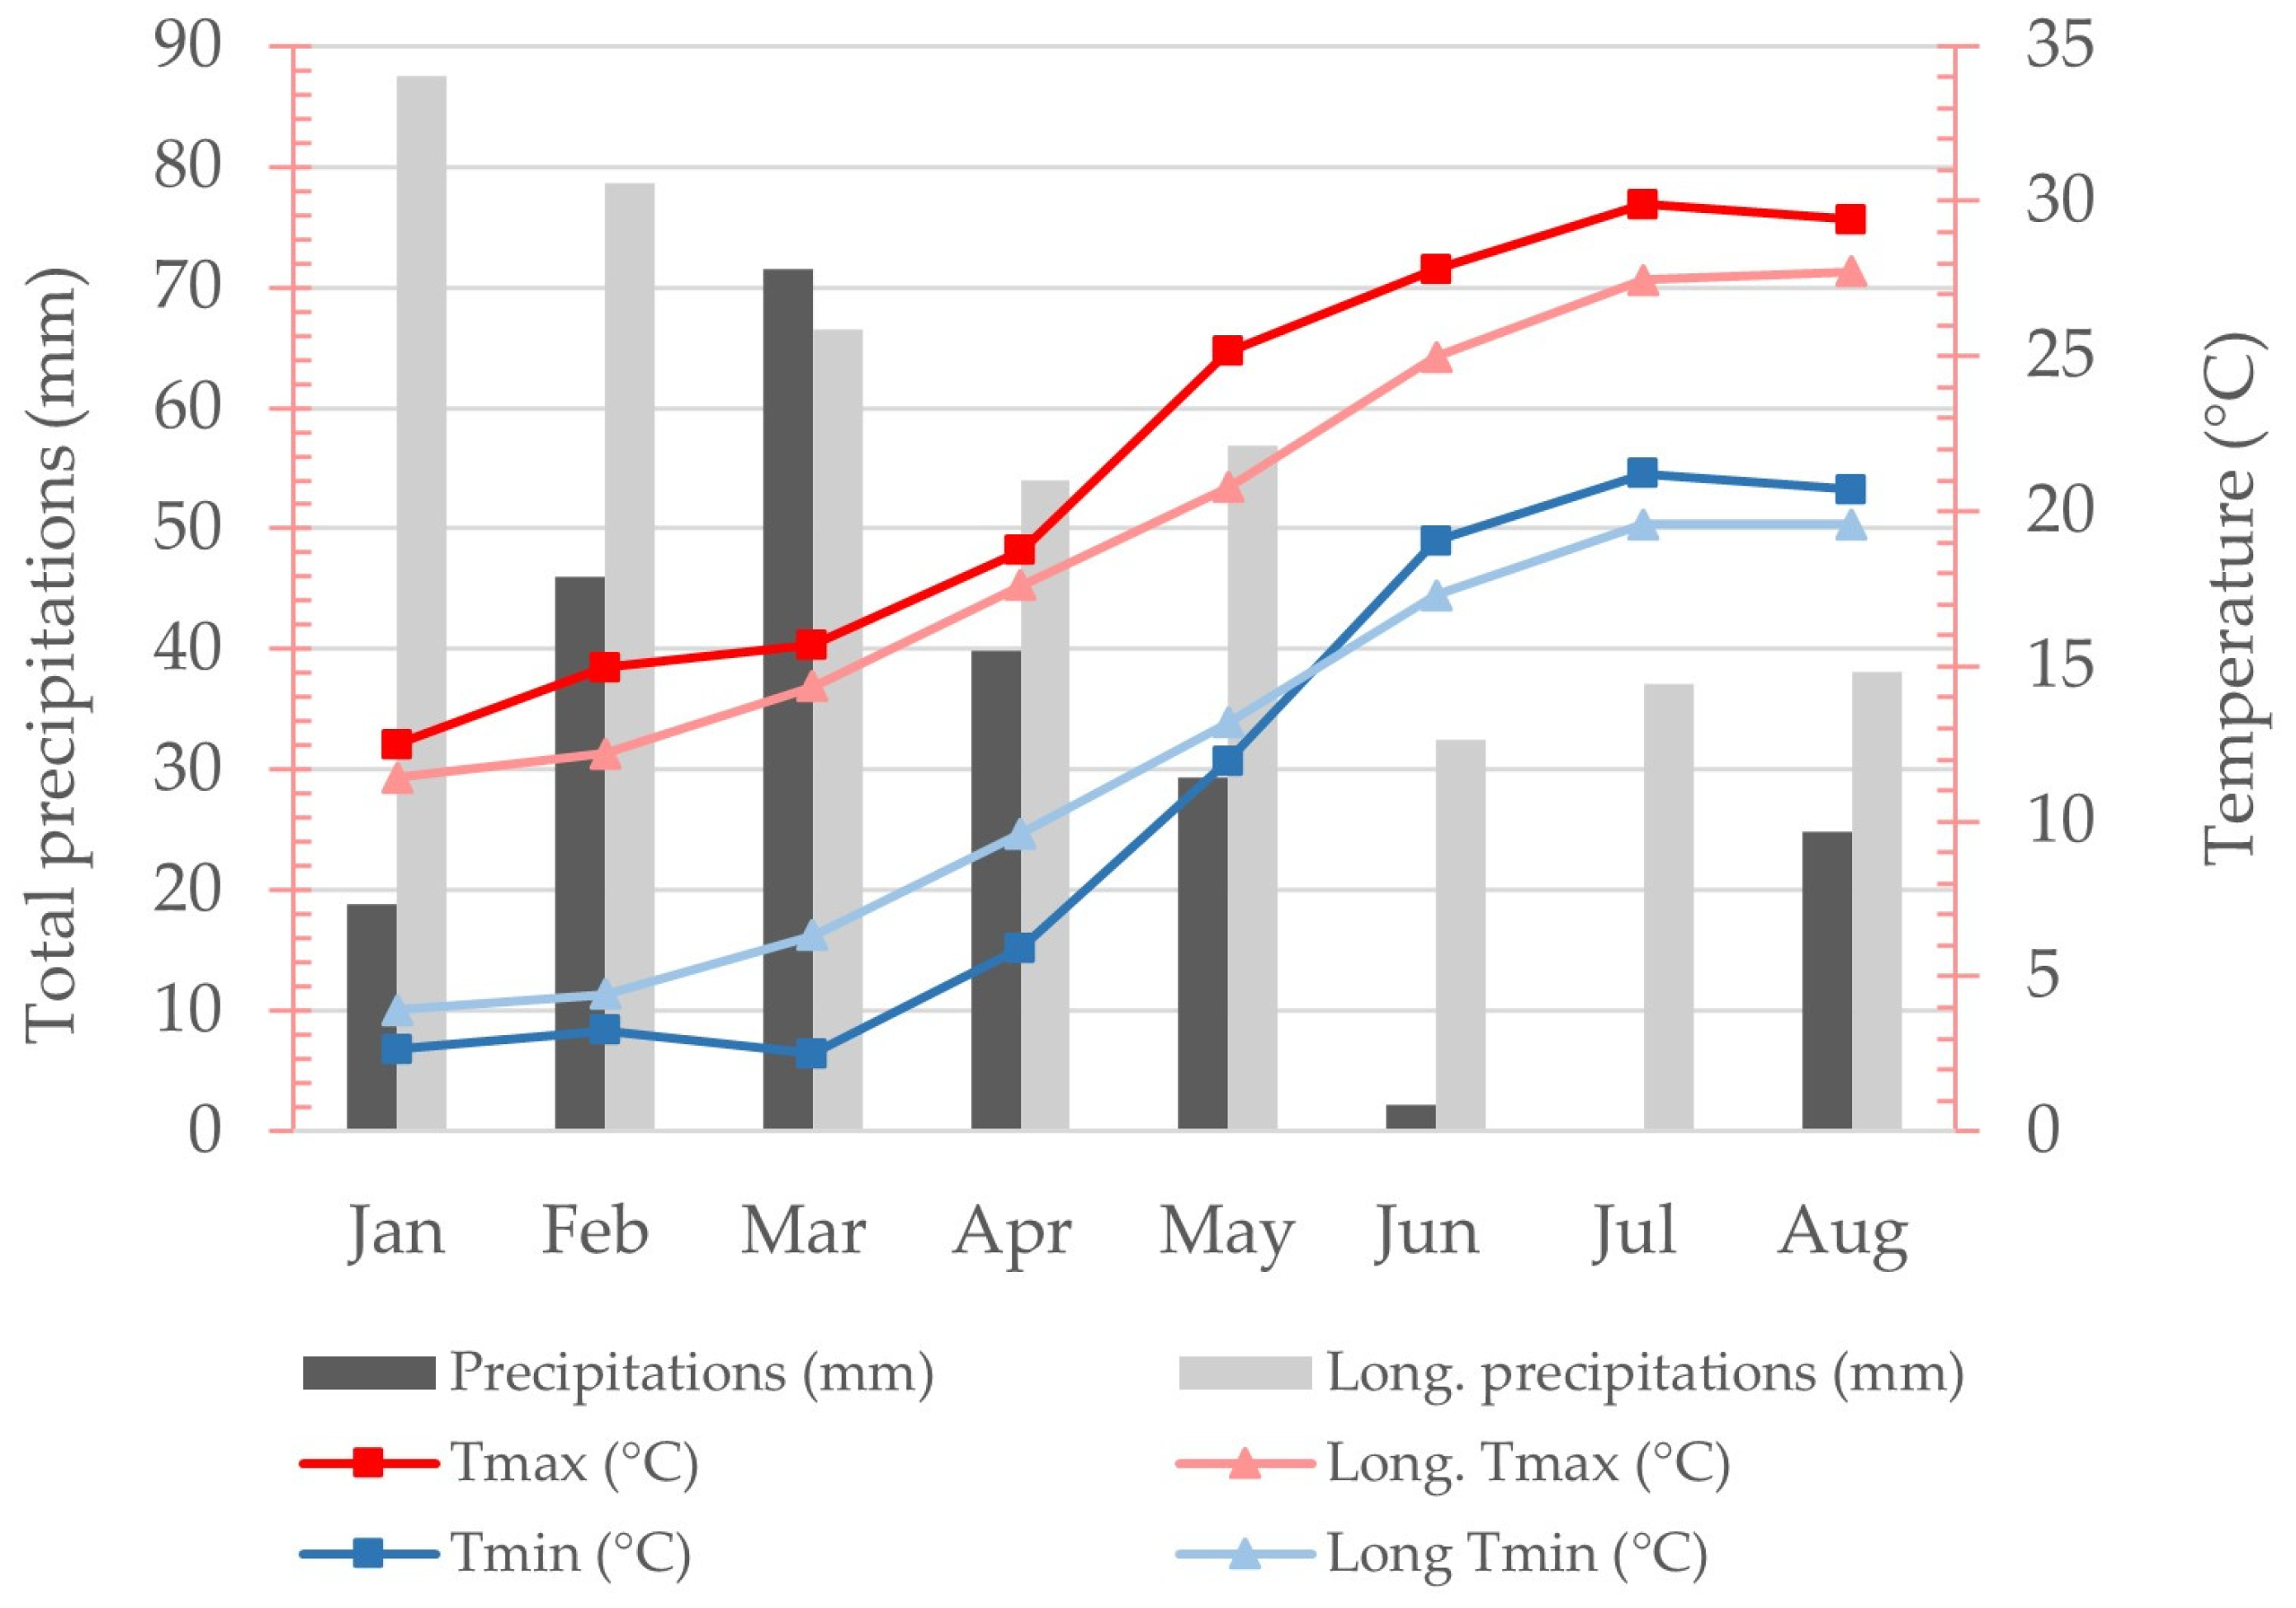
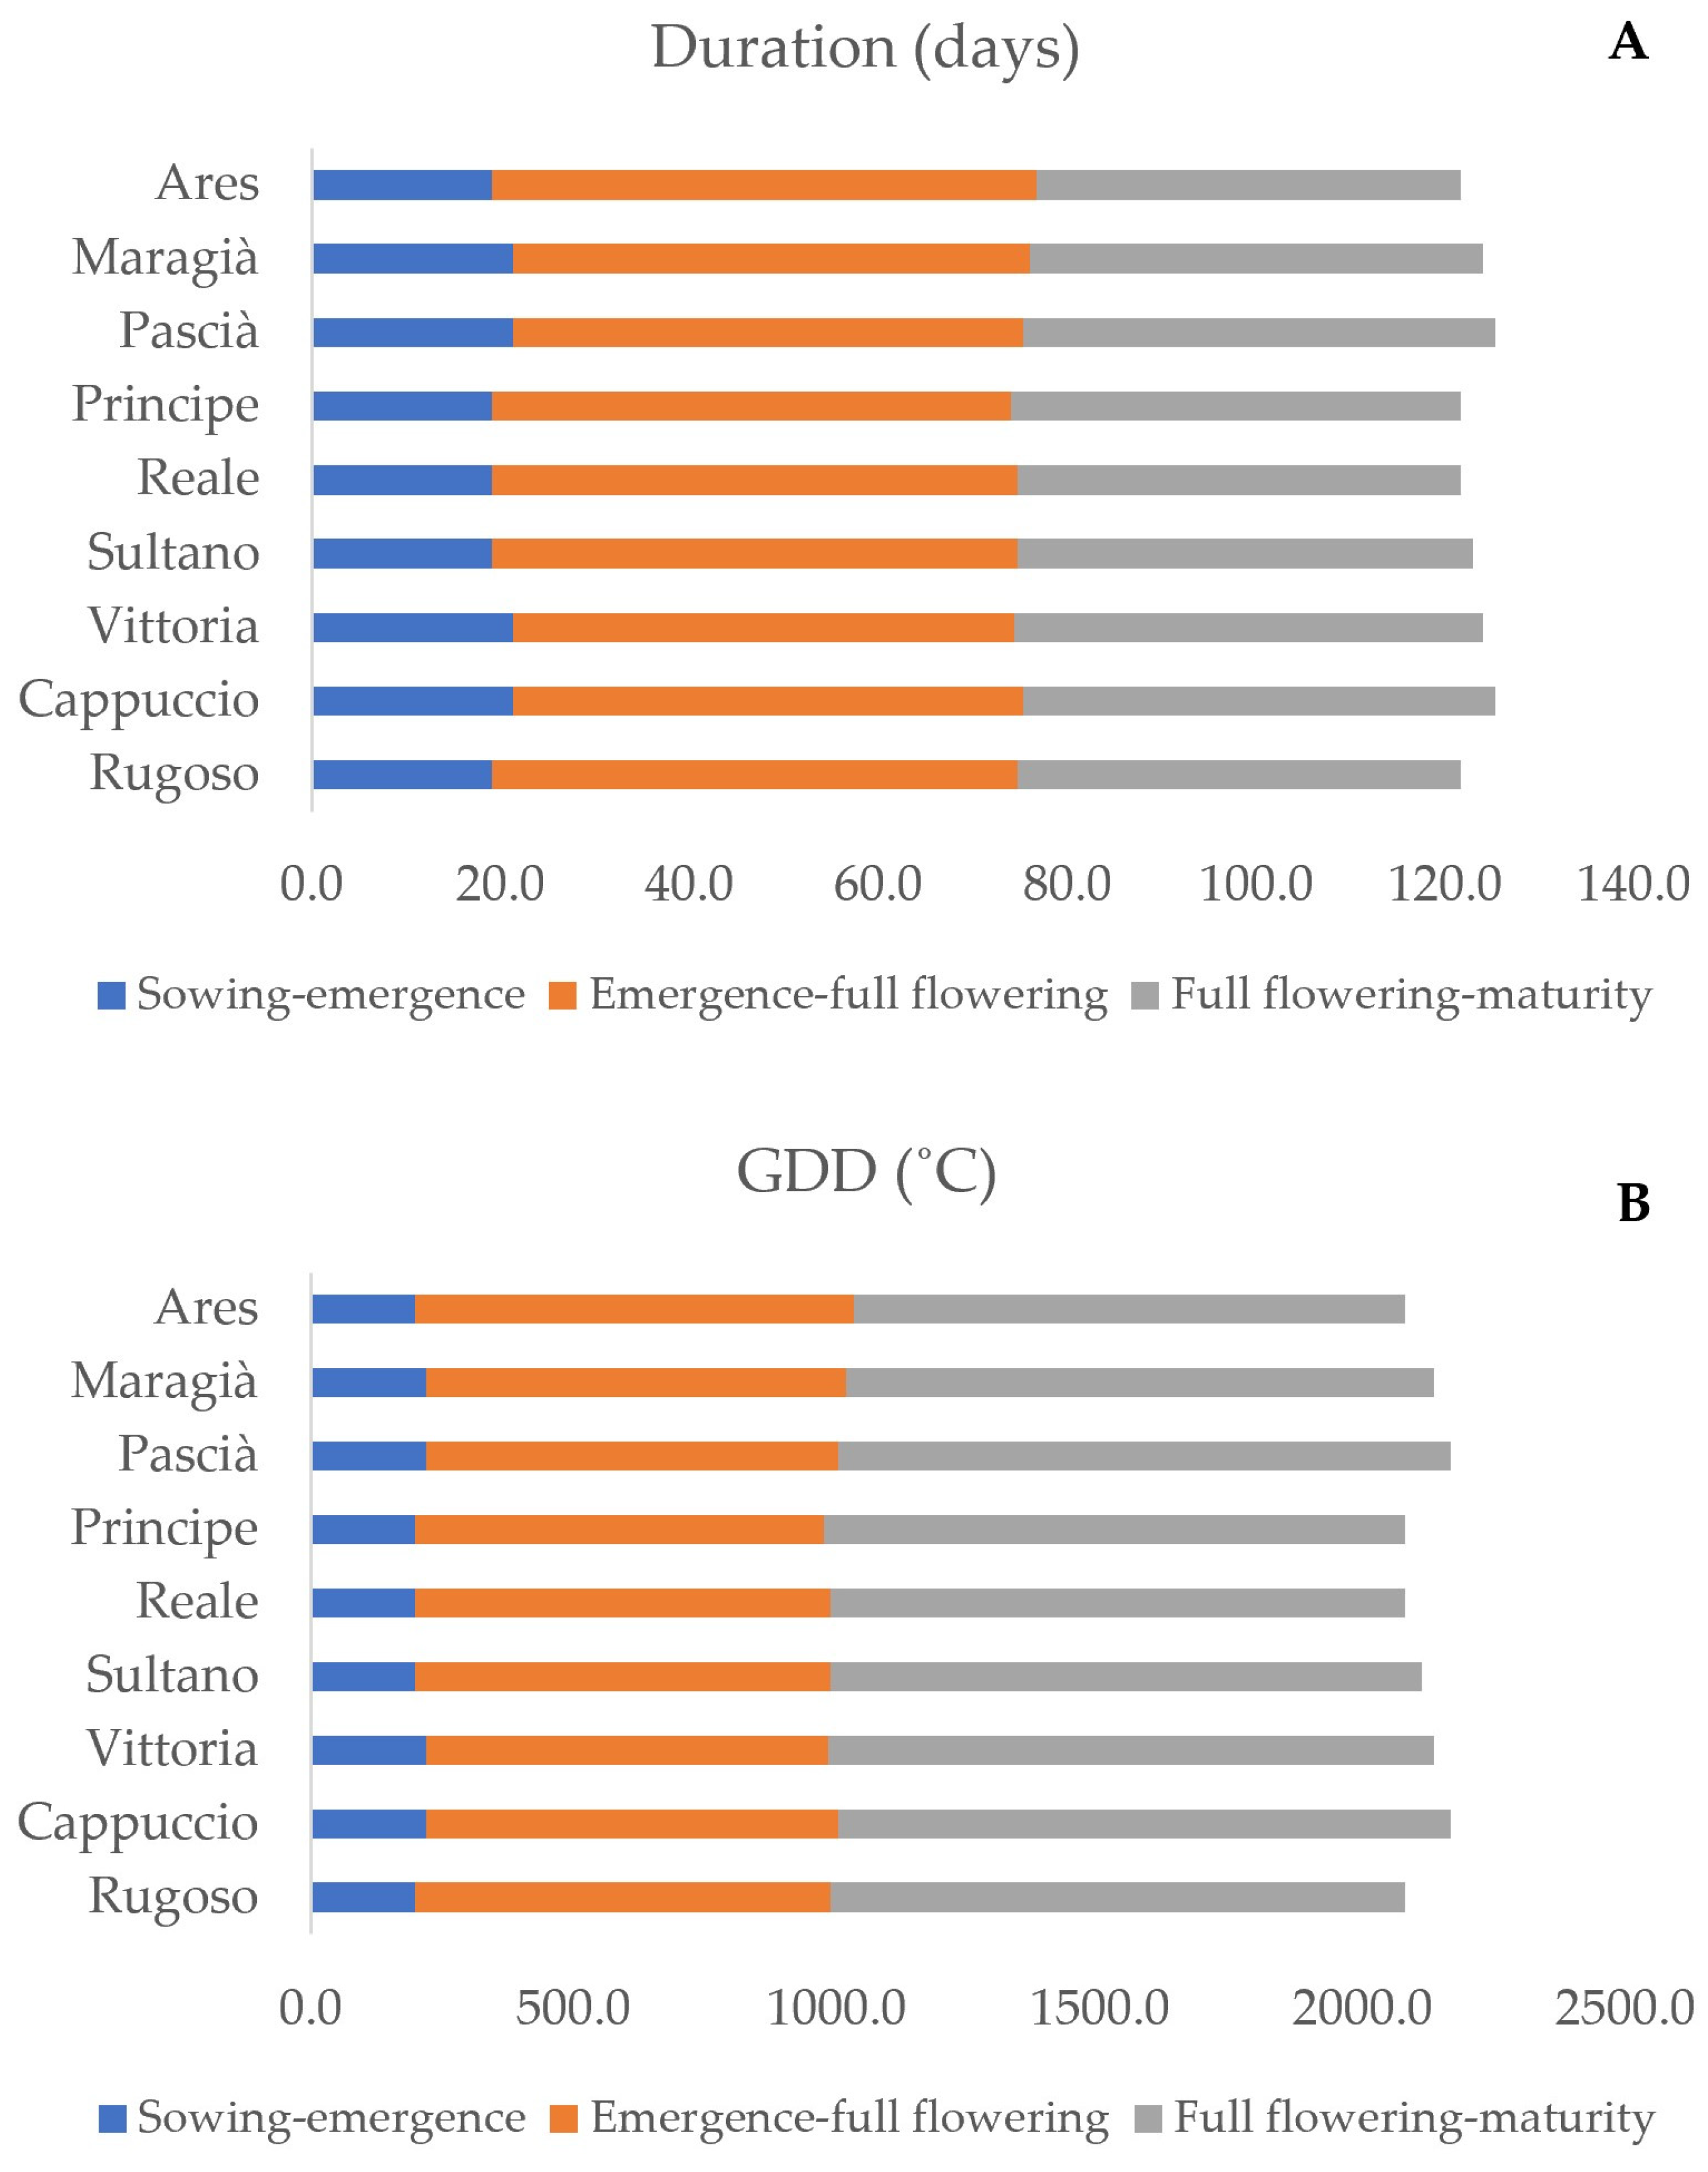
3.1. Weather and Plant Phenology

Hotter weather characterized the crop-growing season compared to the long-term trend, especially from May to July 2022 (from chickpea flowering to harvest) (Figure 1). In addition, drier conditions occurred before the chickpea cycle (from the end of March till May 2022) compared to the long-term trend. No considerable variability was observed among the chickpea genotypes regarding crop developmental stages (Figure 2). Plant emergence was characterized by a dry period and required 19–21 days from sowing time. The genotypes required between 74 and 77 days to reach full flowering and 122 and 125 days to complete their growing cycle (Figure 2A). Accordingly, the thermal time needed for the genotypes ranged between 975.1 and 1031.5 °C and between 2081.7 and 2167.4 °C for full flowering and seed maturity, respectively (Figure 2B). These results are generally in line with those reported by other studies conducted on spring-sown chickpea in Mediterranean conditions, despite some differences related to genotypes, pedoclimatic conditions, and biotic or abiotic stresses like heat stress and moisture availability [32,33].

3.2. Yield and Yield Components

Morphological and agronomic characteristics of the nine chickpea genotypes investigated are reported in Table 3. Plant height ranged from 45.85 cm in Pascià to 54.40 cm in Ares. However, pairwise comparisons did not return any significant differences among the heights of the genotypes. All the chickpea genotypes in our study grew well despite being exposed to dry and hot conditions during the season. The landraces were among the shortest genotypes, reaching almost 47 cm in height. Similar trends were observed with the height of the first pod, a key indicator for mechanical harvesting. An average bottom pod height above 27 cm was observed in landraces, suggesting that these genotypes might be suitable for mechanized combine harvest.
The findings revealed the impact of genetic variability on the plant components. Ares was observed to be the highest branching genotype (10.37) and with the highest number of pods per plant (38.36), but with one of the lowest plant densities (27.55) in the field. Conversely, the genotype Reale had the fewest secondary branches (4.74) and the least number of pods per plant (21.55). Local genotypes, Cappuccio and Rugoso, had fair to high secondary branching (6.53 and 8.15, respectively) and numbers of pods per plant (30.50 and 29.06, respectively), along with potentially greater plant densities (33.86 and 36.51, respectively) at harvest compared to the other genotypes. Genotypic differences were marked for the thousand-seed weight. Maragià, Cappuccio della Valtiberina, Pascià, Principe, and Reale are large to medium-seeded genotypes (432.92 to 382.79 g TSW). In contrast, Vittoria, Sultano, Areas, and Rugoso della Maremma are relatively small-seeded genotypes (331.57 to 271.27 g TSW).
The production per plant was statistically invariable between genotypes. However, the results indicated a tendency for greater production per plant in the landrace Cappuccio della Valtiberina (10.49 g plant−1) and the commercial genotype Pascià (10.72 g plant−1) compared to the other genotypes. The least productive genotype was observed to be Sultano (6.48 g plant−1). Likewise, there was no significant difference in seed yields among the individual genotypes, which ranged from 292.83 to 219.40 g m−2. Nevertheless, when the genotypes were grouped into local and commercial varieties, an overall yield advantage of approximately 18.75% for landraces was noticed. Our results are higher than those reported on the yield of spring-sown chickpea in Central and South Italy [32,34] and sometimes that of winter-sown [32]. This makes most of the genotypes suitable and well-performing for spring sowing in the pedo-climatic conditions of coastal Tuscany if frost damage is to be avoided.
The HI, a proxy of the plant capacity of allocating biomass from source organs into sink organs, was relatively high and ranged between a minimum of 0.50 for Rugoso and Sultano and a maximum of 0.55 for Reale and Cappuccio. The harvest indices of the genotypes were generally in the range reported in the literature [32,33]. Differential responses in the HI can be related to environmental and genetic factors. Delayed sowing, for instance, can increase the remobilization and partitioning of photoassimilates into the developing grain [35]. Unfavorable conditions during the reproductive phase of the crop, like heat or moisture stress, might stimulate dry matter translocation to the seed [33,36]. Dry matter translocation is an adaptation mechanism and can be superior in local genotypes (although not verified in our case), which are selected under the local pedo-climatic conditions [33].
Pearson’s correlation analysis between the plant production and yield components of the nine chickpea genotypes was conducted to point out the main drivers of chickpea production. No particular relationships were noticed when the grouped genotypes (local vs. commercial) were analyzed separately. The correlation analysis performed on the nine genotypes is presented in Table 4. As the results show, plant seed production seems highly correlated to the number of pods (r = 0.71, p ≤ 0.001) and the plant density (r = −0.79, p ≤ 0.001). As the density decreased, both the number of pods and the production per plant increased. No clear contribution of the thousand-seed weight to the chickpea production was found. The strong relationship between chickpea production and pod number per plant rather than seed size, corroborated by Richards et al. [35], is connected to their inherent greater plasticity and adaptability to agronomic and environmental conditions. A moderate positive correlation (r = 0.43, p ≤ 0.05), was also found between the HI and the grain production per plant. Efficient source-sink relationships can positively contribute to grain yield and might be able to reduce yield gaps from contrasting stress conditions [35].

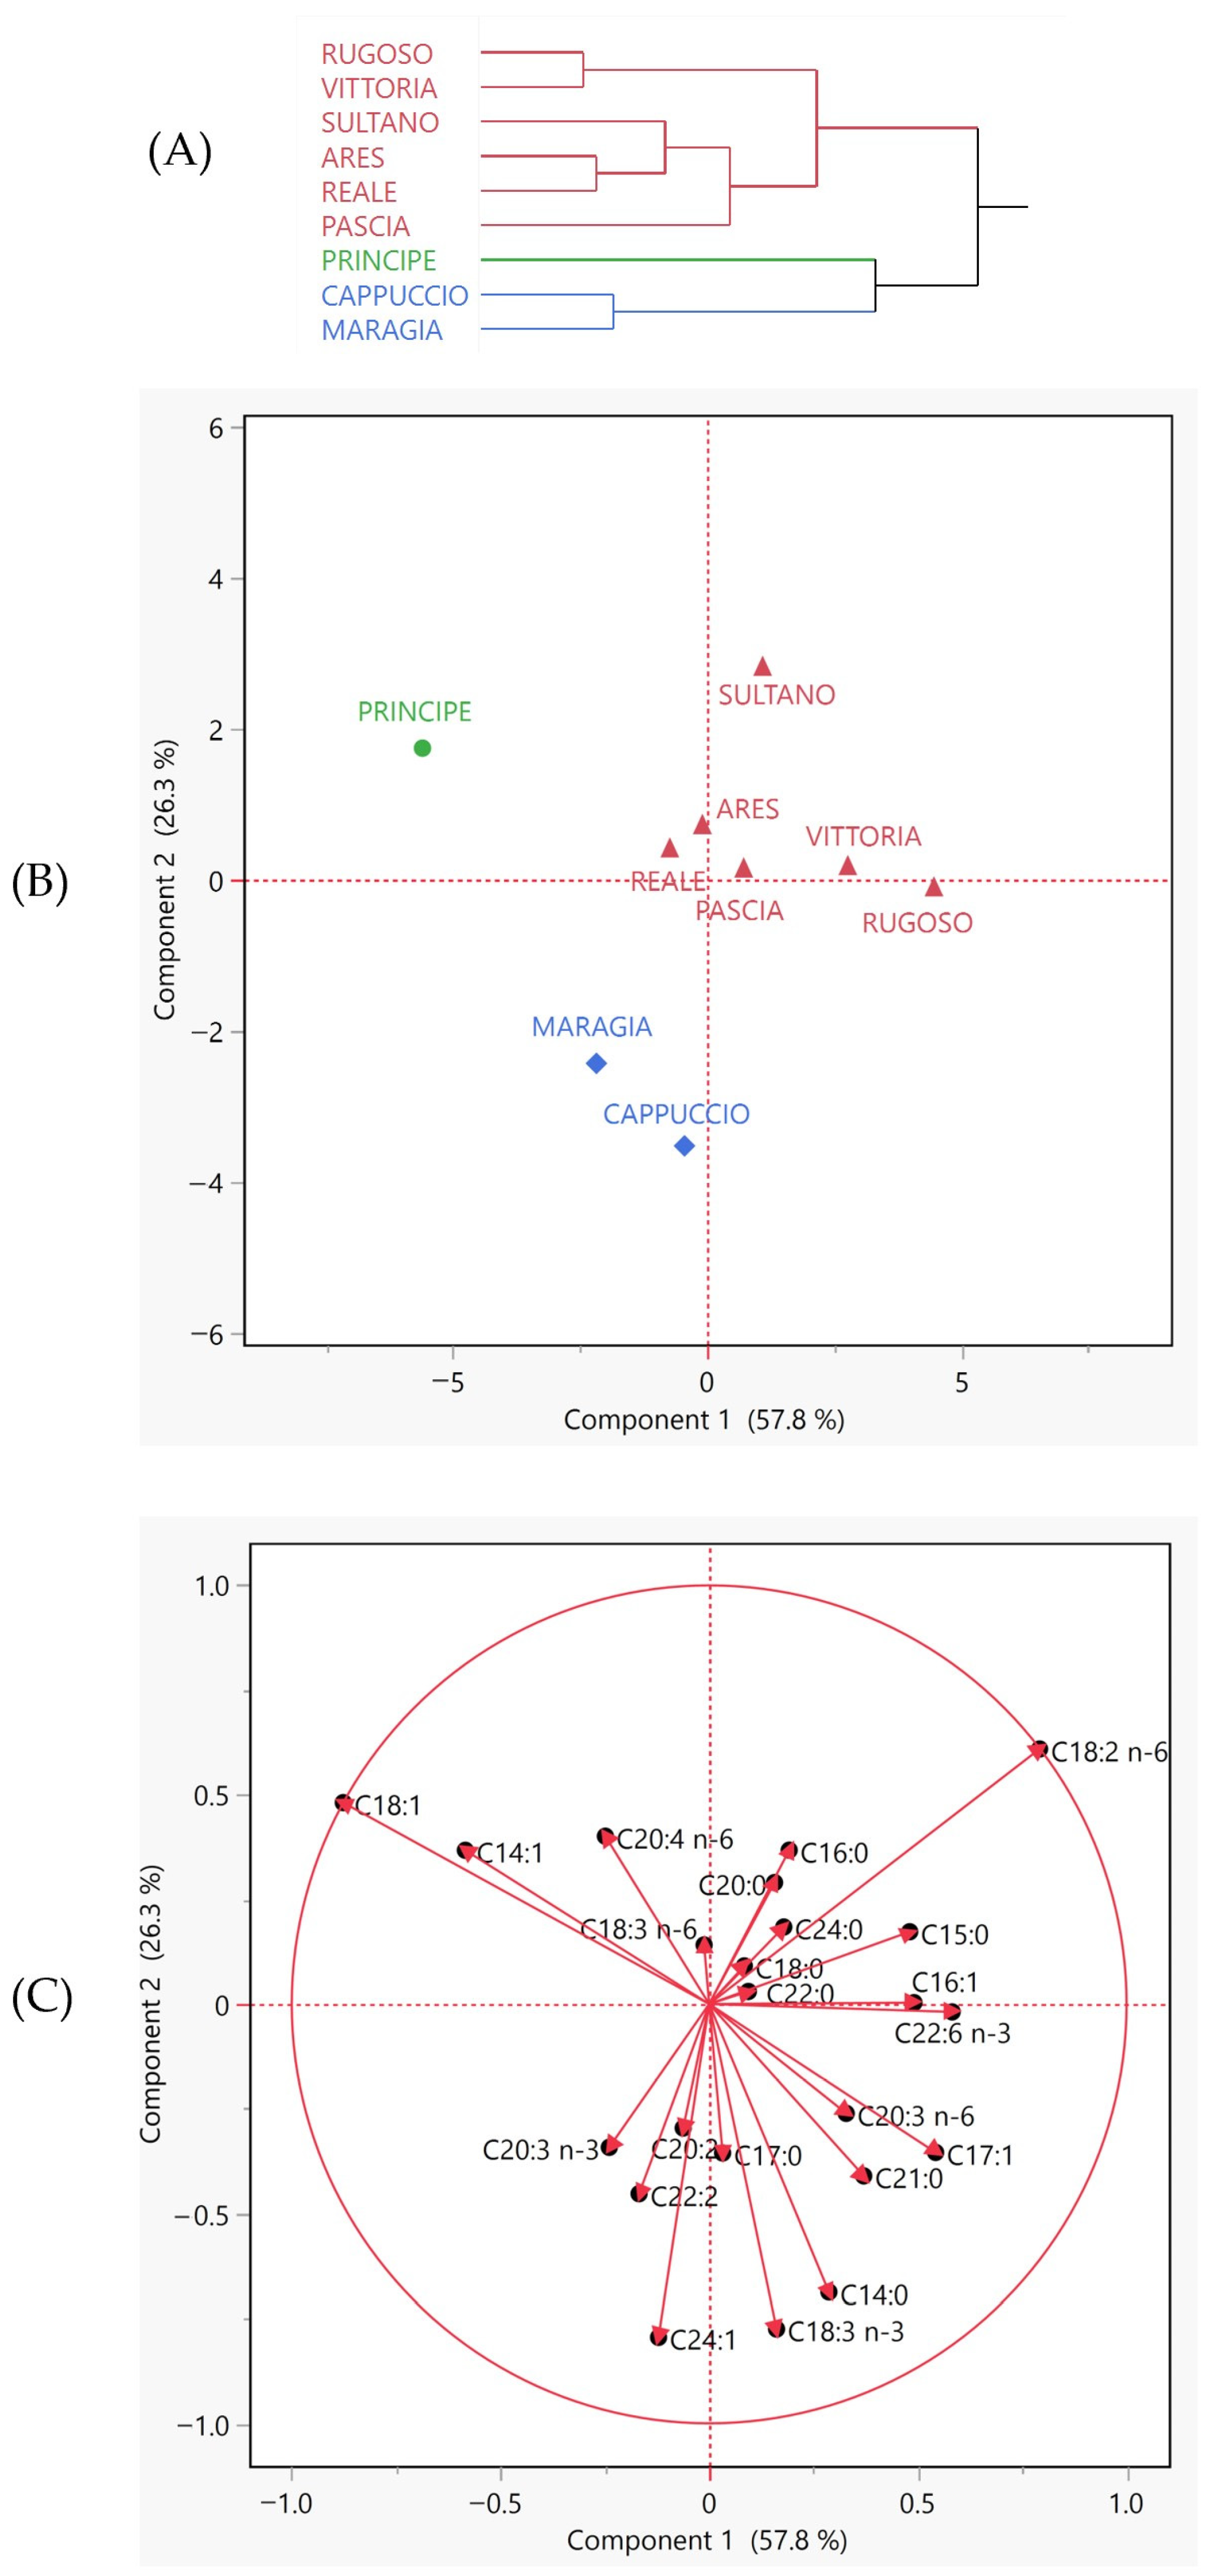
3.3. Phytochemical Evaluation and Antioxidant Activity

3.3.1. Seed Quality Analyses

The crude protein and oil content, along with the fatty acid composition, of both commercial and local chickpea genotypes are presented in Table 5.
Compared to other pulse crops, chickpea exhibits a higher lipid content, reaching up to 10%, featured by nutritionally important sterols, tocopherols, and tocotrienols [37]. Among the nine analyzed genotypes, the oil content ranged from 6.1% to 7.2%, with the lowest percentage observed in the Vittoria genotype (6.1%) and the highest in Pascià (7.2%) and the Cappuccio landrace (7.1%). Our results in terms of oil content align with the findings reported by Zia-Ul-Haq et al. [38] for four desi chickpea cultivars grown in Pakistan and by Zhao et al. (2021) [39] for six cultivars (five Kabuli and one desi) from China. However, other studies indicate a slightly lower oil content, approximately 4–5% [40,41].
The total fat content of chickpea mainly consists of polyunsaturated (PUFAs), monounsaturated (MUFAs), and saturated (SFAs) fatty acids [42]. In the selected samples, the fatty acid classes were detected in the following range of percentages: 11–12% of SFAs, 29–37% of MUFAs, and 51–57% of PUFAs, in accordance with prior research outcomes [43,44]. A chickpea-based diet prioritizes increased consumption of unsaturated fats over saturated fats, contributing to the maintenance of healthy cholesterol levels and mitigating the risk of obesity and diabetes [45].
The fatty acid profiles were dominated by linoleic (C18:2 n-6), oleic (C18:1 n-9), palmitic (C16:0), and α-linolenic (C18:3 n-3) acids, listed in descending order. More in detail, linoleic acid (LA), ranging from 46.89% to 52.96%, showed a significantly (p ≤ 0.05) higher value in the Sultano (52.96%) and Vittoria (51.98%) commercial genotypes and in Rugoso (52.91%) among the local ones. The percentages of oleic acid varied between 27.13% (Rugoso, landrace) and 35.92% (Principe, commercial). The saturated lipid fraction was represented by palmitic acid, significantly higher in Vittoria (11.74%) compared to the other genotypes. Finally, polyunsaturated α-linolenic acid (ALA) ranged from 2.97% in Pascià to 3.98% in Maragià, with comparable values among the two landraces (Cappuccio, 3.80%; Rugoso, 3.86%). All the remaining analyzed genotypes exhibited intermediate values. The complete fatty acid compositions were also subjected to multivariate statistical analysis using HCA and PCA (Figure 3). The dendrogram generated by HCA revealed a red macro cluster comprising six genotypes, a more homogeneous blue cluster including Cappuccio and Maragià, and a green cluster formed by Principe itself. In the PCA score plot and loading plot, Principe was positioned in the upper left quadrant (PC1 < 0; PC2 > 0), primarily influenced by the oleic acid vector. The two genotypes within the blue cluster were in the lower left quadrant (PC1 < 0; PC2 < 0) due to their modest linoleic acid percentages. The six genotypes from the red cluster were plotted in the central upper right part of the score plot, characterized by a linoleic acid percentage greater than 50%, with only one exception (Reale).
The obtained percentages of the nutritionally essential fatty acids, LA and ALA, as well as oleic and palmitic acids, fell within the ranges previously reported in the literature [37,44,46]. However, a notable difference was observed concerning ALA, which was detected at significantly lower levels (<1%) in various desi chickpea genotypes [38,43]. Therefore, the obtained ω-6/ω-3 ratios were notably lower than the values reported in other studies [47,48], with the most favorable outcomes observed in the Maragià commercial genotype (11.78), followed by the two local ones (Cappuccio, 12.45; Rugoso, 13.71).
Chickpea seeds are considered an inexpensive source of high-quality proteins, mainly represented by globulin, glutelin, and albumin [49]. The amino acidic profile of chickpea is well-balanced and rich in lysin and arginine, but deficient in sulfur-containing amino acids [50]. In this study, the crude protein content of both the commercial and local genotypes was investigated. The statistical analysis revealed no significant effect of the genotype on the seed crude protein content, with mean values ranging from 17.45% to 20.48%. These findings align with the data previously reported in the literature [47,51].
From a nutritional point of view, our findings demonstrated that the landraces “Cappuccio della Valtiberina” and “Rugoso della Maremma” exhibited comparable profiles to the analyzed well-known commercial genotypes in terms of protein and oil content, as well as fatty acid composition.

3.3.2. Bioactive Compounds and Antioxidant Activity

Chickpea seeds can provide health-protective bioactive components, such as anthocyanins, flavonoids, and phenolics, with antioxidant activity due to their capability to act as reducing agents, hydrogen-bond donors, and to neutralize free radicals [41].
The concentration of total phenols and the reported antioxidant activity of the hydroalcoholic extracts obtained from the nine analyzed chickpea genotypes are detailed in Table 6.
The Vittoria commercial genotype displayed the highest total phenolic content (0.56 mg GAE g−1). Furthermore, it exhibited a good radical-scavenging activity (0.67 μmol TE g−1), together with Principe (0.62 μmol TE g−1), another commercial genotype, which also showed the highest antioxidant activity (1.23 μmol TE g−1). Conversely, the DPPH assay evidenced the lowest radical-scavenging capacity for the Pascià and Cappuccio genotypes (0.39 and 0.43 μmol TE g−1, respectively); likewise, the FRAP assay indicated the lowest total antioxidant activity for the Pascià and Maragià genotypes (0.88 and 0.81 μmol TE g−1, respectively), the latter showing a small content of phenolic compounds (0.44 mg GAE g−1) as well. The total phenolic content values of the analyzed chickpea genotypes are consistent with the range reported in the study of Kaur et al. (2019) [52] for Kabuli chickpea genotypes. Higher total phenols are described by Zhao et al. (2021) [39] for six beige and black-colored varieties of chickpea. The distribution of these bioactive secondary metabolites in the chickpea seeds shows the highest concentration of phenolic compounds in the seed coat, which acts as a protective barrier for the cotyledon [53]. The scavenging activity determined by DPPH of the chickpea extracts showed lower values than the average DPPH values reported in the literature (>1 μmol TE g−1 DW) [54]. The FRAP values of the analyzed genotypes were included in the range previously described by Quintero-Soto et al. (2018) [54] for nine Kabuli genotypes from Mexico (0.46–1.72 μmol TE g−1 DW) and were consistent with other data reported in the literature [55]. However, they were higher than the antioxidant activity values observed for six chickpea varieties from China (0.4–0.6 μmol TE g−1 DW) [39].
Concerning the two analyzed local genotypes, Rugoso della Maremma and Cappuccio della Valtiberina, the spectrophotometric assays revealed a medium content of secondary metabolites and antioxidant activity in comparison to the commercial varieties. Between the two landraces, Rugoso showed a higher radical-scavenging capacity (0.54 μmol TE g−1) than Cappuccio (0.43 μmol TE g−1). However, no statistically significant differences between the two landraces were observed in terms of total phenolic content (Cappuccio, 0.45 mg GAE g−1; Rugoso, 0.48 mg GAE g−1) and total antioxidant activity (Cappuccio, 1.07 μmol TE g−1; Rugoso, 1.09 μmol TE g−1) as measured by the FRAP assay (Table 6).

3.4. Colorimetric Analysis

The color analysis outcomes are reported in Table 7. For color evaluation, L*, a*, and b* values were observed for the flour samples of both commercial and local chickpea genotypes. These parameters were significantly affected by the genotype. Specifically, the lightness values (L*) ranged from 84.87 for Rugoso, the darkest flour, to 87.41 for the Reale genotype. Our findings were in accordance with data previously reported in the literature for light-colored chickpea varieties [56]. The color parameters a* (green–red) and b* (blue–yellow) pointed out the local genotype Rugoso as the most intensively red (1.85) and yellow (27.32) colored one. All flour samples showed positive a* values, which indicated a slight red tint rather than a green one. The main significant differences concerned the b* parameter, whereby the commercial genotype, Principe, showed the lowest level of yellowness (22.80). The specific color characterizing legume seeds is the result of the presence of various pigments in their seed coats and cotyledons [57]. In another chickpea study, a positive correlation between higher yellow pigment intensity and carotenoid concentration has been observed [58]. The extraction and quantification of carotenoids represent expensive and time-consuming analyses. Hence, the evaluation of flour color may represent a possible strategy for a preliminary assessment of carotenoid concentration in chickpea seeds [59]. Moreover, a fast color analysis of the chickpea flour could be useful for the quality assessment of the product in relation to storage conditions, as reported in recent research [60].
The CIE L*a*b* color difference values (ΔE*ab) among the flour samples are described in Table 8.
ΔE*ab represents the expression of the metric distances among the chromaticity coordinates. As shown in Table 8, noticeable color differences can be observed among most samples, especially for the chickpea flours obtained from the commercial Principe and Reale genotypes and the local Rugoso, with ΔE*ab > 3 values compared to many other genotypes.

4. Conclusions

All nine chickpea genotypes evaluated in this study grew well despite the dry and hot weather conditions experienced during the season. This indicates a high level of adaptability of the evaluated genotypes to the Mediterranean pedo-climatic conditions of Central Italy. The results of this study demonstrate the significant potential of Tuscan chickpea landraces, Rugoso della Maremma and Cappuccio della Valtiberina, as valuable genetic resources for future breeding programs targeting low-input management systems such as organic farming. Both landraces exhibited favorable agronomic traits, such as seed yield, 1000-seed weight, and harvest index, comparable to widely distributed commercial varieties. Additionally, their superior nutritional quality, evidenced by favorable ω-6/ω-3 ratios, highlights their importance in promoting healthier and more sustainable diets. These findings underscore the relevance of chickpea landraces in supporting the agroecological transition and enhancing crop diversity in the face of changing environmental conditions. Additional trials across different seasons remain necessary to unravel their potential under different abiotic and biotic stress conditions and to further define the best agronomic practices to optimize their agronomic and quality traits.

Author Contributions

Conceptualization, L.G.A., D.A. and S.T.; methodology, L.G.A., D.A., L.A.C. and S.T.; formal analysis, L.A.C., G.K. and M.F.B.; investigation, L.G.A., D.A., L.A.C. and S.T.; resources, L.G.A. and D.A.; data curation, L.A.C., M.F.B. and L.C.; writing—original draft preparation, L.A.C., M.F.B., L.C., S.T. and L.G.A.; writing—review and editing, S.T., L.A.C., M.F.B., L.C., D.A., G.K. and L.G.A.; visualization, L.A.C., L.C. and M.F.B.; supervision, L.G.A.; project administration, L.G.A.; funding acquisition, L.G.A. and D.A. All authors have read and agreed to the published version of the manuscript.

Funding

This research was funded by Ente Terre Regionali Toscane (Tuscany Region) within Rural Development Program 2014/2022, sub-measure 10.2. Support for the conservation and sustainable use of genetic resources in agriculture; under the project “Ex situ conservation of genetic resources of endangered herbaceous species in the Region of Tuscany”.

Data Availability Statement

The data presented in this study are available upon request from the corresponding author.

Acknowledgments

The authors would like to thank the staff of the Center for Agri-Environmental Research Enrico Avanzi (CiRAA) of the University of Pisa for their contribution to the field experiment set-up and sample collection.

Conflicts of Interest

The authors declare no conflicts of interest. The funders had no role in the design of the study; in the collection, analyses, or interpretation of data; in the writing of the manuscript; or in the decision to publish the results.

References

  1. Semba, R.D.; Ramsing, R.; Rahman, N.; Kraemer, K.; Bloem, M.W. Legumes as a Sustainable Source of Protein in Human Diets. Glob. Food Sec. 2021, 28, 100520. [Google Scholar] [CrossRef]
  2. Wu, G.; Fanzo, J.; Miller, D.D.; Pingali, P.; Post, M.; Steiner, J.L.; Thalacker-Mercer, A.E. Production and Supply of High-quality Food Protein for Human Consumption: Sustainability, Challenges, and Innovations. Ann. N. Y. Acad. Sci. 2014, 1321, 1–19. [Google Scholar] [CrossRef]
  3. Onwezen, M.C.; Bouwman, E.P.; Reinders, M.J.; Dagevos, H. A Systematic Review on Consumer Acceptance of Alternative Proteins: Pulses, Algae, Insects, Plant-Based Meat Alternatives, and Cultured Meat. Appetite 2021, 159, 105058. [Google Scholar] [CrossRef]
  4. Dixon, R.A.; Sumner, L.W. Legume Natural Products: Understanding and Manipulating Complex Pathways for Human and Animal Health. Plant Physiol. 2003, 131, 878–885. [Google Scholar] [CrossRef]
  5. Fratianni, F.; Cardinale, F.; Cozzolino, A.; Granese, T.; Albanese, D.; Di Matteo, M.; Zaccardelli, M.; Coppola, R.; Nazzaro, F. Polyphenol Composition and Antioxidant Activity of Different Grass Pea (Lathyrus sativus), Lentils (Lens culinaris), and Chickpea (Cicer arietinum) Ecotypes of the Campania Region (Southern Italy). J. Funct. Foods 2014, 7, 551–557. [Google Scholar] [CrossRef]
  6. Casini, P. Field Evaluation of New Kabuli Chickpeas Lines for the Production of Canned Seeds. Adv. Hortic. Sci. 2018, 32, 569–573. [Google Scholar] [CrossRef]
  7. Voisin, A.-S.; Guéguen, J.; Huyghe, C.; Jeuffroy, M.-H.; Magrini, M.-B.; Meynard, J.-M.; Mougel, C.; Pellerin, S.; Pelzer, E. Legumes for Feed, Food, Biomaterials and Bioenergy in Europe: A Review. Agron. Sustain. Dev. 2014, 34, 361–380. [Google Scholar] [CrossRef]
  8. Abbate, V. Aspetti Della Tecnica Colturale Del Cece. Agric. Ric. 1994, 155, 105–120. [Google Scholar]
  9. Rossini, F. Soluzione Ai Problemi Della Coltura Del Cece. L’informatore Agrar. 2008, 17, 45–47. [Google Scholar]
  10. Kumar, S.; Meena, R.S.; Datta, R.; Verma, S.K.; Yadav, G.S.; Pradhan, G.; Molaei, A.; Rahman, G.K.M.M.; Mashuk, H.A. Legumes for Carbon and Nitrogen Cycling: An Organic Approach. In Carbon and Nitrogen Cycling in Soil; Springer: Singapore, 2020; pp. 337–375. ISBN 9789811372643. [Google Scholar]
  11. European Commission. The European Green Deal. COM (2019) 640 Final. 2019. Available online: https://eur-lex.europa.eu/legal-content/EN/TXT/?uri=COM%3A2019%3A640%3AFIN (accessed on 27 January 2024).
  12. Balázs, B.; Kelemen, E.; Centofanti, T.; Vasconcelos, M.W.; Iannetta, P.P.M. Integrated Policy Analysis to Identify Transformation Paths to More Sustainable Legume-Based Food and Feed Value-Chains in Europe. Agroecol. Sustain. Food Syst. 2021, 45, 931–953. [Google Scholar] [CrossRef]
  13. Wijerathna-Yapa, A.; Pathirana, R. Sustainable Agro-Food Systems for Addressing Climate Change and Food Security. Agriculture 2022, 12, 1554. [Google Scholar] [CrossRef]
  14. Merga, B.; Haji, J. Economic Importance of Chickpea: Production, Value, and World Trade. Cogent Food Agric. 2019, 5, 1615718. [Google Scholar] [CrossRef]
  15. Cece-Cicer arietinum, L., Atlante Delle Coltivazioni Erbacee—Leguminose Da Granella. Available online: www.agraria.org (accessed on 4 July 2023).
  16. Faridy, J.-C.M.; Stephanie, C.-G.M.; Gabriela, M.-M.O.; Cristian, J.-M. Biological Activities of Chickpea in Human Health (Cicer arietinum L.). A Review. Plant Foods Hum. Nutr. 2020, 75, 142–153. [Google Scholar] [CrossRef] [PubMed]
  17. Kaur, R.; Prasad, K. Technological, Processing and Nutritional Aspects of Chickpea (Cicer arietinum)—A Review. Trends Food Sci. Technol. 2021, 109, 448–463. [Google Scholar] [CrossRef]
  18. Wang, J.; Li, Y.; Li, A.; Liu, R.H.; Gao, X.; Li, D.; Kou, X.; Xue, Z. Nutritional Constituent and Health Benefits of Chickpea (Cicer arietinum L.): A Review. Food Res. Int. 2021, 150, 110790. [Google Scholar] [CrossRef] [PubMed]
  19. McLean, E.O. Soil PH and Lime Requirement. In Methods of Soil Analysis, Part 2: Chemical and Microbiological Properties; Page, A.L., Miller, R.H., Keeney, D.R., Eds.; American Society of Agronomy, Inc.: Madison, WI, USA, 1982; pp. 199–224. [Google Scholar]
  20. Bremner, J.M.; Mulvaney, C.S. Nitrogen Total. In Methods of Soil Analysis, Part 2: Chemical and Microbiological Properties; Page, A.L., Miller, R.H., Keeney, D.R., Eds.; American Society of Agronomy, Inc.: Madison, WI, USA, 1982; pp. 595–624. [Google Scholar]
  21. Olsen, S.R.; Sommers, L.E. Phosphorus. In Methods of Soil Analysis, Part 2: Chemical and Microbiological Properties; Page, A.L., Miller, R.H., Keeney, D.R., Eds.; Agronomy Monograph 9; American Society of Agronomy, Inc.: Madison, WI, USA, 1982; pp. 403–430. [Google Scholar]
  22. Thomas, G.W. Exchangeable Cations. In Methods of Soil Analysis, Part 2: Chemical and Microbiological Properties; Page, A.L., Miller, R.H., Keeney, D.R., Eds.; American Society of Agronomy, Inc.: Madison, WI, USA, 1982; pp. 159–165. [Google Scholar]
  23. Nelson, D.W.; Sommers, L.E. Total Carbon, Organic Carbon, and Organic Matter. In Methods of Soil Analysis, Part 2: Chemical and Microbiological Properties; Page, A.L., Miller, R.H., Keeney, D.R., Eds.; American Society of Agronomy, Inc.: Madison, WI, USA, 1982; pp. 539–579. [Google Scholar]
  24. Mehlich, A. Determination of Cation- and Anion-Exchange Properties of Soils. Soil Sci. 1948, 66, 429–446. [Google Scholar] [CrossRef]
  25. International Seed Testing Association (ISTA). International Rules for Seed Testing; ISTA: Wallisellen, Switzerland, 2024; ISBN 978-3-906549-41-5. [Google Scholar]
  26. Rocchetti, L.; Bellucci, E.; Cortinovis, G.; Di Vittori, V.; Lanzavecchia, G.; Frascarelli, G.; Nanni, L.; Del Gatto, A.; Pieri, S.; Mangoni, L.; et al. The Development of a European and Mediterranean Chickpea Association Panel (EMCAP). Agronomy 2020, 10, 1417. [Google Scholar] [CrossRef]
  27. Clemente, C.; Ercolini, L.; Rossi, A.; Foschi, L.; Grossi, N.; Angelini, L.G.; Tavarini, S.; Silvestri, N. Spectral Response of Camelina (Camelina sativa (L.) Crantz) to Different Nitrogen Fertilization Regimes under Mediterranean Conditions. Agronomy 2023, 13, 1539. [Google Scholar] [CrossRef]
  28. Christie, W.W. Preparation of Lipid Extracts from Tissues. In Advances in Lipid Methodology-Two; Christie, W.W., Ed.; Oily Press: Dundee, UK, 1993; pp. 195–213. [Google Scholar]
  29. Dewanto, V.; Wu, X.; Liu, R.H. Processed Sweet Corn Has Higher Antioxidant Activity. J. Agric. Food Chem. 2002, 50, 4959–4964. [Google Scholar] [CrossRef] [PubMed]
  30. Benzie, I.F.F.; Strain, J.J. Ferric Reducing/Antioxidant Power Assay: Direct Measure of Total Antioxidant Activity of Biological Fluids and Modified Version for Simultaneous Measurement of Total Antioxidant Power and Ascorbic Acid Concentration. In Methods in Enzymology; Academic Press: Cambridge, MA, USA, 1999; Volume 299, pp. 15–27. [Google Scholar]
  31. Brand-Williams, W.; Cuvelier, M.E.; Berset, C. Use of a Free Radical Method to Evaluate Antioxidant Activity. LWT-Food Sci. Technol. 1995, 28, 25–30. [Google Scholar] [CrossRef]
  32. De Santis, M.A.; Satriani, A.; De Santis, F.; Flagella, Z. Water Use Efficiency, Spectral Phenotyping and Protein Composition of Two Chickpea Genotypes Grown in Mediterranean Environments under Different Water and Nitrogen Supply. Agriculture 2022, 12, 2026. [Google Scholar] [CrossRef]
  33. Fotiadis, S.; Koutroubas, S.D.; Damalas, C.A. Sowing Date and Cultivar Effects on Assimilate Translocation in Spring Mediterranean Chickpea. Agron. J. 2017, 109, 2011–2024. [Google Scholar] [CrossRef]
  34. Ruggeri, R.; Primi, R.; Danieli, P.P.; Ronchi, B.; Rossini, F. Effects of Seeding Date and Seeding Rate on Yield, Proximate Composition and Total Tannins Content of Two Kabuli Chickpea Cultivars. Ital. J. Agron. 2017, 12, 201–207. [Google Scholar] [CrossRef]
  35. Richards, M.F.; Maphosa, L.; Preston, A.L. Impact of Sowing Time on Chickpea (Cicer arietinum L.) Biomass Accumulation and Yield. Agronomy 2022, 12, 160. [Google Scholar] [CrossRef]
  36. Chauhan, Y.; Allard, S.; Williams, R.; Williams, B.; Mundree, S.; Chenu, K.; Rachaputi, N.C. Characterisation of Chickpea Cropping Systems in Australia for Major Abiotic Production Constraints. Field Crops Res. 2017, 204, 120–134. [Google Scholar] [CrossRef]
  37. Jukanti, A.K.; Gaur, P.M.; Gowda, C.L.L.; Chibbar, R.N. Nutritional Quality and Health Benefits of Chickpea (Cicer arietinum L.): A Review. Br. J. Nutr. 2012, 108, S11–S26. [Google Scholar] [CrossRef]
  38. Zia-Ul-Haq, M.; Ahmad, M.; Iqbal, S.; Ahmad, S.; Ali, H. Characterization and Compositional Studies of Oil from Seeds of Desi Chickpea (Cicer arietinum L.) Cultivars Grown in Pakistan. J. Am. Oil Chem. Soc. 2007, 84, 1143–1148. [Google Scholar] [CrossRef]
  39. Zhao, X.; Sun, L.; Zhang, X.; Wang, M.; Liu, H.; Zhu, Y. Nutritional Components, Volatile Constituents and Antioxidant Activities of 6 Chickpea Species. Food Biosci. 2021, 41, 100964. [Google Scholar] [CrossRef]
  40. Dragičević, V.; Kratovalieva, S.; Dumanović, Z.; Dimov, Z.; Kravić, N. Variations in Level of Oil, Protein, and Some Antioxidants in Chickpea and Peanut Seeds. Chem. Biol. Technol. Agric. 2015, 2, 2. [Google Scholar] [CrossRef]
  41. Summo, C.; De Angelis, D.; Ricciardi, L.; Caponio, F.; Lotti, C.; Pavan, S.; Pasqualone, A. Nutritional, Physico-Chemical and Functional Characterization of a Global Chickpea Collection. J. Food Compos. Anal. 2019, 84, 103306. [Google Scholar] [CrossRef]
  42. Shah, T.M.; Iqbal, Z.; Asi, M.R.; Atta, B.M. Induced Genetic Variability for Fatty Acids and Oil Contents in Chickpea (Cicer arietinum). Int. J. Agric. Biol. 2013, 15, 419–426. [Google Scholar]
  43. Xiao, S.; Li, Z.; Zhou, K.; Fu, Y. Chemical Composition of Kabuli and Desi Chickpea (Cicer arietinum L.) Cultivars Grown in Xinjiang, China. Food Sci. Nutr. 2023, 11, 236–248. [Google Scholar] [CrossRef] [PubMed]
  44. Vivar-Quintana, A.M.; Absi, Y.; Hernández-Jiménez, M.; Revilla, I. Nutritional Value, Mineral Composition, Fatty Acid Profile and Bioactive Compounds of Commercial Plant-Based Gluten-Free Flours. Appl. Sci. 2023, 13, 2309. [Google Scholar] [CrossRef]
  45. Madurapperumage, A.; Tang, L.; Thavarajah, P.; Bridges, W.; Shipe, E.; Vandemark, G.; Thavarajah, D. Chickpea (Cicer arietinum L.) as a Source of Essential Fatty Acids—A Biofortification Approach. Front. Plant Sci. 2021, 12, 734980. [Google Scholar] [CrossRef]
  46. Gül, M.K.; Egesel, C.Ö.; Turhan, H. The Effects of Planting Time on Fatty Acids and Tocopherols in Chickpea. Eur. Food Res. Technol. 2008, 226, 517–522. [Google Scholar] [CrossRef]
  47. Jahreis, G.; Brese, M.; Leiterer, M.; Schäfer, U.; Böhm, V. Legume Flours: Nutritionally Important Sources of Protein and Dietary Fiber. Ernahrungs Umschau 2016, 63, 36–42. [Google Scholar] [CrossRef]
  48. Padhi, E.M.T.; Liu, R.; Hernandez, M.; Tsao, R.; Ramdath, D.D. Total Polyphenol Content, Carotenoid, Tocopherol and Fatty Acid Composition of Commonly Consumed Canadian Pulses and Their Contribution to Antioxidant Activity. J. Funct. Foods 2017, 38, 602–611. [Google Scholar] [CrossRef]
  49. Grasso, N.; Lynch, N.L.; Arendt, E.K.; O’Mahony, J.A. Chickpea Protein Ingredients: A Review of Composition, Functionality, and Applications. Compr. Rev. Food Sci. Food Saf. 2022, 21, 435–452. [Google Scholar] [CrossRef]
  50. Grewal, S.K.; Sharma, K.P.; Bharadwaj, R.D.; Hegde, V.; Sidhu, S.K.; Singh, S.; Jain, P.K.; Rasool, S.; Arya, D.K.; Agrawal, P.K.; et al. Characterization of Chickpea Cultivars and Trait Specific Germplasm for Grain Protein Content and Amino Acids Composition and Identification of Potential Donors for Genetic Improvement of Its Nutritional Quality. Plant Genet. Resour. Charact. Util. 2022, 20, 383–393. [Google Scholar] [CrossRef]
  51. Begum, N.; Khan, Q.U.; Liu, L.G.; Li, W.; Liu, D.; Haq, I.U. Nutritional Composition, Health Benefits and Bio-Active Compounds of Chickpea (Cicer arietinum L.). Front. Nutr. 2023, 10, 1218468. [Google Scholar] [CrossRef]
  52. Kaur, K.; Grewal, S.K.; Gill, P.S.; Singh, S. Comparison of Cultivated and Wild Chickpea Genotypes for Nutritional Quality and Antioxidant Potential. J. Food Sci. Technol. 2019, 56, 1864–1876. [Google Scholar] [CrossRef] [PubMed]
  53. Sreerama, Y.N.; Sashikala, V.B.; Pratape, V.M. Variability in the Distribution of Phenolic Compounds in Milled Fractions of Chickpea and Horse Gram: Evaluation of Their Antioxidant Properties. J. Agric. Food Chem. 2010, 58, 8322–8330. [Google Scholar] [CrossRef] [PubMed]
  54. Quintero-Soto, M.F.; Saracho-Peña, A.G.; Chavez-Ontiveros, J.; Garzon-Tiznado, J.A.; Pineda-Hidalgo, K.V.; Delgado-Vargas, F.; Lopez-Valenzuela, J.A. Phenolic Profiles and Their Contribution to the Antioxidant Activity of Selected Chickpea Genotypes from Mexico and ICRISAT Collections. Plant Foods Hum. Nutr. 2018, 73, 122–129. [Google Scholar] [CrossRef] [PubMed]
  55. Segev, A.; Badani, H.; Kapulnik, Y.; Shomer, I.; Oren-Shamir, M.; Galili, S. Determination of Polyphenols, Flavonoids, and Antioxidant Capacity in Colored Chickpea (Cicer arietinum L.). J. Food Sci. 2010, 75, S115–S119. [Google Scholar] [CrossRef] [PubMed]
  56. Milán-Carrillo, J.; Reyes-Moreno, C.; Armienta-Rodelo, E.; Carábez-Trejo, A.; Mora-Escobedo, R. Physicochemical and Nutritional Characteristics of Extruded Flours from Fresh and Hardened Chickpeas (Cicer arietinum L.). LWT-Food Sci. Technol. 2000, 33, 117–123. [Google Scholar] [CrossRef]
  57. Teterycz, D.; Sobota, A. Legume Flour as a Natural Colouring Component in Pasta Production. J. Food Sci. Technol. 2020, 57, 301–309. [Google Scholar] [CrossRef] [PubMed]
  58. Ashokkumar, K.; Tar’an, B.; Diapari, M.; Arganosa, G.; Warkentin, T.D. Effect of Cultivar and Environment on Carotenoid Profile of Pea and Chickpea. Crop Sci. 2014, 54, 2225–2235. [Google Scholar] [CrossRef]
  59. Ashokkumar, K.; Diapari, M.; Jha, A.B.; Tar’an, B.; Arganosa, G.; Warkentin, T.D. Genetic Diversity of Nutritionally Important Carotenoids in 94 Pea and 121 Chickpea Accessions. J. Food Compos. Anal. 2015, 43, 49–60. [Google Scholar] [CrossRef]
  60. Kazemzadeh Pournaki, S.; Biswas, A.; Hall, C. Effects of Storage Conditions on Chemistry and Technological Properties of Different Cultivars of Chickpea. J. Agric. Food Res. 2024, 16, 101066. [Google Scholar] [CrossRef]
Figure 1. Meteorological data with mean maximum and minimum air temperatures (°C) and monthly precipitations during the trial period (March 2022–July 2022) in Central Italy (Pisa, Italy, 43°40′ N; 10°19′ E; 1 m elevation), compared to long-term (1992–2021) mean values.
Agronomy 14 02229 g001
Figure 2. Duration in days (A) and growing degree days (GDD) (B) of the main phenological stages of chickpea genotypes.
Agronomy 14 02229 g002
Figure 3. Multivariate statistical analysis performed on the fatty acid complete compositions. HCA dendrogram (A), PCA score plot (B), and loading plot (C) based on PC1 and PC2.
Agronomy 14 02229 g003
Table 1. List of the compared commercial and local chickpea genotypes.
TypeGenotypeProviderOrigin
CommercialAresSAIS 1 Italy
MaragiàISEA 2 S.r.l.Italy
PasciàISEA S.r.l.Italy
PrincipeSAISItaly
RealeISEA S.r.l.Italy
SultanoISEA S.r.l.Italy
VittoriaSAISItaly
LandraceCappuccio della ValtiberinaGermplasm bank of the DAFE 3Italy
Rugoso della MaremmaGermplasm bank of the DAFEItaly
1 SAIS = Società Agricola Italiana Sementi (Via Ravennate 214, 47521, Cesena (FC), Italy); 2 Società Produttori Sementi S.P.A. (via Macero, 1, 40050 Argelato (BO), Italy); 3 DAFE = Department of Agriculture, Food and Environment, University of Pisa (via del Borghetto 80, 56124, Pisa, Italy).
Table 2. Soil physical and chemical characteristics (0–30 cm depth) at the start of the experiment.
Sand (%) 58.70
Silt (%) 27.50
Clay (%)13.80
pH 7.85
Electric conductivity (mS cm−1) 0.14
Total N (g kg−1) 0.89
NO3-N (mg kg−1)50.70
Available P Olsen (mg kg−1)4.5
Exchangeable K (mg kg−1)141.5
Organic matter (%)2.15
Active CaCO3 (%)2.83
Cation exchange capacity (meq 100 g−1)7.24
Table 3. Morpho-agronomic characteristics of the commercial and local chickpea genotypes compared in the study.
GenotypePlant Height Height to the First PodBranchesPods per
Plant
No. Seeds per Pod1000-Seed
Weight
Seed
Production
Plant
Density
Seed YieldHarvest
Index
PrimarySecondary
cmcmNo. Plant−1No. Plant−1No. Plant−1No. Pod−1g DW Plant−1g DW Plant−1No. Plant m−2g m−2
Commercial
Ares54.40 ± 1.8233.20 ± 2.472.30 ± 0.2810.37 ± 0.87 a38.36 ± 5.640.83 ± 0.09280.67 ± 13.49 c8.75 ± 1.8527.55 ± 3.36241.68 ± 26.190.51 ± 0.01 ab
Maragià45.97 ± 1.8227.43 ± 2.472.40 ± 0.287.29 ± 0.66 b21.77 ± 3.251.09 ± 0.13432.92 ± 13.49 a9.90 ± 1.8527.22 ± 3.33261.24 ± 26.190.53 ± 0.01 ab
Pascià45.85 ± 1.8125.59 ± 2.462.12 ± 0.267.29 ± 0.66 b27.01 ± 4.020.93 ± 0.11377.48 ± 13.49 ab10.72 ± 1.8526.22 ± 3.26219.40 ± 26.190.53 ± 0.01 ab
Principe50.27 ± 1.8232.00 ± 2.472.53 ± 0.296.33 ± 0.60 bc22.84 ± 3.400.85 ± 0.09392.32 ± 13.49 ab7.51 ± 1.8532.53 ± 3.71240.74 ± 26.190.52 ± 0.01 ab
Reale46.70 ± 1.8228.67 ± 2.472.70 ± 0.304.74 ± 0.49 c21.55 ± 3.220.90 ± 0.10382.79 ± 13.49 ab7.15 ± 1.8530.87 ± 3.59220.63 ± 26.190.55 ± 0.01 a
Sultano53.83 ± 1.8233.80 ± 2.472.20 ± 0.278.48 ± 0.74 ab28.19 ± 4.180.81 ± 0.09283.44 ± 13.49 c6.48 ± 1.8535.85 ± 3.94237.23 ± 26.190.50 ± 0.01 ab
Vittoria49.73 ± 1.8230.47 ± 2.472.87 ± 0.316.76 ± 0.63 b30.41 ± 4.500.88 ± 0.10331.57 ± 13.49 bc8.79 ± 1.8529.87 ± 3.52245.15 ± 26.190.53 ± 0.01 ab
Local
Cappuccio47.07 ± 1.8227.13 ± 2.472.50 ± 0.296.53 ± 0.61 bc30.50 ± 4.510.78 ± 0.08425.50 ± 13.49 a10.49 ± 1.8533.86 ± 3.80292.83 ± 26.190.55 ± 0.01 a
Rugoso47.23 ± 1.8228.83 ± 2.472.83 ± 0.318.15 ± 0.72 ab29.06 ± 4.300.96 ± 0.11271.27 ± 13.49 c7.40 ± 1.8536.51 ± 3.98272.45 ± 26.190.50 ± 0.01 b
Significance*n.s.n.s.****n.s.***n.s.n.s.n.s.*
Commercial49.49 ± 1.5330.11 ± 1.842.44 ± 0.117.07 ± 0.5026.65 ± 2.290.90 ± 0.03354.46 ± 14.168.47 ± 1.1730.01 ± 1.98238.01 ± 8.88 b0.52 ± 0.01
Local47.15 ± 1.6427.98 ± 1.942.67 ± 0.217.21 ± 0.8929.73 ± 3.940.87 ± 0.07348.39 ± 26.498.95 ± 1.5035.19 ± 3.05282.64 ± 16.62 a0.52 ± 0.01
Significancen.s.n.s.n.s.n.s.n.s.n.s.n.s.n.s.**n.s.
*** p ≤ 0.001; * p ≤ 0.05; n.s. p > 0.05, means followed by different superscript letters are significantly different (p ≤ 0.05, Tukey’s test), Tukey’s test returns no differences.
Table 4. Pearson’s product moment correlation coefficients (r) and their statistical significance for the chickpea genotypes’ yield components.
Plant HeightFirst Pod HeightNo.
Primary Branches
No.
Secondary Branches
No. Pods per PlantNo. Seeds per Pod1000-Seed WeightSeed Production Plant
Density
YieldHarvest Index
Plant height1----------
First pod height0.84 ***1---------
No. primary branchesn.s.n.s.1--------
No. secondary branchesn.s.n.s.n.s.1-------
No. pods per plantn.s.−0.39 *n.s.0.76 ***1------
No. seeds per podn.s.n.s.n.s.n.s.n.s.1-----
1000-seed weightn.s.n.s.n.s.−0.44 *n.s.n.s.1----
Seed production −0.46 *−0.77 ***n.s.0.42 *0.71 ***n.s.n.s.1---
Plant density0.48 *0.69 ***n.s.n.s.−0.47 *−0.48 *n.s.−0.79 ***1--
Yield n.s.n.s.n.s.n.s.n.s.n.s.n.s.n.s.0.51 *1-
Harvest index−0.39 *−0.42 *n.s.n.s.n.s.n.s.0.51 **0.43 *−0.41 *n.s.1
*** p ≤ 0.001; ** p ≤ 0.01; * p ≤ 0.05; n.s. p > 0.05, per plant.
Table 5. Protein and oil content in chickpea seeds with main fatty acids profile as affected by genotype.
GenotypeProtein ContentOil ContentC16:0C18:1C18:2C18:3ω-6/ω-3
%
Commercial
Ares18.87 ± 0.996.6 ± 0.09 abc10.99 ± 0.09 d31.04 ± 0.25 bc50.50 ± 0.41 b3.39 ± 0.03 c14.90 ± 0.01 f
Maragià18.24 ± 1.656.9 ± 0.18 ab10.66 ± 0.08 e30.71 ± 0.22 cd46.89 ± 0.41 c3.98 ± 0.03 a11.78 ± 0.01 i
Pascià19.66 ± 1.497.2 ± 0.14 a9.98 ± 0.07 f29.97 ± 0.21 d50.38 ± 0.41 b2.97 ± 0.01 f16.96 ± 0.08 b
Principe20.48 ± 1.266.9 ± 0.23 ab11.25 ± 0.10 cd35.92 ± 0.30 a47.78 ± 0.41 c3.08 ± 0.02 e15.51 ± 0.03 e
Reale19.10 ± 0.146.2 ± 0.32 bc11.52 ± 0.07 b31.37 ± 0.27 bc49.92 ± 0.46 b3.06 ± 0.02 e16.31 ± 0.04 c
Sultano17.45 ± 1.586.5 ± 0.24 abc11.07 ± 0.09 d31.50 ± 0.28 b52.96 ± 0.50 a2.98 ± 0.02 f17.77 ± 0.05 a
Vittoria19.08 ± 2.146.1 ± 0.26 c11.74 ± 0.11 a28.55 ± 0.20 e51.98 ± 0.47 a3.26 ± 0.01 d15.94 ± 0.10 d
Local
Cappuccio18.55 ± 1.557.1 ± 0.09 a10.57 ± 0.06 e28.72 ± 0.25 e47.31 ± 0.40 c3.80 ± 0.03 b12.45 ± 0.01 h
Rugoso19.40 ± 0.476.5 ± 0.10 abc11.42 ± 0.10 bc27.13 ± 0.19 f52.91 ± 0.49 a3.86 ± 0.03 b13.71 ± 0.02 g
Significancen.s.******************
The results are expressed as mean (n = 3) on a DW basis ± standard deviation. Different superscript letters indicate statistically significant differences at p < 0.05 level according to Tukey’s post hoc test. Asterisks (*) point out a significant influence of the genotype factor as follows: n.s., not significant at p > 0.05; ***, significant at p ≤ 0.001 level.
Table 6. Total phenolic content (TPC), DPPH scavenging capacity, and FRAP antioxidant activity of the analyzed commercial and local chickpea genotypes.
GenotypeTPC
(mg GAE g−1 DW)
DPPH
(μmol TE g−1 DW)
FRAP
(μmol TE g−1 DW)
Commercial
Ares0.51 ± 0.01 b0.51 ± 0.02 cde0.94 ± 0.06 d
Maragià0.44 ± 0.01 d0.53 ± 0.04 bcd0.81 ± 0.03 e
Pascià0.46 ± 0.02 bcd0.39 ± 0.06 e0.88 ± 0.04 de
Principe0.50 ± 0.03 bc0.62 ± 0.03 ab1.23 ± 0.02 a
Reale0.50 ± 0.01 bc0.61 ± 0.03 abc0.98 ± 0.06 cd
Sultano0.50 ± 0.00 bc0.60 ± 0.03 abc1.12 ± 0.01 ab
Vittoria0.56 ± 0.01 a0.67 ± 0.05 a1.06 ± 0.00 bc
Local
Cappuccio0.45 ± 0.03 cd0.43 ± 0.03 de1.07 ± 0.02 bc
Rugoso0.48 ± 0.03 bcd0.54 ± 0.05 bc1.09 ± 0.06 bc
Significance*********
The results are expressed as mean (n = 3) ± standard deviation. Different superscript letters indicate statistically significant differences at p < 0.05 level according to the Tukey’s post hoc test. Asterisks point out a significant influence of the genotype factor as follows: ns, not significant at p > 0.05; ***, significant at p ≤ 0.001 level. DW, dry weight; GAE, gallic acid equivalents; and TE, Trolox equivalents.
Table 7. Color parameters for chickpea flours from commercial and local genotypes. Data are presented as a mean of three replicates.
GenotypeL*a*b*
Commercial
Ares85.61 ± 0.08 cd1.77 ± 0.03 ab26.52 ± 0.06 ab
Maragià86.40 ± 0.13 abc1.40 ± 0.08 abc23.73 ± 0.54 cd
Pascià86.33 ± 0.01 abc1.37 ± 0.03 abc24.08 ± 0.57 cd
Principe87.18 ± 0.07 ab1.27 ± 0.00 bc22.80 ± 0.10 d
Reale87.41 ± 0.03 a1.21 ± 0.02 c24.88 ± 0.13 bcd
Sultano86.10 ± 0.47 bc1.63 ± 0.23 abc25.72 ± 0.08 abc
Vittoria87.08 ± 0.01 ab1.17 ± 0.01 c24.46 ± 0.05 bcd
Local
Cappuccio86.37 ± 0.47 abc1.38 ± 0.09 abc23.73 ± 0.45 cd
Rugoso84.87 ± 0.5 d1.85 ± 0.28 a27.32 ± 1.35 a
Significance*****
** p ≤ 0.01; * p ≤ 0.05; in the same column, different superscript letters indicate significant differences among samples.
Table 8. CIE L*a*b* color differences among the analyzed chickpea flour genotypes.
Δ E ab MaragiàPasciàPrincipeRealeSultanoVittoriaCappuccioRugoso
Ares2.922.584.072.50.952.62.921.09
Maragià-0.351.221.542.031.020.033.93
Pascià -1.541.181.680.860.356.08
Principe -10.472.093.131.671.24
Reale -1.610.541.563.58
Sultano -1.662.022.03
Vittoria -1.043.68
Cappuccio -3.92
Rugoso -
Disclaimer/Publisher’s Note: The statements, opinions and data contained in all publications are solely those of the individual author(s) and contributor(s) and not of MDPI and/or the editor(s). MDPI and/or the editor(s) disclaim responsibility for any injury to people or property resulting from any ideas, methods, instructions or products referred to in the content.

