Article

Monitoring and Optimization of Potato Growth Dynamics under Different Nitrogen Forms and Rates Using UAV RGB Imagery

1
College of Agronomy and Biotechnology, Yunnan Agricultural University, Kunming 650201, China
2
State Key Laboratory of Vegetable Biobreeding, Institute of Vegetables and Flowers, Chinese Academy of Agricultural Sciences, Beijing 100081, China
*
Authors to whom correspondence should be addressed.
Agronomy 2024, 14(10), 2257; https://doi.org/10.3390/agronomy14102257
Submission received: 23 August 2024 / Revised: 27 September 2024 / Accepted: 27 September 2024 / Published: 29 September 2024

Abstract

:
The temporal dynamics of canopy growth are closely related to the accumulation and distribution of plant dry matter. Recently, unmanned aerial vehicles (UAVs) equipped with various sensors have been increasingly adopted in crop growth monitoring. In this study, two potato varieties were used as materials, and treated with different combinations of nitrogen forms (nitrate and ammonium) and application rates (0, 150, and 300 kg ha−1). A canopy development model was then constructed using low-cost time-series RGB imagery acquired by UAV. The objectives of this study were to quantify the variation in canopy development parameters under different nitrogen treatments and to explore the model parameters that represent the dynamics of plant dry matter accumulation, as well as those that contribute significantly to yield. The results showed that, except for the thermal time to canopy senescence (t2), other parameters of the potato canopy development model exhibited varying degrees of variation under different nitrogen treatments. The model parameters were more sensitive to nitrogen forms, such as ammonium and nitrate, than to application rates. The integral area (At) under the canopy development curve had a direct effect on plant dry matter accumulation (path coefficient of 0.78), and the two were significantly positively correlated (Pearson correlation coefficient of 0.93). Integral area at peak flowering (AtII) was significantly correlated with yield for both single and mixed potato varieties, having the greatest effect on yield (total effect of 1.717). In conclusion, UAV-acquired time-series RGB imagery could effectively quantify the variation of potato canopy development parameters under different nitrogen treatments and monitor the dynamic changes in plant dry matter accumulation. The regulation of canopy development parameters is of great importance and practical value for optimizing nitrogen management strategies and improving yield.

1. Introduction

Potato (Solanum tuberosum L.) is one of the most important non-cereal crops, with high nutritional and economic value, and plays a crucial role in ensuring global food security [1]. There is a competitive and dependent relationship between potato canopy growth and tuber yield formation [2]. Proper nitrogen fertilizer management not only promotes the timely transfer of photosynthetic assimilation products and increases potato tuber yield, but also reduces negative impact on the environment [3,4]. Therefore, it is important to conduct a comprehensive study on the relationship between potato canopy growth dynamics and plant dry matter accumulation and distribution under different nitrogen fertilizer management practices, which is of great importance for optimizing nitrogen management and improving tuber yield.
Nitrogen is an essential nutrient for plant growth and development. Appropriate nitrogen fertilizer dosage can enhance the growth of potato plants and contribute to increased dry matter accumulation and tuber yield [5]. However, more nitrogen is not always better; excessive nitrogen application not only fails to increase tuber yield, but also reduces tuber quality and causes negative environmental impacts [6]. The main sources of nitrogen taken up by potatoes are nitrate and ammonium nitrogen, but research on the effects of different forms of nitrogen on potatoes has yielded conflicting results. While Lorenz et al. [7] found that ammonium nitrogen was the most effective nitrogen source for potato growth, other studies have shown that nitrate nitrogen promotes greater stem and leaf growth compared to ammonium nitrogen and urea, resulting in higher dry matter accumulation and tuber yield [8].
The canopy is the primary site of photosynthesis in crops, and its growth dynamics are closely linked to plant dry matter accumulation and distribution [2,9]. Environmental factors such as temperature, photoperiod, light, water, and nitrogen availability influence canopy growth dynamics in the field, with temperature and nitrogen having the most significant effects [10]. In addition, nitrogen supply is a critical factor influencing potato dry matter accumulation and distribution [11,12,13,14,15]. Studies have shown that adequate nitrogen supply can enhance chlorophyll synthesis, boost photosynthetic capacity, and produce more organic matter, thus facilitating canopy expansion and dry matter accumulation [16]. Variations in canopy growth, duration of maximum green canopy cover, and senescence rate influence the dry matter accumulation rate by affecting light interception and radiation use efficiency [17].
The degree of canopy development can be quantified by the percentage of soil surface area covered by green leaves and has been recognized as one of the effective indicators for assessing the factors affecting crop growth characteristics [16,17,18]. The rate of canopy growth, the duration of canopy maintenance, and the rate of canopy senescence together determine the crop canopy cover throughout the growth cycle [19]. It has been shown that nitrogen promotes crops to reach maximum canopy cover earlier, prolongs canopy cover time, and slows canopy senescence, thereby increasing the canopy’s ability to intercept photosynthetically active radiation [10,20]. Khan [18] was the first to construct a physiological-ecological model of potato canopy cover dynamics with heat accumulation throughout the growth cycle, and quantifiable model parameters were analyzed as new traits. Some studies have shown that model parameters can be affected by multiple factors such as genetic variation, nitrogen fertilizer dosage, environmental conditions, and their interactions [10,16,17,18]. However, there is still a relative lack of studies on the temporal dynamics of canopy growth, plant dry matter accumulation and partitioning, and their interrelationships in potato under different combinations of nitrogen forms and rates throughout the life span.
Traditional crop monitoring methods are often labor-intensive and time-consuming and have difficulties comprehensively and accurately reflecting actual conditions in large agricultural fields [21]. In recent years, high-throughput phenotyping technologies, exemplified by unmanned aerial vehicle (UAV) remote sensing, have been widely applied for non-destructive, efficient, accurate, and continuous crop monitoring [22,23]. UAVs equipped with visible light sensors, such as consumer-grade digital cameras, offer the advantages of low cost, ease of operation, and rich data acquisition, making them widely used for crop growth monitoring, disease detection, and yield estimation [24,25]. In this study, we used a UAV as a remote sensing platform to periodically and continuously acquire high-resolution RGB images of potato throughout the growing season, and subsequently we fitted potato canopy development curves by extracting canopy cover. The objectives of this study were to (1) quantify the variations in canopy development parameters of potato under different combinations of nitrogen application and nitrogen form, (2) explore the canopy development parameter that represents the dynamics of total dry matter accumulation in potato plants, and (3) identify stable canopy development parameters that significantly contribute to potato yield and are not influenced by potato variety.

2. Materials and Methods

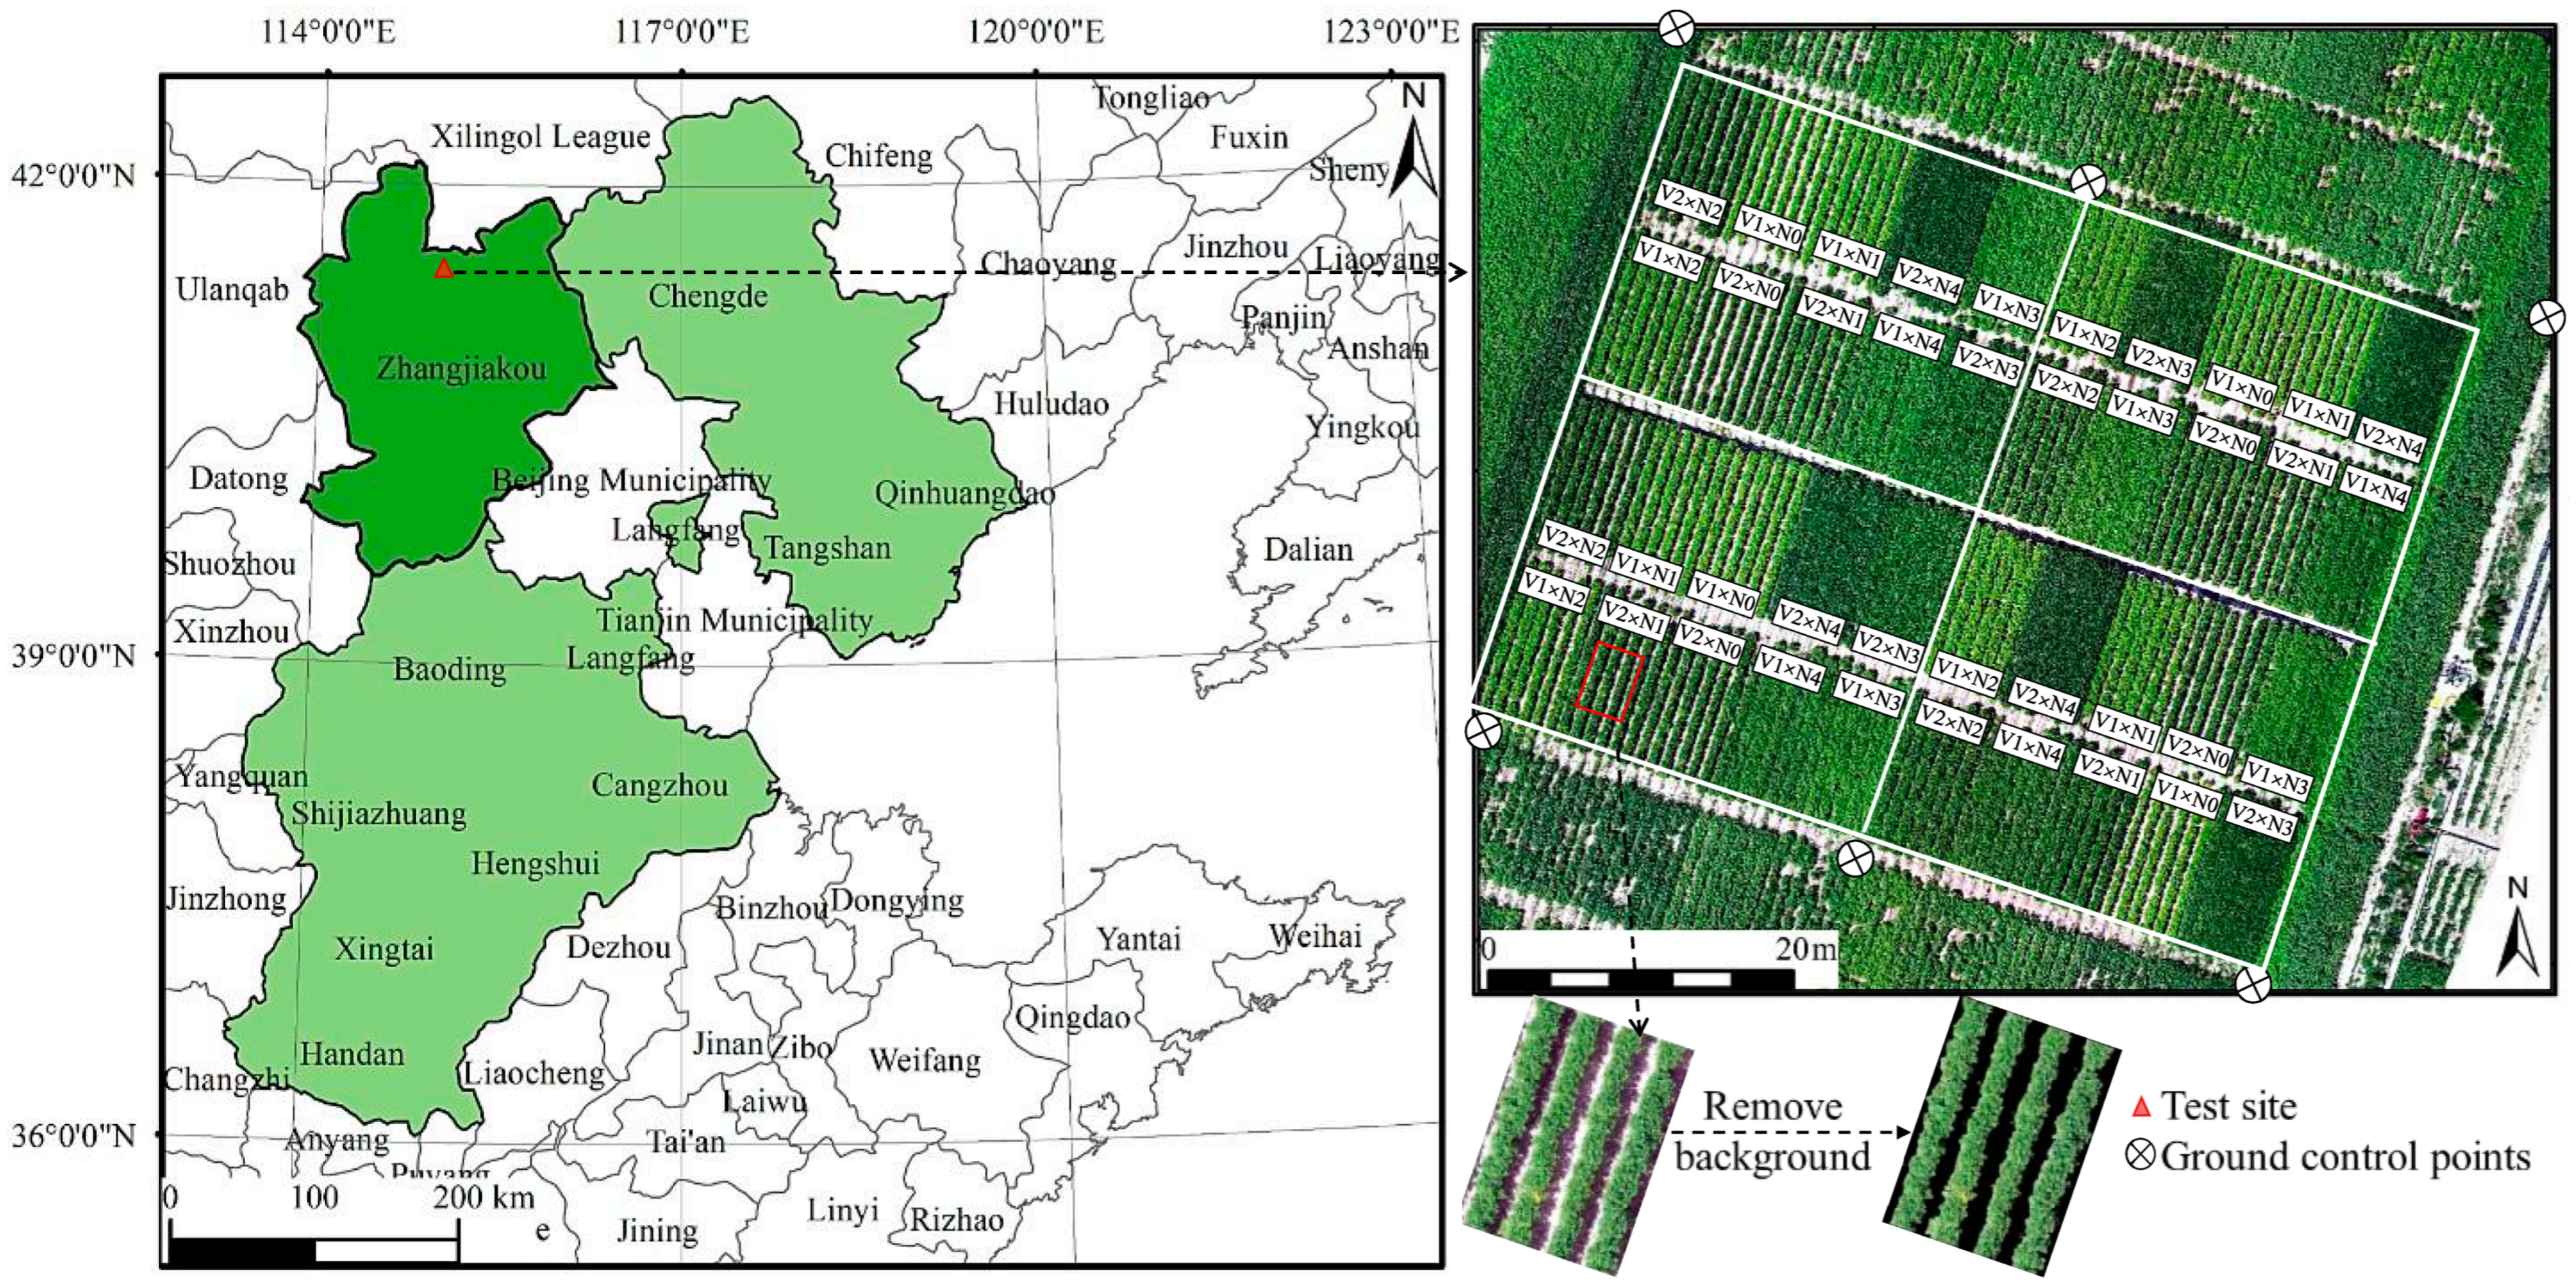
2.1. Experimental Sites and Design

The field experiment was conducted in the Chabei Administrative District of Zhangjiakou City, Hebei Province, located at 115.06° E longitude, 41.48° N latitude, and an altitude of 1390 m. The average temperature during the potato growing season in this region is about 16.49 °C, with average solar radiation of 3.64 × 10⁴ W m−2, typical of a temperate continental monsoon climate. The experimental field soil is a calcareous chernozem with 16.27 g kg−1 organic matter, 1.08 g kg−1 total nitrogen, 0.07 g kg−1 hydrolyzable nitrogen, 8.81 mg kg−1 available phosphorus, 73.00 mg kg−1 available potassium, and a pH of 8.4.
The experimental design of “2 potato varieties × 2 nitrogen forms × 3 nitrogen application rates” was adopted, using a split-plot design with four replications, resulting in a total of 40 experimental plots. The main plots were assigned to the nitrogen treatments (nitrogen forms and application rates), while the sub-plots were assigned to the two potato varieties. Each experimental plot was planted with 6 rows, each 10 m long and 5.4 m wide, with 20 cm plant spacing and 90 cm row spacing; the field layout is shown in Figure 1. Two potato varieties, ‘Shapody’ (V1) and ‘Zhongshu 18’ (V2), were selected for the experiment. The forms of nitrogen used were nitrate nitrogen (potassium nitrate, KNO3) and ammonium nitrogen (ammonium sulfate, (NH4)2SO4, with 1% nitrification inhibitor). Nitrogen application rates were set at three levels: 0, 150, and 300 kg ha−1 of nitrogen. Nitrogen treatments were randomly assigned to the main plots, while the two potato varieties were randomly distributed within each main plot as sub-plots.
The nitrogen was applied as follows: 40% of the total nitrogen fertilizer was applied as a basal dose at planting, while the remaining nitrogen was administered through fertigation in split applications, with all nitrogen applied before the peak flowering stage. Specifically, 20% was applied before flowering, 20% during the early flowering stage, 10% just before peak flowering, and the final 10% during full flowering. Phosphorus was applied at 240 kg ha−1 as superphosphate (Ca(H2PO4)2), and potassium was applied at 450 kg ha−1 as potassium sulfate (K2SO4). Irrigation was provided via drip irrigation to meet crop water requirements throughout the growing season. Pesticides and fungicides were applied as necessary based on local agronomic recommendations, and weed control was performed manually as needed. The nitrogen treatments were coded as N0, N1, N2, N3, and N4, representing the following: control (no nitrogen fertilizer), 150 kg ha−1 KNO3, 300 kg ha−1 KNO3, 150 kg ha−1 (NH4)2SO4, and 300 kg ha−1 (NH4)2SO4, respectively. All other field management practices were consistently applied across all treatments and replications to ensure uniform experimental conditions.

2.2. UAV Image Acquisition and Preprocessing

A small quadcopter drone, the Inspire 2 (DJI Technology Co., Ltd., Shenzhen, China), was used as the remote sensing platform. It was equipped with a 20.8 megapixel Zenmuse X5S image sensor (red, green, and blue channels) to acquire digital images of the potato throughout its growth cycle, with UAV surveys conducted approximately once a week at different growth stages. The flight altitude was set to 20 m (corresponding to a spatial resolution of 0.44 cm/pixel) to balance sufficient coverage and resolution for accurate analysis, and the front and side overlaps were 80% and 70%, respectively. To avoid the influence of light on the results, clear and cloudless weather was chosen for the flight operation, and the flight time was at 11:00~13:00. Before the mission, five ground control points were evenly placed in the field area for post-image geometric correction. Image preprocessing was performed using Agisoft Metashape Professional software (Agisoft LLC, St. Petersburg, Russia), which consists of the steps of importing raw images, aligning, geometric correction, generating point clouds, constructing grids, and finally generating a digital orthomosaic (DOM).

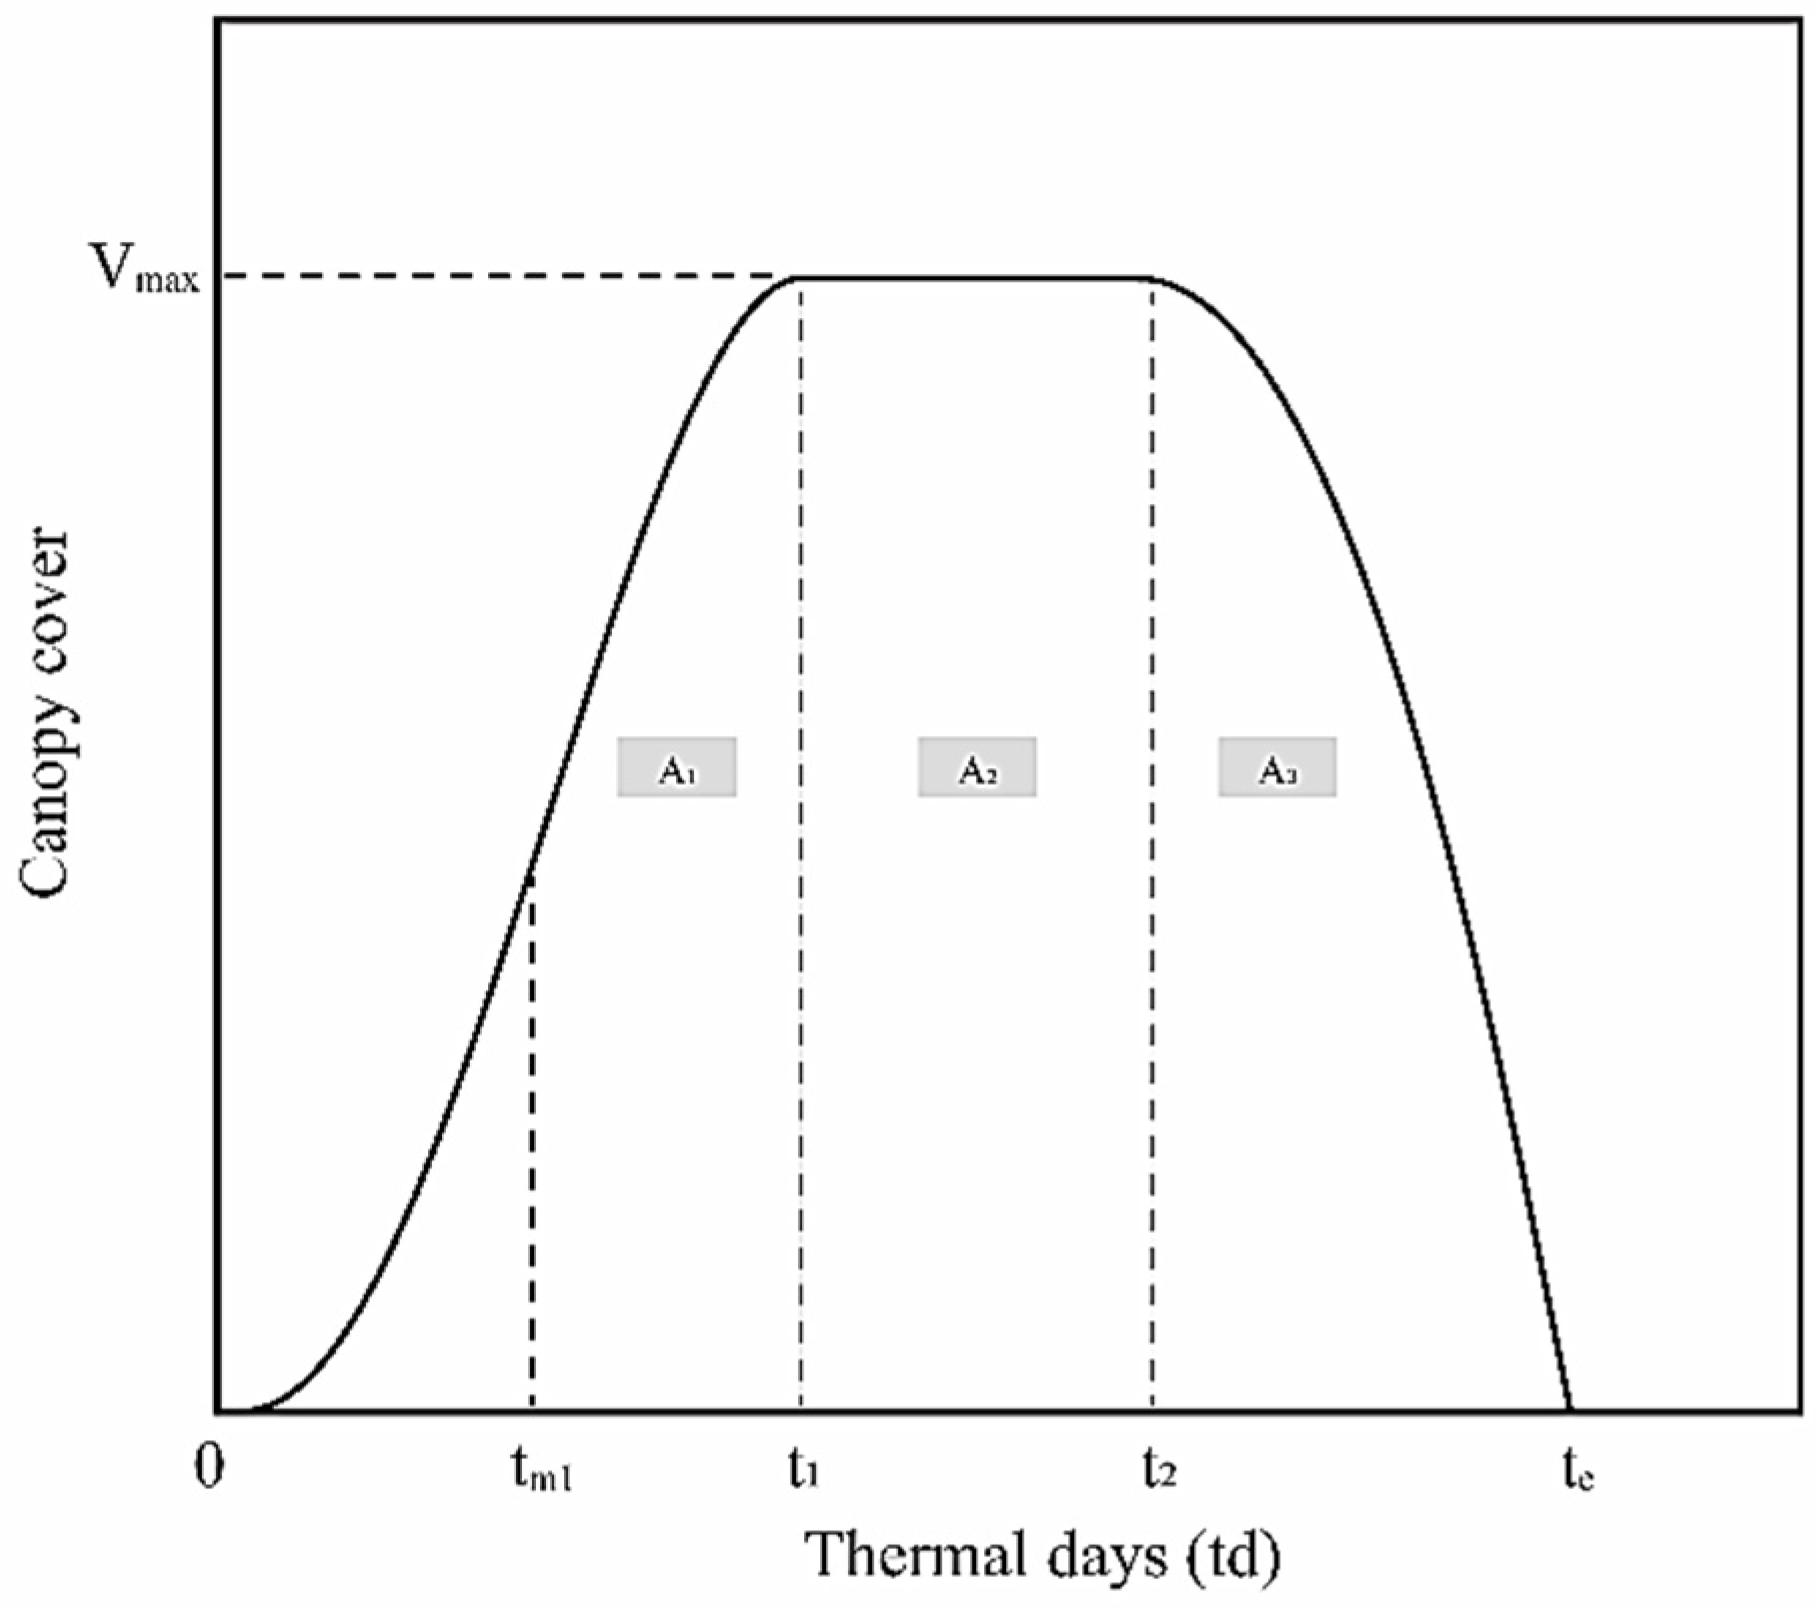
2.3. Canopy Cover Extraction and Canopy Development Curve Fitting

The vegetation canopy information in the DOM generated from UAV RGB images was accurately extracted using the green leaf index (GLI), a vegetation index based on the RGB bands (Equation (1)). A threshold of 0.05 was applied to differentiate vegetation from non-vegetation areas in this study. The DOMs were processed to classify each pixel as either vegetation or non-vegetation based on the GLI threshold. The ratio of the number of canopy pixels to the total number of pixels in the central area (4 m × 5 m) of each experimental plot was then used to determine the canopy coverage of each plot.
G L I = 2 G R B 2 G + R + B
The dynamics of potato canopy coverage over thermal days was modeled according to the method described by Khan [18], which was used to evaluate the dynamics of canopy development under different nitrogen treatments (Figure 2). The formula for converting days after emergence to thermal days is as follows:
g T = T c T T c T o T T b T o T b T o T b T c T o ,
where g ( T ) represents the growth or development rate of the plant as a function of temperature, with T b , T o , and T c being the base, optimum, and ceiling temperatures, respectively [26]. In this study, these values were set to 5.5 °C, 23.4 °C, and 34.6 °C [17].
The dynamics of potato canopy cover can be divided into three stages: the canopy expansion phase, the maximum canopy coverage duration, and the canopy decline phase [17,18]. These stages can be described mathematically as follows:
v = ν m a x ( 1 + t 1 t t 1 t m 1 ) ( t t 1 ) t 1 t 1 t m 1 ,   with   0     t     t 1 ,
ν = ν m a x ,   with   t 1     t     t 2 ,
ν = ν m a x t e t t e t 2 t + t 1 t 2 t 1 t 1 t e t 2 , with   t 2     t     t e ,
In the formula above, ν represents the canopy cover as a decimal between 0 and 1, where ν = 0 means no cover and ν = 1 means full cover. t represents thermal time. The model includes five key parameters: t m 1 , t 1 , t 2 , t e , and ν m a x . t m 1 , t 1 , t 2 , and t e represent the thermal times corresponding to key points in the canopy development (the inflection point described in Equation (3), and the onset, maximum, and end of canopy cover, respectively). ν m a x represents the maximum canopy cover.
The main secondary parameters derived from the model were: the thermal days of maximum canopy cover duration (t2−t1); the thermal days of canopy senescence duration (te−t2); the maximum canopy growth rate (Cm1, Equation (6)); the integral area of the three phases under the canopy development curve (A1, A2, and A3); and the total integral area (Asum). When the thermal days reach te, the integral area (At) under the dynamic development curve of canopy cover versus thermal days equals Asum. Furthermore, AtI, AtII, AtIII, and AtIV represent the cumulative areas under the aforementioned curve for potato plants during the budding stage, full flowering stage, end of flowering stage, and leaf senescence stage, respectively. These cumulative areas correspond to the plant sampling time points described in Section 2.5.
C m 1 = 2 t 1 t m 1 t 1 ( t 1 t m 1 ) ( t m 1 t 1 ) t m 1 t 1 t m 1 v m a x

2.4. Determination of Net Photosynthetic Rate at the Leaf Level

We randomly selected and marked three healthy potato plants with representative growth in each experimental plot. Photosynthetic gas exchange parameters of the newest functional leaves on the marked plants were measured using a CIRAS-3 photosynthesis system (PP Systems, Amesbury, MA, USA) on sunny days during key growth stages from 8:30 A.M. to 11:30 A.M. The parameters were set as follows: light intensity of 1200 µmol m−2 s−1, leaf chamber temperature of 25 °C, and CO2 concentration of 400 µmol mol−1.

2.5. Determination of Total Plant Dry Weight and Tuber Yield

Plant samples were collected at four key growth stages, the budding stage, full flowering stage, end of flowering stage, and leaf senescence stage, which correspond to the BBCH (Biologische Bundesanstalt, Bundessortenamt and CHemical industry) scale stages 50, 65, 69, and 91, respectively. The BBCH scale is an internationally standardized system for describing the phenological development stages of plants. Eight plants per plot were sampled at the bud and full flowering stages, while four plants were sampled at the late flowering and senescence stages due to the larger size of the plants during these stages. To ensure representativeness, plants were selected from different parts of the plot. The sampled plants were immediately placed in an oven at 105 °C for 30 min for rapid drying, followed by drying at a constant 70 °C until completely dried. After drying, their dry weight was measured. Finally, the total dry weight per plant for each sampling period was calculated based on the number of destructively sampled plants. At harvest, the fresh tuber weight of each experimental plot was measured. To calculate tuber yield per plant, the total fresh tuber weight was divided by the number of plants remaining in each plot after accounting for the number of plants destructively sampled at planting and at specific intervals throughout the growing season. The yield was then standardized per plant by subtracting the sampled plants from the total planted population in each plot.

2.6. Data Analysis

The canopy development curves were fitted using Python software (version 3.10.9), and the resulting data were subjected to one-way analysis of variance and significance tests in IBM SPSS Statistics (version 27.0.1). Linear regression analysis and graphing were performed with Microsoft Excel (version 2016). R software (version 4.2.3) was used for path analysis, correlation analysis (Pearson correlation coefficient), and additional plotting. In the path model, the paths between variables represent causal relationships, with the direction of the arrows indicating the order of causality. The path coefficients represent the magnitude of influence one variable has on another. We calculated both direct and indirect effects using standardized path coefficients to further evaluate the relationships between the variables. The significance of each path was tested, and paths with a p-value less than 0.01 were considered statistically significant.

3. Results

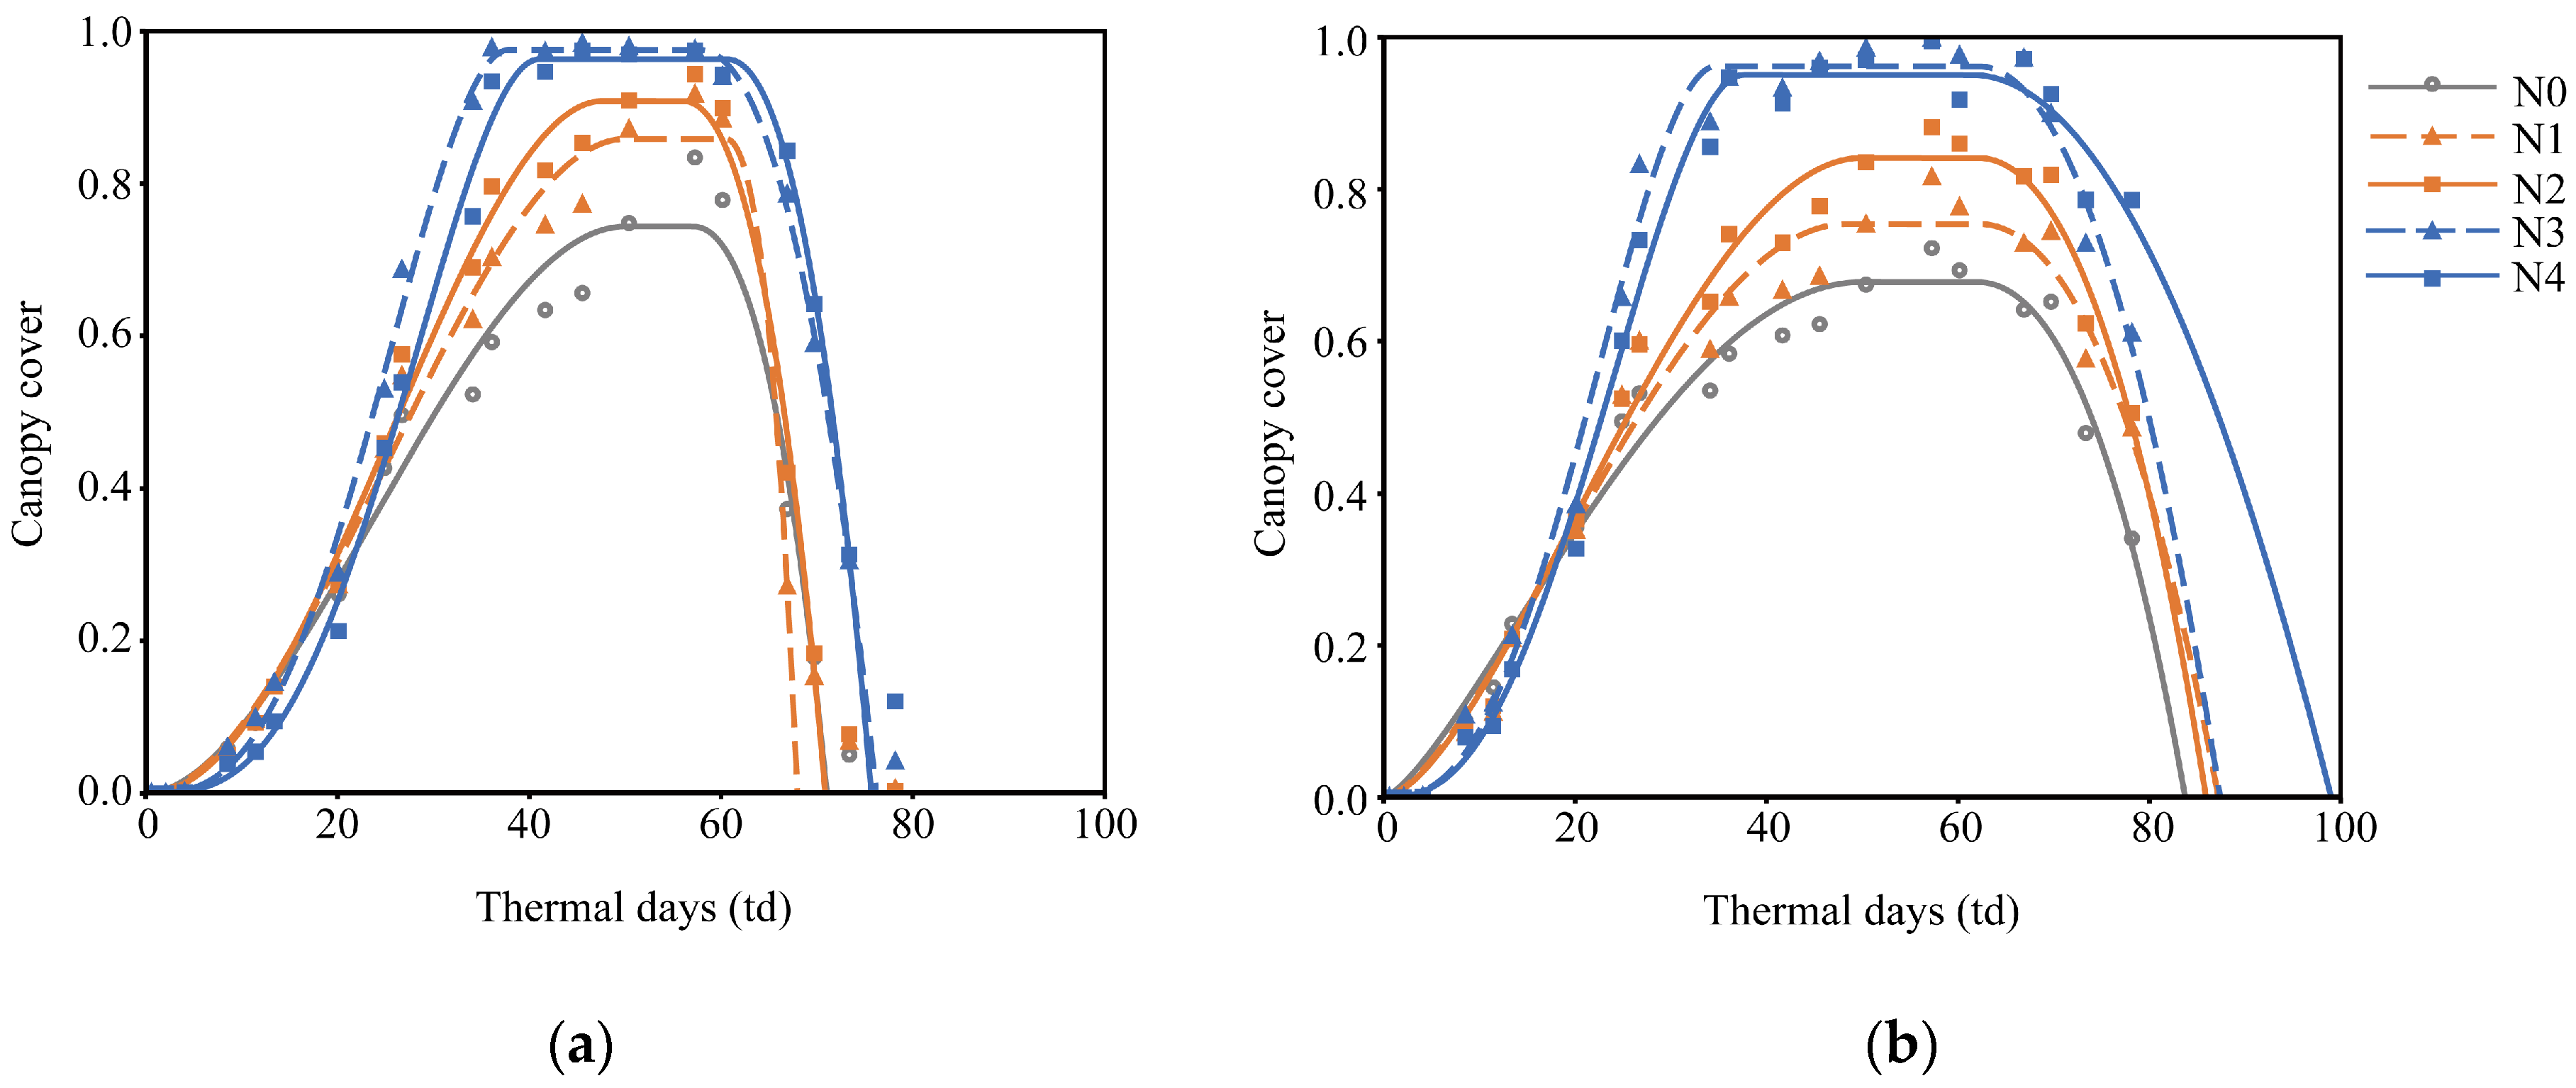
3.1. Parameters of Potato Canopy Development under Different Nitrogen Treatments

Figure 3 shows the fitted curves of potato canopy development under different nitrogen treatments, and it can be seen that there are obvious differences in the canopy development curves of ‘Shapody’ and ‘Zhongshu 18’ under different nitrogen treatments, especially under different nitrogen forms.

3.1.1. Primary Parameters

The analysis of the main parameters for the fitted canopy development curves of potato populations across all field experiment plots are presented in Table 1. It can be seen that different forms of nitrogen and application rates have significant effects on most parameters (p < 0.05). Both potato varieties, ‘Shapody’ and ‘Zhongshu 18’, showed the highest mean maximum canopy cover (Vmax) under the 150 kg ha−1 ammonium nitrogen (N3) treatment, with increases of 31.08% and 44.78%, respectively, compared to the control (N0).
Nitrogen fertilization delayed the thermal time (tm1) to reach the maximum canopy growth rate (Cm1) to varying degrees and prolonged the above-ground life cycle (te), with the most significant effects observed under the 300 kg ha−1 ammonium nitrogen (N4) treatment. Overall, the te value of the mid-to-late maturing variety ‘Shapody’ was lower than that of the late-maturing variety ‘Zhongshu 18’. Canopy decay thermal time (t2) did not differ significantly among nitrogen treatments, indicating that t2 is a relatively conservative parameter for a given cultivar. The thermal days (t1) required to reach Vmax for both varieties were significantly shortened (p < 0.05) under ammonium nitrogen treatment. The t1 value for the N3 treatment was the smallest, reduced by 12.88 td and 9.72 td, respectively, compared to the N0 treatment. This indicates that ammonium nitrogen can significantly promote potato populations to reach maximum canopy coverage earlier and delay the senescence of the above-ground parts of the plants.

3.1.2. Secondary Parameters

Compared to nitrogen application rates, different forms of nitrogen have a more significant effect on secondary parameters (Table 2). Cm1, t2−t1, te−t2, A2, A3, and Asum increased significantly under ammonium nitrogen treatment (p < 0.05), except for A1 which was greatly reduced. The Asum values of ‘Shapody’ and ‘Zhongshu 18’ reached their maximum under N3 and N4 treatments, respectively, increasing by 46.59% and 57.67% compared to the control group. This may be related to the duration of the fertility periods of these varieties.

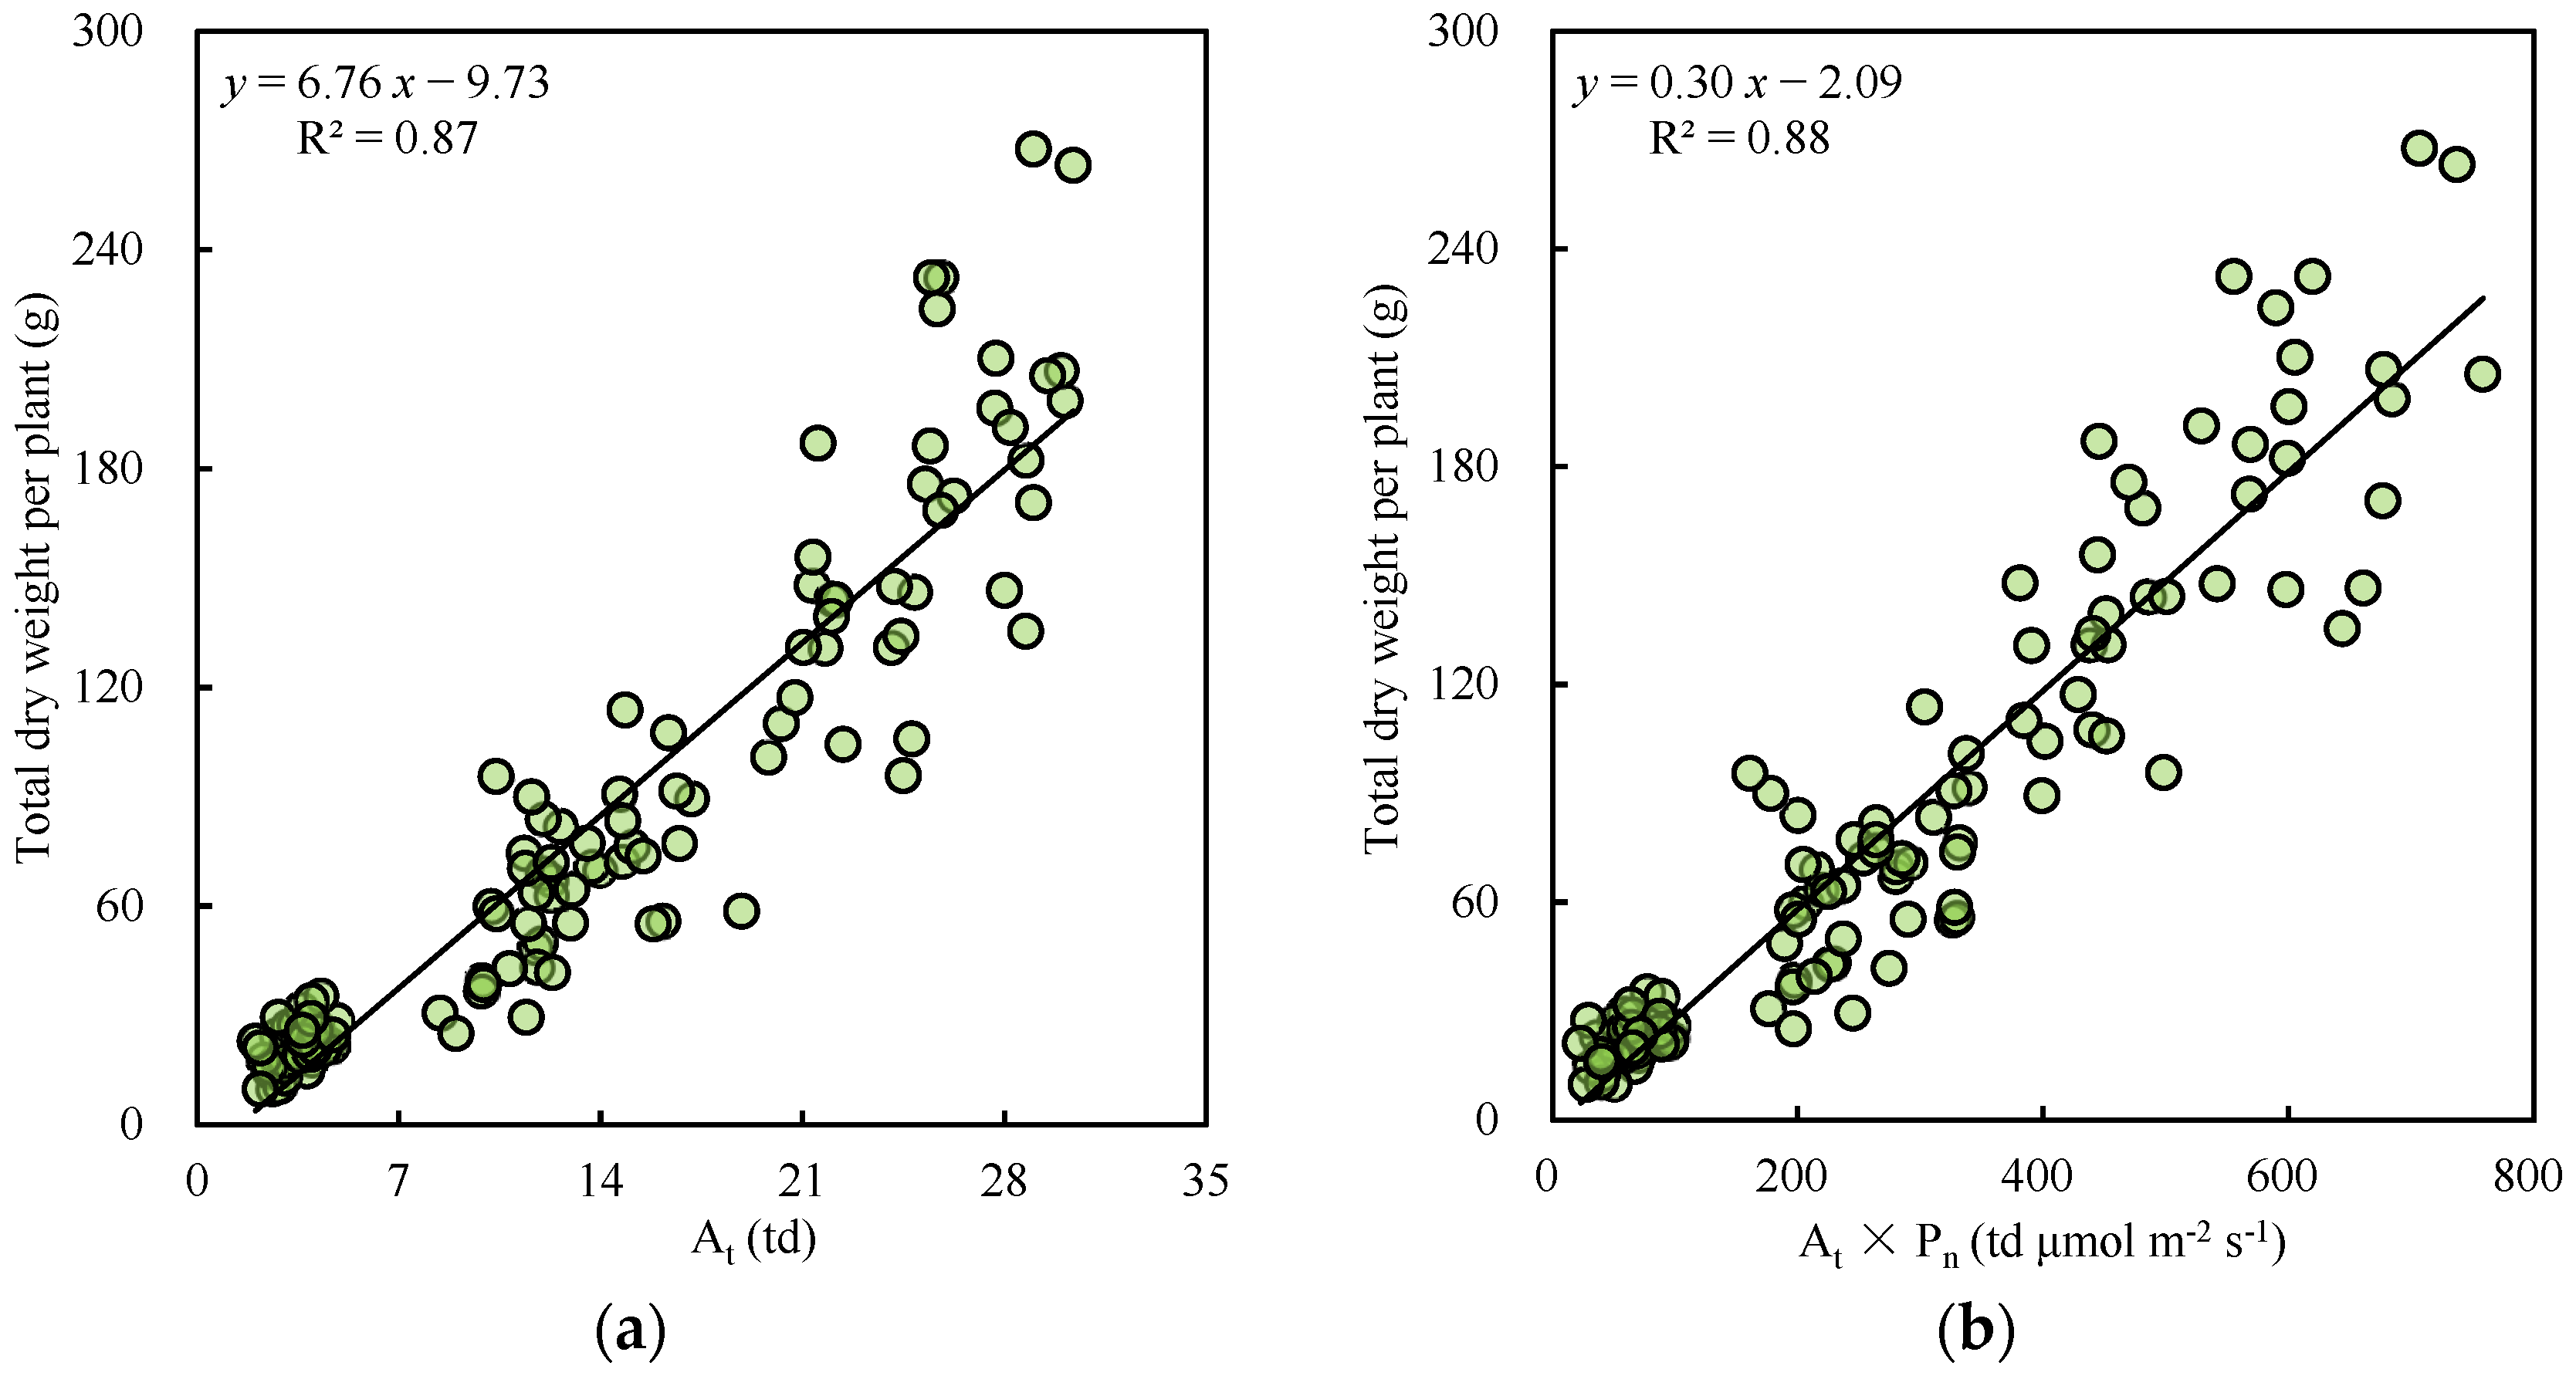
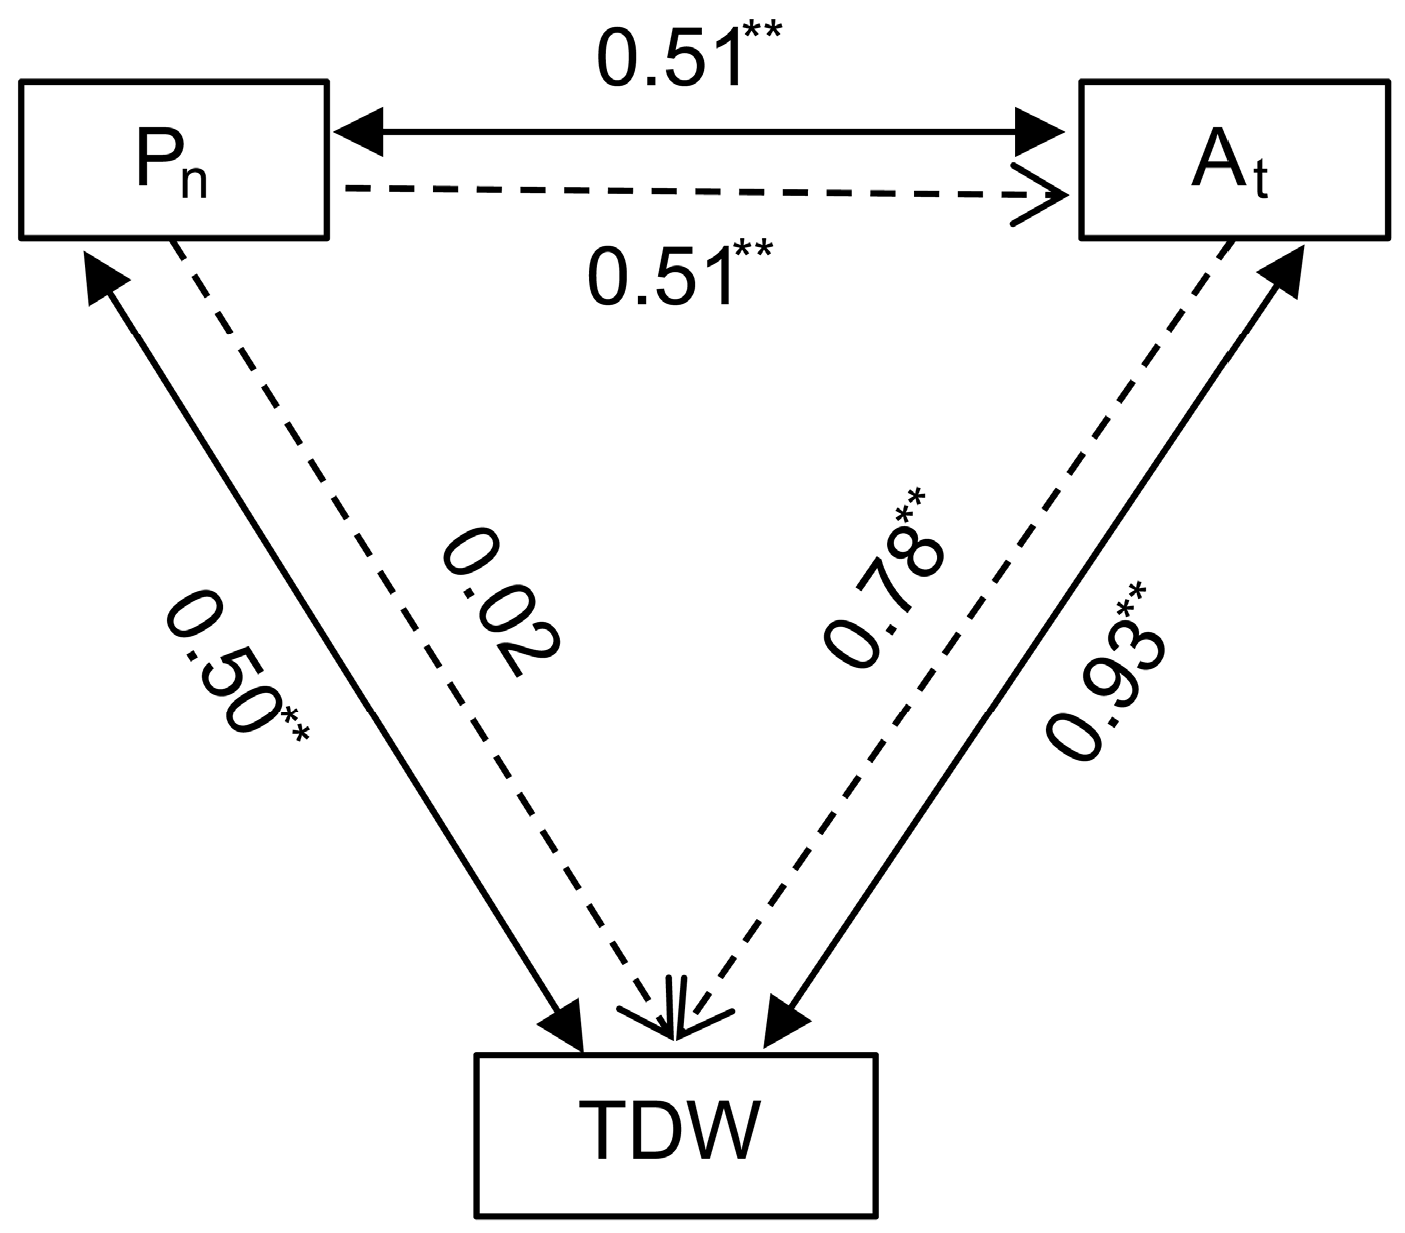
3.2. Relationship between Integral Area under Canopy Development Curve and Plant Dry Matter Accumulation

The relationship between total dry weight (TDW) of plants and area of integration (At) under the dynamic development curve of canopy cover with thermal time is shown in Figure 4a. The results indicate that At had a strong linear relationship with TDW, with a high coefficient of determination (R2) of 0.87. Compared to the single indicator At, the correlation between the composite indicator At × Pn, constructed using the net photosynthetic rate (Pn) at the leaf level, and TDW showed only a slight improvement (R2 = 0.88) (Figure 4b).
Correlation analysis revealed that Pn, At, and TDW all have a significant positive linear correlation (p < 0.01). To further clarify the direct and indirect effects of Pn and At on TDW, a path analysis was performed (Figure 5). The results showed that Pn had a significant positive effect on At (path coefficient = 0.51) and At on TDW (path coefficient = 0.78), while Pn had no significant direct effect on TDW (p < 0.01). This indicates that Pn mainly has an indirect effect on TDW by influencing At and then TDW.

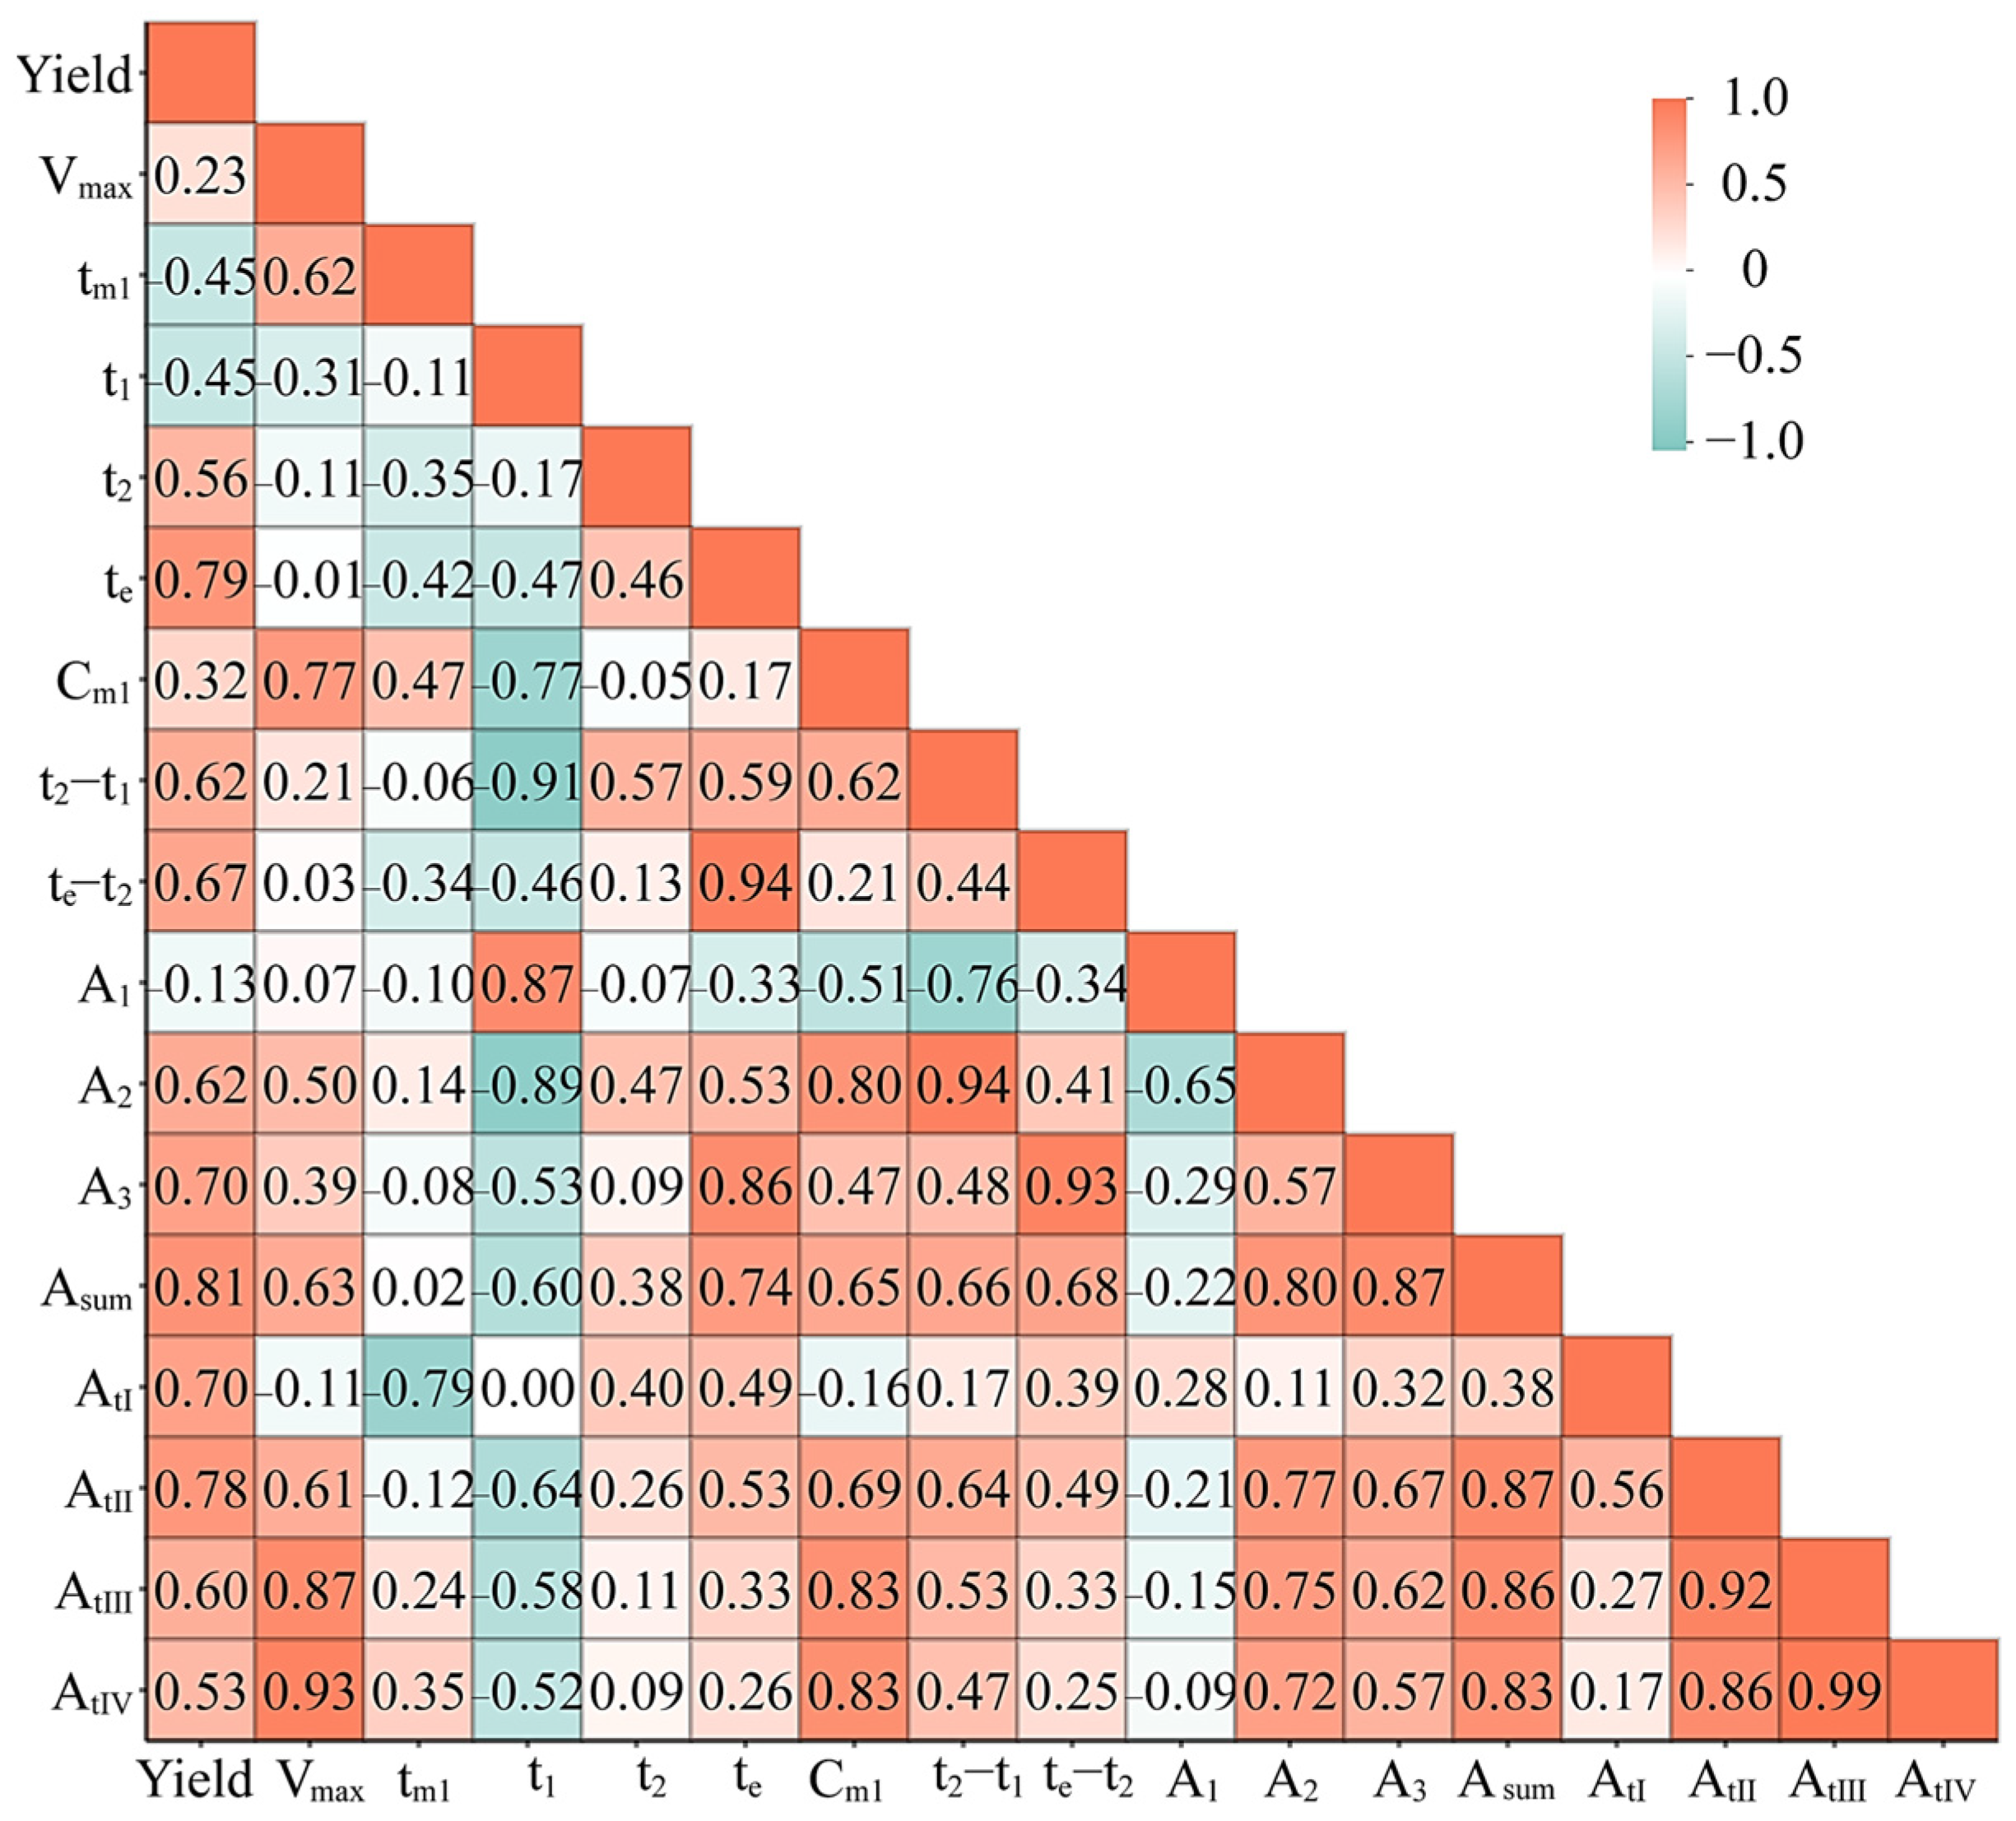
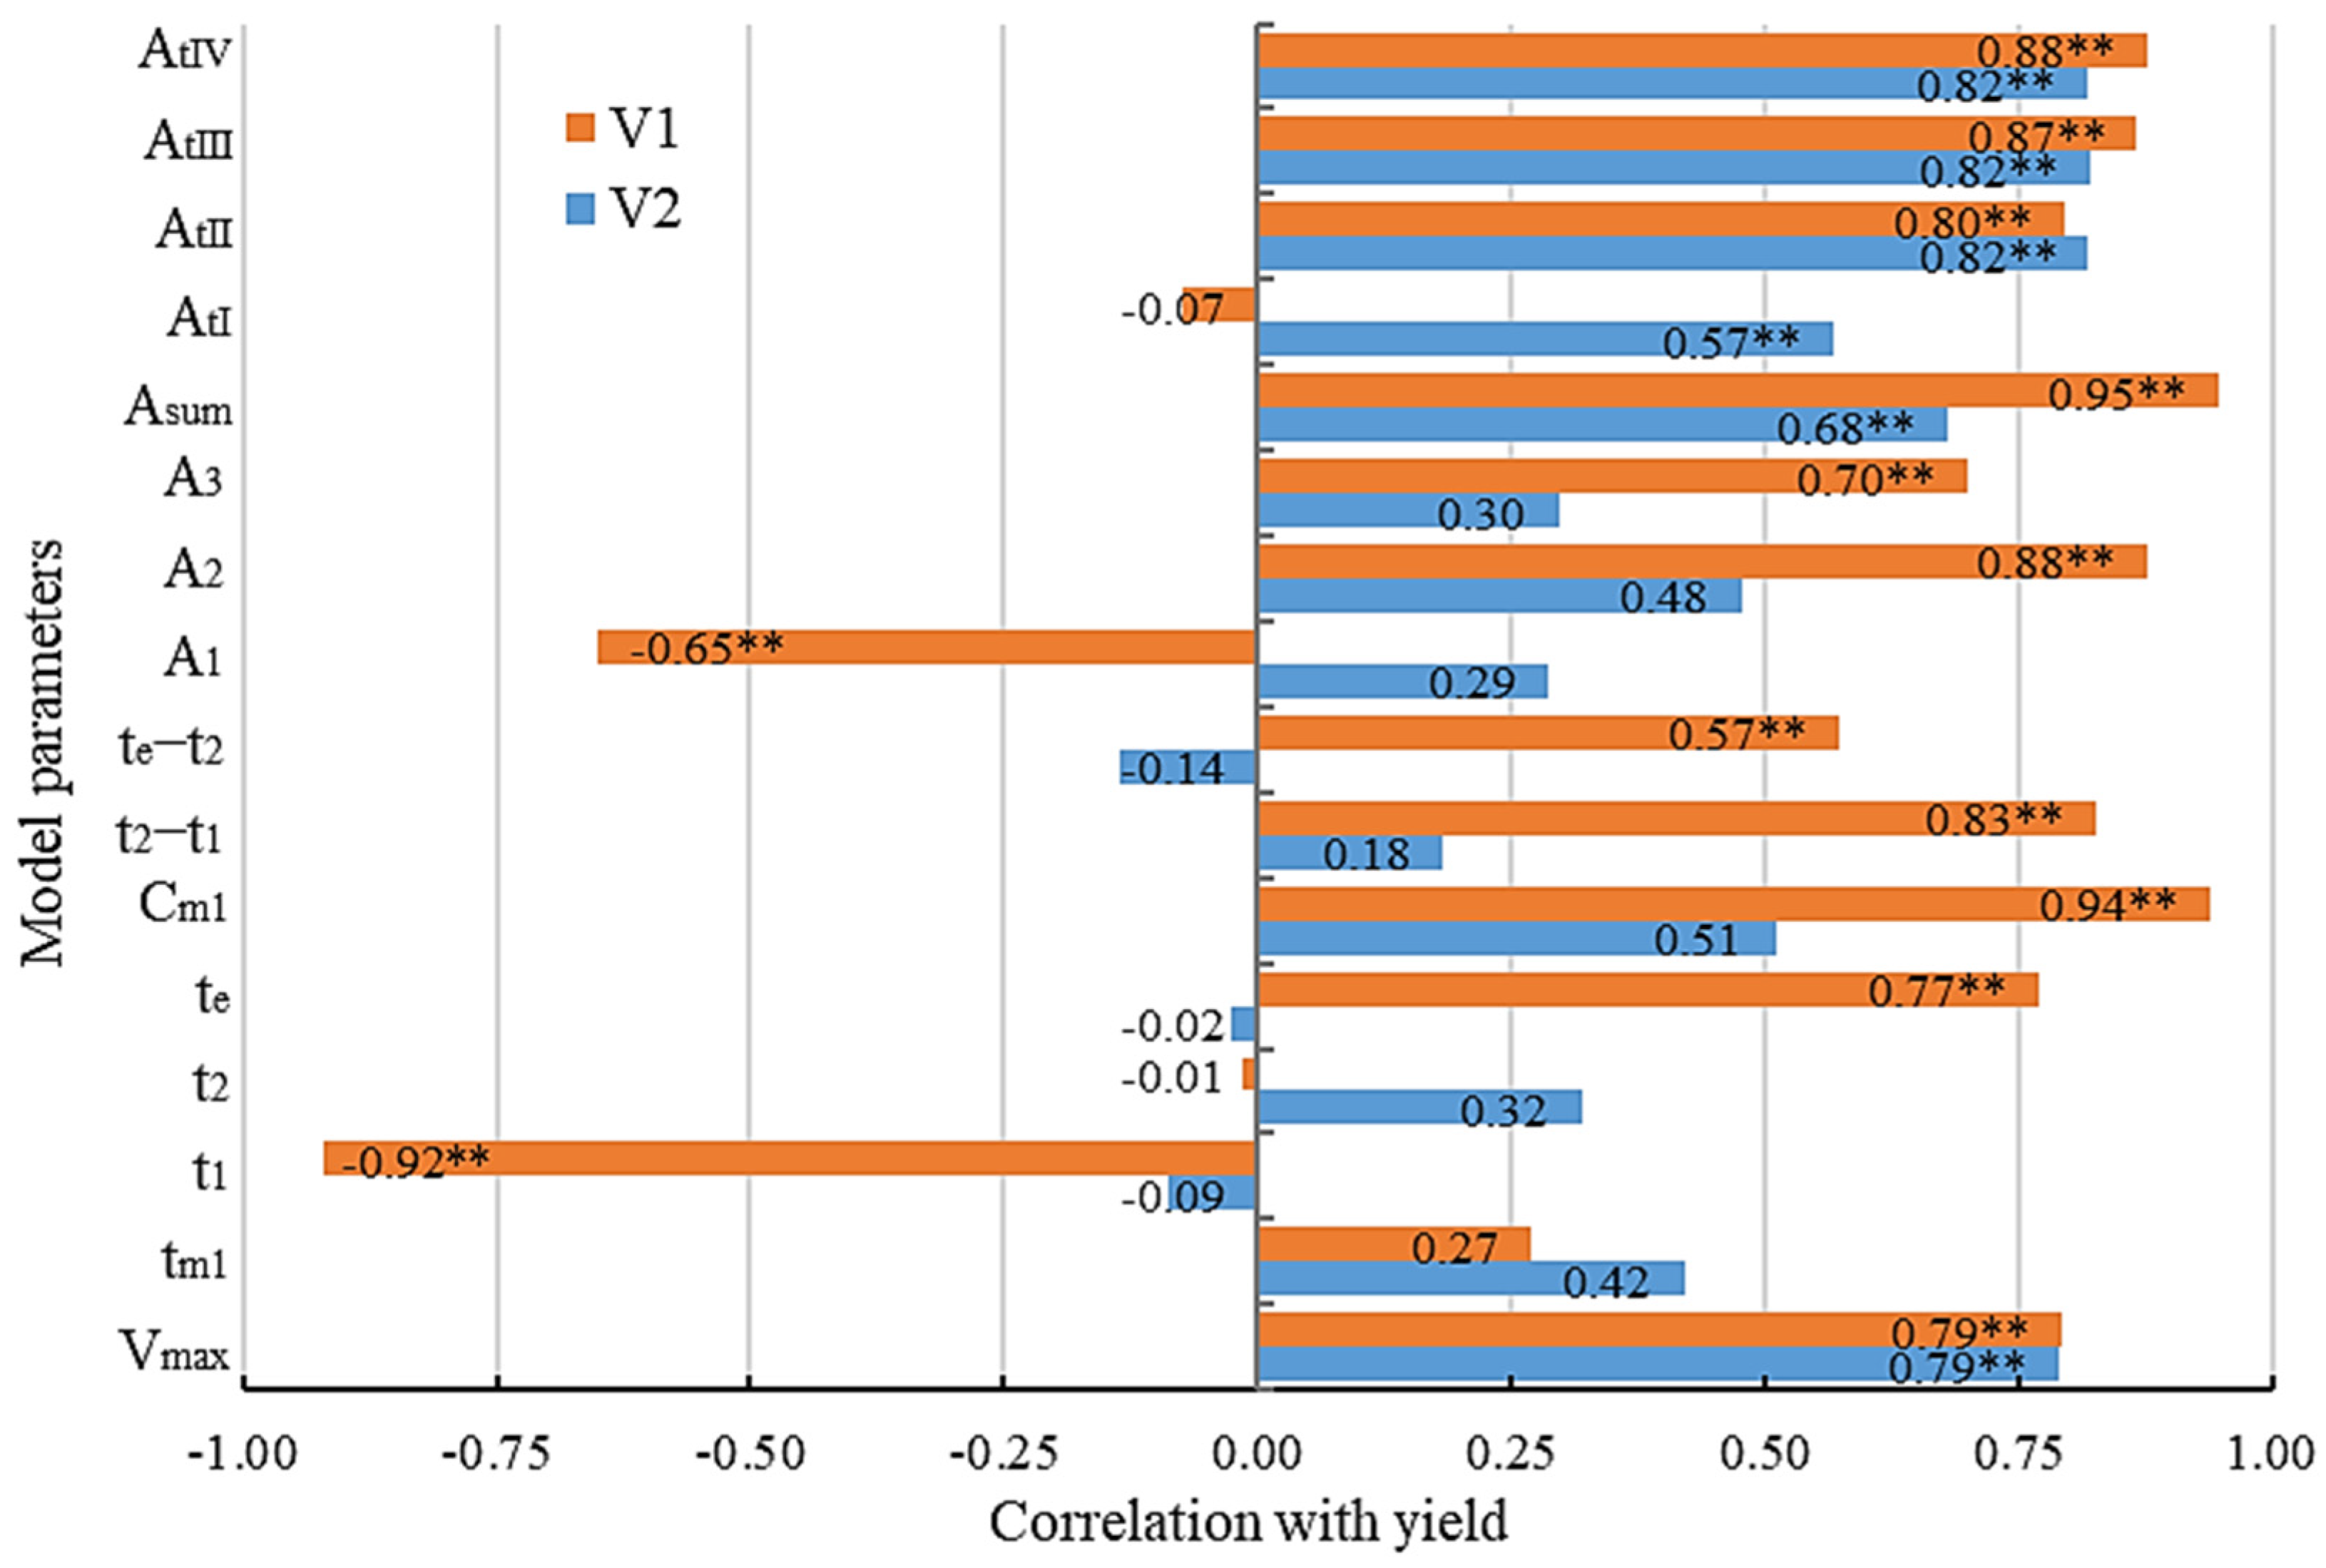
3.3. Relationship between Tuber Yield and Model Parameters

The correlation matrix of tuber yield with model parameters for all experimental plots is presented in Figure 6. It can be seen that tm1 and t1 had significant correlations with tuber yield, Vmax, Cm1, and A1 had no significant correlation with tuber yield, while all other model parameters had a significant positive correlation with tuber yield (p < 0.01). Among these, Asum, te, and the integral area of canopy coverage at full flowering stage with thermal time (AtII) had the strongest linear correlation with tuber yield, with Pearson correlation coefficients of 0.81, 0.79, and 0.78, respectively.
When analyzed separately by variety, the correlation between tuber yield and model parameters varied significantly (Figure 7). The results showed that Vmax, Asum, AtII, AtIII, and AtIV were significantly correlated with tuber yield for individual varieties (p < 0.01). Among these, the correlation coefficients of AtII, AtIII, and AtIV with tuber yield were all above 0.80. t1 and A1 were found to be significantly negatively correlated with tuber yield in variety ‘Shapody’, while te, Cm1, t2−t1, te−t2, A2, and A3 were significantly positively correlated with tuber yield in ‘Shapody’. However, these model parameters did not show significant correlations with tuber yield in ‘Zhongshu 18’. These indicate that Asum, AtII, AtIII, and AtIV are effective parameters for predicting potato yield performance for both single and mixed varieties.
To further analyze the extent to which the model parameters affected yield, we quantified the contribution of Vmax, AtII, AtIII, AtIV, and Asum to yield using path analysis (Table 3). It can be seen that Asum has the largest positive direct effect on yield (standardized coefficient of 0.73). Vmax, AtIII, and AtIV have negative direct and/or indirect effects on yield, while AtII has significant positive direct and indirect effects on yield, with the largest total effect (1.717). The above indicates that adjusting the variables Vmax, AtIII, and AtIV carries a higher risk and may have a negative impact on yield; increasing the integral area under the canopy development curve at peak flowering (AtII) is the most effective way to improve yield.

4. Discussion

4.1. Factors Affecting Canopy Development Parameters

Factors such as crop genotype, nitrogen supply, temperature, and water conditions significantly influence canopy development parameters [10,16]. Previous studies have shown that increasing nitrogen inputs can increase maximum canopy cover (Vmax) [6,24,25,26,27,28]. Our results further showed that the effect of different nitrogen forms on Vmax was more significant compared to the dose of nitrogen applied, where Vmax was higher under the 150 kg ha−1 ammonium nitrogen treatment than other treatments. Ospina et al. [27] found shorter t1 and longer t2 at high nitrogen fertilization levels, which is not completely consistent with the results of this study and may be due to different physiological response mechanisms of different genotypes to different forms of nitrogen.
Our study showed that high nitrogen levels, especially high doses of ammonium nitrogen, significantly prolonged te. The late-maturing variety ‘Zhongshu 18’ had significantly higher te and Asum than the mid-to-late maturing variety ‘Shapody’, which is similar to the findings of Ospina [16] and Tessema [17]. The above indicates that in addition to the amount of nitrogen applied, the form of the nitrogen is also an important factor influencing the model parameters.

4.2. Factors Affecting Plant Dry Matter Accumulation

Canopy light interception and radiation use efficiency are essential for improving dry matter accumulation and yield in field crops [29]. Previous studies have shown that changes in canopy cover can reflect the light interception capacity of plants during the growing season [30,31,32]. Our results further demonstrated that the integral area (At) of canopy cover over thermal days had a significant direct effect on plant dry matter accumulation, showing a strong linear relationship between the two.
Radiation use efficiency (RUE) is an important measure of the dry matter produced by a plant per unit of light energy [16]. RUE is strongly correlated with net photosynthetic rate under different environmental conditions [33,34]. Previous studies have found that although net photosynthetic rate (Pn) at the leaf level varies significantly under some conditions, its direct effect on total dry weight of the whole plant is not significant, while total net CO2 assimilation of the plant and dry weight yield are closely related, and temperature and leaf area index are the most important factors affecting RUE [34,35,36]. Our results showed that the correlation with total plant dry weight was only slightly improved by combining Pn with At data. This may be due to the fact that leaf-level Pn does not fully represent the net photosynthetic capacity of the population canopy, and Pn varies significantly at different growth stages of the crop and at different times of the day.

4.3. Relationship between Model Parameters and Tuber Yield

Vmax is closely related to tuber yield, and a high Vmax usually means that the plant is able to intercept more light, thereby increasing the accumulation of photosynthetic products and yield [10,18]. Our results showed that Vmax was significantly and positively correlated with tuber yield for single varieties, whereas there was no significant correlation between Vmax and tuber yield for mixed varieties. Khan [18] found a significant positive correlation between Cm1 and tuber dry weight. The canopy development parameters DP2 (i.e., t2−t1) and te under drought conditions significantly affected yield, with longer DP2 and later te contributing to higher yield under drought conditions [11]. However, our results showed that the strength of the correlation between Cm1, t2−t1, and te with yield was closely related to varieties, suggesting that while canopy development dynamics are closely related to light interception, the correlation of most canopy development parameters with tuber yield can be strongly influenced by genetic characteristics of different varieties.
In our study, Asum was highly positively correlated with tuber yield, which is consistent with the findings of Khan et al. [18,37] and Ospina et al. [27]. Furthermore, our results showed that although Asum had the greatest positive direct effect on yield, AtII had the largest total effect on yield. This suggests that increasing the integrated area of canopy cover over time during the peak flowering period of potatoes is the optimal strategy to improve yield. However, it is important to note that while our findings demonstrated the effects of nitrogen treatments on canopy development and tuber yield, other environmental factors—such as temperature [38], soil moisture [39], irrigation practices, and soil properties [40]—may also influence canopy growth and yield. These factors could lead to variations in results despite consistent nitrogen treatments, highlighting the limitations of our study.

5. Conclusions

In this study, we developed a potato canopy development model based on canopy cover data extracted from UAV RGB imagery, from which we can draw the following conclusions: (1) The model accurately characterizes the potato canopy growth patterns under different combinations of nitrogen application rates and forms and quantifies the differences in canopy development parameters. Most model parameters were more sensitive to nitrogen application forms than to application rates. Specifically, ammonium nitrogen significantly increased the values of Vmax, te, Cm1, t2−t1, te−t2, A2, A3, and Asum, while the values of t1 and A1 decreased significantly; (2) the parameter At showed a significant positive correlation with plant dry matter accumulation, indicating that the integral area of canopy cover over thermal time is a reliable predictor of plant dry matter status; (3) the integral area of canopy cover during the peak flowering stage of potato had a significant total effect on yield. Therefore, we speculate that increasing the integral area during this critical period, through optimized nitrogen management and other agronomic practices, could effectively improve potato yield.
In the future, we can further explore the optimal combination of nitrogen application forms and doses for potatoes at each growth stage and improve the applicability and predictive accuracy of the model through refined optimization, integrated management practices, and long-term experimental validation.

Author Contributions

Conceptualization, J.L. and Y.Y.; formal analysis, investigation, methodology, visualization, and writing—original draft preparation, Y.Y.; writing—review and editing, H.G., L.J., J.L. and Y.Y.; funding acquisition, J.L. and H.G.; resources, L.J. and C.B.; supervision, H.G. All authors have read and agreed to the published version of the manuscript.

Funding

This work was supported by the National Natural Science Foundation of China (32260543, 32372232), the National Key R&D Program of China (2023YFD2302100), earmarked funds for CARS (CARS-09-P15 and P12), and the Major Science and Technology Special Programs of Yunnan Province, China (202402AE09001702).

Data Availability Statement

Data are contained within the article.

Conflicts of Interest

The authors declare no conflict of interest.

References

  1. De Jong, H. Impact of the Potato on Society. Am. J. Potato Res. 2016, 5, 415–429. [Google Scholar] [CrossRef]
  2. Tiwari, J.K.; Plett, D.; Garnett, T.; Chakrabarti, S.K.; Singh, R.K. Integrated Genomics, Physiology and Breeding Approaches for Improving Nitrogen Use Efficiency in Potato: Translating Knowledge from Other Crops. Funct. Plant Biol. 2018, 45, 587. [Google Scholar] [CrossRef] [PubMed]
  3. Saluzzo, J.A.; Echeverría, H.E.; Andrade, F.H.; Huarte, M. Nitrogen Nutrition of Potato Cultivars Differing in Maturity. J. Agron. Crop Sci. 1999, 183, 157–165. [Google Scholar] [CrossRef]
  4. Alva, L. Potato Nitrogen Management. J. Veg. Crop Prod. 2004, 10, 97–132. [Google Scholar] [CrossRef]
  5. Huangfu, L. Effects of Water Supply and Nitrogen Forms on Nitrogen Uptake and Utilization, Yield and Quality of Potato. Master’s Thesis, Jilin Agricultural University, Changchun, China, 2023. [Google Scholar]
  6. Ayyub, C.; Haidar, M.; Zulfiqar, F.; Abideen, Z.; Wright, S. Potato Tuber Yield and Quality in Response to Different Nitrogen Fertilizer Application Rates under Two Split Doses in an Irrigated Sandy Loam Soil. J. Plant Nutr. 2019, 42, 1850–1860. [Google Scholar] [CrossRef]
  7. Lorenz, O.A.; Bishop, J.C.; Hoyle, B.J.; Zobel, M.P.; Minges, P.A.; Doneen, L.D.; Ulrich, A. Potato Fertilizer Experiment in California. Calif. Agric. Exp. Stn. Bull. 1954, B0744, 7. [Google Scholar]
  8. Wang, S. Effects of Different Nitrogen Forms on Potato Growth and Soil Microecology. Master’s Thesis, Hunan Agricultural University, Changsha, China, 2021. [Google Scholar]
  9. Kukal, M.S.; Irmak, S. Comparative Canopy Growth Dynamics in Four Row Crops and Their Relationships with Allometric and Environmental Determinants. Agron. J. 2019, 111, 1799–1816. [Google Scholar] [CrossRef]
  10. Khan, M.S.; Struik, P.C.; van der Putten, P.E.; Jansen, H.J.; van Eck, H.J.; van Eeuwijk, F.A.; Yin, X. A Model-Based Approach to Analyse Genetic Variation in Potato Using Standard Cultivars and a Segregating Population. I. Canopy Cover Dynamics. Field Crops Res. 2019, 242, 107581. [Google Scholar] [CrossRef]
  11. Aliche, E.B.; Oortwijn, M.; Theeuwen, T.P.J.M.; Bachem, C.W.B.; Visser, R.G.F.; van der Linden, C.G. Drought Response in Field Grown Potatoes and the Interactions between Canopy Growth and Yield. Agric. Water Manag. 2018, 206, 20–30. [Google Scholar] [CrossRef]
  12. Minda, T.T. Weather and Crop Dynamics in a Complex Terrain, the Gamo Highlands–Ethiopia: Towards a High-Resolution and Model-Observation Based Approach. Ph.D. Thesis, Wageningen University and Research, Wageningen, The Netherlands, 2019. [Google Scholar]
  13. Minda, T.T.; Van Der Molen, M.K.; Vilà-Guerau de Arellano, J.; Chulda, K.C.; Struik, P.C. Responses of Canopy Growth and Yield of Potato Cultivars to Weather Dynamics in a Complex Topography: Belg Farming Seasons in the Gamo Highlands, Ethiopia. Agronomy 2019, 9, 163. [Google Scholar] [CrossRef]
  14. Oliveira, J.S.; Brown, H.E.; Moot, D.J. Assessing Potato Canopy Growth and Development at the Individual Leaf Level to Improve the Understanding of the Plant Source–Sink Relations. N. Z. J. Crop Hortic. Sci. 2021, 49, 325–346. [Google Scholar] [CrossRef]
  15. Liu, G.; Yang, Y.; Guo, X.; Liu, W.; Xie, R.; Ming, B.; Xue, J.; Wang, K.; Li, S.; Hou, P. A Global Analysis of Dry Matter Accumulation and Allocation for Maize Yield Breakthrough from 1.0 to 25.0 Mg Ha−1. Resour. Conserv. Recycl. 2023, 188, 106656. [Google Scholar] [CrossRef]
  16. Ospina Nieto, C.A. Nitrogen Use Efficiency in Potato: An Integrated Agronomic, Physiological and Genetic Approach. Ph.D. Thesis, Wageningen University, Wageningen, The Netherlands, 2016. [Google Scholar]
  17. Tessema, B.B. Genetic Studies towards Elucidation of Drought Tolerance of Potato. Ph.D. Thesis, Wageningen University and Research, Wageningen, The Netherlands, 2017. [Google Scholar]
  18. Khan, M.S. Assessing Genetic Variation in Growth and Development of Potato. Ph.D. Thesis, Wageningen University and Research, Wageningen, The Netherlands, 2012. [Google Scholar]
  19. Struik, P.C.; Haverkort, A.J.; Vreugdenhil, D.; Bus, C.B.; Dankert, R. Manipulation of Tuber-Size Distribution of a Potato Crop. Potato Res. 1990, 33, 417–432. [Google Scholar] [CrossRef]
  20. Vos, J. Nitrogen Responses and Nitrogen Management in Potato. Potato Res. 2009, 52, 305–317. [Google Scholar] [CrossRef]
  21. Vicente-Guijalba, F.; Martinez-Marin, T.; Lopez-Sanchez, J.M. Dynamical Approach for Real-Time Monitoring of Agricultural Crops. IEEE Trans. Geosci. Remote Sens. 2015, 53, 3278–3293. [Google Scholar] [CrossRef]
  22. Tattaris, M.; Reynolds, M.P.; Chapman, S.C. A Direct Comparison of Remote Sensing Approaches for High-Throughput Phenotyping in Plant Breeding. Front. Plant Sci. 2016, 7, 1131. [Google Scholar] [CrossRef] [PubMed]
  23. Leo, S.; De, M.; Nguyen, T.H.; Grace, P.R. Combining Remote Sensing-Derived Management Zones and an Auto-Calibrated Crop Simulation Model to Determine Optimal Nitrogen Fertilizer Rates. Agric. Syst. 2023, 205, 103559. [Google Scholar] [CrossRef]
  24. dos Santos, L.M.; Ferraz, G.A.E.S.; Barbosa, B.D.D.S.; Diotto, A.V.; Maciel, D.T.; Xavier, L.A.G. Biophysical parameters of coffee crop estimated by UAV RGB images. Precis. Agric. 2020, 21, 1227–1241. [Google Scholar] [CrossRef]
  25. Poley, L.G.; McDermid, G.J. A systematic review of the factors influencing the estimation of vegetation aboveground biomass using unmanned aerial systems. Remote Sens. 2020, 12, 1052. [Google Scholar] [CrossRef]
  26. Yin, X. Model Analysis of Flowering Phenology in Recombinant Inbred Lines of Barley. J. Exp. Bot. 2005, 56, 959–965. [Google Scholar] [CrossRef]
  27. Ospina, C.A.; Lammerts van Bueren, E.T.; Allefs, J.J.H.M.; Engel, B.; van der Putten, P.E.L.; van der Linden, C.G.; Struik, P.C. Diversity of Crop Development Traits and Nitrogen Use Efficiency among Potato Cultivars Grown under Contrasting Nitrogen Regimes. Euphytica 2014, 199, 13–29. [Google Scholar] [CrossRef]
  28. Ospina Nieto, C.A.; Lammerts van Bueren, E.T.; Allefs, S.; Vos, P.G.; Van Der Linden, G.; Maliepaard, C.A.; Struik, P.C. Association Mapping of Physiological and Morphological Traits Related to Crop Development under Contrasting Nitrogen Inputs in a Diverse Set of Potato Cultivars. Plants 2021, 10, 1727. [Google Scholar] [CrossRef] [PubMed]
  29. Craufurd, P.Q.; Wheeler, T.R. Effect of Drought and Plant Density on Radiation Interception, Radiation-Use Efficiency and Partitioning of Dry Matter to Seeds in Cowpea. Exp. Agric. 1999, 35, 309–325. [Google Scholar] [CrossRef]
  30. Haverkort, A.J.; Uenk, D.; Veroude, H.; Van De Waart, M. Relationships between Ground Cover, Intercepted Solar Radiation, Leaf Area Index and Infrared Reflectance of Potato Crops. Potato Res. 1991, 34, 113–121. [Google Scholar] [CrossRef]
  31. Boyd, N.S.; Gordon, R.; Martin, R.C. Relationship between Leaf Area Index and Ground Cover in Potato under Different Management Conditions. Potato Res. 2002, 45, 117–129. [Google Scholar] [CrossRef]
  32. Praharaj, C.S.; Govindakrishnan, P.M.; Lal, S.S. Dry Matter Distribution in Potato Genotypes as Affected by Physiological Degree Days. Potato J. 2010, 37, 138–142. [Google Scholar]
  33. Muchow, R.C.; Robertson, M.J.; Pengelly, B.C. Radiation-Use Efficiency of Soybean, Mugbean and Cowpea under Different Environmental Conditions. Field Crops Res. 1993, 32, 1–16. [Google Scholar] [CrossRef]
  34. Choudhury, B.J. A Sensitivity Analysis of the Radiation Use Efficiency for Gross Photosynthesis and Net Carbon Accumulation by Wheat. Agric. For. Meteorol. 2000, 101, 217–234. [Google Scholar] [CrossRef]
  35. Peterson, R.B.; Zelitch, I. Relationship between Net CO2 Assimilation and Dry Weight Accumulation in Field-Grown Tobacco. Plant Physiol. 1982, 70, 677–685. [Google Scholar] [CrossRef]
  36. Schaffer, B.; Bar den, J.A.; Williams, J.M. Whole Plant Photosynthesis and Dry-Matter Partitioning in Fruiting and Deblossomed Day-Neutral Strawberry Plants. J. Am. Soc. Hortic. Sci. 1986, 111, 430–433. [Google Scholar] [CrossRef]
  37. Khan, M.S.; van Eck, H.J.; Struik, P.C. Model-Based Evaluation of Maturity Type of Potato Using a Diverse Set of Standard Cultivars and a Segregating Diploid Population. Potato Res. 2013, 56, 127–146. [Google Scholar] [CrossRef]
  38. Lee, Y.; Sang, W.; Baek, J.; Kim, J.; Shin, P.; Seo, M.; Cho, J. The Effect of Concurrent Elevation in CO2 and Temperature on the Growth, Photosynthesis, and Yield of Potato Crops. PLoS ONE 2020, 15, e0241081. [Google Scholar] [CrossRef] [PubMed]
  39. El-Mageed, H.; Ibrahim, M.; Elbeltagi, A. The Effect of Water Stress on Nitrogen Status as Well as Water Use Efficiency of Potato Crop Under Drip Irrigation System. Misr J. Agric. Eng. 2017, 34, 1351–1374. [Google Scholar] [CrossRef]
  40. Ahmadi, S.; Andersen, M.; Lærke, P.; Plauborg, F.; Sepaskhah, A.; Jensen, C.; Hansen, S. Interaction of Different Irrigation Strategies and Soil Textures on the Nitrogen Uptake of Field Grown Potatoes. Int. J. Plant Prod. 2011, 5, 263–274. [Google Scholar] [CrossRef]
Figure 1. Layout of field experiment at Zhangjiakou test site, China, and a diagram of plot splitting and background removal. V1: ‘Shapody’, V2: ‘Zhongshu 18’; N0: control, N1: 150 kg ha−1 KNO3, N2: 300 kg ha−1 KNO3, N3: 150 kg ha−1 (NH4)2SO4, N4: 300 kg ha−1 (NH4)2SO4.
Agronomy 14 02257 g001
Figure 2. Fitted curve of potato canopy dynamic development (adapted from Khan [18]). Vmax: maximum canopy cover; A1, A2, A3: areas under individual curve segments; tm1: inflection point during canopy expansion; t1: duration of canopy expansion; t2: onset of canopy senescence; te: the time point when canopy cover is zero.
Agronomy 14 02257 g002
Figure 3. Fitted curves of canopy development of two potato varieties under different nitrogen application rates and forms. (a) ‘Shapody’; (b) ‘Zhongshu 18’. N0: control, N1: 150 kg ha−1 KNO3, N2: 300 kg ha−1 KNO3, N3: 150 kg ha−1 (NH4)2SO4, N4: 300 kg ha−1 (NH4)2SO4.
Agronomy 14 02257 g003
Figure 4. Relationship between the total dry weight of the potato plants and At (a), and At × Pn (b). At: area under the canopy curve; Pn: the net photosynthetic rate.
Agronomy 14 02257 g004
Figure 5. Relationships between the net photosynthetic rate (Pn), area under the canopy curve (At), and total dry weight (TDW). Solid lines indicate the correlation coefficients between the two variables, and dashed lines indicate the path coefficients from the predictor variables to the response variable. ** indicates significant differences at the 0.01 level.
Agronomy 14 02257 g005
Figure 6. Pearson’s correlation coefficient matrix of yield and model parameters for all experimental plots. Vmax: maximum canopy cover; tm1: inflection point during canopy expansion; t1: duration of canopy expansion; t2: onset of canopy senescence; te: the time point when canopy cover is zero; Cm1: maximum growth rate during canopy expansion; t2−t1: duration of maximum canopy cover; te−t2: duration of canopy senescence; A1, A2, A3: areas under individual curve segments; Asum: integrated ground cover. AtI, AtII, AtIII, and AtIV: area under the canopy curve for the budding, peak flowering, final flowering, stem and leaf senescence stages, respectively.
Agronomy 14 02257 g006
Figure 7. Comparison of yield correlations with model parameters for two varieties. V1: ‘Shapody’; V2: ‘Zhongshu 18’. Vmax: maximum canopy cover; tm1: inflection point during canopy expansion; t1: duration of canopy expansion; t2: onset of canopy senescence; te: the time point when canopy cover is zero; Cm1: maximum growth rate during canopy expansion; t2−t1: duration of maximum canopy cover; te−t2: duration of canopy senescence; A1, A2, A3: areas under individual curve segments; Asum: integrated ground cover. AtI, AtII, AtIII, and AtIV: area under the canopy curve for the budding, peak flowering, final flowering, stem and leaf senescence stages, respectively. ** represents a significant correlation at the 0.01 level.
Agronomy 14 02257 g007
Table 1. Results of the fitting analysis of the primary parameters of the potato canopy development model.
VarietiesTreatmentsVmaxtm1t1t2te
‘Shapody’N00.74 ± 0.06 de23.76 ± 0.92 bc50.00 ± 0.00 a58.93 ± 1.21 abc70.56 ± 0.95 e
N10.86 ± 0.04 abc25.05 ± 1.09 b50.00 ± 0.00 a59.66 ± 1.89 abc69.30 ± 1.92 e
N20.91 ± 0.04 ab25.91 ± 0.81 b47.12 ± 1.82 ab56.06 ± 0.84 c70.89 ± 0.31 e
N30.98 ± 0.00 a25.65 ± 0.73 b37.12 ± 1.14 de57.90 ± 1.84 bc76.26 ± 0.90 d
N40.97 ± 0.01 a28.35 ± 0.21 a41.13 ± 0.48 cd59.80 ± 1.15 abc76.61 ± 1.60 d
‘Zhongshu 18’N00.67 ± 0.06 e15.59 ± 1.21 f45.25 ± 2.97 abc62.34 ± 1.11 ab84.27 ± 1.35 c
N10.75 ± 0.06 cde18.82 ± 1.05 e44.00 ± 4.06 bc63.08 ± 1.45 a86.86 ± 0.79 bc
N20.84 ± 0.06 bcd20.09 ± 0.82 de48.08 ± 1.31 ab61.74 ± 1.92 ab89.53 ± 4.27 b
N30.97 ± 0.01 a22.33 ± 0.34 cd35.53 ± 2.06 e61.59 ± 0.50 ab88.59 ± 2.44 bc
N40.95 ± 0.00 ab24.13 ± 0.89 bc36.47 ± 1.87 de62.91 ± 1.24 a96.81 ± 1.94 a
Bolded data are maximum values under all treatments of the variety and italicized data are minimum values. Same lowercase letters indicate no significant difference at the p < 0.05 level. Vmax: maximum canopy cover; tm1: inflection point during canopy expansion; t1: duration of canopy expansion; t2: onset of canopy senescence; te: the time point when canopy cover is zero.
Table 2. Results of the fitting analysis of the secondary parameters of the potato canopy development model.
VarietiesTreatmentsCm1t2−t1te−t2A1A2A3Asum
‘Shapody’N00.02 ± 0.00 cd8.93 ± 1.21 e11.63 ± 1.80 ef19.04 ± 1.62 abc6.75 ± 1.23 e5.90 ± 0.69 f31.68 ± 2.31 e
N10.03 ± 0.00 cd9.66 ± 1.89 e9.64 ± 3.81 f21.48 ± 0.95 a8.16 ± 1.48 e6.03 ± 2.59 ef35.67 ± 1.98 de
N20.03 ± 0.00 c8.95 ± 1.14 e14.82 ± 0.84 def20.14 ± 0.44 ab8.25 ± 1.33 e9.42 ± 0.78 def37.82 ± 1.76 cd
N30.05 ± 0.00 a20.78 ± 2.48 abc18.36 ± 2.02 cde13.83 ± 0.64 c20.27 ± 2.39 ab12.33 ± 1.36 cd46.44 ± 1.27 b
N40.04 ± 0.00 b18.67 ± 1.36 cd16.82 ± 2.10 cdef15.21 ± 0.54 bc18.01 ± 1.20 bc11.26 ± 1.45 cd44.47 ± 1.30 b
‘Zhongshu 18’N00.02 ± 0.00 d17.10 ± 2.93 cd21.93 ± 2.24 bcd17.46 ± 2.89 abc11.00 ± 1.35 de10.00 ± 1.23 de38.46 ± 3.36 cd
N10.03 ± 0.00 cd19.09 ± 4.67 bcd23.77 ± 1.00 bc17.72 ± 3.25 abc13.78 ± 2.76 cd12.18 ± 1.32 cd43.67 ± 3.51 bc
N20.03 ± 0.00 cd13.67 ± 2.50 de27.79 ± 5.42 ab21.65 ± 2.04 a11.51 ± 2.25 de15.14 ± 1.82 bc48.29 ± 1.70 b
N30.05 ± 0.00 ab26.06 ± 1.87 ab27.00 ± 2.91 ab14.58 ± 1.74 bc25.18 ± 1.68 a17.60 ± 1.74 ab57.36 ± 1.45 a
N40.05 ± 0.00 ab26.44 ± 2.82 a33.90 ± 1.07 a13.97 ± 0.99 c25.13 ± 2.73 a21.54 ± 0.65 a60.64 ± 2.19 a
Bolded data are maximum values under all treatments of the variety and italicized data are minimum values. Same lowercase letters indicate no significant difference at the p < 0.05 level. Cm1: maximum growth rate during canopy expansion; t2−t1: duration of maximum canopy cover; te−t2: duration of canopy senescence; A1, A2, A3: areas under individual curve segments; Asum: integrated ground cover.
Table 3. Analysis of the total effect of model parameters on yield.
ParametersDirect EffectIndirect EffectTotal Effect
Vmax−0.002−0.706−0.708
AtII0.5731.1441.717
AtIII0.131−2.206−2.075
AtIV−0.7681.8851.117
Asum0.7320.0000.732
Vmax: maximum canopy cover; AtII, AtIII, and AtIV: area under the canopy curve for the peak flowering, final flowering, stem and leaf senescence stages, respectively. Asum: integrated ground cover.
Disclaimer/Publisher’s Note: The statements, opinions and data contained in all publications are solely those of the individual author(s) and contributor(s) and not of MDPI and/or the editor(s). MDPI and/or the editor(s) disclaim responsibility for any injury to people or property resulting from any ideas, methods, instructions or products referred to in the content.

