Article

Transcriptome Analysis Revealed the Response Mechanism of Pomegranate to Salt Stress

1
Shandong Institute of Pomology, Tai’an 271000, China
2
Urban Garden Management Service Center of Liaocheng, Liaocheng 252000, China
3
College of Forestry, Shandong Agricultural University, Tai’an 271018, China
*
Authors to whom correspondence should be addressed.
Agronomy 2024, 14(10), 2261; https://doi.org/10.3390/agronomy14102261
Submission received: 20 August 2024 / Revised: 28 September 2024 / Accepted: 29 September 2024 / Published: 1 October 2024
(This article belongs to the Special Issue Crop and Vegetable Physiology under Environmental Stresses)

Abstract

:
Pomegranate (Punica granatum) is a well-known fruit tree species and a significant pioneer ecological species on saline–alkali land with moderate resistance to salt stress. To explore its response mechanism to salt stress could provide valuable insights into the molecular and physiological strategies plants employ to adapt and survive in high-salt environments. In this study, changes in physiological parameters and gene expressions were examined following salt treatment. After 72 h of salt treatment, change patterns of SOD and POD differed between high and low salt concentrations. Similar changes were found in the contents of proline and total soluble sugar. RNA-Seq analysis of fifteen samples detected 32,630 genes from the pomegranate genome data. A total of 6571 DEGs, including 374 TFs, were identified across different treatments. Six special modules and 180 hub genes were obtained by WGCNA analysis. Functional annotation highlighted signaling pathways and the accumulation of primary and secondary metabolites as significant pathways. These findings could reveal the salt tolerance mechanism in pomegranate leaves, offering a theoretical foundation for enhancing plant salt tolerance through genetic engineering.

1. Introduction

Salinity is a significant abiotic stress factor, restricting the growth of numerous fruit tree species, particularly in high concentrations [1,2]. Some tree species have demonstrated adaptability to saline–alkali environments and have been utilized in bioremediation initiatives [3]. Soil salinity impacts plant growth and development by inducing ion toxicity, osmotic stress, and oxidative stress [4,5]. Plants respond to salt stress by activating a sophisticated signaling network to mitigate stress-induced damage. This includes mechanisms such as adjusting stomatal aperture, synthesizing osmoregulatory compounds, enhancing ion efflux and compartmentalization, scavenging reactive oxygen species (ROS), and other adaptive responses [6,7,8,9].
The pomegranate tree (Punica granatum) is a significant pioneer ecological species on saline–alkali land due to its moderate salt stress resistance [3]. During the long-term domestication process, pomegranates have formed a unique physiological and biochemical reaction and molecular response mechanism to deal with salt stress. The level of K+ and K+/Na+ in pomegranate plants exhibit a notable rise under salt treatment, with K+ being selectively transported during root absorption and subsequent upward translocation [10]. For the different levels of salt concentration stress effects on two pomegranate varieties, it is found that Na+ and Cl accumulate in the stems and leaves, which promoted the decrease in relative water content and stomatal conductivity, respectively, with the increase in salt concentration [11]. Under salt stress, a series of metabolic processes occur in plants to relieve the damage caused by reactive oxygen species (ROS) to cells by scavenging ROS [12]. Peroxidase (POD) and superoxide dismutase (SOD) are the main indicators of osmotic stress proteins for the antioxidant capacity assessment. Osmotic regulatory substances, such as proline, could indicate the osmotic regulation ability. However, current knowledge on pomegranate salt tolerance mechanisms is primarily centered on tree growth and ion balance, rather than the molecular basis of salt tolerance.
Next-generation sequencing (NGS) is often used in plant abiotic stress response mechanism studies [13,14]. Moreover, the weighted gene co-expression network analysis (WGCNA) is used to find modules and networks of highly related genes, as a representative system biology algorithm for gene co-expression network construction [15,16]. This algorithm is usually utilized with the transcriptome to mine core genes that are significantly related to target traits and their interaction network and is widely used in the field of biology [17,18].
In this study, the ‘Taishanhong’ pomegranate was used to explore the response mechanisms of pomegranate leaf to salt stress. The aims of our study were to answer the following questions: (1) What are the changes in enzymatic activity, and osmoregulation substances under different salt treatments? (2) How do gene expression and metabolic processes alter? (3) Which genes are the key factors that regulate the salt response? The findings of this study could provide gene resources for the explore of salt-tolerant mechanism pomegranates.

2. Materials and Methods

2.1. Plant Material and Treatment

The one-year-old ‘Taishanhong’ pomegranate seedlings used in this study were planted in flowerpots with a volume of 700 cm3 and filled with 2 kg of humus and vermiculite (1:1, v/v), where they grew in the Pomegranate Germplasm Repository, Taishan District, Tai’an, China (36°12′26″ N, 117°05′14″ E) under natural conditions. The salt treatments were performed with 6 concentrations of NaCl solution of 0% (the same volume of distilled water), 0.3%, 0.4%, 0.5%, 0.6%, 0.7% and 0.8%. A total of 400 mL NaCl solution with different salt concentrations was poured into each flowerpot. Three duplicate leaves were collected for each treatment at 2 h, 24 h, 48 h, and 72 h after salt treatment, denoted as H2, H24, H48, and H72. The samples were frozen in liquid nitrogen immediately and then stored at −80 °C for further measurements.

2.2. Physiological Indexes Measurement

The activities of POD and SOD were measured by the guaiacol method and the nitrogen blue tetrazole method, using the AA900T flame atomic absorption spectrometer (PerkinElmer, Waltham, MA, USA) at 470 nm and 560 nm, respectively [19]. The contents of proline and soluble sugar were determined by acid ninhydrin colorimetry and anthrone colorimetry, according to previous study [20].

2.3. Transcriptome Analysis

2.3.1. RNA Extraction and cDNA Library Sequence

According to the physiological change trends, the leaves treated with 0.5% (LH24 and LH48) and 0.8% (HH24 and HH48) salts for 24 h and 48 h were subjected to comparative deep transcriptome analysis. The sample collected at H2 treated with distilled water was regarded as the CK group. Total RNA was extracted using TRIzol reagent (Invitrogen, Carlsbad, CA, USA). Subsequently, the integrity and concentration of total RNA were assessed using a Nano Drop and Agilent 2100 bioanalyzer (Thermo Fisher Scientific, Chelmsford, MA, USA).
High-quality total RNA was enriched using the NEBNext Poly(A) mRNA Magnetic Isolation Module (NEB, Ipswich, MA, USA) according to the manufacturer’s instructions. cDNA library construction and normalization were performed using methods described in a previous study [21]. The 15 cDNA libraries were sequenced on the Illumina Hiseq 4000 Sequencing platform (Illumina, San Diego, CA, USA) and 150 bp paired-end reads were generated.

2.3.2. Gene Annotation and Expression Analysis

After removing the reads containing adapter sequences, low-quality sequences, and ploy-N using Trimmomatic v 0.38, the high-quality sequences were then aligned to the P. granatum reference genome using HISAT2 2.1.0 (https://www.ncbi.nlm.nih.gov/genome/13946?genome_assembly_id=720008, acceded on 6 July 2024). The transcript sequence assembly and abundance calculations were performed by StringTie v1.3.4d. The gene expression level was evaluated using the metric FPKM and the differentially expressed genes (DEGs) were identified using DESeq2 v1.26.0 with fold change ≥ 2.0 and p value ≤ 0.05 as screening criteria. The software programs topGO v2.40.0 and KOBAS v3.0.0 were used to analyze the GO enrichment analysis and Kyoto Encyclopedia of Genes and Genomes functions of specific gene sets. The K-means analysis of differentially expressed TFs was performed using the Metware Cloud (https://cloud.metware.cn, acceded on 27 September 2024).

2.3.3. Co-Expression Network Analysis

All the obtained DEGs were analyzed to construct a gene co-expression network by R package WGCNA analysis [22]. The Pearson’s correlation matrix between each pair of genes was determined based on FPKM values and then transformed into the adjacency matrix with the following formula: connection strength (adjacency value) = |Pearson’s correlation| β. The parameter β represented the soft threshold of the correlation matrix and emphasized the strength of the correlation between genes, with the value being 24 in this study. The obtained adjacency matrix was transformed into the topological overlap matrix of all differential genes (TOM) and the genes were hierarchically clustered via the TOM similarity algorithm. The modules were defined using dynamic tree cutting according to the default parameters (minModuleSize = 30, deepSplit = 2) and then redefined by collapsing or combining branches. Seven modules, including a grey module, were obtained, after merging highly similar modules with a cutting height of 0.2 (MEDissThres = 0.20). The module eigengene (ME) value, i.e., the first principal component of the module, was calculated to represent the gene expression spectrum of the whole model.

2.3.4. Hub Gene Screening

To identify phase-specific modules, the correlation between the stage and the ME was determined and used to screen the relevant modules in the specific stage of salt treatment. After screening the key gene modules associated with the salt treatment, the gene co-expression network map was drawn based on the relationships of the genes within the module [23]. For each module, a total of 150 genes with the highest TOM value and 300 gene relationship pairs with the highest correlation were selected, which were screened using the Cytoscape 3.7.0 software [18]. The top 30 genes with connectivity were screened as hub genes.

2.3.5. Gene Expression Validation

Twelve genes were selected to analyze the response mechanism to salt stress in pomegranate leaves and validate the accuracy of the RNA-seq results via quantitative reverse transcription PCR (RT-qPCR). The genes were selected based on DEG annotation results and the co-expression network of WGCNA modules analysis. Premier 5.0 software (Premier Biosoft International, Palo Alto, CA, USA) was used to design the primers (Table S1). All reactions were carried out on a StepOne Real-Time PCR System (Applied Biosystems, Foster, CA, USA) using SYBR Green Dye (Takara, Dalian, China). Relative gene expression was calculated by the 2−ΔΔCt method with actin as an internal control.

2.4. Statistical Analyses

Values of different indicators are expressed as mean ± SD (n = 3). One-way analysis of variance (ANOVA) with repeated measures was used to test the changes in each index separately. Pearson correlation coefficients were used to examine relationships between transcriptional levels and gene expression levels. All statistics were performed using SPSS R27.0.1.0 (IBM, Armonk, NY, USA). For all parameters measured, α was set at 0.05 and p values less than α were considered significant.

3. Results

3.1. Changes in the Physiological Indexes after Salt Treatment

To analyze the physiological condition and stress resistance mechanisms of pomegranate leaves under salt stress, the antioxidant capacity and osmotic regulation ability were evaluated after exposure to different salt treatments. The level of SOD activity rose with escalating salt concentrations at each time point (Figure 1a). Over the observation period, two changing patterns of SOD activity were observed. SOD activity exhibited consistent upward trends under low-salt treatments (≤0.5%) and displayed up–down patterns, peaking at H48 under high-salt treatments (>0.5%). Under low-salt treatments, the POD activity showed an initial increase, followed by a stable trend by H72, while under high-salt treatments, it demonstrated a sustained increase throughout the observation period (Figure 1b). The proline content increased with increasing salt concentration at each time point (Figure 1c). For each salt treatment, the content of proline increased from H2 to H48 and then changed gently at H72. The change trends of total soluble sugar content were similar to proline, with significant increase shown at H24 (Figure 1d). Overall, all the salt concentrations were divided into two groups, low concentration and high concentration. Two time points of H24 and H48 presented significant metabolic changes in response to salt stress.

3.2. Transcriptome Sequencing and Gene Response Analysis

3.2.1. Overview of Transcriptome Profiles

The results of the physiological characteristics in different salt-concentration treatments were analyzed to evaluate the response of leaves to salt stresses. And further, the leaves under low (0.5%) and high (0.8%) concentration, at different reaction times (24 h and 48 h) were collected for transcriptome sequencing. A total of four treatment groups, i.e., LH24 (24 h, 0.5%), LH48 (48 h, 0.5%), HH24 (24 h, 0.8%) and HH48 (48 h, 0.8%) were set up, with the non-salt treatment (0%) as CK. Fifteen cDNA libraries were constructed and the raw data were deposited at the NCBI Sequence Read Archive (SRA) under accession numbers SRR19568829~SRR19568843.
After sequence quality control, an average 64,711,096l (95.69%) of clean reads was obtained in all 15 samples, with the proportion of Q30 base exceeding 96.83% (Table 1). The average clean reads of 15 samples was 64,711,096, with the clean percentage being 95.69%. Compared with the reference genome of pomegranate, the mapping rate ranged from 95.81% to 96.48%, with a mean value of 96.14%. Based on the pomegranate genome data, 32,630 genes were identified, with the number of expressed genes ranging from 21,912 to 23,424 in each sample.
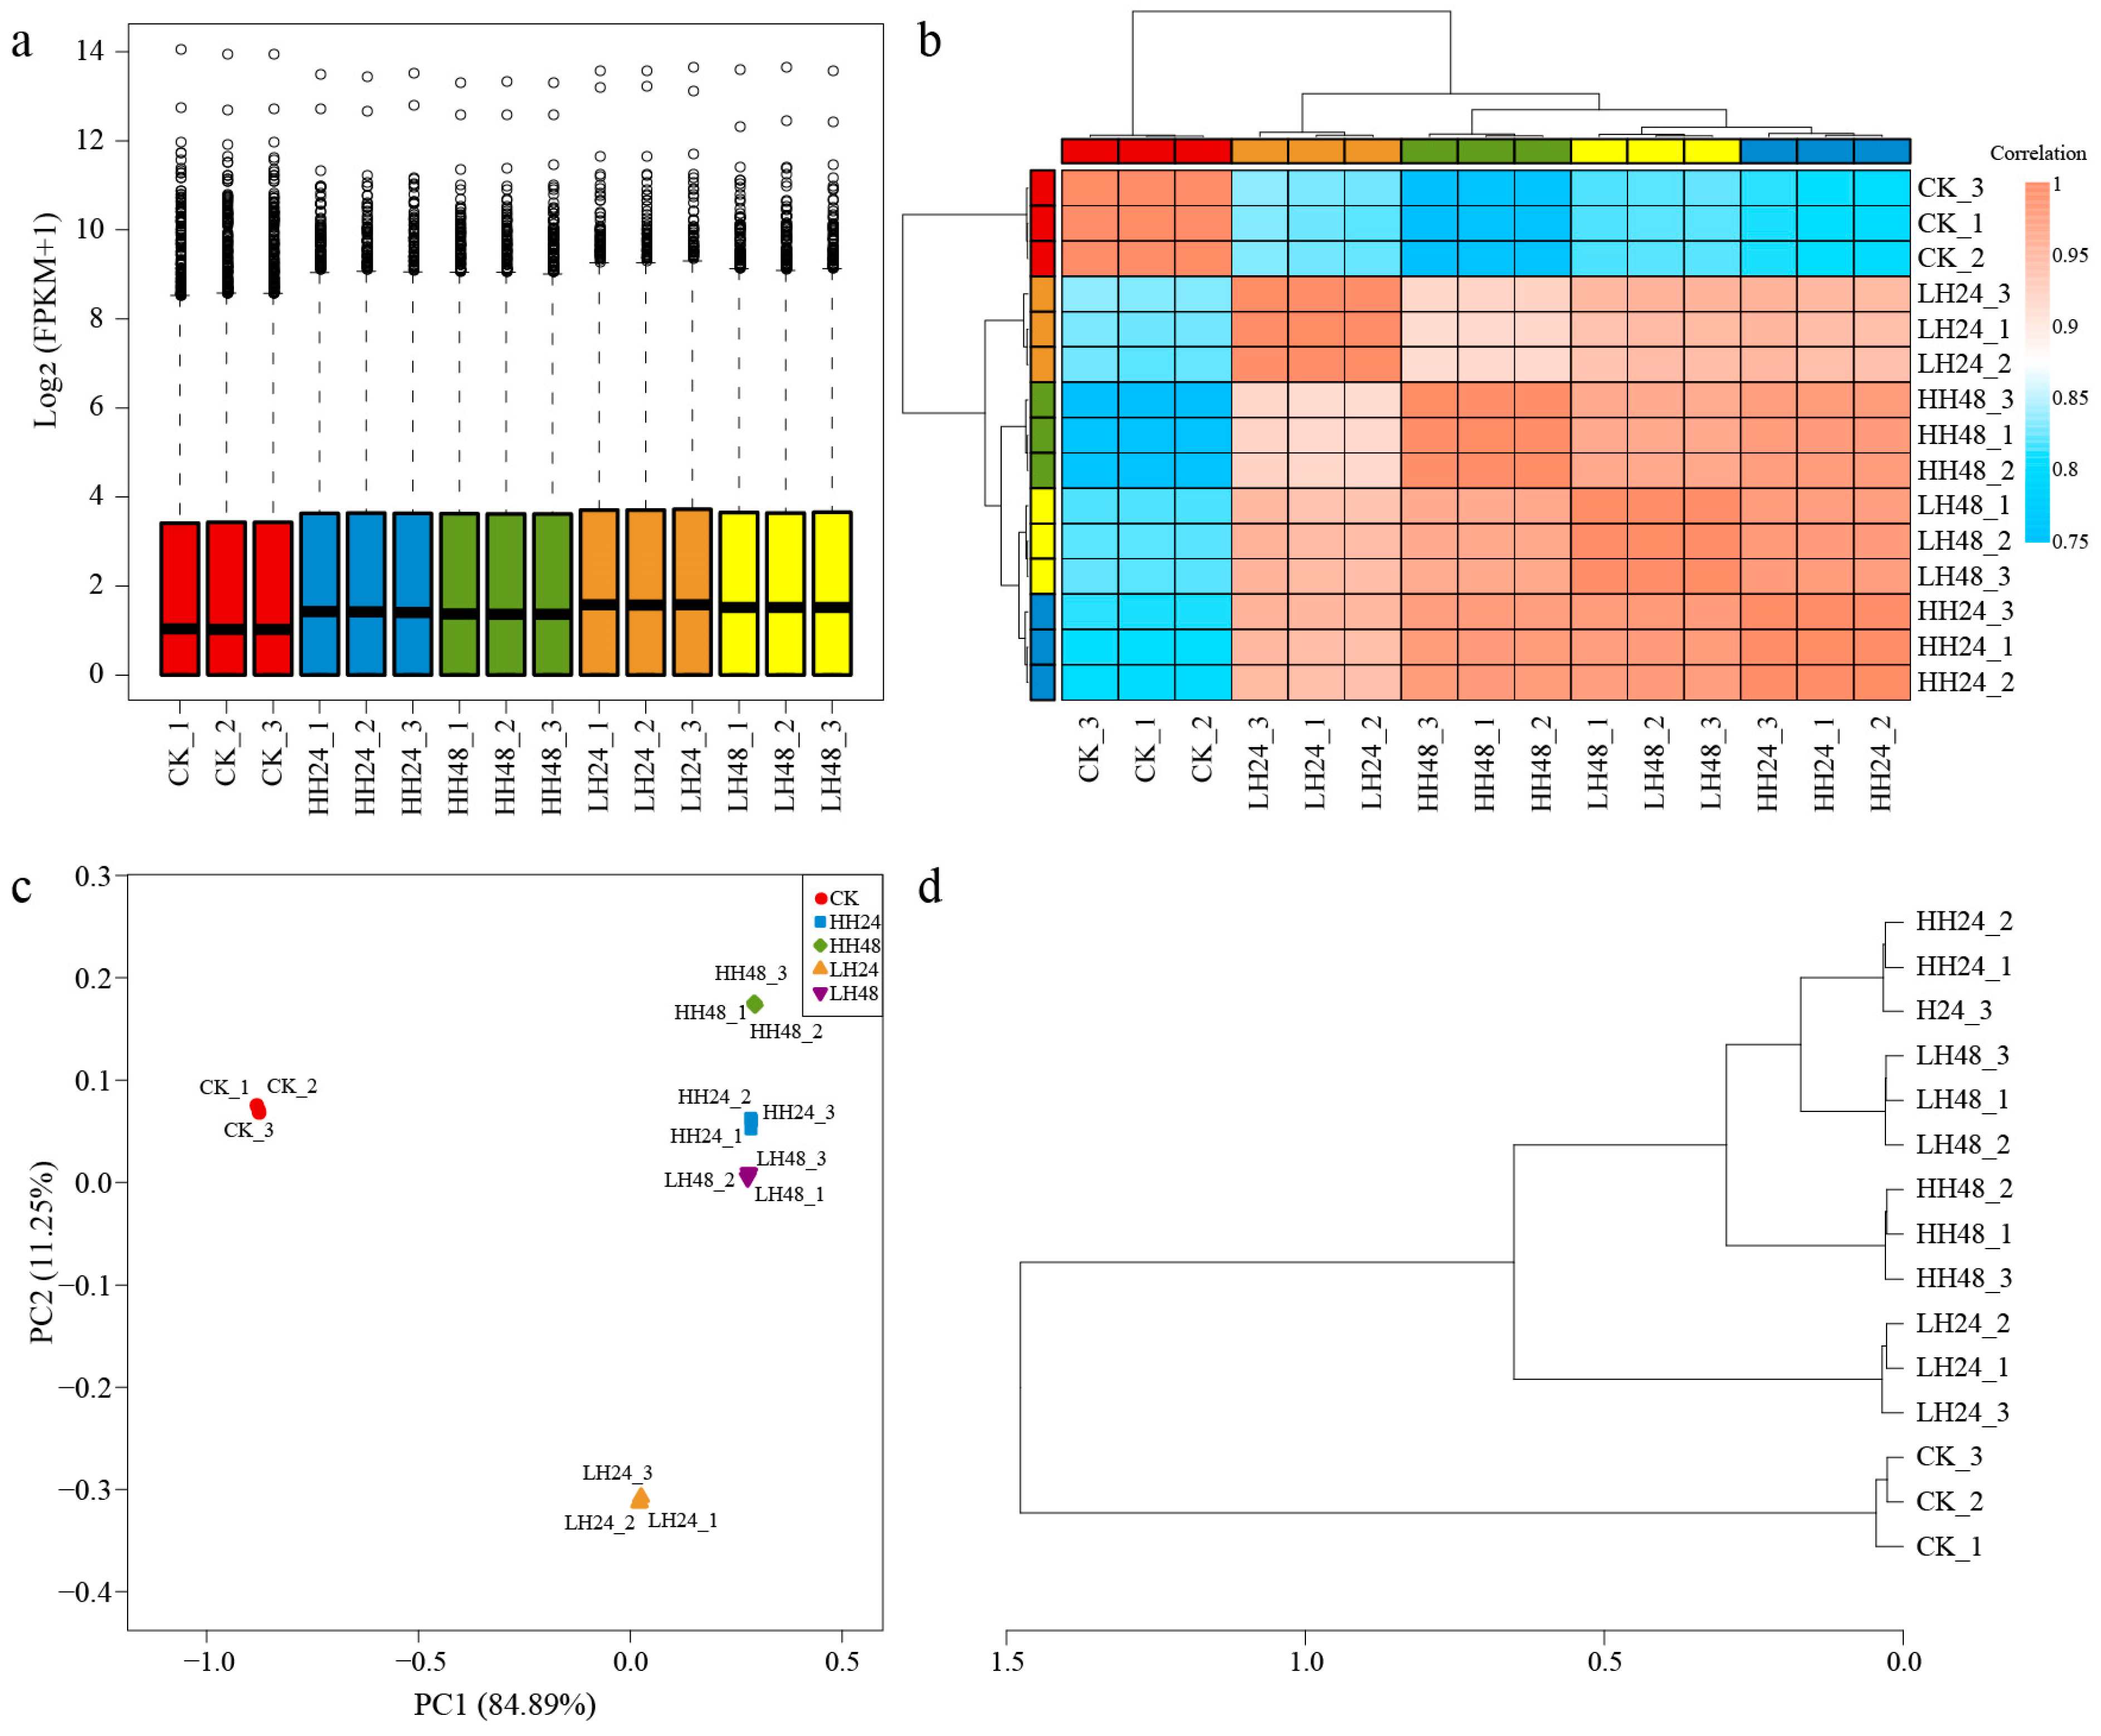
To find differential genes more accurately, the sample expression, correlation analysis, principal component analysis (PCA), and hierarchical cluster analysis (HCA) of genes expressed under different concentrations of salt stress and at different reaction times were carried out (Figure 2). The two concentration gradients showed similar expression distributions compared to the CK group, at different treatment times. The Pearson correlation coefficients of the 15 samples showed that the interaction between treatment time and concentration was significant. The transcriptional programs of HH24 and LH48 were highly similar, and they were also highly similar to H48, which was significantly different from that of CK and LH24. The PCA and HCA results suggested that the samples under different salt treatment had significant variance, and could be used for further study.

3.2.2. DEG Analysis under Different Salt Treatments

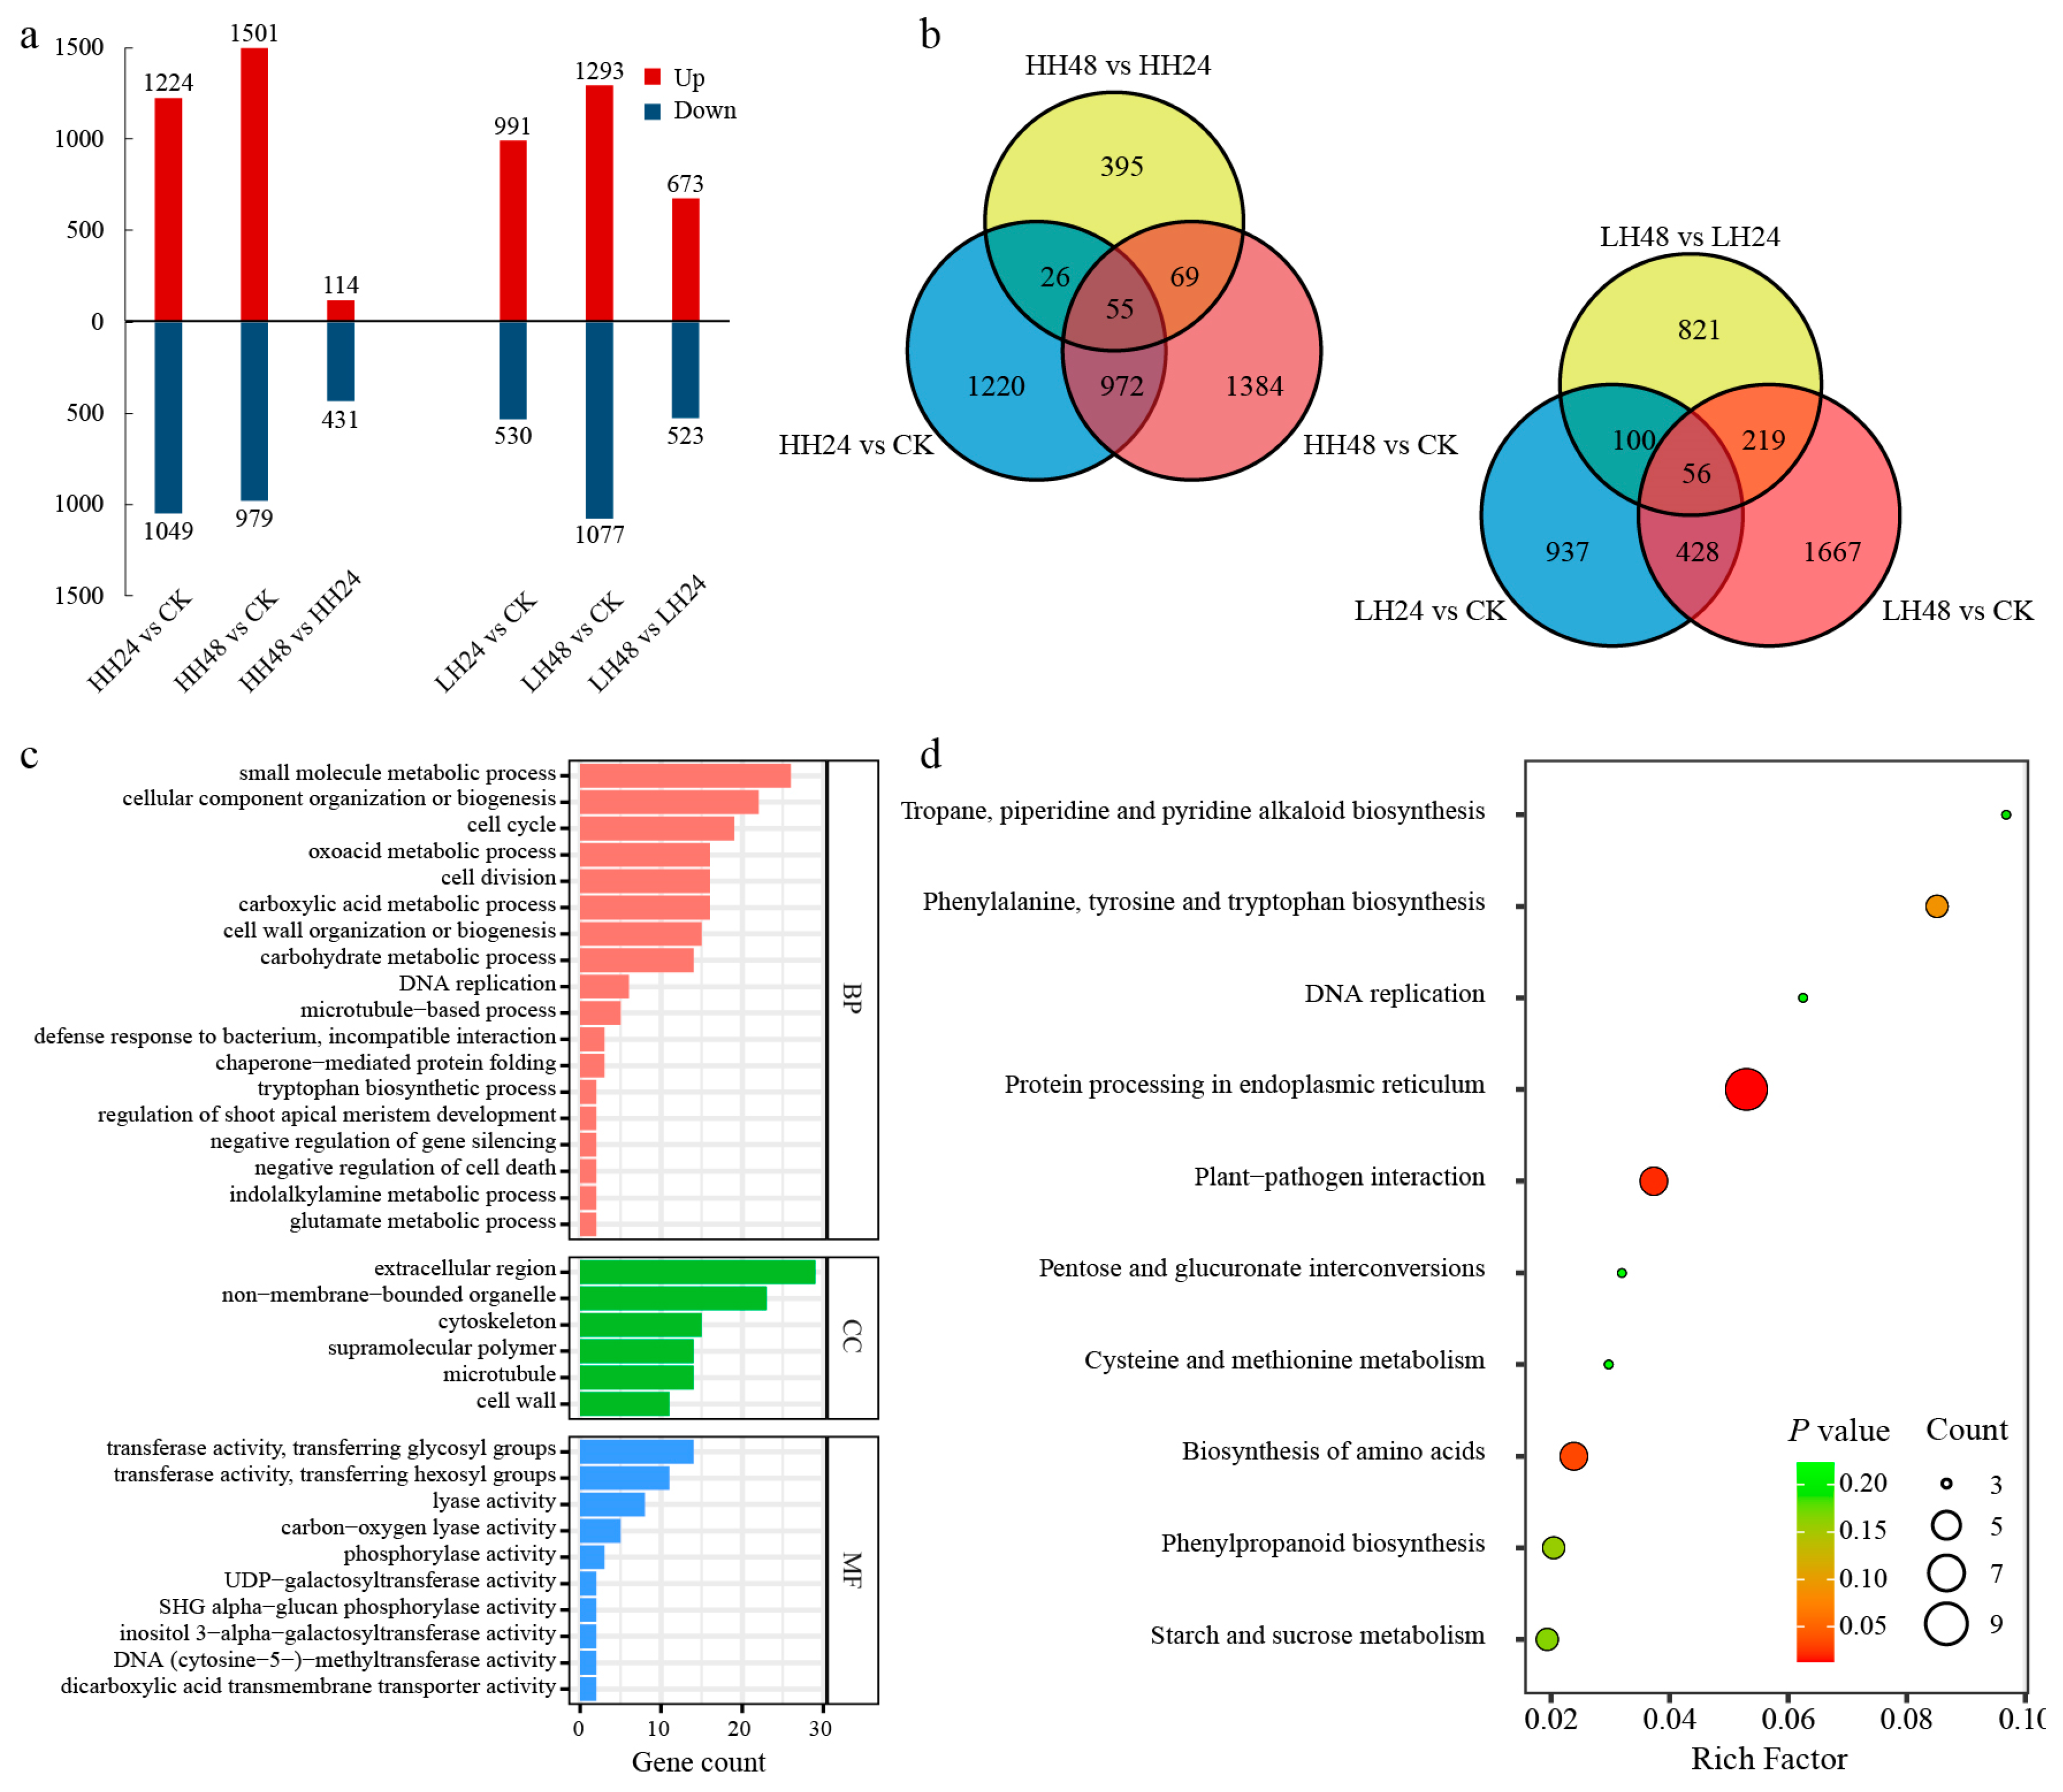
To further explore the response of pomegranate to salt stress, the transcriptome profiles of low- and high-concentration salt treatments were compared. The DEGs were identified between different germplasms via log2|Fold Change| ≥ 2 and p-value < 0.05. The up- and down-regulated genes were tallied (Figure 3a). A total of 2273 genes had different expression patterns between the HH24 and CK group, including more up-regulated genes (1244) than down-regulated genes (1049). There were 2480 DEGs, 1501 up-regulated genes and 979 down-regulated genes found in the HH48 vs. CK group. Taking HH24 as control, a total of 545 DEGs were expressed differentially in HH48, including 114 up- and 431 down-regulated genes. Meanwhile, there were 1521 DEGs identified between the LH24 and CK group, with more up-regulated genes (991). A total of 2370 DEGs were found between the LH48 and CK group, including 1293 up-regulated gene and 1077 down-regulated genes. For the compared combination of LH48 and LH24, 673 up-regulated genes and 523 down-regulated genes were identified as DEGs. At 24 h after salt treatments, more DEGs were identified at the high concentration than the low concentration, and roughly the same number of DEGs were found at 48 h after high- and low-concentration salt treatments.
For the Venn diagram analysis, a total of 6571 DEGs were found to express differentially between different treatments, including 4121 and 4228 DEGs under high- and low- concentration salt treatments, respectively (Figure 3b). There were 1027 and 484 DEGs identified, both at two different time points under different salt treatments of high and low concentrations, respectively. And further, a total of 260 DEGs were identified, both in the two comparative combinations of high- and low-concentration salt treatments.
The identified 260 DEGs were annotated into 114 GO terms belonging to three categories (Figure 3c), i.e., biological process (BP), cellular component (CC), and molecular function (MF). The BP category contained the genes mainly involved in cells and their components (GO: 0044281, 26 DEGs; GO: 0071840, 22; GO: 0007049, 17; GO: 0051301, 16), and the metabolites of carbohydrates and their intermediate processes (GO: 0019752, 16; GO: 0005975, 14; GO: 0046394, 13) pathways. The main pathways of CC categories were the extracellular region (GO: 0005576, 29), non-membrane-bounded organelle (GO: 0043228, 23), and cytoskeleton (GO: 0005856, 15). Transferase activity, transferring glycosyl and hexosyl groups (GO: 0016757, 14; GO: 0016758, 11), and lyase activity (GO: 0016829, 8) were the most enrichment pathways in MF categories.
KEGG enrichment analysis was conducted on the 260 identified DEGs, and then a total of 56 KEGG terms were enriched (Figure 3d). Protein processing in endoplasmic reticulum (ko04141) was annotated significantly, followed by plant–pathogen interaction (ko04626), and biosynthesis of amino acids (ko01230). What’s more, the pathways associated with primary and secondary metabolite accumulation, including shikimic acid metabolism (ko00400, ko00940, ko00960), proline metabolism (ko00330), sugar metabolism (ko00010, ko00500, ko00030), and the pathways involved in signaling pathways, including pentose and glucuronate interconversions (ko00040), phosphatidylinositol signaling system (ko04070), and plant hormone signal transduction (ko04075), were enriched in KEGG, which may be directly related to salt response.

3.2.3. Expression Analysis of DEGs Involved in Salt Tolerance

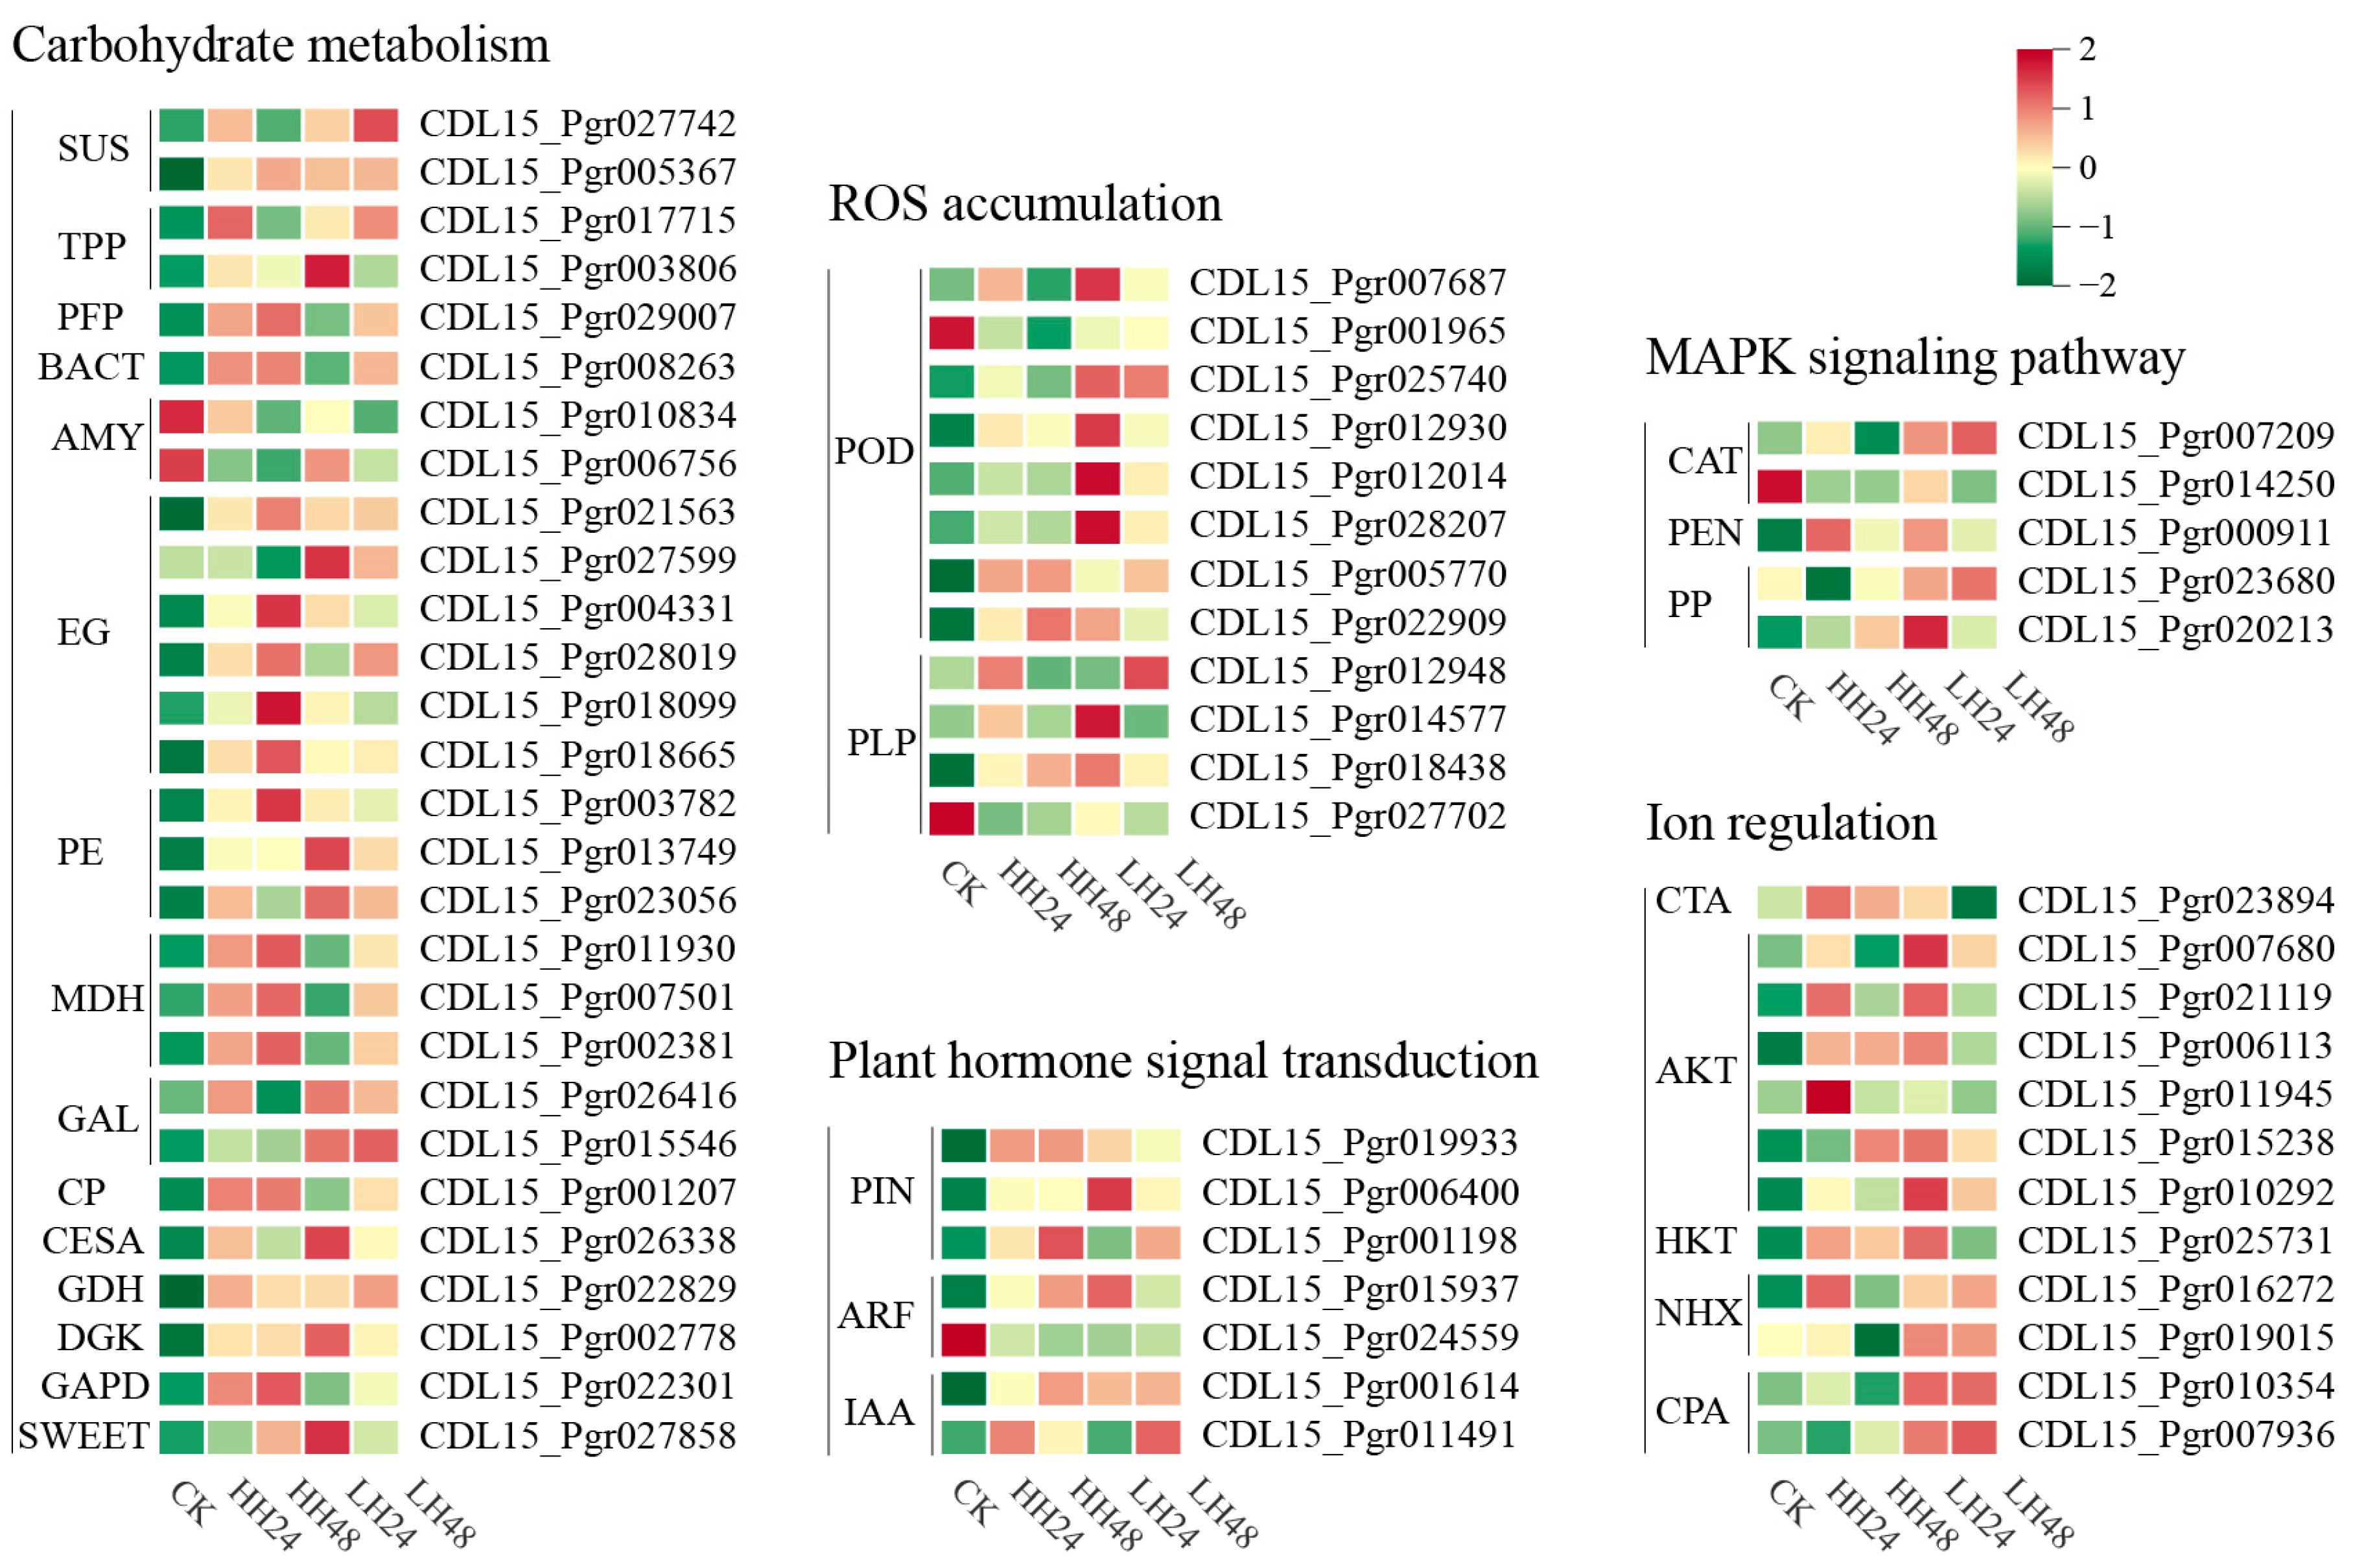
To explore the mechanism behind salt tolerance in pomegranate leaves, the DEGs of potential salinity tolerance genes among different treatments were examined (Figure 4). A total of 28 DEGs encoding 15 enzymes involved in carbohydrate metabolism were identified. Most of these genes were up-regulated under different salt treatments, including cellulose synthase (CESA), pectinesterase (PE), and sucrose synthase (SUS). The high salt concentration had more significant effects, with most carbohydrate-related genes peaking at HH48. We detected twelve DEGs related to ROS production, including eight peroxidase-encoding genes and four patatin-like protein-encoding genes, peaking mostly at LH24. Auxin-signal-transduction-related genes were mainly up-regulated in pomegranate leaves, including three auxin efflux carrier component genes (PIN), one auxin response factor (ARF), and two auxin-responsive proteins (IAA). The expression of MAPK signaling pathway-related genes were affected by salt stress with varied change trends after salt treatments. There were five types of membrane transporters and ion channels found under salt stress, including calcium-transporting ATPase (CTA), potassium transporter (HKT), serine/threonine protein kinase (AKT), sodium/hydrogen exchanger (NHX), and vacuolar cation/proton exchanger (CPA). Most DEGs of ion transport were up-regulated and down-regulated under low- and high-salt-concentration treatments, respectively, indicating that the process of ion transport could be inhibited by salt stress.

3.2.4. TF Analysis under Different Salt Treatments

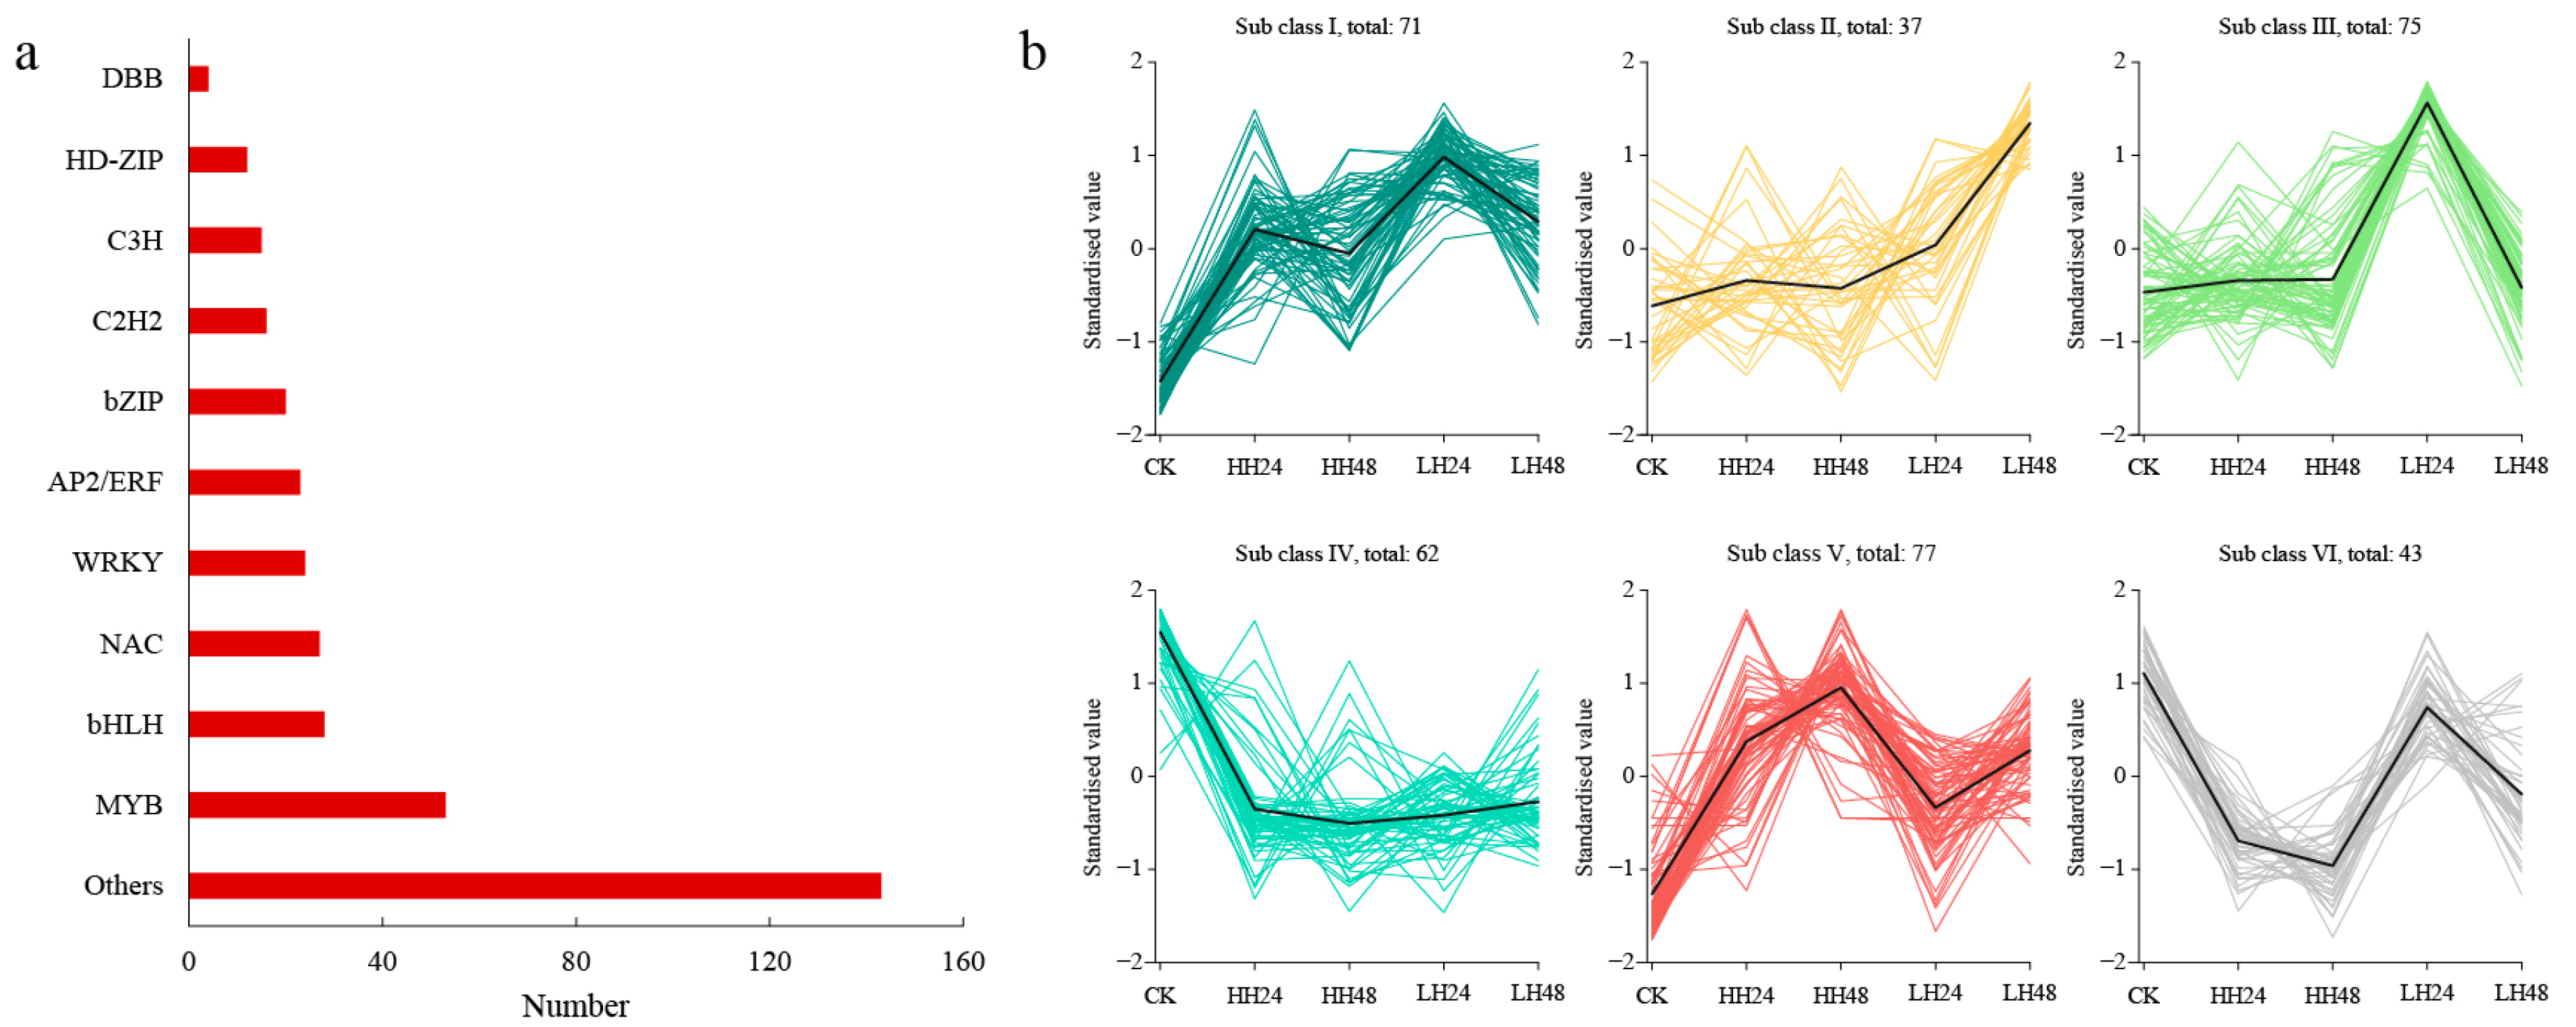
Among the 6571 DEGs identified under different salt treatments, a total of 365 TFs were found belonging to 23 gene families (Figure 5a). As the major TF, the MYB family contained 53 members differentially expressed under salt stress, followed by the bHLH (28) and the NAC (27). Furthermore, 24 DEGs were identified in the WRKY family, and an additional 23 DEGs were attributed to the AP2/ERF family. According to the gene expression analysis, 135 and 80 TFs showed upward and downward regulations under all the salt treatments, respectively (Table S2).
To further identify key TFs in the response to salt stress, all the differentially expressed TFs were grouped into six classes by the K-means analysis (Figure 5b). Class I contained 71 TFs, such as CDL15_Pgr002490(bHLH), CDL15_Pgr004535(MYB), and CDL15_Pgr014520 (WRKY), which showed significantly up-regulated trends under all salt treatments. There were 37 and 75 TFs found in classes II and III with peaks in LH48 and LH24, respectively. Class IV contained 62 TFs with significantly down-regulated change trends under different salt treatments, such as CDL15_Pgr002809 (AP2/ERF), CDL15_Pgr004305 (bZIP), and CDL15_Pgr011469 (MYB). A total of 77 TFs were identified in class V, which had up-regulated expressions under high salt concentrations. In addition, 43 TFs were found in class VI with down-regulated expressions in high-salt-concentration treatments. The TFs from classes I and IV were significantly responsive to salt treatments, suggesting that transcriptional regulation plays an important role in the response of pomegranate leaves to salt stress.

3.3. Co-Expression Network and WGCNA Module Analysis

3.3.1. Identification and Visual Analysis of the Specific Modules

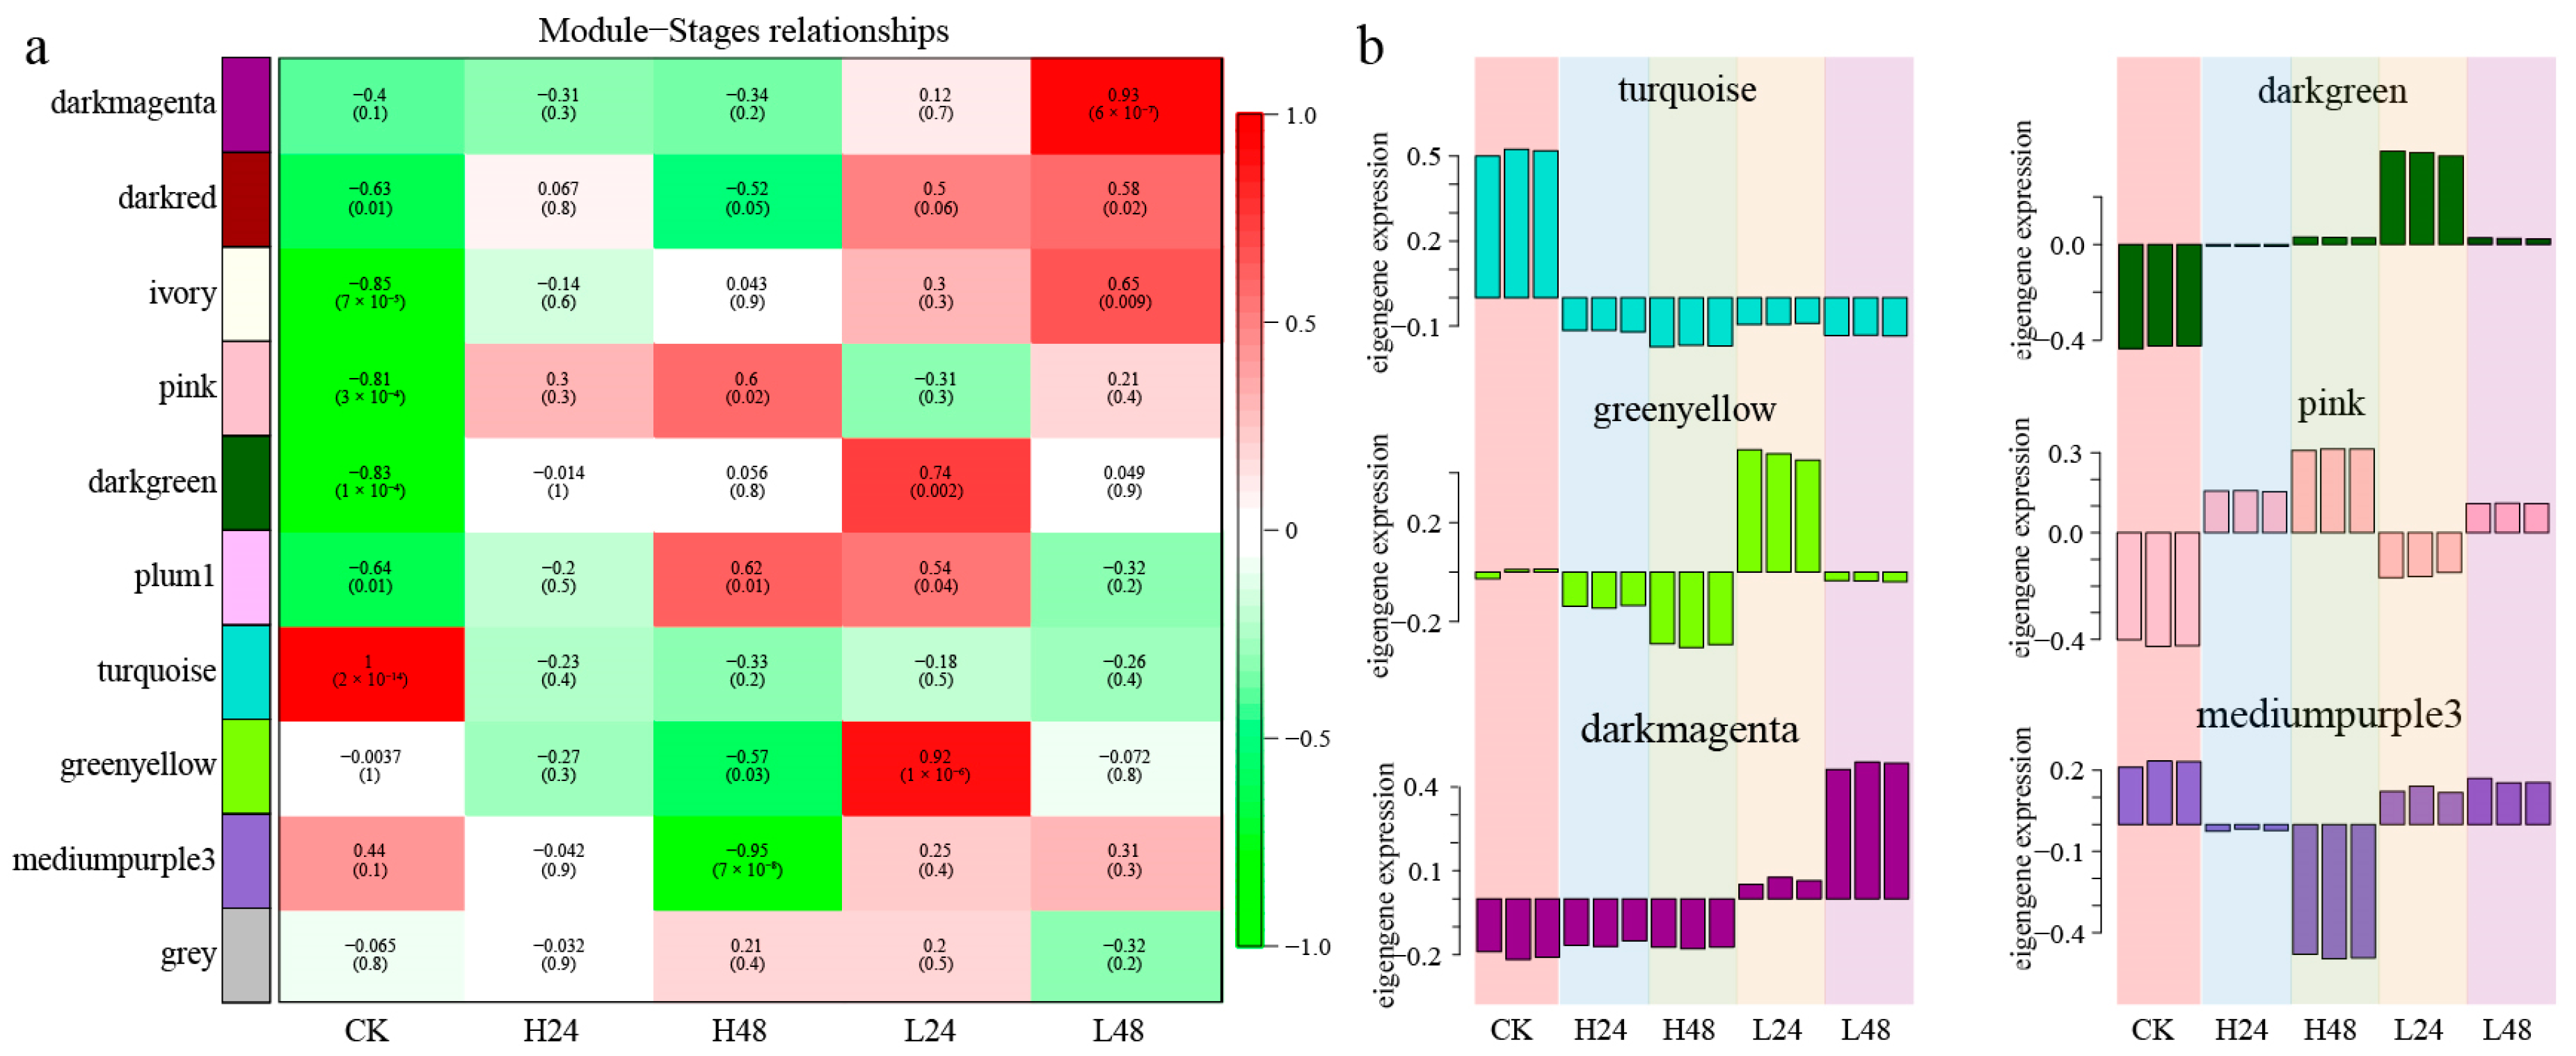
To further analyze the response to salt stress in pomegranates leaves, a total of 6571 DEGs were obtained. A gene co-expression network of DEGs was constructed through R package WGCNA analysis. There were 10 modules identified using the dynamic tree cutting method (Figure 6a), of which the pink module had the maximum quantity of genes (2221 genes), followed by the dark green module (1470), while the ivory module had the minimum quantity, with 37 genes (Figure 6b).
According to Pearson’s correlation analysis among different treatments (Figure 7a), LH24 had significantly positive correlations with the pink module (0.92, p < 0.01) and dark green module (0.74, p < 0.01); LH48 had a significantly positive correlation with the dark magenta module (0.93, p < 0.01); and HH48 had significantly positive correlations with the pink (0.60, p < 0.05) and plum (0.62, p < 0.05) modules and a significantly negative correlation with the medium purple module (−0.95, p < 0.01). Under different salt-stress treatments, the genes from the turquoise module showed a slight downward trend compared with CK (Figure 7b). The genes from darkgreen had an upward trend, peaking in LH24. The expressions of genes from the greenyellow, pink, and darkmagenta modules peaked in LH24, HH48, and LH48, respectively. Additionally, the genes from the mediumpurple3 module showed significant downward trend in HH48. The gene expression patterns in different modules showed corresponding correlations with salt treatments.

3.3.2. GO and KEGG Analysis of the Specific Modules

All the genes from the six specific modules were annotated by GO enrichment (Table S3). For the BP category, organic substance metabolic process (GO: 0071704) and primary metabolic process (GO: 0044238) were the major pathways annotated by the hub genes from the darkgreen (398 and 367) and pink (541 and 493) modules. The genes of the turquoise module were annotated into the oxidation–reduction process (GO: 0055114, 114) and small-molecule metabolic process (GO: 0044281, 80). Cellular component organization or biogenesis (GO: 0071840, 49) was the majority pathway in the greenyellow module. For the CC category, cell part (GO: 0044464) and intracellular part (GO: 0044424) were the major pathways annotated in the turquoise (580 and 508), darkgreen (608 and 479), and pink (1055 and 963) modules. For the MF category, the genes of turquoise were mainly annotated into oxidoreductase activity (GO:0016491, 109). Binding (GO: 0005488) and organic cyclic compound binding (GO:0097159) were the major pathways identified in the darkgreen (516 and 337) and greenyellow (307 and 197) modules, while organic cyclic compound binding (GO: 0097159, 453) was the important pathway for the pink module. The hub genes from different modules were enriched into varied KEGG pathways (Table S4). Carbon metabolism (ko01200) and biosynthesis of amino acids (ko01230) were identified in all modules expect the darkmagenta one. Plant hormone signal transduction (ko04075) and protein processing in endoplasmic reticulum (ko04141) were annotated by the hub genes from four of the six modules besides the darkmagenta and mediumpurple3 modules. Ribosome (ko03010) was enriched by hub genes from the greenyellow and pink modules, while ribosome biogenesis in eukaryotes (ko03008) was mainly found in the greenyellow module.

3.3.3. Candidate Gene Identification Associated with Salt Stress

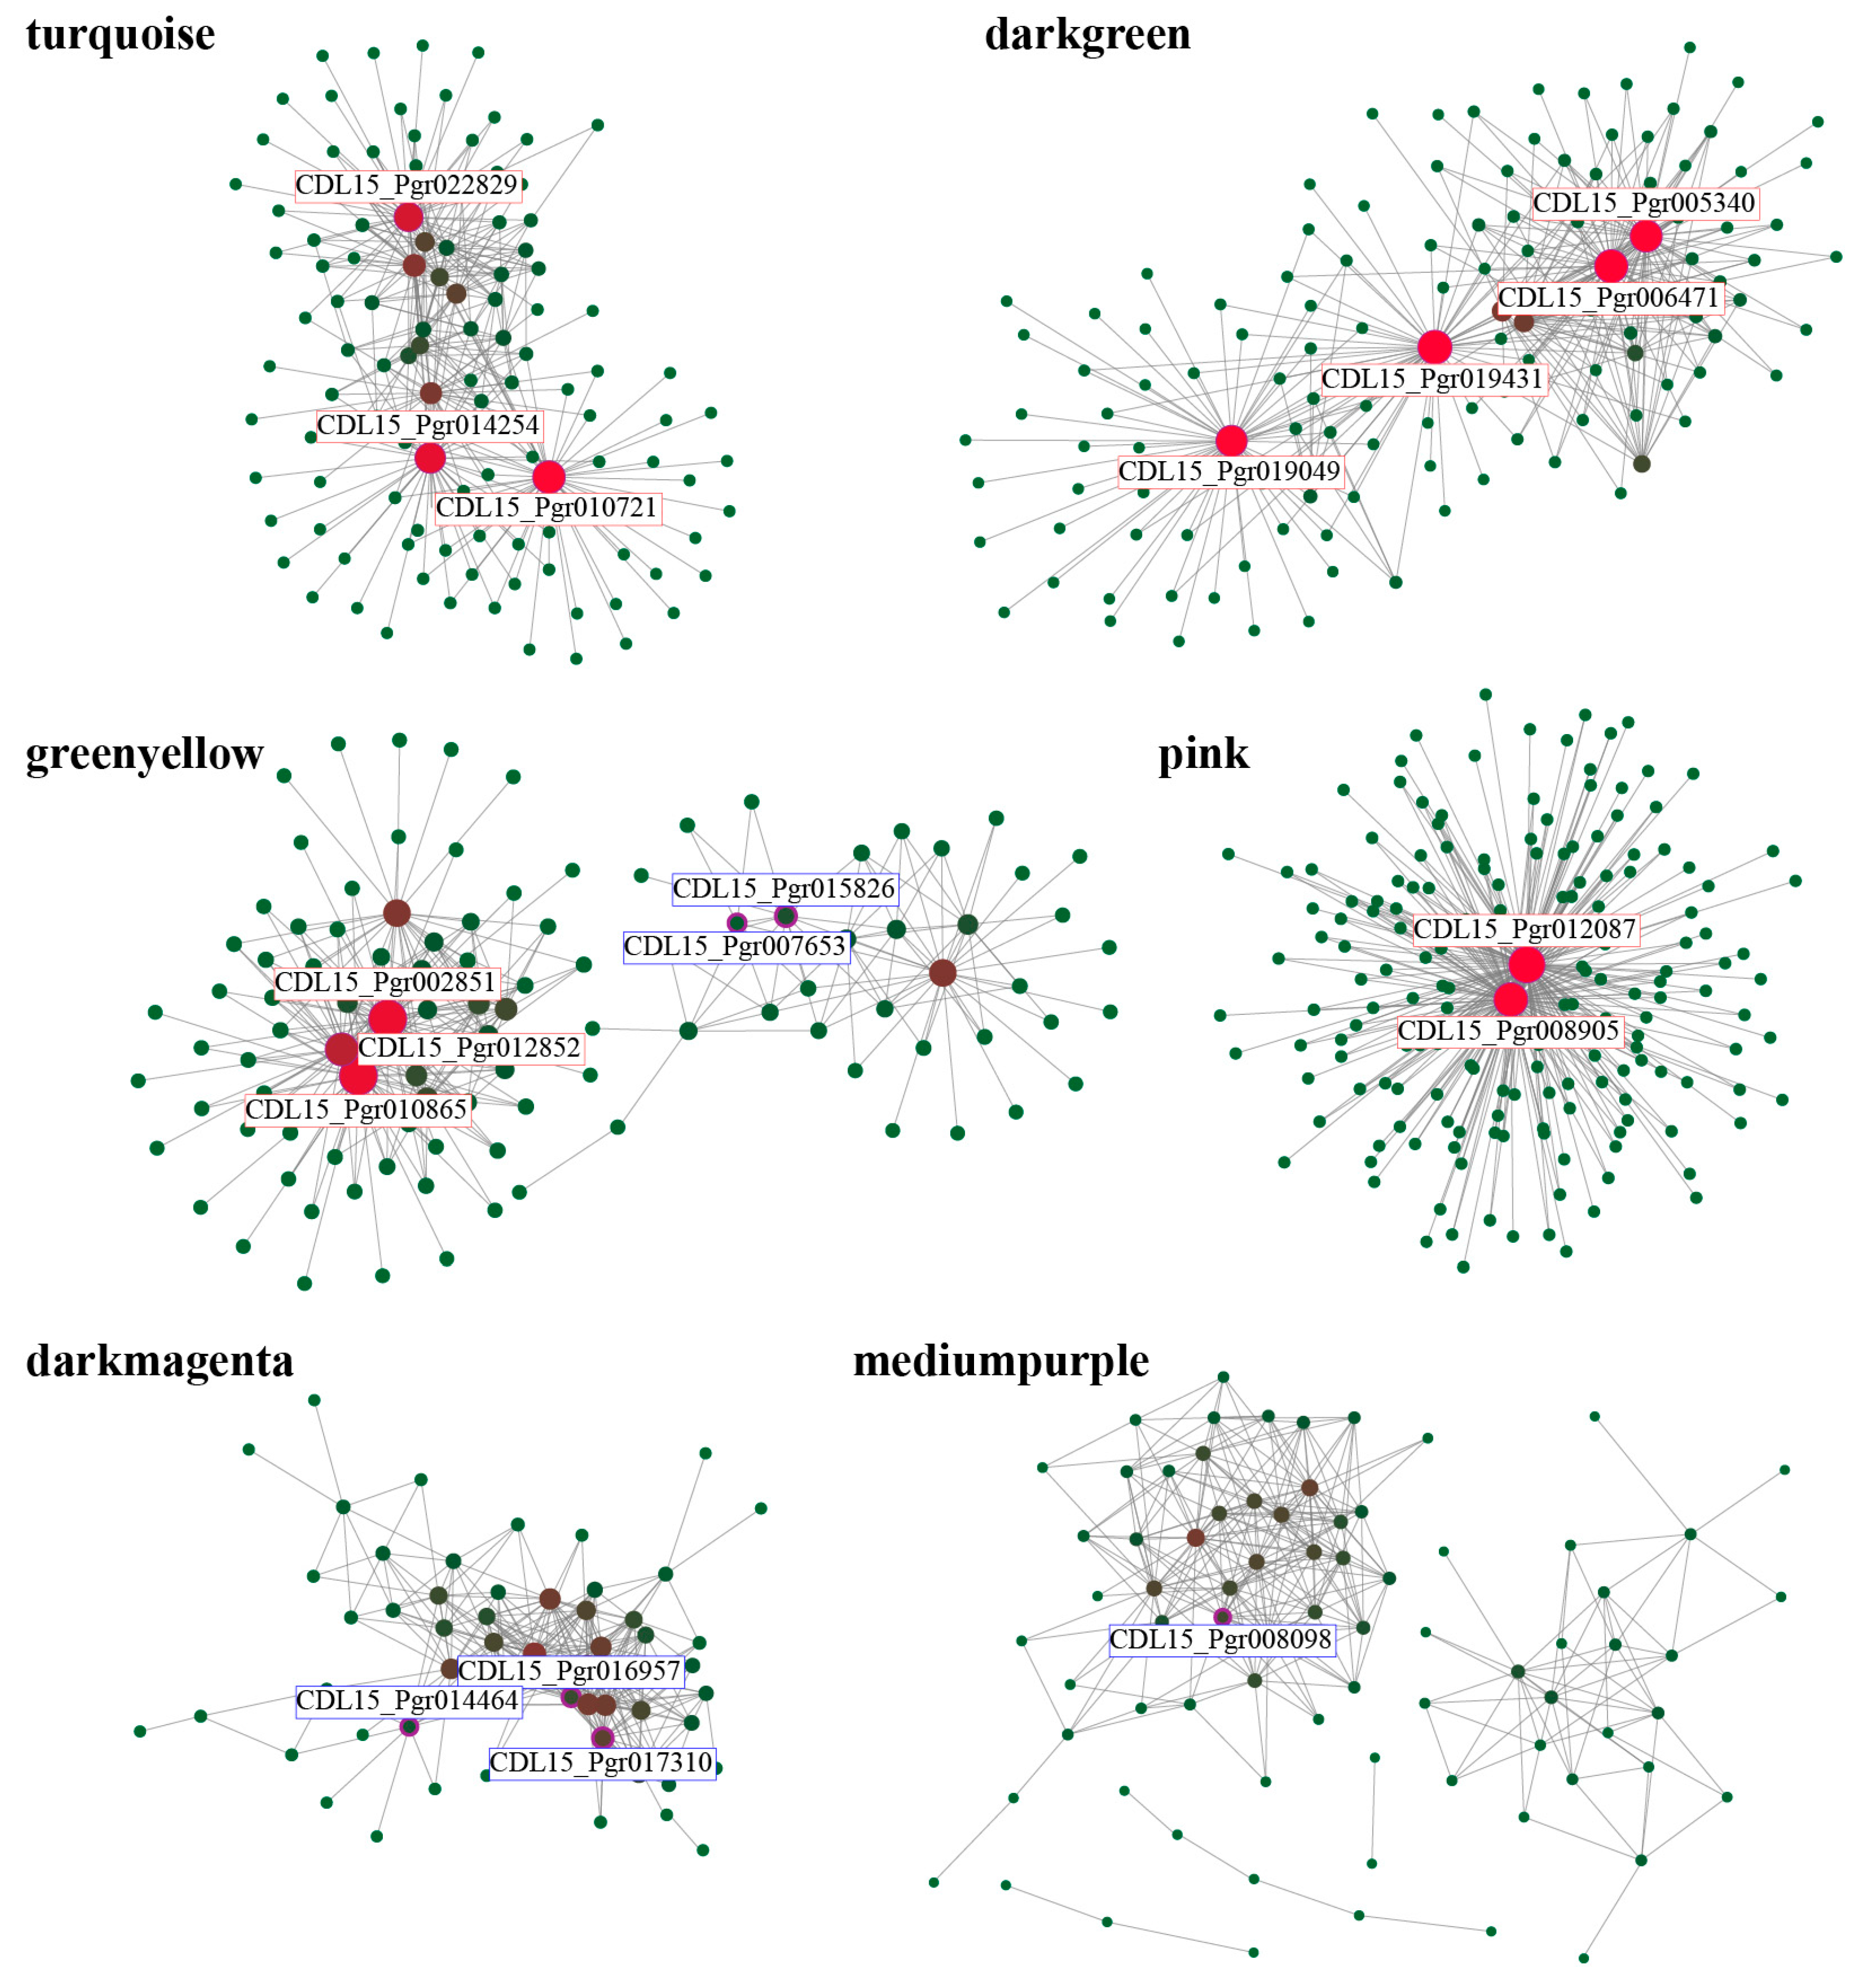
The TOM of all the DEGs was calculated to identify the hub genes associated with salt stress. A total of 180 hub genes were selected from six specific modules with high correlations with different salt treatments (Figure 8, Table S5). The hub genes were mainly associated with the endogenous hormone signaling (such as auxin-responsive protein, CDL15_Pgr019431) and primary metabolic process (such as glutamate dehydrogenase, CDL15_Pgr022829; long chain acyl-CoA synthetase, CDL15_Pgr006471). The GO annotation of hub genes was analyzed. A large number of genes were annotated in the BP category, including the dioxide-reduction process (22), and polysaccharide catabolic and metabolic process (7). In addition, intracellular non-membrane-bounded organelle (23) and RNA binding (14) were the major GO terms enriched in the CC and MF categories, respectively. According to the KEGG analysis, the hub genes were annotated into 35 pathways, including ribosome (22), biosynthesis of secondary metabolites (7), and amino sugar and nucleotide sugar metabolism (5). There were six TFs found in the hub gene network. For the six TFs, CDL15_Pgr017310 (ERF), CDL15_Pgr016957 (MYB41), and CDL15_Pgr014464(C2H2) were listed in the darkmagenta module, with peaking expressions in LH48. CDL15_Pgr015826 (WRKY) and CDL15_Pgr007653 (WRKY18) were listed in the greenyellow module, with peaking expressions in LH24. CDL15_Pgr008098 (DBB) was listed in the mediumpurple module, with the lowest expression level in HH48.

3.4. Validation of the Candidate Gene Expression

To further verify the transcriptome results and analyze the function of the hub genes, 12 genes were selected to measure the expression patterns under different salt treatments (Figure 9). The change trends of the hub genes were similar for the transcriptome results and RT-qPCR analysis, with the correlations ranging from 0.878 (p < 0.01) to 0.971 (p < 0.01), indicating the transcriptome profile was accurate for the analysis of salt tolerance of pomegranate. There were two majority expression patterns after different salt treatments, i.e., upward and downward trends in gene expressions. In addition, some difference was found in the gene relative-expression levels between different salt concentrations and treatment times. Ribulose bisphosphate carboxylase small chain (RuBPCase), as one of key enzymes in photosynthesis, showed a continually downward change trend after salt treatment. The expression level of laccase increased significantly, especially under high-concentration salt stress. Proline dehydrogenase (ProDH) showed a downward change trend, which inhibited the activity of ProDH and promoted the accumulation of proline. The sugar-related genes, such as BACT, glycosyltransferase (GT), and PE, had significant increase in relative gene expressions. The selected TFs showed varied change trends under salt stresses, which may be associated with the complex response pathways to salt stress in pomegranate.

4. Discussion

Salt stress, a prevalent abiotic stress in plant cultivation, notably affects the growth and development of plants, especially in saline–alkali environments [2,13]. Pomegranate, a commonly cultivated fruit tree, exhibits significant salt tolerance, with a salt tolerance index reaching 0.4% [24]. This stress triggers responses in pomegranate leaves through activating the antioxidant enzyme system and accumulating osmoregulatory substances [25,26]. In this study, significant change occurred in the growth, physiological, and biochemical characteristics of pomegranate leaves under salt stress. The activities of SOD and POD were significantly increased to cope with the oxidative stress. These enzymes play a crucial role in mitigating oxidative damage by scavenging ROS and safeguarding cell membrane integrity [27,28,29]. The enhancement in enzyme activity is more pronounced with escalating treatment concentrations and durations, particularly evident in the alterations observed in POD activity. In addition to the antioxidant enzyme system, pomegranate leaves respond to salt stress by accumulating osmoregulatory substances. Following salt treatments, there is a continuous elevation in proline and total soluble sugar levels, aiding in the preservation of intracellular osmotic equilibrium and mitigation of salt-induced damage [29,30]. The ability of pomegranate to manage salt injury by regulating osmosis and ion distribution is essential for maintaining intracellular equilibrium and reducing harm. Therefore, exploring the salt tolerance of pomegranate is pivotal for its successful cultivation and breeding in saline–alkali regions. The differentiation of salt concentrations and key stages post salt treatments has been indicated by four physiological markers. However, a more comprehensive evaluation of pomegranate leaf response to salt stress could be achieved by incorporating additional indicators such as ascorbate peroxidase (APX), catalase (CAT), glutathione peroxidase (GPX), and malondialdehyde (MDA) content, which was a limitation of the current study.
There were 32,630 expressed genes detected in 15 samples in the transcriptome profile. The PCA and HCA results showed that the samples of each concentration and time were clearly distinguished, indicating the requisite sample repeatability for further investigation [31]. There were 6571 DEGs identified in the salt-treated samples, which were mainly involved in signaling pathways and primary- and secondary-metabolite accumulation. Salt stress affects plant growth and development by two means: ion toxicity and osmotic stress [26,29]. Plants respond to abiotic stresses through intricate signal transduction pathways involving Ca2+, plant hormone, and the SOS pathways [32]. These mechanisms detect external stress signals, facilitate the transfer of intracellular signaling molecules, modulate gene expression, and, in turn, activate plant defense and adaptation responses to bolster salt tolerance [33]. The regulation of osmotic regulation ability mainly focused on the increase in cell fluid concentration and enzyme gene expression level. The expression trends of related DEGs and functional annotation were consistent with the responding mechanism of pomegranate. Furthermore, distinct gene expression profiles were observed in leaves under varying concentrations and durations of salt stress, underscoring the complexity of plant responses to different salt stress conditions.
Recently, WGCNA has been used widely for biological and medicinal studies, such as the salt–alkali stress analysis in Gossypium hirsutum [18,34]. In this study, a total of 6571 DEGs (4228 for low-salt treatment and 4121 for high-salt treatment) were used for the WGCNA analysis of the response to salt stress in pomegranate leaves. A total of 180 hub genes with high TOM values were identified in six modules, which were divided into five categories, i.e., carbohydrate catabolic process (CDL15_Pgr003782, CDL15_Pgr010830), adversity stress (CDL15_Pgr002637, CDL15_Pgr011492), cell division regulation (CDL15_Pgr015785, CDL15_Pgr020503), ROS (CDL15_Pgr027567), and signal transduction and ion transportation (CDL15_Pgr024714). The expression changes in structural genes, such as PE and BCAT, could promote salt resistance. Increasing photosynthetic activity contributes to the accumulation of total soluble sugars, to support adaptation to salt stress [35]. BACT showed an up-regulated trend under salt stress in Populus euphratica, and its overexpression could improve the salt tolerance of transgenic plants, suggesting a crucial role for BCAT in salt tolerance mechanisms [36]. The gene expression patterns correlated with enzyme activities and osmotic-regulation substance contents, consistent with findings in Medicago sativa, Prunus mume, and Trollius chinensis [37,38,39].
Transcriptional regulation plays a pivotal role in the plant’s response to salt stress, involving the activation or inhibition of TFs, which enables plants to modify their gene expression patterns to cope with ion imbalance and osmotic stress induced by salinity [40,41]. Various TFs, such as AP2/ERF, HD-ZIP, MYB, and WRKY, have been identified to play roles in the salt-tolerant response process [40,41,42]. Both VaERF3 of Vigna angularis and OsERF71 of Oraza sativa induced the accumulation of proline to improve stress resistance [42,43]. The MYB is known to be crucial in plant abiotic stress responses and has been studied in multiple fruit tree species [40,44,45]. Additionally, GhWRKY41 in Gossypium hirsutum was verified to enhance salt tolerance by regulating stomatal closure, ROS scavenging and antioxidant gene expressions [46]. Moreover, C2H2 plays a key role in abiotic stress-response processes [47]. In this study, 374 TFs, mainly belonging to several TF families, had varied expressions after different salt treatments and were identified to be involved in the response to salt stress in pomegranate. However, the transcriptional regulatory mechanism of physiological and metabolic processes was complex, and needs further study.

5. Conclusions

In this study, the response mechanism of pomegranate leaves to exogenous salt stress was studied by measuring physiological changes and conducting transcriptome analysis. The activities of SOD and POD increased continuously after salt treatment across different concentrations and durations, consistent with the change trends of proline and total soluble sugar contents. Among the detected 32,630 genes, 6571 were identified as DEGs with varying trends under salt treatment. Through WGCNA, 180 hub genes were found in six represented modules. Functional annotation primarily focused on signaling pathways and the accumulation of primary and secondary metabolites. A large number of TFs responsive to salt stress were obtained, such as AP2/ERF, bHLH, MYB, and WRKY, which may play important roles in the response process to salt stress in pomegranate. These findings from this study could reveal the salt-tolerance mechanism of pomegranate leaves, and offer a valuable theoretical foundation for enhancing plant salt tolerance through genetic engineering.

Supplementary Materials

The following supporting information can be downloaded at: https://www.mdpi.com/article/10.3390/agronomy14102261/s1, Table S1: All RT-qPCR primer sequences used in this experiment; Table S2: The list of TFs identified in the Venn clusters; Table S3: The GO annotation of hub genes identified in different modules; Table S4: The KEGG enrichment of hub genes identified in different modules; Table S5: The list of 180 hub genes identified in the module analysis.

Author Contributions

Conceptualization, H.T. and Y.Y.; methodology, H.T.; software, C.W.; validation, H.T., C.W. and J.M.; formal analysis, H.T. and L.F.; investigation, L.F.; resources, Y.Y.; data curation, H.T. and J.M.; writing—original draft preparation, H.T. and Q.W.; writing—review and editing, Y.Y.; visualization, H.T., C.W. and Q.W.; supervision, Y.Y.; project administration, Y.Y.; funding acquisition, H.T. and Y.Y. All authors have read and agreed to the published version of the manuscript.

Funding

This research was funded by the Key Research and Development Project of Shandong Province (2021LZGC007, 2023TZXD088), Agricultural Science and Technology Innovation Project of Shandong Academy of Agricultural Sciences (CXGC2024B09).

Data Availability Statement

The original contributions presented in the study are included in the Article/Supplementary Materials; further inquiries can be directed to the corresponding authors.

Acknowledgments

We are deeply indebted to the entire research team for their support during this research work. Thanks to Shandong KeGene Science & Technology Co., Ltd., for providing technical support for sequencing work.

Conflicts of Interest

The authors declare no conflicts of interest.

References

  1. Kaleem, F.; Shabir, G.; Aslam, K.; Rasul, S.; Manzoor, H.; Shah, S.M.; Khan, A.R. An overview of the genetics of plant response to salt stress: Present status and the way forward. Appl. Biochem. Biotechnol. 2018, 186, 306–334. [Google Scholar] [CrossRef] [PubMed]
  2. Benny, J.; Marchese, A.; Giovino, A.; Marra, F.P.; Perrone, A.; Caruso, T.; Martinelli, F. Gaining insight into exclusive and common transcriptomic features linked to drought and salinity responses across fruit tree crops. Plants 2020, 9, 1059. [Google Scholar] [CrossRef]
  3. Bhantana, P.; Lazarovitch, N. Evapotranspiration, crop coefficient and growth of two young pomegranate (Punica granatum L.) varieties under salt stress. Agric. Water Manag. 2010, 97, 715–722. [Google Scholar] [CrossRef]
  4. Assaha, D.V.M.; Ueda, A.; Saneoka, H.; Al-Yahyai, R.; Yaish, M.W. The Role of Na+ and K+ transporters in salt stress adaptation in glycophytes. Front. Physiol. 2017, 8, 509. [Google Scholar] [CrossRef] [PubMed]
  5. Acosta-Motos, J.R.; Ortuño, M.F.; Bernal-Vicente, A.; Diaz-Vivancos, P.; Sanchez-Blanco, M.J.; Hernandez, J.A. Plant responses to salt stress: Adaptive mechanisms. Agronomy 2017, 7, 18. [Google Scholar] [CrossRef]
  6. Wakamatsu, A.; Mori, I.C.; Matsuura, T.; Taniwaki, Y.; Ishii, R.; Yoshida, R. Possible roles for phytohormones in controlling the stomatal behavior of Mesembryanthemum crystallinum during the salt-induced transition from C3 to crassulacean acid metabolism. J. Plant Physiol. 2021, 262, 153448. [Google Scholar] [CrossRef] [PubMed]
  7. Zhu, D.; Luo, F.; Zou, R.; Liu, J.X.; Yan, Y.M. Integrated physiological and chloroplast proteome analysis of wheat seedling leaves under salt and osmotic stresses. J. Proteom. 2021, 234, 104097. [Google Scholar] [CrossRef]
  8. Koselski, M.; Trebacz, K.; Dziubinska, H. The role of vacuolar ion channels in salt stress tolerance in the liverwort Conocephalum conicum. Acta Physiol. Plant. 2019, 41, 110. [Google Scholar] [CrossRef]
  9. Shen, W.Q.; Liu, D.; Zhang, H.; Zhu, W.; He, H.Z.; Li, G.H.; Liu, J.W. Overexpression of β-cyanoalanine synthase of Prunus persica increases salt tolerance by modulating ROS metabolism and ion homeostasis. Environ. Exp. Bot. 2021, 186, 104431. [Google Scholar] [CrossRef]
  10. Rahimi, E.; Nazari, F.; Javadi, T.; Samadi, S.; Teixeira da Silva, J.A. Potassium-enriched clinoptilolite zeolite mitigates the adverse impacts of salinity stress in perennial ryegrass (Lolium perenne L.) by increasing silicon absorption and improving the K/Na ratio. J. Environ. Manag. 2021, 285, 112142. [Google Scholar] [CrossRef] [PubMed]
  11. Khayyat, M.; Tehranifar, A.; Davarynejad, G.H.; Sayyari-Zahan, M.H. Vegetative growth, compatible solute accumulation, ion partitioning and chlorophyll fluorescence of ‘Malas-e-Saveh’ and ‘Shishe-Kab’ pomegranates in response to salinity stress. Photosynthetica 2014, 52, 301–312. [Google Scholar] [CrossRef]
  12. Savoi, S.; Wong, D.C.J.; Arapitsas, P.; Miculan, M.; Bucchetti, B.; Peterlunger, E.; Fait, A.; Mattivi, F.; Castellarin, S.D. Transcriptome and metabolite profiling reveals that prolonged drought modulates the phenylpropanoid and terpenoid pathway in white grapes (Vitis vinifera L.). BMC Plant Biol. 2016, 16, 67. [Google Scholar] [CrossRef] [PubMed]
  13. Peng, Z.; He, S.P.; Gong, W.F.; Xu, F.F.; Pan, Z.E.; Jia, Y.H.; Geng, X.L.; Du, X.M. Integration of proteomic and transcriptomic profiles reveals multiple levels of genetic regulation of salt tolerance in cotton. BMC Plant Biol. 2018, 18, 128. [Google Scholar] [CrossRef] [PubMed]
  14. Wu, Q.K.; Chen, H.; Zhang, Z.H.; Chen, C.; Yu, F.Y.; Guy, R.D. Effects of fruit shading on gene and protein expression during starch and oil accumulation in developing Styrax tonkinensis kernels. Front. Plant Sci. 2022, 13, 905633. [Google Scholar] [CrossRef] [PubMed]
  15. Guo, Y.; Gao, C.Y.; Wang, M.K.; Fu, F.F.; El-Kassaby, Y.A.; Wang, T.L.; Wang, G.B. Metabolome and transcriptome analyses reveal flavonoids biosynthesis differences in Ginkgo biloba associated with environmental conditions. Ind. Crops Prod. 2020, 158, 112963. [Google Scholar] [CrossRef]
  16. Shi, J.L.; Wang, S.; Yao, J.A.; Cui, M.Y.; Hu, B.Q.; Wang, J.; Li, F.; Wang, S.; Tong, R.R.; Li, M.; et al. Ultrasound treatment alleviates external pericarp browning and improves fruit quality of pomegranate during storage. J. Sci. Food Agric. 2024, 104, 391–399. [Google Scholar] [CrossRef]
  17. Zhang, P.; Duo, T.Q.; Wang, F.D.; Zhang, X.Z.; Yang, Z.Z.; Hu, G.F. De novo transcriptome in roots of switchgrass (Panicum virgatum L.) reveals gene expression dynamic and act network under alkaline salt stress. BMC Genom. 2021, 22, 82. [Google Scholar] [CrossRef] [PubMed]
  18. Yang, J.W.; Ren, Y.J.; Zhang, D.Y.; Chen, X.W.; Huang, J.Z.; Xu, Y.; Aucapiña, C.B.; Zhang, Y.; Miao, Y. Transcriptome-based WGCNA analysis reveals regulated metabolite fluxes between floral color and scent in Narcissus tazetta flower. Int. J. Mol. Sci. 2021, 22, 8249. [Google Scholar] [CrossRef]
  19. Chen, C.; Chen, H.; Han, C.; Liu, Z.M.; Yu, F.Y.; Wu, Q.K. 24-Epibrassinolide and methyl jasmonate promoted seed development of Styrax tonkinensis and affected seed chemical compositions, especially seed lipid metabolism. J. Plant Growth Regul. 2023, 42, 2162–2175. [Google Scholar] [CrossRef]
  20. Wu, Q.K.; Cao, Y.Y.; Zhao, X.; Zhang, Z.H.; Yu, F.Y.; Guy, R.D. A comparative study of seed reserve accumulation in five Styrax species with potential for biofuel production. Trees Struct. Funct. 2020, 34, 891–902. [Google Scholar] [CrossRef]
  21. Wang, Y.T.; Li, S.P.; Zhu, Z.Q.; Xu, Z.D.; Qi, S.; Xing, S.T.; Yu, Y.Y.; Wu, Q.K. Transcriptome and chemical analyses revealed the mechanism of flower color formation in Rosa rugosa. Front. Plant Sci. 2022, 13, 1021521. [Google Scholar] [CrossRef]
  22. Pei, G.; Chen, L.; Zhang, W. WGCNA application to proteomic and metabolomic data analysis. Methods Enzymol. 2017, 585, 135–158. [Google Scholar] [PubMed]
  23. Bolger, A.M.; Lohse, M.; Usadel, B. Trimmomatic: A flexible trimmer for Illumina sequence data. Bioinformatics 2014, 30, 2114–2120. [Google Scholar] [CrossRef]
  24. Liu, C.Y.; Zhao, Y.J.; Zhao, X.Q.; Dong, J.M.; Yuan, Z.H. Genome-wide identification and expression analysis of the CLC gene family in pomegranate (Punica granatum) reveals its roles in salt resistance. BMC Plant Biol. 2020, 20, 560. [Google Scholar] [CrossRef]
  25. Dien, D.C.; Mochizuki, T.; Yamakawa, T. Effect of various drought stresses and subsequent recovery on proline, total soluble sugar and starch metabolisms in Rice (Oryza sativa L.) varieties. Plant Prod. Sci. 2019, 22, 530–545. [Google Scholar] [CrossRef]
  26. Dong, J.M.; Liu, C.Y.; Wang, Y.Y.; Zhao, Y.J.; Ge, D.P.; Yuan, Z.H. Genome-wide identification of the NHX gene family in Punica granatum L. and their expressional patterns under salt stress. Agronomy 2021, 11, 264. [Google Scholar] [CrossRef]
  27. Zhang, M.; Smith, J.A.C.; Harberd, N.P.; Jiang, C.F. The regulatory roles of ethylene and reactive oxygen species (ROS) in plant salt stress responses. Plant Mol. Biol. 2016, 91, 651–659. [Google Scholar] [CrossRef] [PubMed]
  28. Chakraborty, K.; Bishi, S.K.; Goswami, N.; Singh, A.L.; Zala, P.V. Differential fine-regulation of enzyme driven ROS detoxification network imparts salt tolerance in contrasting peanut genotypes. Environ. Exp. Bot. 2016, 128, 79–90. [Google Scholar] [CrossRef]
  29. Yang, Y.; Yao, Y.D.; Li, J.; Zhang, J.; Zhang, X.D.; Hu, L.X.; Ding, D.X.; Bakpa, E.P.; Xie, J.M. Trehalose alleviated salt stress in tomato by regulating ROS metabolism, photosynthesis, osmolyte synthesis, and trehalose metabolic pathways. Front. Plant Sci. 2022, 13, 772948. [Google Scholar] [CrossRef] [PubMed]
  30. Zulfiqar, F.; Nafees, M.; Moosa, A.; Ferrante, A.; Darras, A. Melatonin induces proline, secondary metabolites, sugars and antioxidants activity to regulate oxidative stress and ROS scavenging in salt stressed sword lily. Heliyon 2024, 10, E32569. [Google Scholar] [CrossRef] [PubMed]
  31. Wu, Q.K.; Zhao, X.; Chen, C.; Zhang, Z.H.; Yu, F.Y. Metabolite profiling and classification of developing Styrax tonkinensis kernels. Metabolites 2020, 10, 21. [Google Scholar] [CrossRef] [PubMed]
  32. Xiao, F.; Zhou, H.P. Plant salt response: Perception, signaling, and tolerance. Front. Plant Sci. 2023, 13, 1053699. [Google Scholar] [CrossRef]
  33. Zhang, T.; Sun, K.L.; Chang, X.K.; Ouyang, Z.P.; Meng, G.; Han, Y.A.; Shen, S.S.; Yao, Q.J.; Piao, F.Z.; Wang, Y. Comparative physiological and transcriptomic analyses of two contrasting pepper genotypes under salt stress reveal complex salt tolerance mechanisms in seedlings. Int. J. Mol. Sci. 2022, 23, 9701. [Google Scholar] [CrossRef]
  34. Zheng, X.; Su, Y.L.; Chen, Y.G.; Huang, H.N.; Shen, Q.T. Global transcriptional responses of denitrifying bacteria to functionalized single-walled carbon nanotubes revealed by weighted gene-coexpression network analysis. Sci. Total Environ. 2018, 613, 1240–1249. [Google Scholar] [CrossRef] [PubMed]
  35. Mansuri, R.M.; Shobbar, Z.S.; Jelodar, N.B.; Ghaffari, M.; Mohammadi, S.M.; Daryani, P. Salt tolerance involved candidate genes in rice: An integrative meta-analysis approach. BMC Plant Biol. 2020, 20, 452. [Google Scholar]
  36. Qaisar, U.; Irfan, M.; Meqbool, A.; Zahoor, M.; Khan, M.Y.; Rashid, B.; Riazuddin, S.; Husnain, T. Identification, sequencing and characterization of a stress induced homologue of fructose bisphosphate aldolase from cotton. Can. J. Plant Sci. 2010, 90, 41–48. [Google Scholar] [CrossRef]
  37. Niu, J.P.; Chen, Z.; Guo, Z.P.; Xu, N.; Sui, X.; Roy, M.; Kareem, H.A.; Ul Hassan, M.; Cui, J.; Wang, Q.Z. Exogenous melatonin promotes the growth of alfalfa (Medicago sativa L.) under NaCl stress through multiple pathways. Ecotoxicol. Environ. Saf. 2022, 242, 113938. [Google Scholar] [CrossRef] [PubMed]
  38. Wang, X.J.; Song, Z.Q.; Ti, Y.J.; Liu, Y.X.; Li, Q.W. Physiological response and transcriptome analysis of Prunus mume to early salt stress. J. Plant Biochem. Biotechnol. 2022, 31, 330–342. [Google Scholar] [CrossRef]
  39. Hou, R.M.; Yang, L.Z.; Wuyun, T.; Chen, S.Y.; Zhang, L. Genes related to osmoregulation and antioxidation play important roles in the response of Trollius chinensis seedlings to saline-alkali stress. Front. Plant Sci. 2023, 14, 1080504. [Google Scholar] [CrossRef] [PubMed]
  40. Wei, Q.H.; Chen, R.; Wei, X.; Liu, Y.H.; Zhao, S.J.; Yin, X.P.; Xie, T. Genome-wide identification of R2R3-MYB family in wheat and functional characteristics of the abiotic stress responsive gene TaMYB344. BMC Genom. 2020, 21, 792. [Google Scholar] [CrossRef] [PubMed]
  41. Yu, Y.A.; Wu, Y.X.; He, L.Y. A wheat WRKY transcription factor TaWRKY17 enhances tolerance to salt stress in transgenic Arabidopsis and wheat plant. Plant Mol. Biol. 2023, 113, 171–191. [Google Scholar] [CrossRef]
  42. Li, W.Y.; Wang, C.; Shi, H.H.; Wang, B.; Wang, J.X.; Liu, Y.S.; Ma, J.Y.; Tian, S.Y.; Zhang, Y.W. Genome-wide analysis of ethylene-response factor family in adzuki bean and functional determination of VaERF3 under saline-alkaline stress. Plant Physiol. Biochem. 2020, 147, 215–222. [Google Scholar] [CrossRef] [PubMed]
  43. Li, J.J.; Guo, X.; Zhang, M.H.; Wang, X.; Zhao, Y.; Yin, Z.G.; Zhang, Z.Y.; Wang, Y.M.; Xiong, H.Y.; Zhang, H.L.; et al. OsERF71 confers drought tolerance via modulating ABA signaling and proline biosynthesis. Plant Sci. 2018, 270, 131–139. [Google Scholar] [CrossRef]
  44. Chen, H.H.; Lai, L.Y.; Li, L.X.; Liu, L.P.; Jakada, B.H.; Huang, Y.M.; He, Q.; Chai, M.N.; Niu, X.P.; Qin, Y. AcoMYB4, an Ananas comosus L. MYB transcription factor, functions in osmotic stress through negative regulation of ABA signaling. Int. J. Mol. Sci. 2020, 21, 5727. [Google Scholar] [CrossRef]
  45. Chen, K.Q.; Song, M.R.; Guo, Y.N.; Liu, L.F.; Xue, H.; Dai, H.Y.; Zhang, Z.H. MdMYB46 could enhance salt and osmotic stress tolerance in apple by directly activating stress-responsive signals. Plant Biotechnol. J. 2019, 17, 2341–2355. [Google Scholar] [CrossRef] [PubMed]
  46. Chu, X.Q.; Wang, C.; Chen, X.B.; Lu, W.J.; Li, H.; Wang, X.L.; Hao, L.L.; Guo, X.Q. The cotton WRKY gene GhWRKY41 positively regulates salt and drought stress tolerance in transgenic Nicotiana benthamiana. PLoS ONE 2015, 10, e0143022. [Google Scholar] [CrossRef] [PubMed]
  47. Han, G.L.; Lu, C.X.; Guo, J.R.; Qiao, Z.Q.; Sui, N.; Qiu, N.W.; Wang, B.H. C2H2 zinc finger proteins: Master regulators of abiotic stress responses in plants. Front. Plant Sci. 2020, 11, 115. [Google Scholar] [CrossRef] [PubMed]
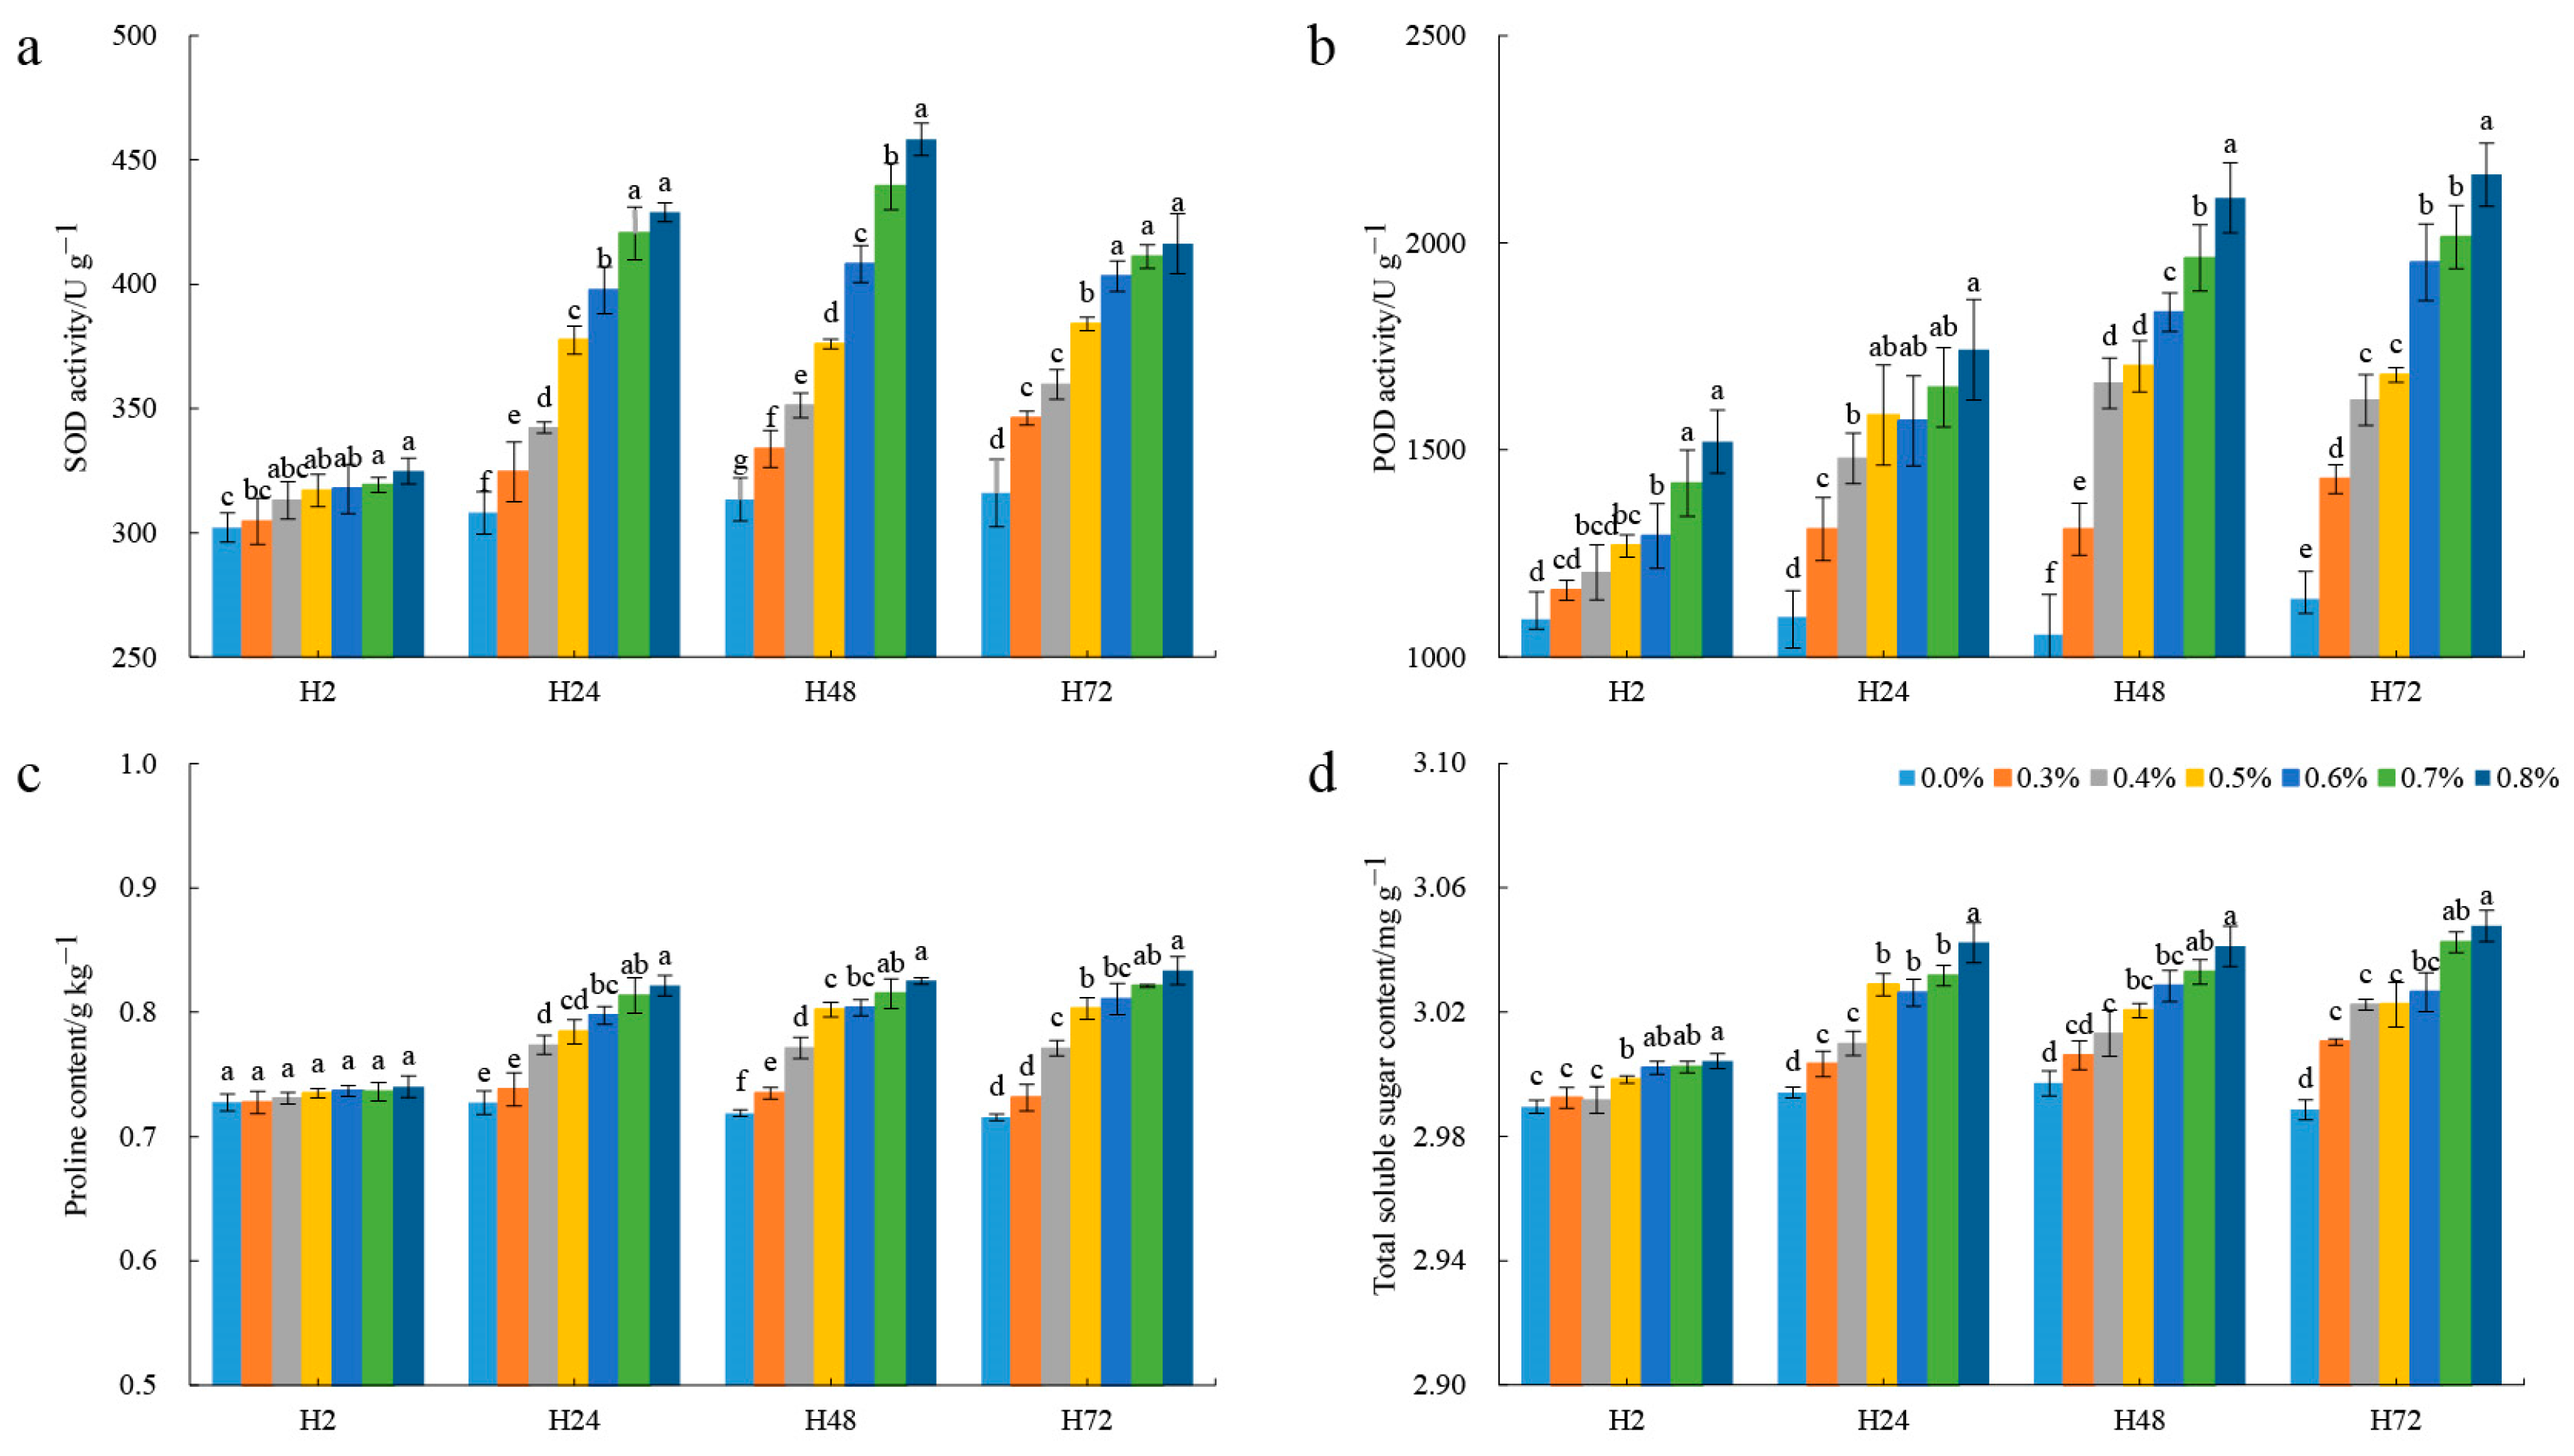
Figure 1. The change trends of physiological characteristics under different salt treatments. (a) SOD activity; (b) POD activity; (c) proline content; (d) total soluble sugar content. The different small letters indicate significant difference between clusters at α = 0.05 based on Duncan’s test.
Agronomy 14 02261 g001
Figure 2. Gene expression analysis under different salt treatments. (a) Expression level distribution of different samples; (b) heatmap of sample correlation analysis result based on global transcriptome expression; (c) PCA result based on global transcriptome expression; (d) HCA result based on global transcriptome expression.
Agronomy 14 02261 g002
Figure 3. Gene distribution and functional annotation of DEGs between different treatments. (a) The distribution of up- and down-regulated DEGs in different samples; (b) the Venn diagram analysis; (c) GO annotation analysis; (d) KEGG enrichment analysis.
Agronomy 14 02261 g003
Figure 4. Expression profile of DEGs associated with salt stress. AKT: Non-specific serine/threonine protein kinase; AMY: Alpha-amylase; ARF: Auxin response factor; BACT: Fructose-bisphosphate aldolase; CAT: Catalase; CESA: Cellulose synthase; CP: Carboxypeptidase; CPA: Vacuolar cation/proton exchanger; CTA: Calcium-transporting ATPase; DGK: Diacylglycerol kinase; EG: Endoglucanase; GAL: Beta-galactosidase; GAPD: Glyceraldehyde-3-phosphate dehydrogenase; GDH: Glutamate dehydrogenase; HKT: Potassium transporter; IAA: Auxin-responsive protein; MDH: Malate dehydrogenase; NHX: Sodium/hydrogen exchanger; PE: Pectinesterase; PFN: Profilin; PFP: Pyrophosphate-fructose 6-phosphate 1-phosphotransferase; PIN: Auxin efflux carrier component; PLP: Patatin-like protein; POD: Peroxidase; PP: Serine/threonine-protein phosphatase; SUS: Sucrose synthase; SWEET: Bidirectional sugar transporter SWEET; TPP: Trehalose 6-phosphate phosphatase.
Agronomy 14 02261 g004
Figure 5. The number and expression patterns of differentially expressed TFs under different salt treatments. (a) The distribution of identified TFs; (b) the expression patterns of identified TFs. The black lines represented the overall expression trend of TF in each group.
Agronomy 14 02261 g005
Figure 6. The construction of DEG weighted co-expression network. (a) Clustering dendrogram of DEGs; (b) gene number of each module. Different color regions provide a simple visual comparison of module assignments based on the dynamic hybrid branch-cutting method.
Agronomy 14 02261 g006
Figure 7. Visualization of gene expression levels and eigengene values of significant modules. (a) Correlation analysis between modules and treatments; (b) Gene expression patterns of each module.
Agronomy 14 02261 g007
Figure 8. Visualization network of genes connections in each module. The genes with red and blue borders are the identified hub genes and TFs, respectively.
Agronomy 14 02261 g008
Figure 9. Gene expression patterns of twelve key genes under different salt treatments measured by RT-qPCR and RNA-Seq, respectively.
Agronomy 14 02261 g009
Table 1. Overview of the transcriptome sequencing dataset and quality check.
Sample NameRaw ReadsClean ReadsQ30/%GC Content/%Mapping Rate/%
CK70,565,33367,423,74796.8650.8396.48
HH2466,980,42164,152,33396.8650.5695.81
HH4867,902,70065,028,69896.8150.5896.29
LH2467,390,39364,555,54096.7450.6595.92
LH4865,291,75362,395,16196.8650.7196.19
Mean67,626,12064,711,09696.8350.6796.14
SD5,818,5995,485,9380.080.120.43
Disclaimer/Publisher’s Note: The statements, opinions and data contained in all publications are solely those of the individual author(s) and contributor(s) and not of MDPI and/or the editor(s). MDPI and/or the editor(s) disclaim responsibility for any injury to people or property resulting from any ideas, methods, instructions or products referred to in the content.