
Effects of Fallow Season Water and Straw Management on Methane Emissions and Associated Microorganisms


Abstract
1. Introduction
2. Materials and Methods
2.1. Experimental Site
2.2. Experimental Design
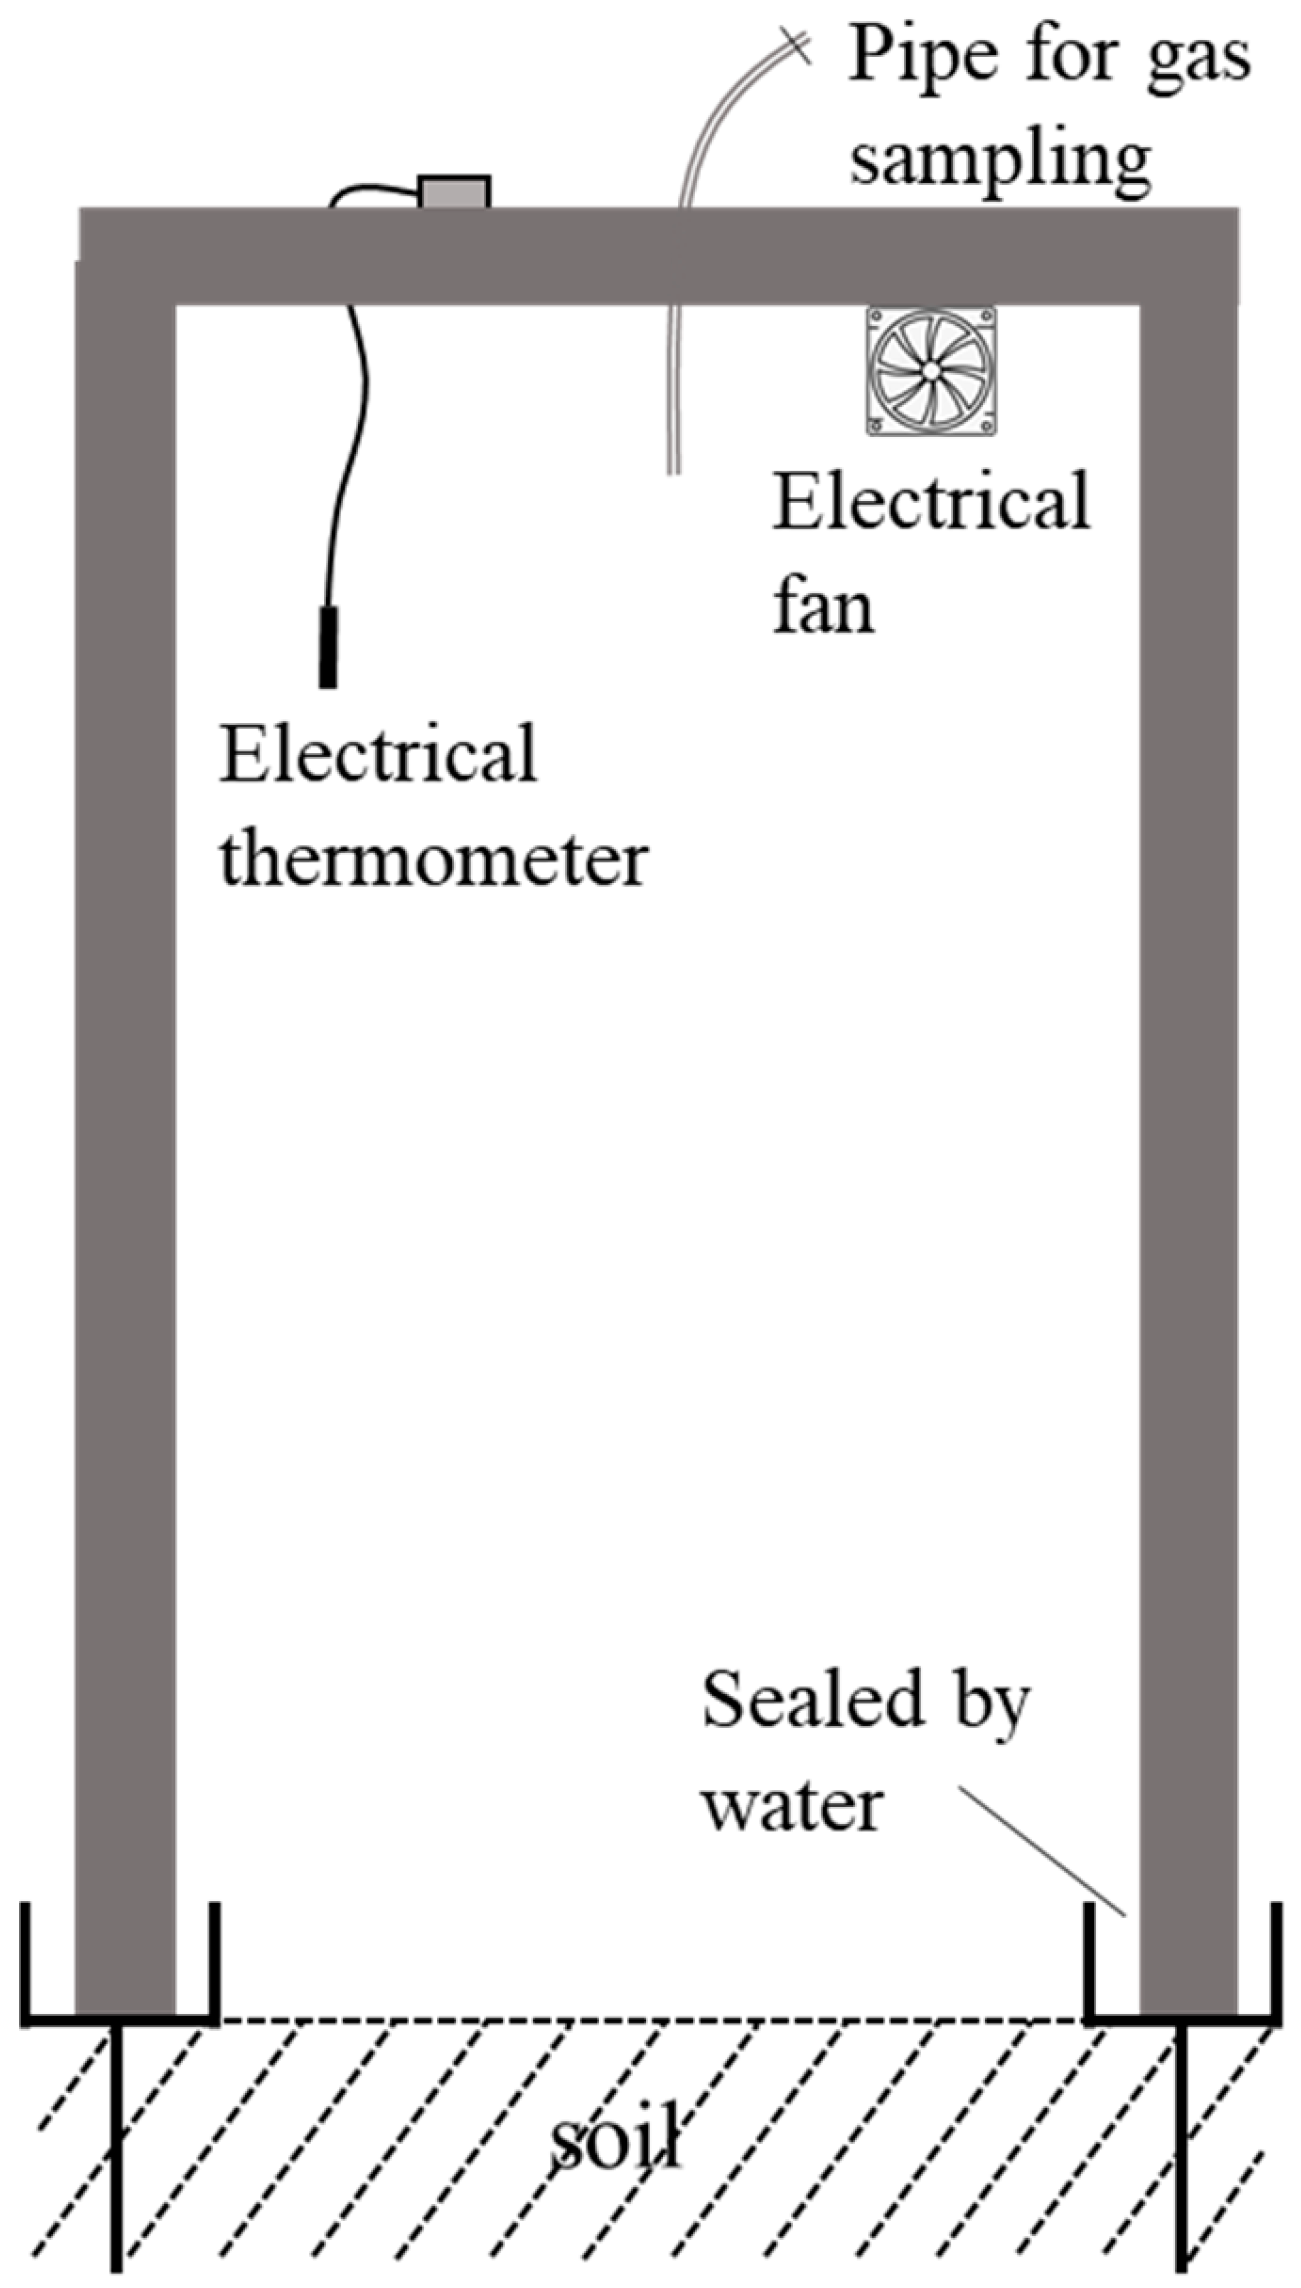
2.3. CH4 Measurement
2.4. Soil Sampling and Processing
2.5. Molecular Analysis
2.5.1. Soil Microbial DNA Preparation
2.5.2. Terminal Restriction Fragment Length Polymorphism (T-RFLP) Analysis
2.5.3. Quantitative PCR
2.6. Statistical Analysis
3. Results
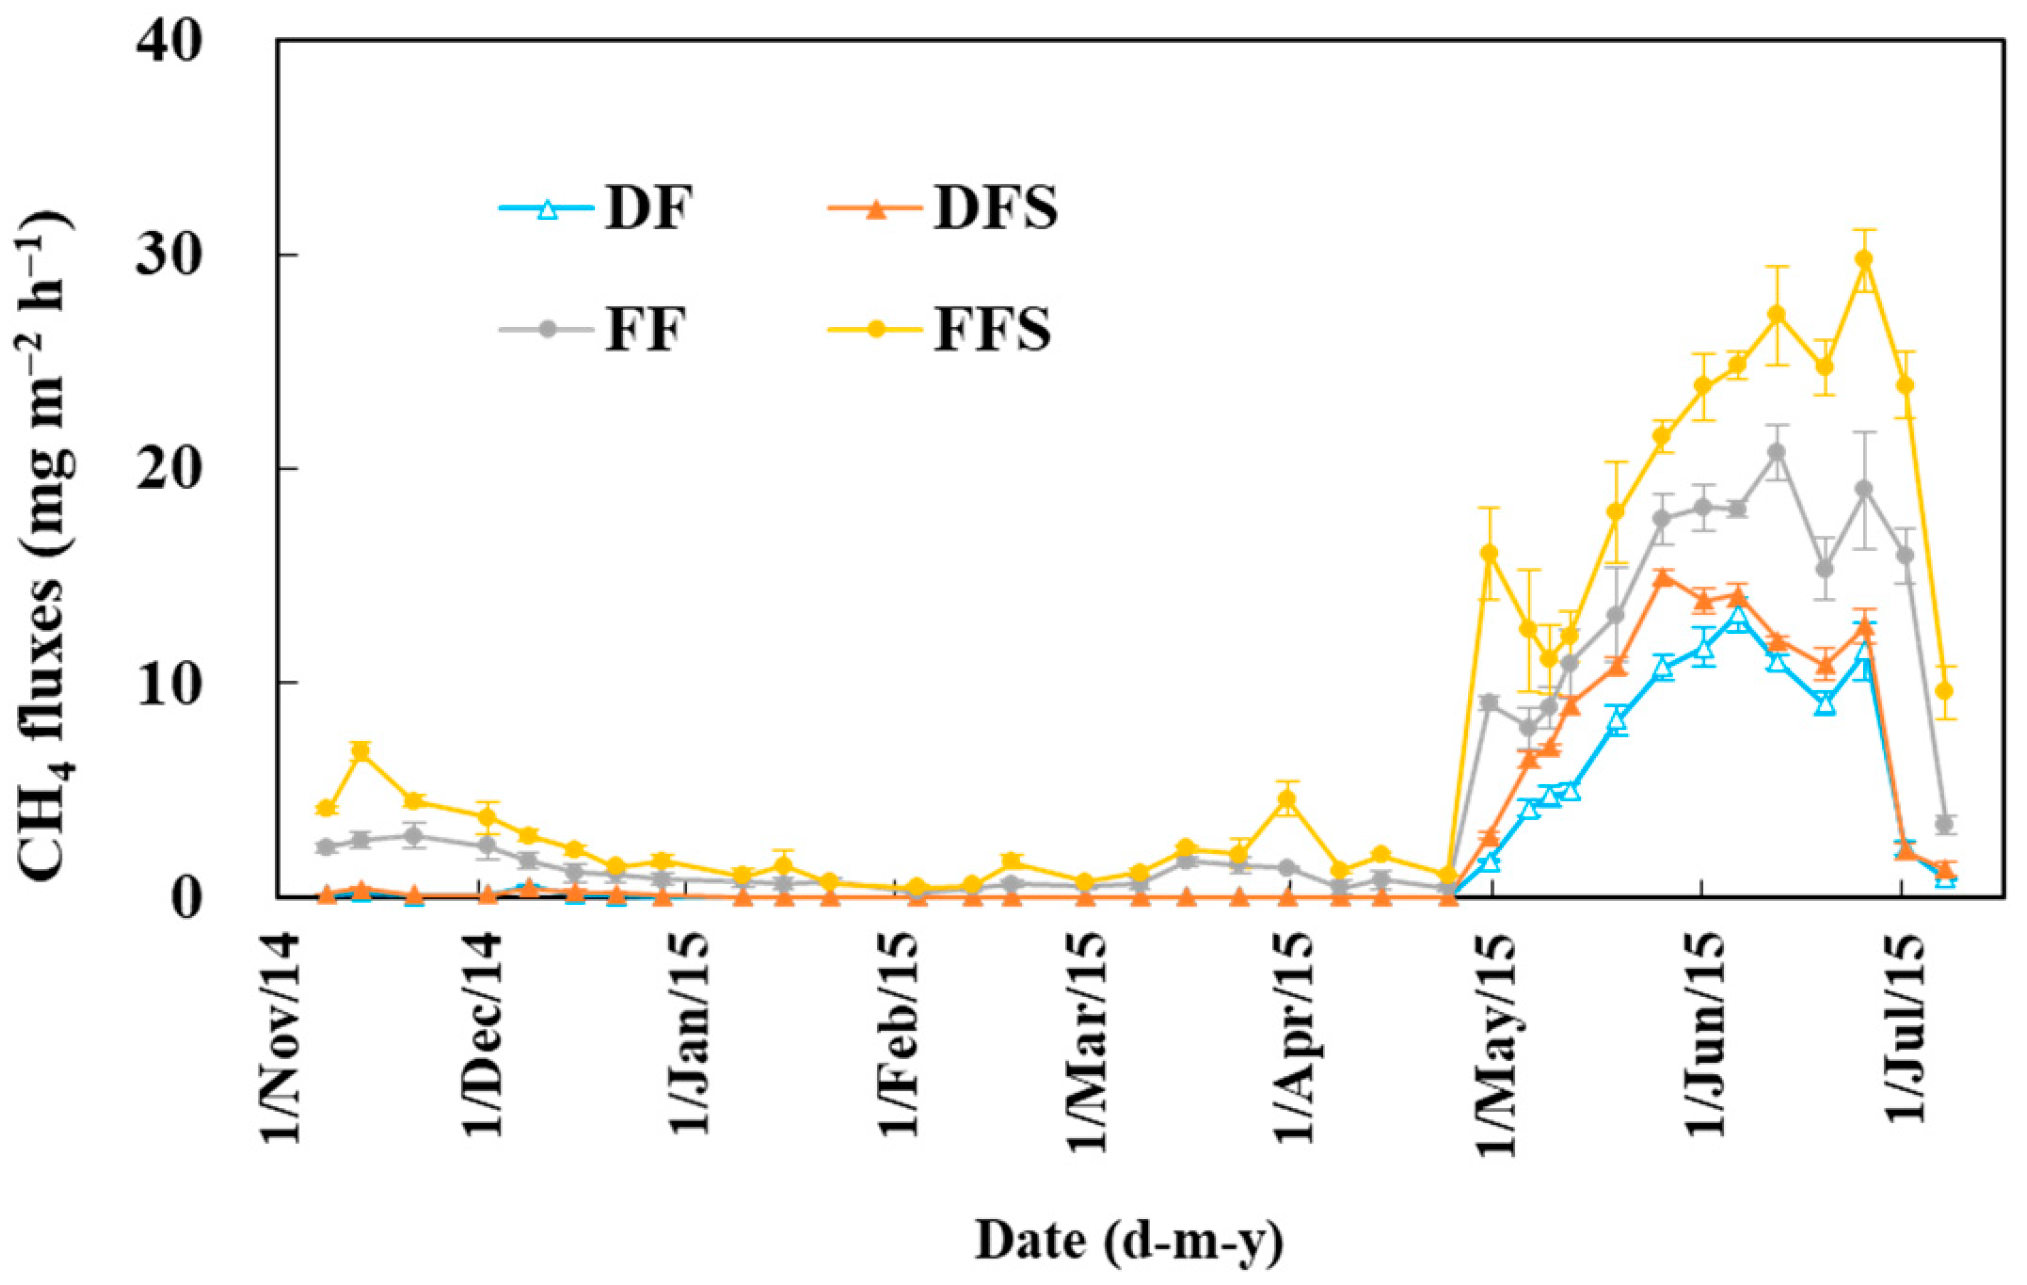
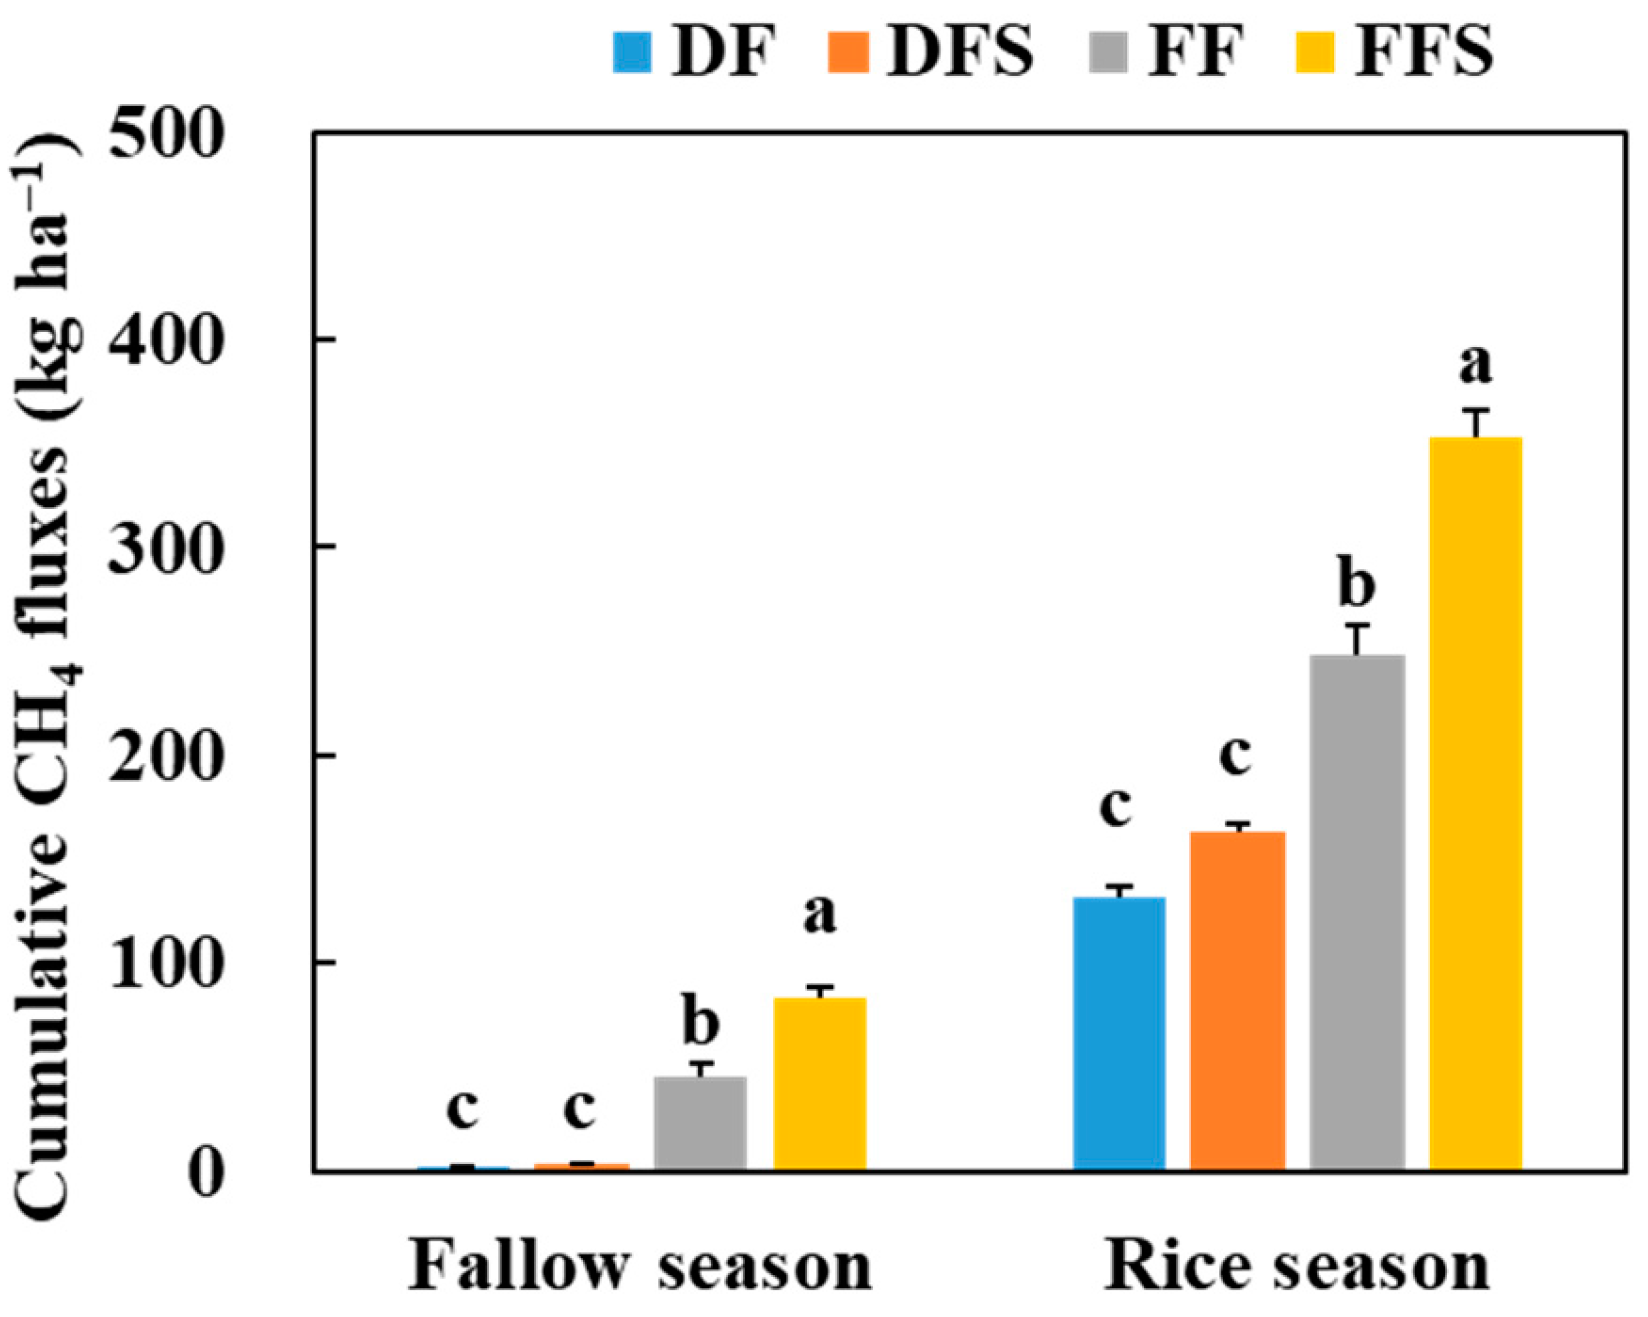
3.1. CH4 Emissions
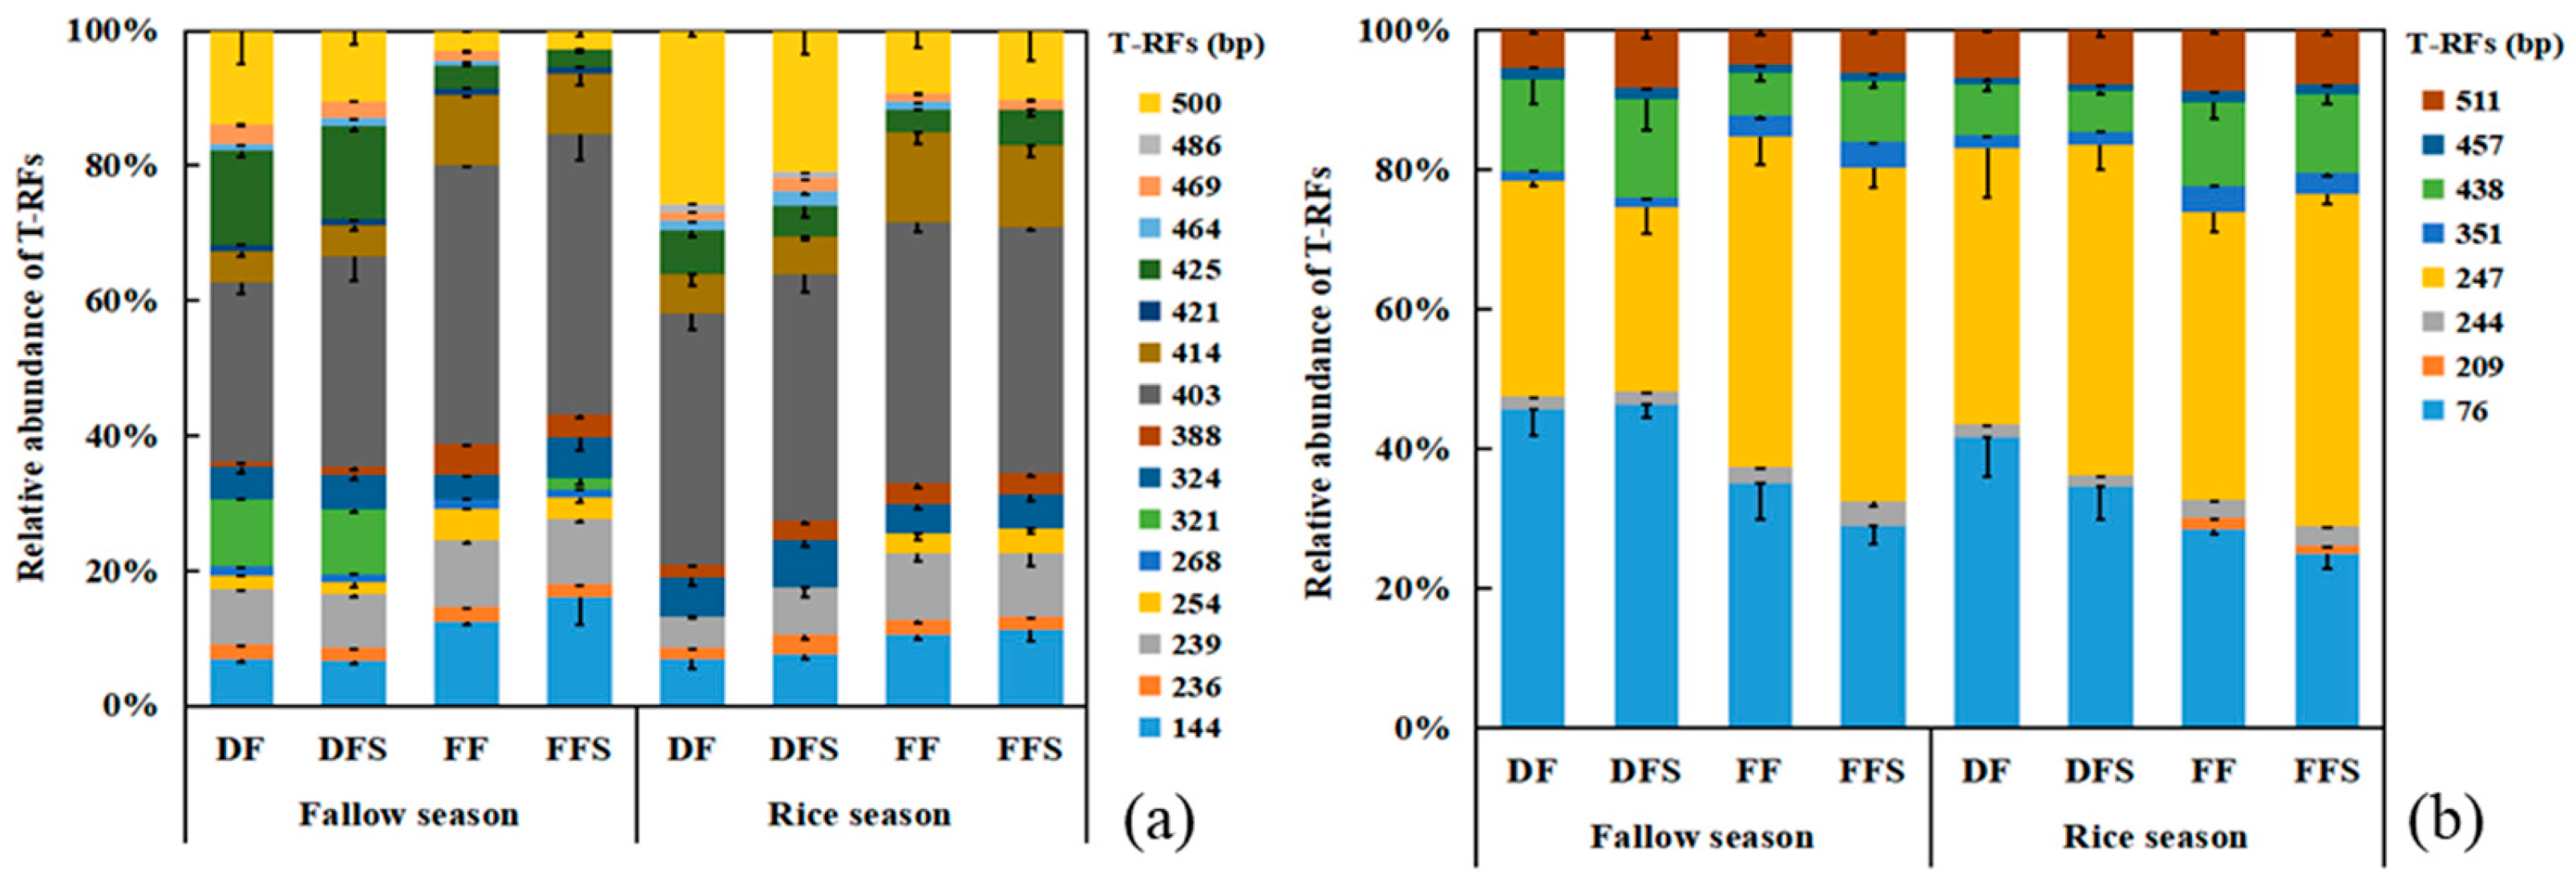
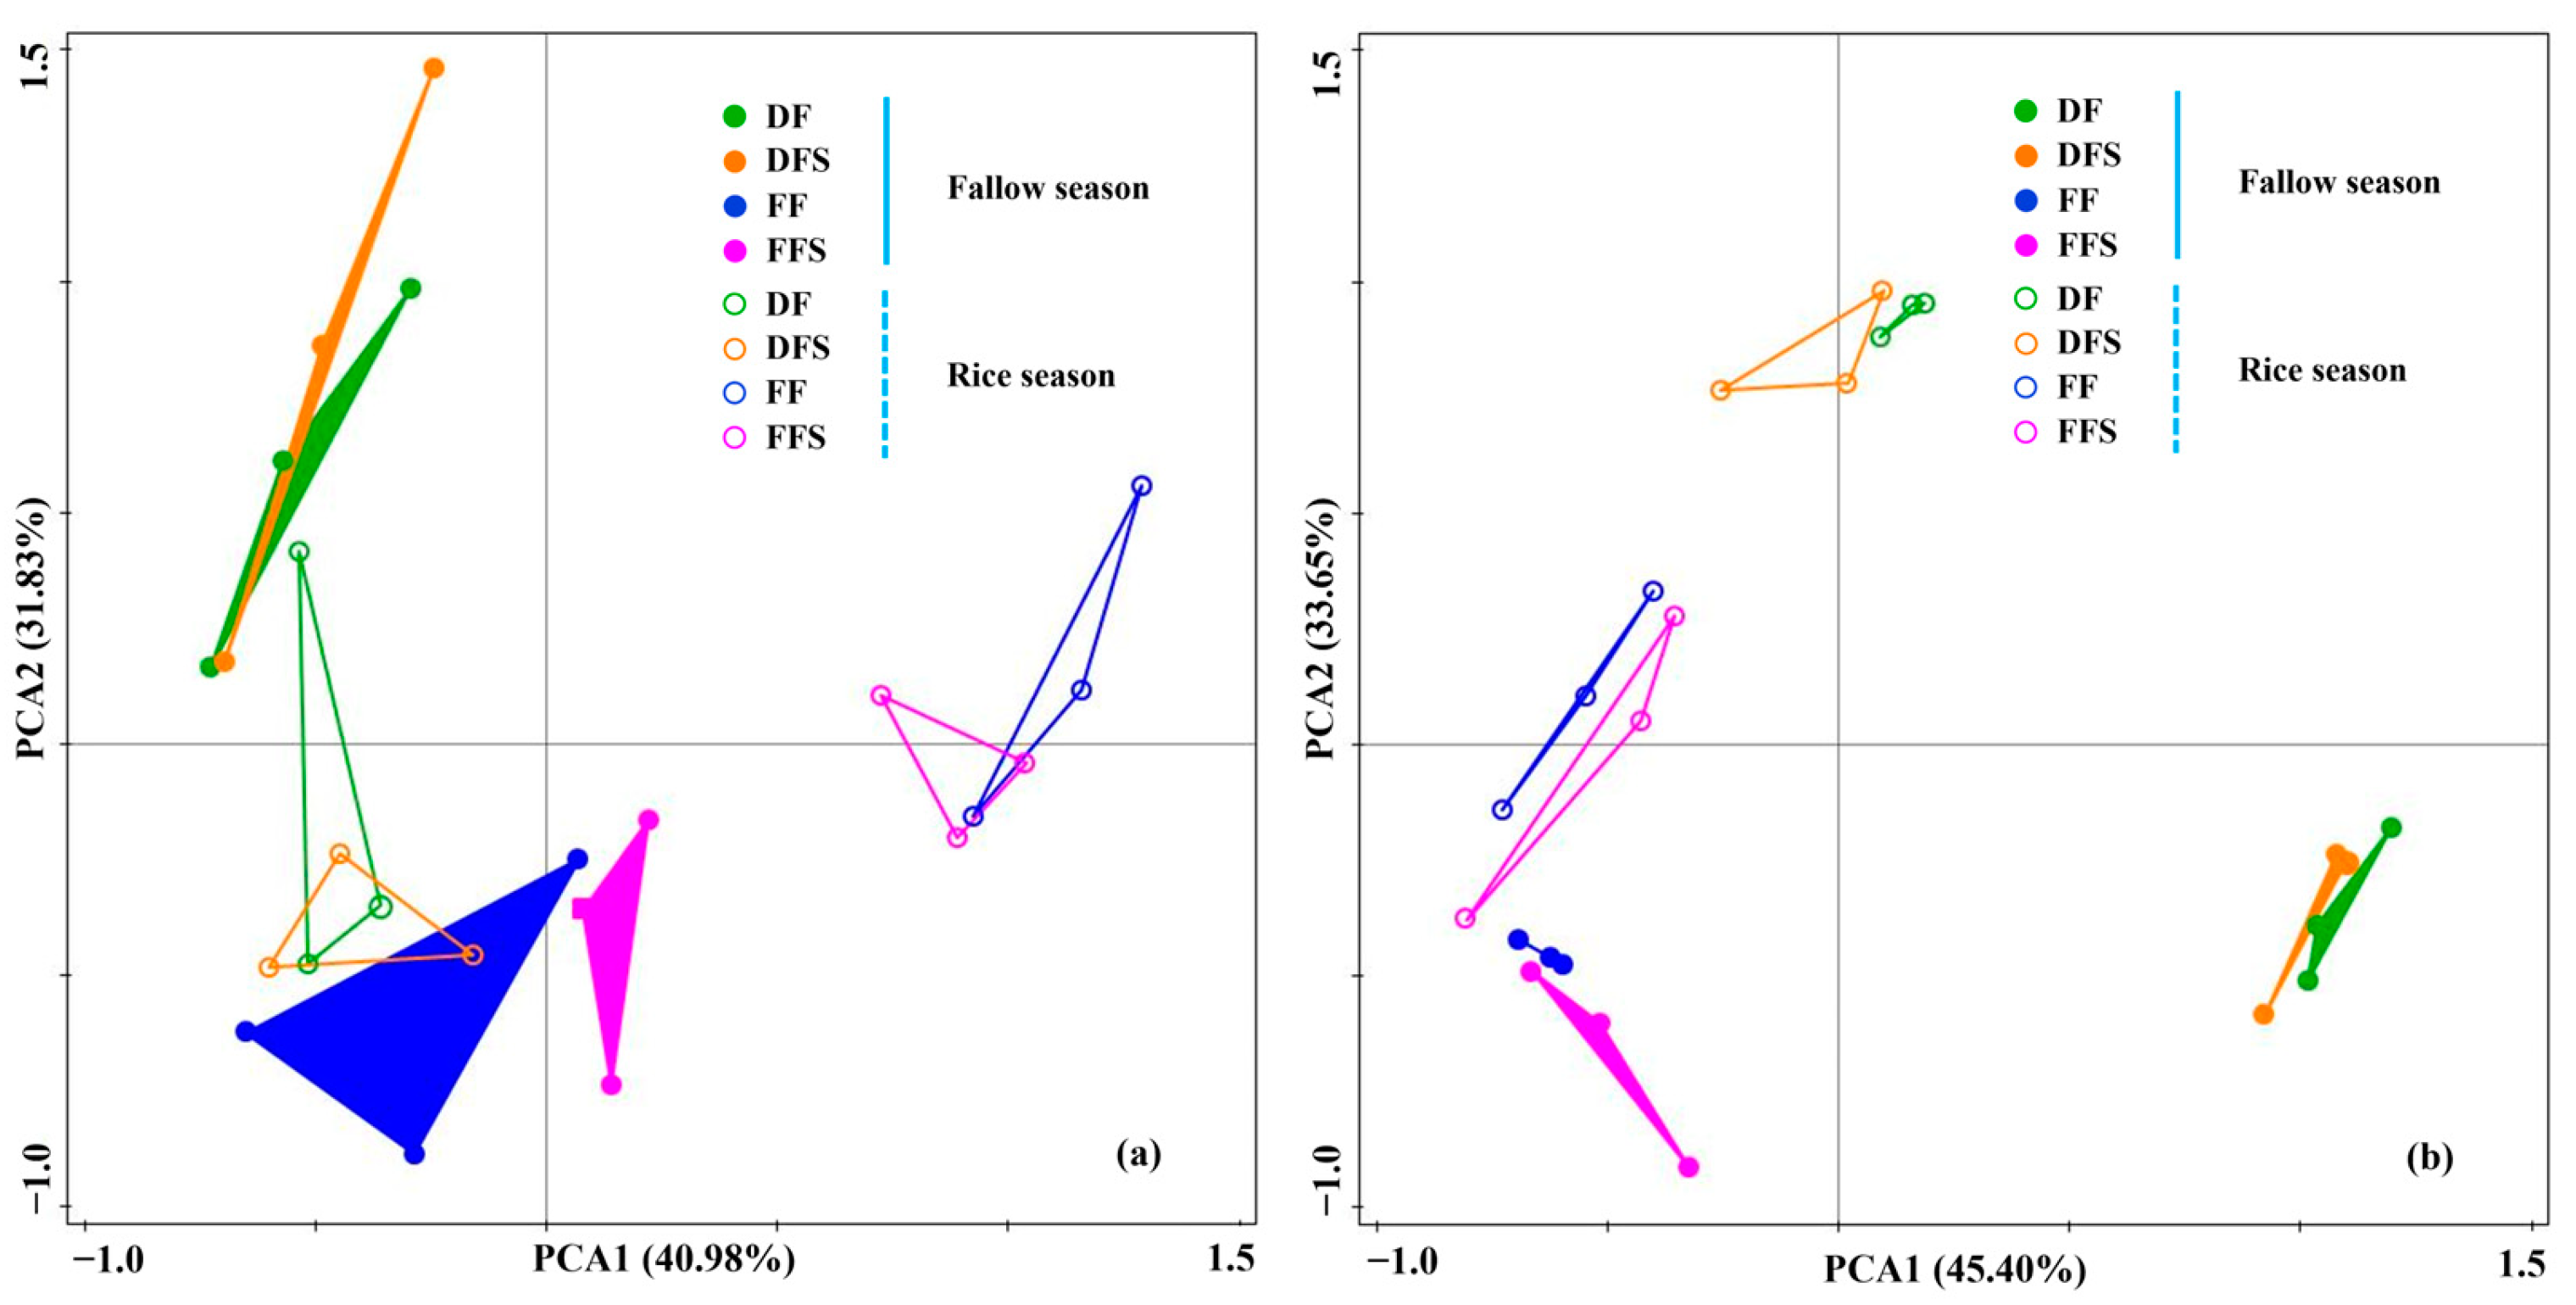
3.2. Community Composition of Methanogens and Methanotrophs
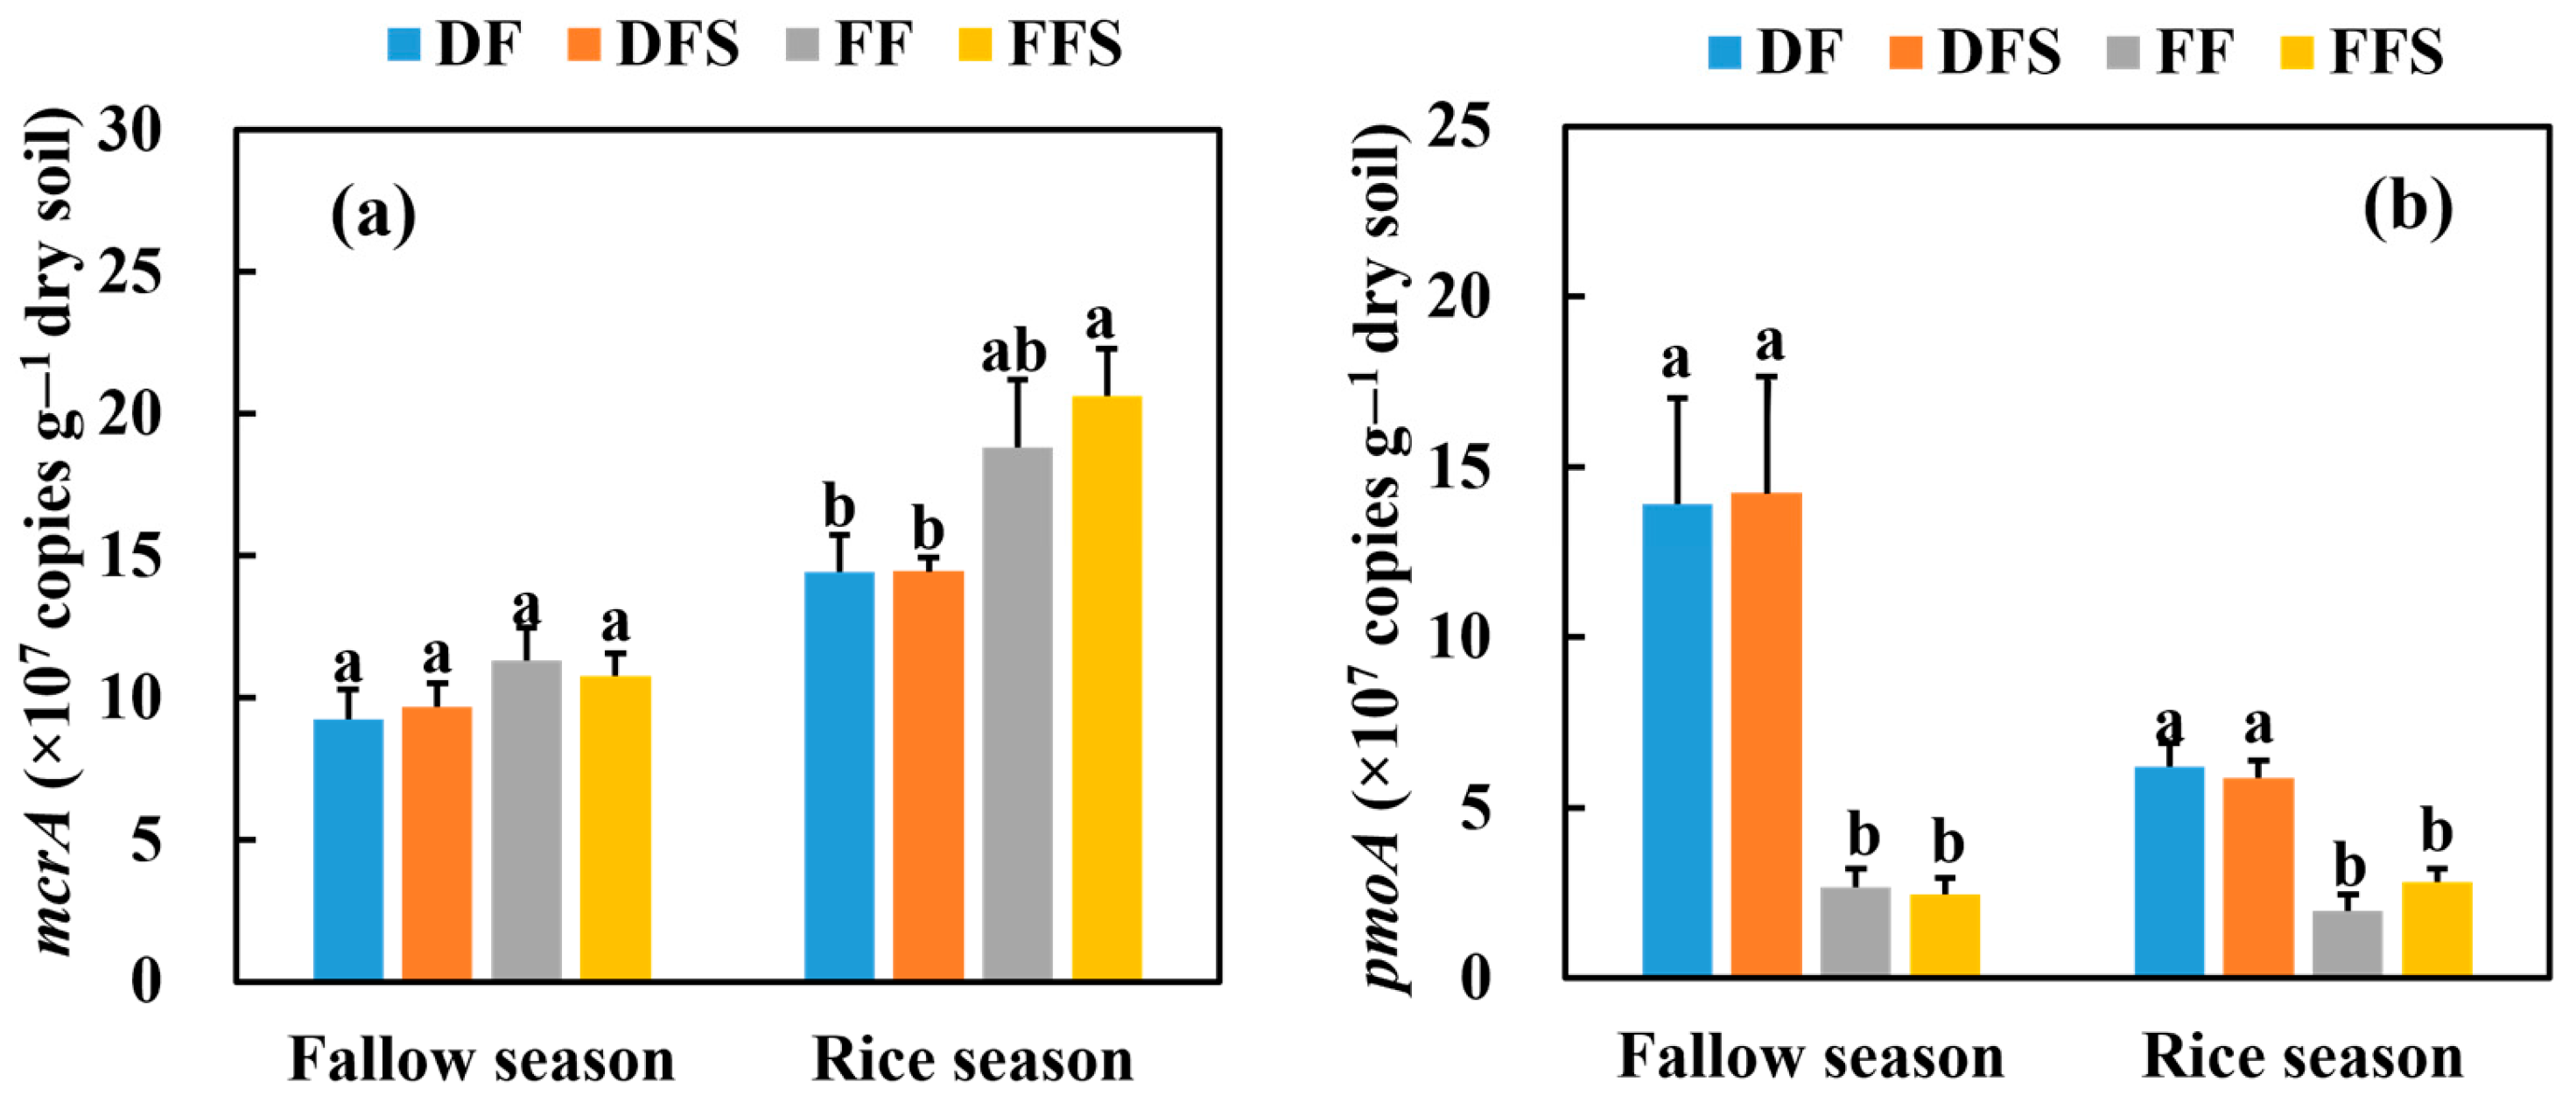
3.3. Gene Abundances of Methanogens and Methanotrophs
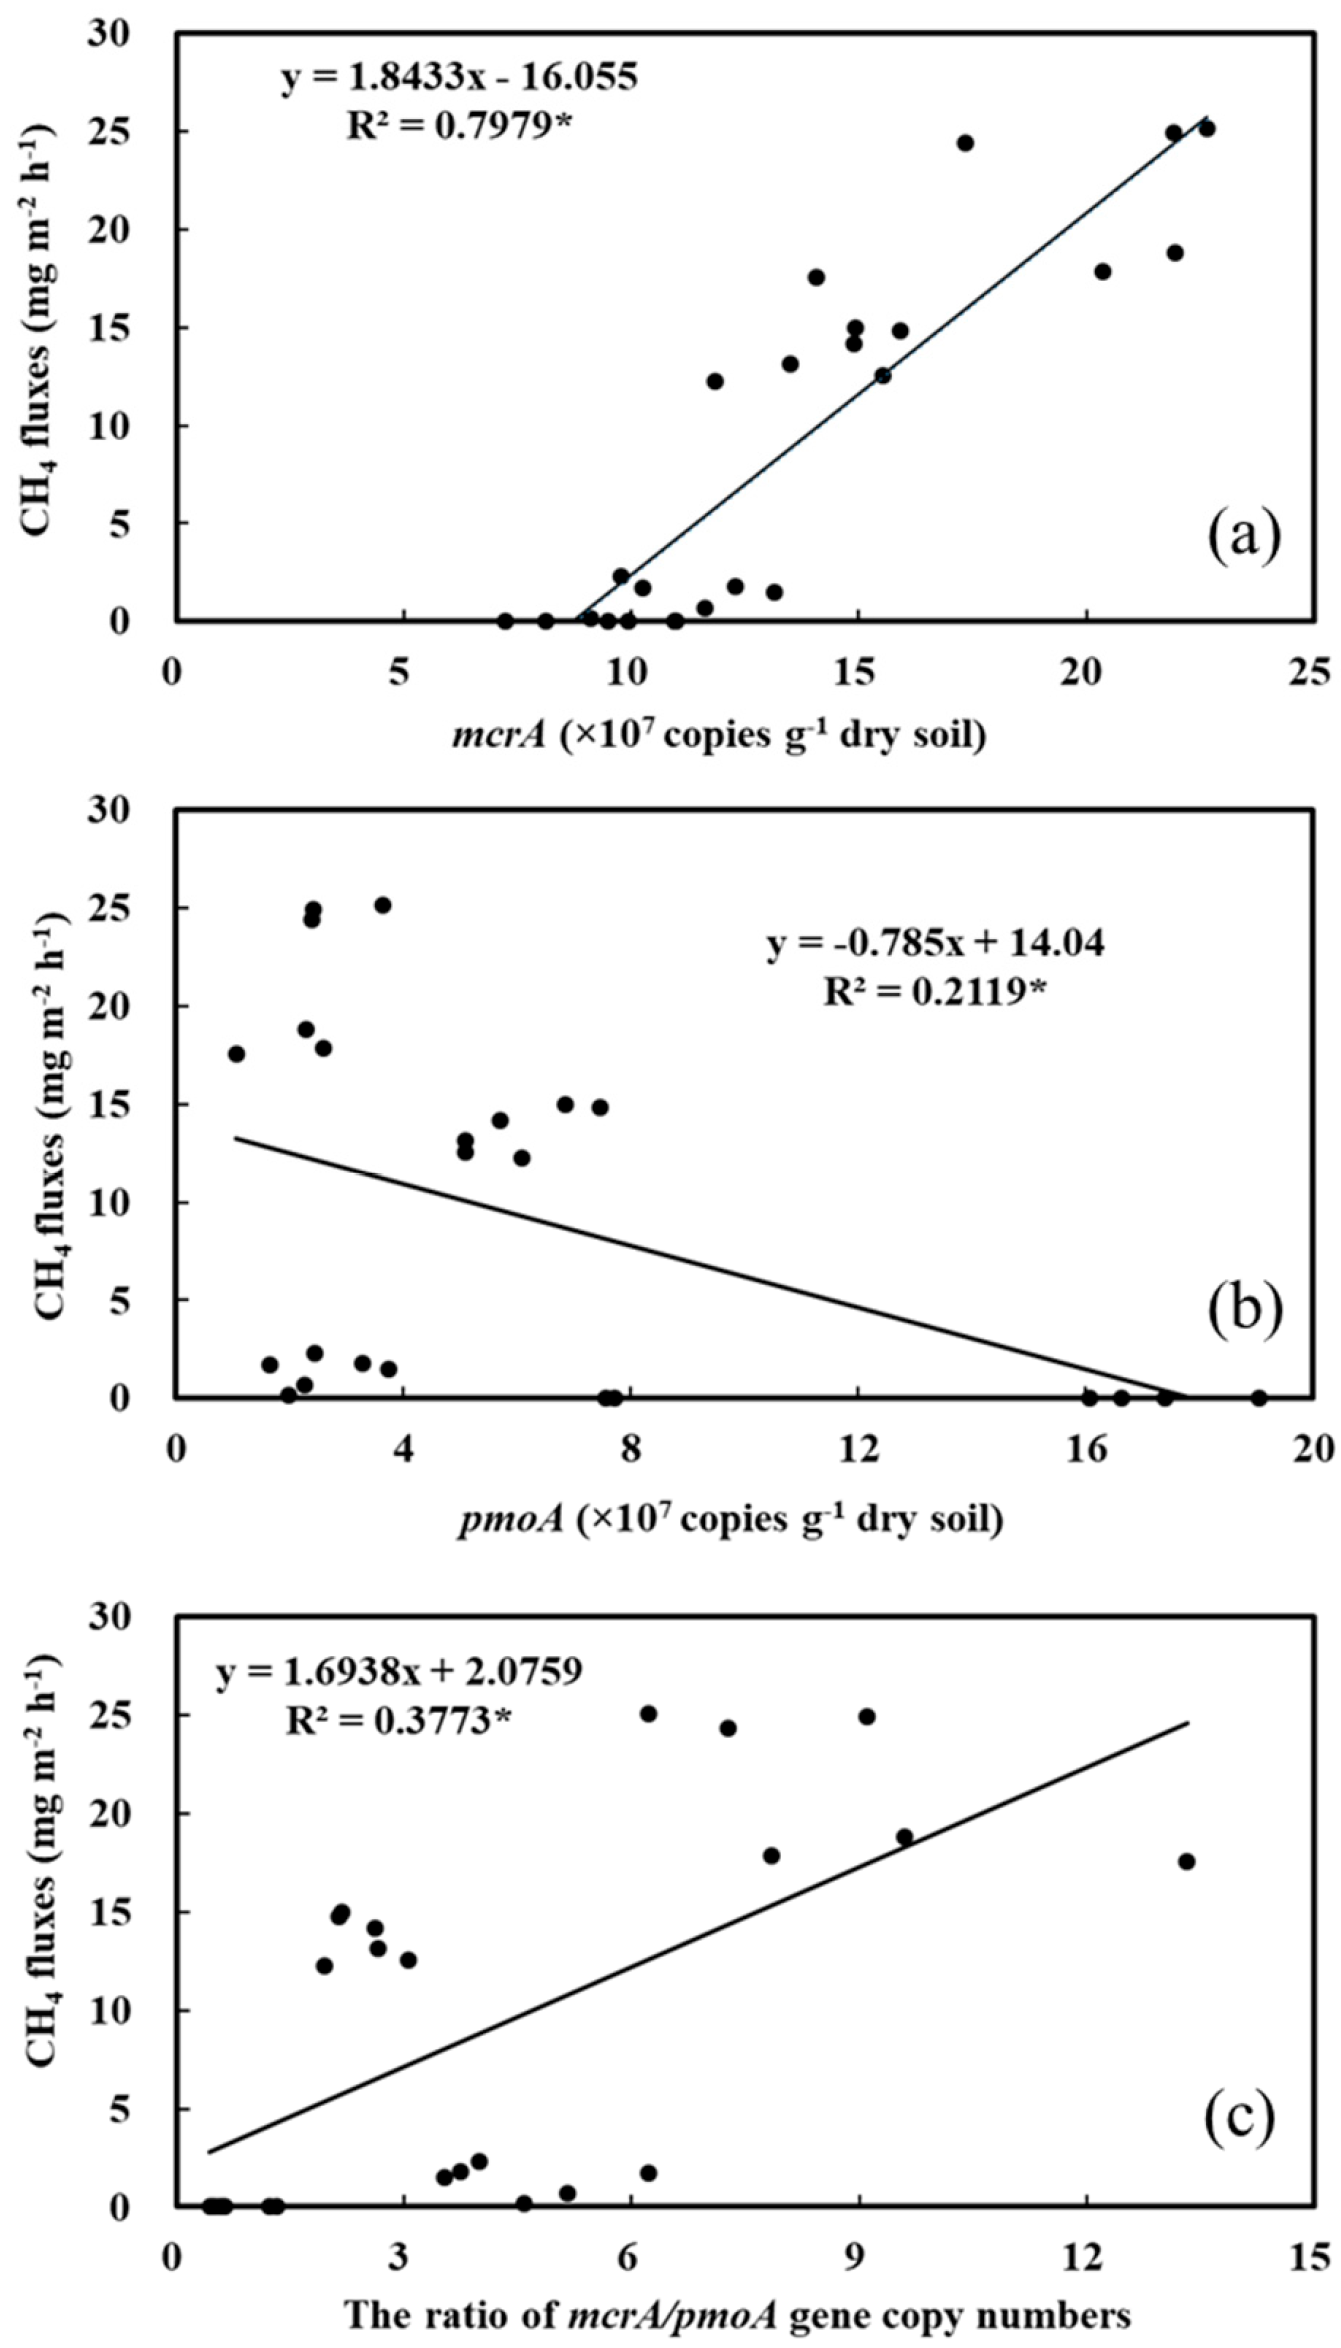
3.4. Link with CH4 Emissions
4. Discussion
5. Conclusions
Author Contributions
Funding
Data Availability Statement
Conflicts of Interest
References
- WMO (World Meteorological Organization). WMO Greenhouse Gas Bulletin: The State of Greenhouse Gases in the Atmosphere Based on Observations through 2022; WMO: Geneva, Switzerland, 2022. [Google Scholar]
- FAOSTAT. 2022. Available online: https://www.fao.org/faostat/en/#data (accessed on 3 May 2023).
- Saunois, M.; Stavert, A.R.; Poulter, B.; Bousquet, P.; Canadell, J.G.; Jackson, R.B.; Raymond, P.A.; Dlugokencky, E.J.; Houweling, S.; Patra, P.K.; et al. The global methane budget 2000–2017. Earth Syst. Sci. Data 2020, 12, 1561–1623. [Google Scholar] [CrossRef]
- Denman, K.L.; Brasseur, G.; Chidthaisong, A.; Ciais, P.; Cox, P.M.; Dickinson, R.E.; Hauglustaine, D.; Heinze, C.; Holland, E.; Jacob, D.; et al. Couplings between changes in the climate system and biogeochemistry. In Climate Change 2007: The Physical Science Basis. Contribution of Working Group I to the Fourth Assessment Report of the Intergovernmental Panel on Climate Change; Solomon, S., Manning, M., Chen, Z., Marquis, M., Averyt, K.B., Tignor, M., Miller, H.L., Eds.; Cambridge University Press: Cambridge, UK; New York, NY, USA, 2007. [Google Scholar]
- Hanson, R.; Hanson, T. Methanotrophic bacteria. Microb. Rev. 1996, 60, 439–471. [Google Scholar] [CrossRef] [PubMed]
- Le Mer, J.; Roger, P. Production, oxidation, emission and consumption of methane by soils: A review. Eur. J. Soil Biol. 2001, 37, 25–50. [Google Scholar] [CrossRef]
- Breidenbach, B.; Conrad, R. Seasonal dynamics of bacterial and archaeal methanogenic communities in flooded rice fields and effect of drainage. Front. Microbiol. 2015, 5, 752. [Google Scholar] [CrossRef]
- Conrad, R. Microbial ecology of methanogens and methanotrophs. Adv. Agrono. 2007, 96, 1–63. [Google Scholar]
- Zhang, G.; Yu, H.; Fan, X.; Liu, G.; Ma, J.; Xu, H. Effect of rice straw application on stable carbon isotopes, methanogenic pathway, and fraction of CH4 oxidized in a continuously flooded rice field in winter season. Soil Biol. Biochem. 2015, 84, 75–82. [Google Scholar] [CrossRef]
- Arunrat, N.; Sansupa, C.; Kongsurakan, P.; Sereenonchai, S.; Hatano, R. Soil Microbial Diversity and Community Composition in Rice–Fish Co-Culture and Rice Monoculture Farming System. Biology 2022, 11, 1242. [Google Scholar] [CrossRef]
- Freitag, T.E.; Prosser, J.I. Correlation of methane production and functional gene transcriptional activity in a peat soil. Appl. Environ. Microbiol. 2009, 75, 6679–6687. [Google Scholar] [CrossRef]
- Henckel, T.; Friedrich, M.; Conrad, R. Molecular analyses of the methane-oxidizing microbial community in rice field soil by targeting the genes of the 16S rRNA, particulate methane monooxygenase, and methanol dehydrogenase. Appl. Environ. Microbiol. 1999, 65, 1980–1990. [Google Scholar] [CrossRef]
- Sonoki, T.; Furukawa, T.; Jindo, K.; Suto, K.; Aoyama, M.; Sanchez-Monedero, M.A. Influence of biochar addition on methane metabolism during thermophilic phase of composting. J. Basic Microb. 2013, 53, 617–621. [Google Scholar] [CrossRef]
- Liu, Y.; Liu, X.; Cheng, K.; Li, L.; Zhang, X.; Zheng, J.; Zheng, J.; Pan, G. Responses of methanogenic and methanotrophic communities to elevated atmospheric CO2 and temperature in a paddy field. Front. Microbiol. 2016, 7, 1895. [Google Scholar] [CrossRef] [PubMed]
- Arunrat, N.; Kongsurakan, P.; Sereenonchai, S.; Hatano, R. Soil organic carbon in sandy paddy fields of northeast Thailand: A review. Agronomy 2020, 10, 1061. [Google Scholar] [CrossRef]
- Che, Y.; Zhang, B.; Liu, B.; Wang, J.; Zhang, H. Effects of Straw Return Rate on Soil Physicochemical Properties and Yield in Paddy Fields. Agronomy 2024, 14, 1668. [Google Scholar] [CrossRef]
- Zou, J.; Huang, Y.; Jiang, J.; Zheng, X.; Sass, R.L. A 3-year field measurement of methane and nitrous oxide emissions from rice paddies in China: Effects of water regime, crop residue, and fertilizer application. Glob. Biogeochem. Cycles 2005, 19, GB2021. [Google Scholar] [CrossRef]
- Li, X.; Ma, J.; Yao, Y.; Liang, S.; Zhang, G.; Xu, H.; Yagi, K. Methane and nitrous oxide emissions from irrigated lowland rice paddies after wheat straw application and midseason aeration. Nutr. Cycl. Agroecos. 2014, 100, 65–76. [Google Scholar] [CrossRef]
- Furukawa, Y.; Shiratori, Y.; Inubushi, K. Depression of methane production potential in paddy soils by subsurface drainage systems. Soil Sci. Plant Nutr. 2008, 54, 950–959. [Google Scholar] [CrossRef]
- Kögel-Knabner, I.; Amelung, W.; Cao, Z.; Fiedler, S.; Frenzel, P.; Jahn, R.; Kalbitz, K.; Kolbl, A.; Schloter, M. Biogeochemistry of paddy soils. Geoderma 2010, 157, 1–14. [Google Scholar] [CrossRef]
- Wu, J.; Zhou, P.; Li, L.; Su, Y.; Yuan, H.; Syers, J.K. Restricted mineralization of fresh organic materials incorporated into a subtropical paddy soil. J. Sci. Food Agric. 2012, 92, 1031–1037. [Google Scholar] [CrossRef]
- Tang, S.R.; Cheng, W.G.; Hu, R.G.; Guigue, J.; Kimani, S.M.; Tawaraya, K.; Xu, X.K. Simulating the effects of soil temperature and moisture in the off-rice season on rice straw decomposition and subsequent CH4 production during the growth season in a paddy soil. Biol. Fert. Soils 2016, 52, 739–748. [Google Scholar] [CrossRef]
- Xiao, M.Q.; Dong, S.S.; Li, Z.L.; Tang, X.; Chen, Y.; Yang, S.M.; Wu, C.Y.; Ouyang, D.X.; Fang, C.M.; Song, Z.P. Effects of water management practices on residue decomposition and degradation of Cry1Ac protein from crop-wild Bt rice hybrids and parental lines during winter fallow season. Ecotox. Environ. Safe 2015, 122, 275–289. [Google Scholar] [CrossRef]
- Liu, W.; Hussain, S.; Wu, L.; Qin, Z.; Li, X.; Lu, J.; Khan, F.; Cao, W.; Geng, M. Greenhouse gas emissions, soil quality, and crop productivity from a mono-rice cultivation system as influenced by fallow season straw management. Environ. Sci. Pollut. Res. 2016, 23, 315–328. [Google Scholar] [CrossRef] [PubMed]
- Sander, B.O.; Samson, M.; Buresh, R.J. Methane and nitrous oxide emissions from flooded rice fields as affected by water and straw management between rice crops. Geoderma 2014, 235, 355–362. [Google Scholar] [CrossRef]
- Yan, X.; Yagi, K.; Akiyama, H.; Akimoto, H. Statistical analysis of the major variables controlling methane emission from rice fields. Global Chang. Biol. 2005, 11, 1131–1141. [Google Scholar] [CrossRef]
- Zhang, G.; Zhang, X.; Ma, J.; Xu, H.; Cai, Z. Effect of drainage in the fallow season on reduction of CH4 production and emission from permanently flooded rice fields. Nutr. Cycl. Agroecos. 2011, 89, 81–91. [Google Scholar] [CrossRef]
- Wu, X.; Wang, W.; Xie, K.; Yin, C.; Hou, H.; Xie, X. Combined effects of straw and water management on CH4 emissions from rice fields. J. Environ. Manag. 2019, 231, 1257–1262. [Google Scholar] [CrossRef]
- Shang, Q.Y.; Yang, X.X.; Gao, C.M.; Wu, P.P.; Liu, J.J.; Xu, Y.C.; Shen, Q.R.; Zou, J.W.; Guo, S.W. Net annual global warming potential and greenhouse gas intensity in Chinese double rice-cropping systems: A 3-year field measurement in long-term fertilizer experiments. Glob. Chang. Biol. 2011, 17, 2196–2210. [Google Scholar] [CrossRef]
- Wang, C.; Shen, J.; Tang, H.; Inubushi, K.; Guggenberger, G.; Li, Y.; Wu, J. Greenhouse gas emissions in response to straw incorporation, water management and their interaction in a paddy field in subtropical central China. Arch. Agron. Soil Sci. 2017, 63, 171–184. [Google Scholar] [CrossRef]
- Zhang, W.; Sheng, R.; Zhang, M.; Xiong, G.; Hou, H.; Li, S.; Wei, W. Effects of continuous manure application on methanogenic and methanotrophic communities and methane production potentials in rice paddy soil. Agric. Ecosyst. Environ. 2018, 258, 121–128. [Google Scholar] [CrossRef]
- Lueders, T.; Chin, K.J.; Conrad, R.; Friedrich, M. Molecular analyses of methyl-coenzyme M reductase alpha-subunit (mcrA) genes in rice field soil and enrichment cultures reveal the methanogenic phenotype of a novel archaea llineage. Environ. Microbiol. 2001, 3, 194–204. [Google Scholar] [CrossRef]
- Ma, K.; Conrad, R.; Lu, Y. Dry/wet cycles change the activity and population dynamics of methanotrophs in rice field soil. Appl. Environ. Microb. 2013, 79, 4932–4939. [Google Scholar] [CrossRef]
- Lukow, T.; Dunfield, P.F.; Liesack, W. Use of the T-RFLP technique to assess spatial and temporal changes in the bacterial community structure within an agricultural soil planted with transgenic and non-transgenic potato plants. FEMS Microbio. Ecol. 2000, 32, 241–247. [Google Scholar] [CrossRef] [PubMed]
- Yuan, H.; Ge, T.; Chen, C.; O’Donnell, A.G.; Wu, J. Significant role for microbial autotrophy in the sequestration of soil carbon. Appl. Environ. Microb. 2012, 78, 2328–2336. [Google Scholar] [CrossRef] [PubMed]
- Wang, Y.; Hu, C.; Zhu, B.; Xiang, H.; He, X. Effects of wheat straw application on methane and nitrous oxide emissions from purplish paddy fields. Plant Soil Environ. 2010, 56, 16–22. [Google Scholar] [CrossRef]
- Wang, H.; Jurasinski, G.; Täumer, J.; Kuß, A.W.; Groß, V.; Köhn, D.; Günther, A.; Urich, T. Linking Transcriptional Dynamics of Peat Microbiomes to Methane Fluxes during a Summer Drought in Two Rewetted Fens. Environ. Sci. Technol. 2023, 57, 5089–5101. [Google Scholar] [CrossRef]
- Xu, C.; Shen, S.; Zhou, B.; Feng, Y.; He, Z.; Shi, L.; Wang, Y.; Wang, H.; Mishra, T.; Xue, L. Long-term non-phosphorus application increased paddy methane emission by promoting organic acid and methanogen abundance in Tai Lake region, China. Sci Total Environ. 2023, 864, 161146. [Google Scholar] [CrossRef]
- Jia, Z.J.; Cai, Z.C.; Xu, H.; Li, X.P. Effect of rice plants on CH4 production, transport, oxidation and emission in rice paddy soil. Plant Soil 2001, 230, 211–221. [Google Scholar] [CrossRef]
- Yu, K.W.; Wang, Z.P.; Chen, G.X. Nitrous oxide and methane transport through rice plants. Biol. Fert. Soils 1997, 24, 341–343. [Google Scholar] [CrossRef]
- Qi, L.; Ma, L.; Chang, S.X.; Zhou, P.; Huang, R.; Wang, Y.; Wang, Z.; Gao, M. Biochar decreases methanogenic archaea abundance and methane emissions in a flooded paddy soil. Sci Total Environ. 2021, 752, 141958. [Google Scholar] [CrossRef]
- Dai, X.; Sun, J.; Zhao, Z.; Ma, R.; Zheng, Z.; Liu, Y.; Wang, X.; Zhou, W. Linking the potential activities of methanogens and methanotrophs to their communities under different fertilization regimes in coastal saline paddy soils. Appl. Soil Ecol. 2023, 192, 105102. [Google Scholar] [CrossRef]
- Cai, Y.; Zheng, Y.; Bodelier, P.L.; Conrad, R.; Jia, Z. Conventional methanotrophs are responsible for atmospheric methane oxidation in paddy soils. Nat. Commun. 2016, 7, 11728. [Google Scholar] [CrossRef]
- Zheng, S.M.; Deng, S.H.; Ma, C.; Xia, Y.H.; Qiao, H.; Zhao, J.; Gao, W.; Tu, Q.; Zhang, Y.M.; Rui, Y.C.; et al. Type I methanotrophs dominated methane oxidation and assimilation in rice paddy fields by the consequence of niche differentiation. Biol. Fertil. Soils. 2024, 60, 153–165. [Google Scholar] [CrossRef]

| Factors | df | CH4 (kg ha−1) | mcrA (Copies g−1 Dry Soil) | pmoA (Copies g−1 Dry Soil) | ||||||
|---|---|---|---|---|---|---|---|---|---|---|
| SS | F | p | SS | F | p | SS | F | p | ||
| Se | 1 | 1704 | 3381.20 | <0.001 | 2.80 × 10¹⁶ | 52.35 | <0.001 | 1.01 × 10¹⁶ | 11.61 | 0.004 |
| Wa | 1 | 126 | 249.97 | <0.001 | 7.07 × 10¹⁵ | 13.20 | 0.002 | 3.45 × 10¹⁶ | 39.79 | <0.001 |
| St | 1 | 29 | 57.23 | <0.001 | 1.18 × 10¹⁴ | 0.22 | 0.645 | 1.38 × 10¹³ | 0.02 | 0.901 |
| Se×Wa | 1 | 62 | 123.23 | <0.001 | 2.04 × 10¹⁵ | 3.82 | 0.068 | 9.27 × 10¹⁵ | 10.70 | 0.005 |
| Se×St | 1 | 16 | 31.49 | <0.001 | 1.38 × 10¹⁴ | 0.26 | 0.619 | 5.54 × 10¹² | 0.01 | 0.937 |
| Wa×St | 1 | 18 | 35.84 | <0.001 | 2.81 × 10¹³ | 0.05 | 0.822 | 1.64 × 10¹³ | 0.02 | 0.892 |
| Se×Wa×St | 1 | 8 | 16.38 | 0.001 | 2.94 × 10¹⁴ | 0.55 | 0.470 | 1.06 × 10¹⁴ | 0.12 | 0.731 |
| Model | 7 | 1963 | 556.48 | <0.001 | 3.77 × 10¹⁶ | 10.06 | <0.001 | 5.39 × 10¹⁶ | 8.89 | <0.001 |
| Error | 24 | 8 | 8.57 × 10¹⁵ | 1.39 × 10¹⁶ | ||||||
Disclaimer/Publisher’s Note: The statements, opinions and data contained in all publications are solely those of the individual author(s) and contributor(s) and not of MDPI and/or the editor(s). MDPI and/or the editor(s) disclaim responsibility for any injury to people or property resulting from any ideas, methods, instructions or products referred to in the content. |
© 2024 by the authors. Licensee MDPI, Basel, Switzerland. This article is an open access article distributed under the terms and conditions of the Creative Commons Attribution (CC BY) license (https://creativecommons.org/licenses/by/4.0/).
Share and Cite
Wang, W.; Chen, Q.; Huang, H.; Xie, Y. Effects of Fallow Season Water and Straw Management on Methane Emissions and Associated Microorganisms. Agronomy 2024, 14, 2302. https://doi.org/10.3390/agronomy14102302
Wang W, Chen Q, Huang H, Xie Y. Effects of Fallow Season Water and Straw Management on Methane Emissions and Associated Microorganisms. Agronomy. 2024; 14(10):2302. https://doi.org/10.3390/agronomy14102302
Chicago/Turabian StyleWang, Wei, Qiping Chen, Hexian Huang, and Yonghong Xie. 2024. "Effects of Fallow Season Water and Straw Management on Methane Emissions and Associated Microorganisms" Agronomy 14, no. 10: 2302. https://doi.org/10.3390/agronomy14102302
APA StyleWang, W., Chen, Q., Huang, H., & Xie, Y. (2024). Effects of Fallow Season Water and Straw Management on Methane Emissions and Associated Microorganisms. Agronomy, 14(10), 2302. https://doi.org/10.3390/agronomy14102302