Article

Defective Pennywort Leaf Detection Using Machine Vision and Mask R-CNN Model

1
Department of Biological and Agricultural Engineering, Kentucky State University, Frankfort, KY 40601, USA
2
Department of Agricultural Machinery Engineering, Graduate School, Chungnam National University, Daejeon 34134, Republic of Korea
3
Department of Smart Agricultural Systems, Graduate School, Chungnam National University, Daejeon 34134, Republic of Korea
4
Department of Horticultural Science, Graduate School, Chungnam National University, Daejeon 34134, Republic of Korea
*
Author to whom correspondence should be addressed.
These authors contributed equally to this work.
Agronomy 2024, 14(10), 2313; https://doi.org/10.3390/agronomy14102313
Submission received: 9 September 2024 / Revised: 5 October 2024 / Accepted: 8 October 2024 / Published: 9 October 2024
(This article belongs to the Special Issue Advanced Machine Learning in Agriculture)

Abstract

:
Demand and market value for pennywort largely depend on the quality of the leaves, which can be affected by various ambient environment or fertigation variables during cultivation. Although early detection of defects in pennywort leaves would enable growers to take quick action, conventional manual detection is laborious and time consuming as well as subjective. Therefore, the objective of this study was to develop an automatic leaf defect detection algorithm for pennywort plants grown under controlled environment conditions, using machine vision and deep learning techniques. Leaf images were captured from pennywort plants grown in an ebb-and-flow hydroponic system under fluorescent light conditions in a controlled plant factory environment. Physically or biologically damaged leaves (e.g., curled, creased, discolored, misshapen, or brown spotted) were classified as defective leaves. Images were annotated using an online tool, and Mask R-CNN models were implemented with the integrated attention mechanisms, convolutional block attention module (CBAM) and coordinate attention (CA) and compared for improved image feature extraction. Transfer learning was employed to train the model with a smaller dataset, effectively reducing processing time. The improved models demonstrated significant advancements in accuracy and precision, with the CA-augmented model achieving the highest metrics, including a mean average precision (mAP) of 0.931 and an accuracy of 0.937. These enhancements enabled more precise localization and classification of leaf defects, outperforming the baseline Mask R-CNN model in complex visual recognition tasks. The final model was robust, effectively distinguishing defective leaves in challenging scenarios, making it highly suitable for applications in precision agriculture. Future research can build on this modeling framework, exploring additional variables to identify specific leaf abnormalities at earlier growth stages, which is crucial for production quality assurance.

1. Introduction

Pennywort (Centella asiatica L.), a plant renowned for its medicinal properties, has been used in traditional and modern medicine across various countries for centuries [1]. Belonging to the Apiaceae family, this herbaceous perennial is rich in secondary metabolites, antioxidants, and anti-bacterial, anti-fungal, and anti-inflammatory properties, making it effective in treating a range of health conditions. Therapeutic potential extends to wound healing and the treatment of skin disorders such as leprosy, lupus, ulcers, eczema, and psoriasis. Additionally, pennywort has been used to manage conditions such as diarrhea, fever, amenorrhea, and diseases of the female genitourinary tract [2,3,4,5]. Recent scientific studies have further underscored the significance as a natural antioxidant, offering defense against age-related alterations in the brain antioxidant defense system [6]. As a result, pennywort has become a valuable medicinal plant, gaining prominence not only in traditional herbal practices but also in contemporary pharmaceutical and health sectors worldwide.
The demand and market value of pennywort plants are largely determined by the quality of the leaves, which are typically influenced by the cultivation conditions. While open-field cultivation of pennywort is possible, it can be challenging to maintain a consistent growth rate and nutrient content due to unpredictable weather conditions. On the contrary, controlled environment agriculture (CEA) facilities, such as greenhouses and plant factories, have significant potentiality to improve and make uniform the quality and quantity of pennywort by manipulating the optimal levels of temperature, humidity, CO2, light conditions, water, and nutrients [7,8,9,10]. Additionally, soilless cultivation techniques, such as aeroponics, ebb–flow, the nutrient film technique (NFT), and drip, have been shown to enhance crop growth and nutritional content compared to traditional soil-based methods [11]. However, plants sometimes face temperature, light, water, or nutrient stress due to malfunctioning of the respective sensors or actuators installed in the CEA facilities. It can have various adverse effects on plant health and growth. Temperature stress can disrupt metabolic processes, enzyme activity, and biochemical reactions, impacting the plant’s ability to perform essential functions. High temperatures can increase water loss through transpiration, resulting in wilting, leaf curling, and, ultimately, dehydration [12]. Light stress can influence stomatal regulation. Plants may respond by closing stomata to reduce water loss, affecting gas exchange and potentially leading to issues with carbon dioxide uptake. Intense light can cause physical damage to leaves, leading to necrosis, leaf burn, or the development of lesions [13,14]. A deficiency or excess of certain nutrients plays a crucial role in cell division, elongation, and overall plant development. Imbalances in specific nutrients may cause characteristic symptoms of leaf discoloration [15]. For example, nitrogen deficiency can lead to yellowing of older leaves, while excessive salts or certain nutrient imbalances can cause leaf burn or tip necrosis. The most typical indicators of environmental stress on plants include changes in the color, size, shape, and texture of plant leaves. Early detection of defects in plant leaves would enable growers to take action quickly, lead to reduced loss, and ensure the quality of yield. Traditionally, it is dependent on human observations, which is critical, laborious, and time-consuming task. The application of proximal sensing in CEA facilities to identify the physical features of plants is complicated and sometimes injurious to plants. Non-contact sensing in conjunction with machine vision can help determine the overall health status of plants and identify the specific needs of each individual plant.
Machine vision and artificial intelligence models are being deployed in many fields, and agriculture is not an exception. The common use of this technology in CEA facilities are ambient environment management, growth monitoring, insect and disease detection, yield prediction and mapping, and even price forecasting for crops [16,17,18,19,20]. Yamamoto et al. [21] developed a system to effectively detect intact tomato fruits by integrating a standard RGB digital camera with machine learning algorithms that analyze color, shape, texture, and size. In test images, this method achieved a recall rate of 0.80 and a precision rate of 0.88. Wang et al. [22] developed techniques to identify tomato diseases using deep CNNs and object detection models. They employed two different models: Faster R-CNN for classifying tomato diseases and Mask R-CNN for segmenting the diseased regions and their morphologies. A leaf area estimation algorithm was developed by Islam et al. [23] where the plants were grown under different artificial light conditions. Liu et al. [24] successfully detected cucumbers using a machine vision technique with an accuracy of 89.47%. Unlike common fruits such as apples, tomatoes, and strawberries, cucumbers present a challenge due to their similar color to leaves and their long, narrow shapes. Story et al. [25] employed a machine vision-guided plant sensing and monitoring system to detect calcium deficiency in greenhouse-grown lettuce. This system analyzed temporal, color, and morphological changes in the plants to identify the deficiency.
Traditionally, plant physiological conditions are determined through observation, which is labor-intensive, time-consuming, and prone to errors. Additionally, destructive or invasive contact measurements are impractical for real-time monitoring and control. At the canopy level, machine vision can identify emerging stresses and guide sampling to pinpoint the stressor. In our previous study [26], we demonstrated how accurately an AI-based algorithm can determine pennywort leaf area using RGB images compared to manual measurement. However, growth defect detection of pennywort plants grown under controlled conditions has not been extensively studied. Therefore, using machine vision to detect faulty pennywort plants and take proper action could be promising for tracking their growth status, quantity, and quality. This study aimed to detect growth abnormalities in pennywort under plant factory conditions using machine vision and deep learning technique, by analyzing temporal, color, and morphological changes in leaf features.

2. Materials and Methods

2.1. Experimental Site and Image Acquisition

Pennywort plants (Centella asiatica L.) were cultivated in a plant factory located in the Department of Agricultural Machinery Engineering at Chungnam National University, Daejeon, Republic of Korea. The dimensions of the plant factory were 6.9 m in length and 3 m in width. The facility had four shelves, each with three layers of cultivation beds, as shown in Figure 1a. For this experiment, only the middle layer was used to grow the pennywort seedlings as shown in Figure 1b.
The pennywort seedlings (variety: Asiatic pennywort) were germinated via tissue culture following the procedures outlined in references [27,28]. After germination, they were transferred to a greenhouse for one month, grown in plugs filled with a peat moss-perlite mixture. Following this period, the seedlings were removed from the plugs, the roots were cleaned, and they were transferred to an ebb-and-flow hydroponic system under fluorescent lights to acclimate to the hydroponic setup and the controlled environment of the plant factory. Ambient environmental variables, such as temperature (25 ± 1 °C), humidity (65 ± 5%), CO2 concentration (400 ppm), light quality (fluorescent), light intensity (150 µmol·m−2·s−1), and photoperiod (18/6 h day/night), were artificially controlled using respective sensors and actuators. The electrical conductivity (EC) and pH of the nutrient solution were maintained at 1.00 ± 0.1 dS·m−1 and 6.5 ± 0.2, respectively, using commercial stock nutrient solution A and B (Daeyu Co., Ltd., Seoul, Republic of Korea). The EC and pH levels 135 were controlled manually every other day using respective sensors. The plant beds were flooded, and the nutrient solution was drained at 15-min intervals. However, symptoms of nutrient deficiency appeared a few days after transplantation due to imbalanced nutrient conditions.
Physically or biologically damaged leaves (e.g., curled, creased, discolored, misshapen, or brown spotted) were classified as defective leaves. Figure 1c shows malnourished and healthy pennywort leaves in the top and bottom row, respectively. Defective and healthy leaf images were taken randomly in different orientations from the plant beds with a white background using an android mobile camera (12 MP, f/1.5-2.4, 27 mm (wide), 144 1/2.55”, 1.4 μm, dual pixel PDAF, OIS). The distance between the camera and the plant was approximately 250 mm. The images were saved in JPEG format. A total of 285 pennywort images were taken for the dataset preparation. Figure 1c shows malnourished leaves (top row) and healthy leaves (bottom row) of pennywort.
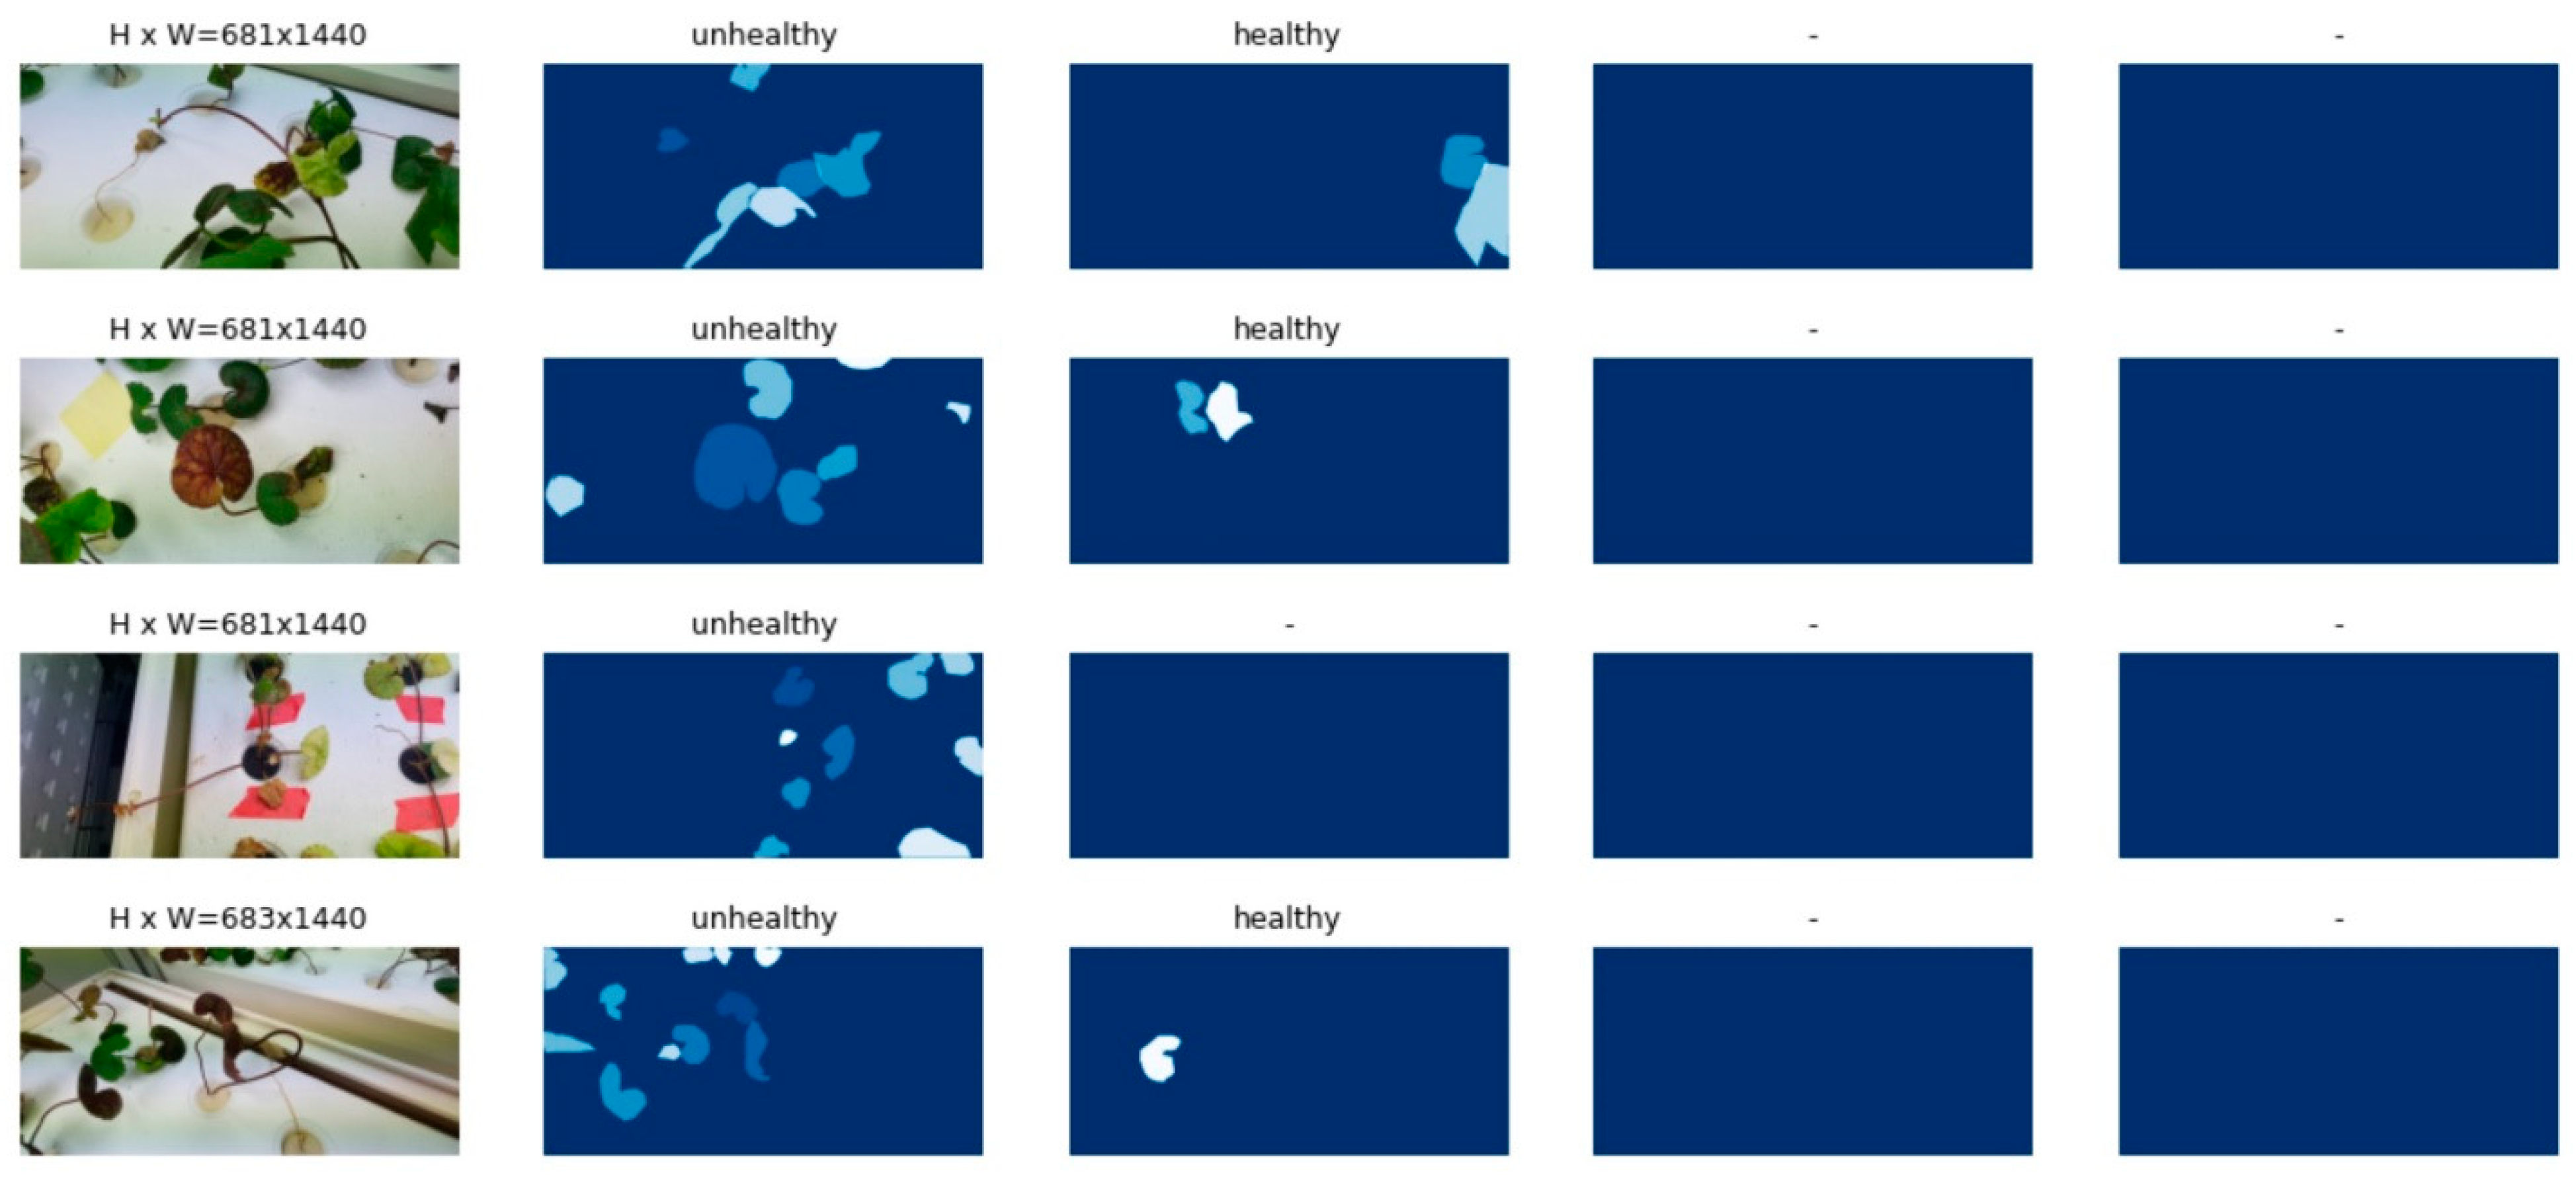
In this study, the annotation process was carried out manually using a free online tool known as MakeSense.ai (https://www.makesense.ai; accessed on 3 December 2024). MakeSense.ai is an open-source annotation platform governed by the GPL version 3 license. This tool is highly accessible, as it only requires a web browser for operation, making it user-friendly and convenient for a wide range of users. The manual annotations involved careful labeling of pennywort images, ensuring precise and accurate data collection. As illustrated in Figure 2, these annotations provided essential insights into the developmental progression of the pennywort plants, supporting further analysis and research.
The considered images were classified into training, validation, and test sets. These three sets were used independently to prevent the problem of data leakage. For the dataset division, we followed a typical 80-20 split, where 80% of the images were allocated for training and 20% for validation and testing. From the annotated images, 250 images were selected for training, and 35 images for validation, and testing of the proposed model. The original images were 1140 × 681 pixels in size and 96 dpi. During the adaptation of the Mask R-CNN model and its parameters, a random selection strategy was employed to train the model based on factors such as age, size, and plant overlap. To expand the training dataset and avoid overfitting, image augmentation techniques (flip, shift, rotation, and zoom) were applied as shown in Figure 3. Additionally, a transfer learning strategy using the Microsoft Common Objects in Context (MS-COCO) dataset was implemented to achieve practical results with a very small dataset.

2.2. Mask R-CNN Model Structure

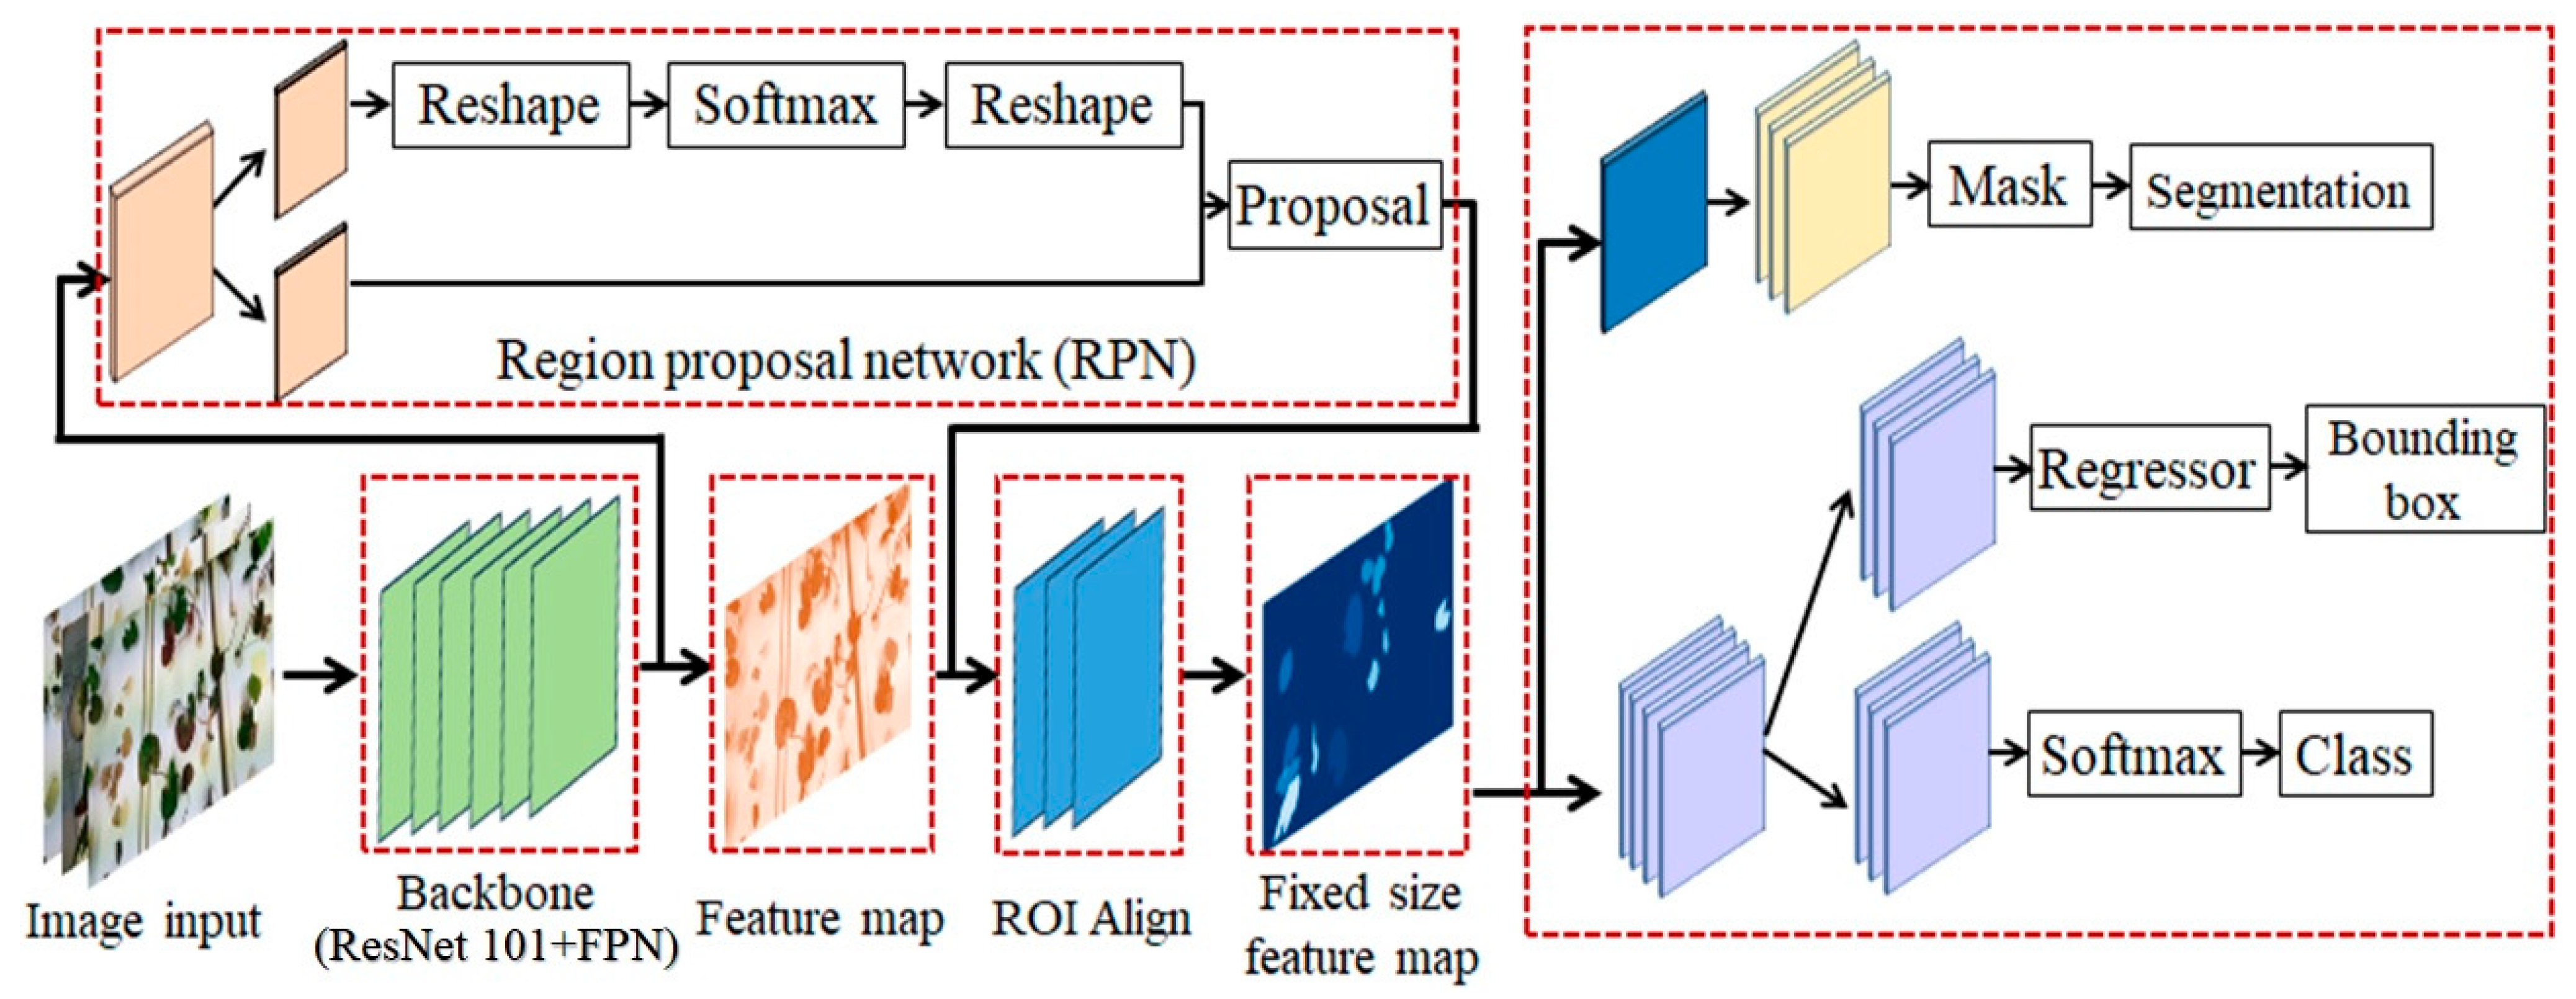
Mask R-CNN is an enhanced neural network architecture derived from Faster R-CNN [29]. It combines Faster R-CNN and Fully Convolutional Networks (FCN) for both object detection and instance segmentation. Unlike Faster R-CNN, which is limited to object detection, Mask R-CNN adds a pre-trained ResNet-101 backbone and a Feature Pyramid Network (FPN) to extract features and generate feature maps for both object detection and instance segmentation. The SoftMax classifier performs binary classification of the foreground and background, while frame regression refines candidate frame positions. After ROI alignment, the model branches into object detection with bounding box regression and mask creation for pixel segmentation, as shown in Figure 4. The ResNet-101 architecture, which serves as the feature extractor, typically expects an input size of 224 × 224 pixels. Therefore, during the preprocessing stage, all images were resized to 224 × 224 pixels to ensure compatibility with the model.
The feature extraction network of Mask R-CNN consists of two pathways: bottom-up and top-down. In the bottom-up pathway, ResNet-101 modules (C1 to C5) extract features, halving the output size at each stage through residual structures and convolutions (stride of 2), as shown in Figure 5a [30]. The top-down pathway merges high-level semantic features with low-level details by up-sampling and aligning feature maps. Final feature maps (P2 to P5) are created through pixel-wise addition and 3 × 3 convolutions, enhancing high-level semantic representation.
The backbone feature extraction network generates feature maps that are fed into the RPN. The RPN performs initial classification and bounding box regression to create initial regions of interest (RoIs), which include the relevant bounding box regression values for the original image regions. The RPN uses anchors on the feature map to propose regions, as depicted in Figure 5b. Each point produces k anchors with different sizes and aspect ratios. The classification and regression layers output probabilities and coordinates for each anchor. After refinement, the corrected RoIs are sent for further processing.
ROI Align pools regions from feature maps into fixed-size feature maps based on ROI coordinates for classification and regression tasks. It uses bilinear interpolation to obtain values at floating-point coordinate pixel points, avoiding quantization and ensuring continuous operation, as illustrated in Figure 5c. ROI Align crops and pools candidate regions into 7 × 7 and 14 × 14 feature maps for classification and mask generation, preserving floating-point precision and utilizing bilinear interpolation for accurate coordinate calculations. This method eliminates errors from quantization mismatches in ROI Pooling.
In Mask R-CNN, adding a “head” component after ROI Align improves the accuracy of predicted masks by increasing the output dimension. During training, the mask branch outputs k mask prediction maps, one for each class, and uses average binary cross-entropy loss. Each ROI undergoes pixel-level alignment using ROI Align, facilitating precise pixel-to-pixel operations and minimizing alignment errors. Figure 6 shows the feature extraction through the implemented algorithm of defective pennywort leaves.

2.3. Improved Mask RCNN Model Using Attention Module

The attention mechanism is a key technology that allows models to selectively focus on relevant information, enhancing their ability to effectively learn from data. By enabling the network to identify and prioritize critical features or regions of input, attention mechanisms facilitate more efficient processing by reducing computational overhead associated with irrelevant or less important information. This targeted focus not only accelerates the convergence of learning but also optimizes resource utilization, making it a powerful technique for minimizing unnecessary computational complexity within neural networks.

2.3.1. Convolutional Block Attention Module (CBAM)

The convolutional block attention module (CBAM) [32] is an attention mechanism that proposes a simple but efficient performance improvement method for a convolutional neural network (CNN). Generally, there are three factors to improve the performance of CNN models: depth, width, and cardinality. Depth means the number of layers, width means the number of filters, and cardinality means the number of groups in the group convolution proposed in different CNN architecture. By adjusting these, the performance of CNN models improves.
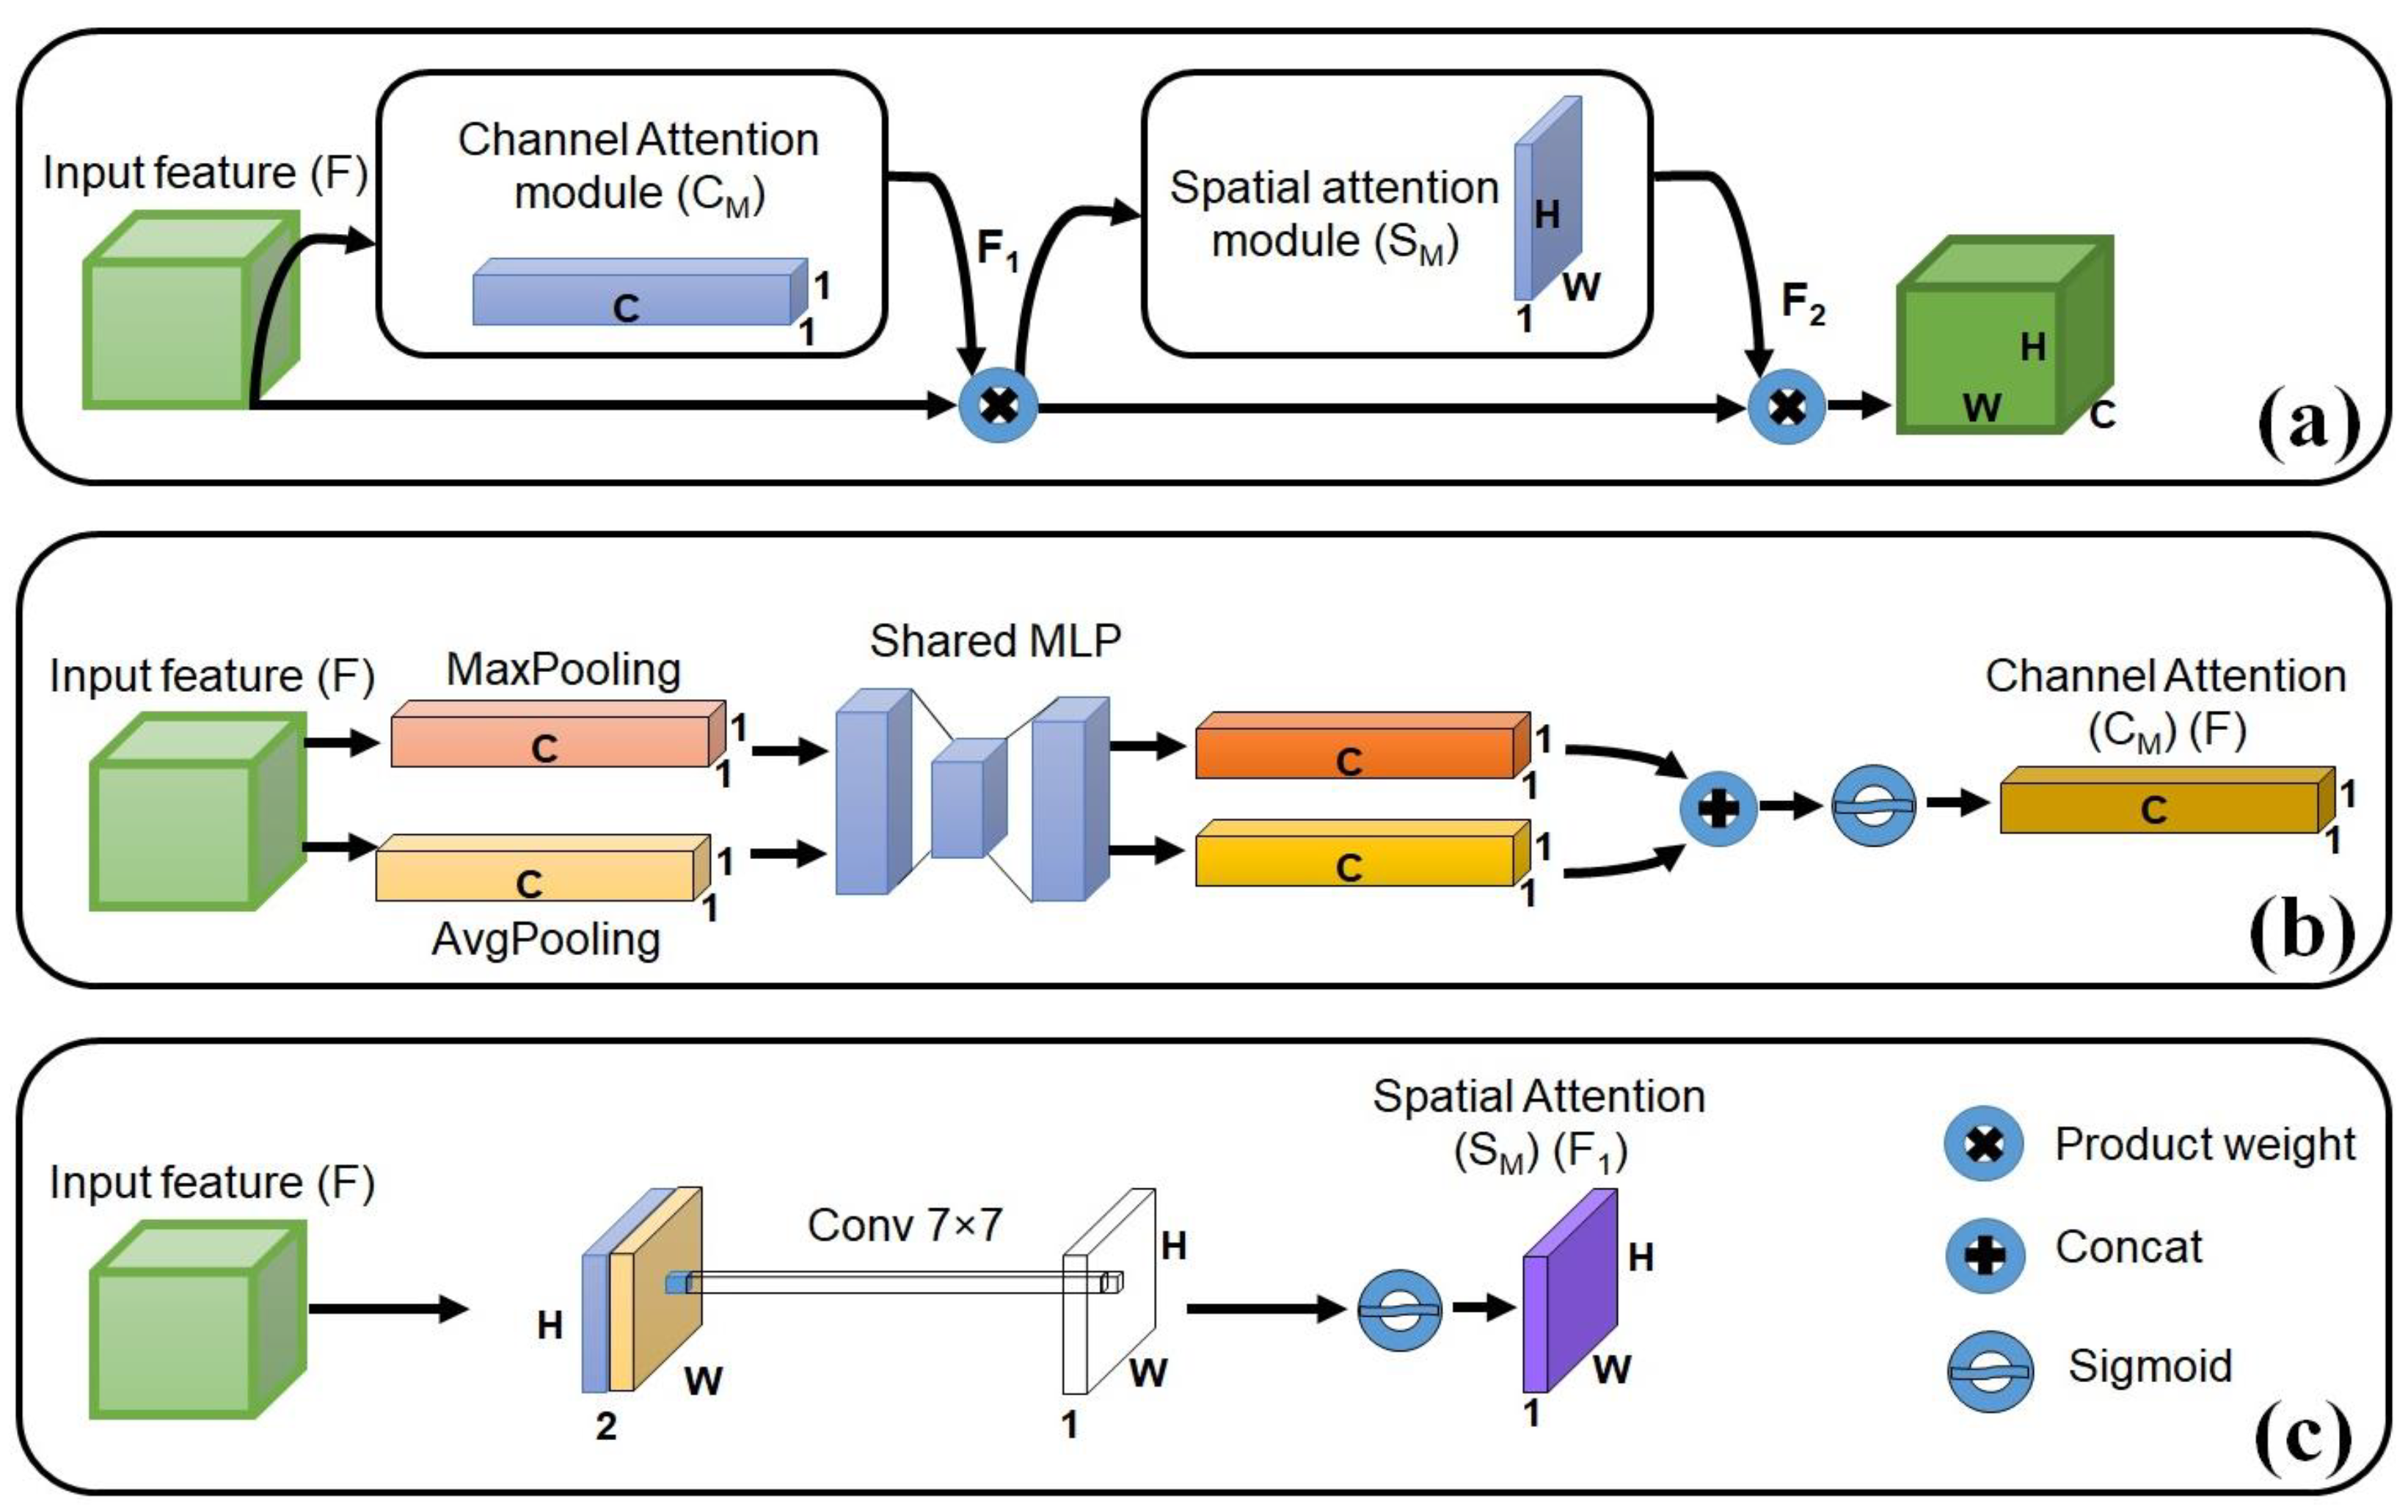
CBAM improves the performance of the model by using the attention module, excluding the three factors above. It consists of a channel attention module and a spatial attention module, and each attention module generates an attention map (containing what and where to look) for each channel and space. The generated attention map is multiplied by the input feature map to suppress unnecessary information and emphasize important information. CBAM is designed to be applied to the CNN structure with a negligible amount of computation.
In this study, CBAM was integrated into the ResNet-101 architecture to enhance the accuracy of the detection model and improve segmentation performance. The accuracy of defective leaf detection in complex background heavily depends on the quality of feature extraction performed by ResNet-101. Consequently, the target categories in the experiment exhibited a strong correlation with the impact of each channel’s feature representation and the spatial localization of targets within the images. The network architecture is illustrated in Figure 7.

2.3.2. Coordinate Attention (CA)

Hou et al. [33] introduced coordinate attention, an innovative mechanism that integrates positional information into channel attention, enabling the network to focus on large, significant regions with minimal computational cost. The coordinate attention mechanism consists of two key steps: coordinate information embedding and attention generation. First, pooling operations are applied along the horizontal and vertical axes, encoding spatial information for each channel. Next, the concatenated outputs from these pooling layers undergo a shared convolutional transformation, after which the resulting tensor is split into two, producing attention vectors that correspond to the horizontal and vertical coordinates of the input (Figure 8).
This mechanism allows the network to precisely localize targeted objects, offering a larger receptive field while also modeling cross-channel relationships. Its lightweight and flexible design makes it easily integrative into the building blocks of mobile networks, enhancing feature representation with minimal overhead.
In this study, the CBAM and CA mechanisms were integrated separately into the backbone of the ResNet-101 architecture to develop a model for detecting defective pennywort leaves. These attention mechanisms were incorporated into the residual modules of ResNet-101 to refine the feature extraction process by directing the focus of the model towards the most relevant information targets during training and inference.
The integration of CBAM and CA into the network enhances the ability to capture important features by emphasizing critical regions in the input images while suppressing irrelevant details. CBAM provides a dual focus on both spatial and channel-wise features, improving the ability of the network to identify significant patterns in the data. In contrast, the CA mechanism further embeds positional information within the channel attention, allowing the model to maintain a larger receptive field and better spatial awareness, which is crucial for accurately localizing defects in pennywort leaves.
By refining the feature extraction process and embedding these attention modules within the residual blocks, these attention mechanisms amplify important details and filter out irrelevant information, and the enhanced network structure improves the overall quality of feature extraction, leading to more accurate detection of defects in pennywort leaves. The architecture of the improved network modules, incorporating these attention mechanisms, is shown in Figure 9.

2.4. Evaluation Matrices

Tests were performed to assess the effectiveness of the affected leaves identification using both training and test datasets. In this study, average precision (AP) and mean average precision (mAP) were used as the key evaluation metrics. AP is defined as the average of precision values computed at various recall levels, essentially representing the area under the precision-recall curve. AP can be expressed as the integral of precision and recall as Equation (1):
A P = 0 1 P R d R
In Equation (1), P represents the precision rate, defined as the proportion of correctly detected defective leaves among all the leaves identified by the model, reflecting the detection accuracy for positive predictions. On the other hand, R denotes the recall rate, which measures the detection accuracy concerning all actual positive leaf samples, indicating how well the model identifies true positives out of all existing positive cases, as shown in Equations (2)–(5) as follows [34]:
P = T P T P + F P
R = T P T P + F N
F = 2 × P × R P + R
A c c u r a c y = T P + T N T P + F N + F P + T N
where, TP: true positive detection, FN: false positive detection, FP: false negative detection, and TN: true negative detection.
The mAP is calculated as the average of the individual AP values for all target types. Here, n denotes the total number of leaf samples, and AP represents the average precision for the ith samples. The formula for calculating mAP is provided in Equation (6) as follows:
m A P = i = 1 n A P i n
In this study, defective leaves were defined as those identified as having an intersection of union (IoU) larger than 0.5 between the predicted and ground truth bounding boxes. The IoU value was set to be modest to reflect the diminutive size of seedlings in comparison to the image resolution.

3. Results

3.1. Trained Mask R-CNN Model

In this study, transfer learning was implemented using the MS-COCO dataset as the source domain to facilitate the training of a detection model. By using pre-trained parameters from MS-COCO, effectively transferred this knowledge to the target domain of the new model, enhancing the performance on specific tasks. The MS-COCO dataset, a comprehensive collection with 80 object categories and approximately 330,000 images—of which around 200,000 are labeled—served as the foundation for pre-training [34]. The pre-trained weights from this dataset were then utilized to fine-tune the network’s hyperparameters for our specific application.
For the model-training process, input data consisted of bounding boxes and annotations around the seedlings, providing the necessary information for the model to learn object localization and classification. The training process involved carefully setting key hyperparameters: The learning rate was configured at 0.001, weight decay at 0.0001, and momentum at 0.9. These settings ensured a balanced and effective learning process, allowing the model to converge efficiently.
The training was conducted over 100 epochs on a high-performance computing setup, consisting of a 64-bit Windows 10 Enterprise server equipped with an Intel Core i9-10,900 K processor, 128 GB of RAM, and a powerful NVIDIA GeForce RTX 3090 GPU with 24 GB of VRAM. This setup provided the necessary computational resources to handle the intensive training workload. The entire training and validation process took approximately six hours to complete, resulting in a well-tuned model ready for application in the target domain.

3.2. Performance Comparison of Mask RCNN Models with Different Attention Mechanisms

The loss and accuracy curve are shown in Figure 10, which shows a clear downward trend throughout the training process, signifying a reduction in prediction loss deviation. This reduction was achieved through iterative refinements of the loss function based on small sample batches during optimization. As the number of epochs exceeded 80, the loss of the model stabilized significantly, with both the training set and validation set showing a loss of below 0.54 and above 97.8, respectively. The convergence of the loss function indicated a state where additional training iterations would yield minimal improvements, affirming the proficiency and reliability of the model in making accurate predictions. This stability showed robustness and its ability to generalize well to new data. With the integration of attention mechanisms (CBAM and CA), into the Mask RCNN model, significant improvements in performance were achieved. These enhancements enabled the model to more effectively focus on relevant features, leading to more accurate localization and detection of defective leaves. Subsequent experiments and analyses confirmed that the attention-augmented Mask RCNN could precisely identify and delineate defects in leaves, demonstrating its superior capability in handling complex visual recognition tasks in comparison to the baseline model. After surpassing 80 epochs, the loss of the improved models stabilized considerably, with both the training and validation sets consistently exhibiting a loss of below 0.36 and above 99.1, respectively.
To validate and demonstrate the effectiveness of the model developed using the Mask-RCNN and improved Mask-RCNN by integrating CBAM and CA attention mechanisms into the Mask RCNN framework algorithm, comparative experiments were conducted. The attention mechanisms CBAM and CA were individually incorporated into Mask RCNN with the ResNet-101 backbone. The resulting models were then evaluated to assess their performance enhancements. The outcomes of these experiments, detailing the performance metrics of each model configuration, are presented in Table 1 and Table 2, highlighting how the inclusion of different attention mechanisms impacted the accuracy and efficiency of the Mask-RCNN ResNet-101 model.
Table 1 demonstrates the performance metrics of the Mask-RCNN_ResNet-101 model, showing a mAP of 0.893 and an accuracy of 0.887, respectively. When attention mechanisms CBAM and CA were integrated into the Mask-RCNN_ResNet-101 model, both mAP and accuracy metrics showed improvements.
Specifically, the introduction of the CA attention mechanism resulted in the most significant enhancement. After incorporating CA, the model achieved a mAP of 0.931 and an accuracy of 0.937. This improvement can be attributed to the ability of CA to more effectively capture and emphasize relevant spatial and channel-wise features, allowing the model to better distinguish between defective and healthy leaf regions. The enhanced focus on pertinent features leads to more accurate localization and classification, thus improving overall model performance. The results clearly indicate that the use of attention mechanisms, particularly CA, substantially boosts the capability of the Mask RCNN ResNet-101 model in complex detection tasks.
Table 2 presents a quantitative comparison of the performance of Mask-RCNN_ResNet-101 combined with CBAM and CA attention mechanisms. The results show that the integration of CBAM and CA attention mechanisms into the ResNet-101 architecture resulted in significant improvements in model performance. The mAP increased by 4.8% and 5.8%, and the accuracy improved by 7.3% and 8.7%, respectively, compared to the baseline ResNet-101 model without attention mechanisms.
These improvements are due to the enhanced ability of CBAM and CA to capture and emphasize critical features. CBAM applies both spatial and channel attention, helping the model focus on relevant areas while reducing noise. CA adds positional information to channel attention, improving the model’s precision in localizing important regions. As a result, these attention mechanisms significantly boost the feature extraction of the model, leading to more accurate detection and classification.
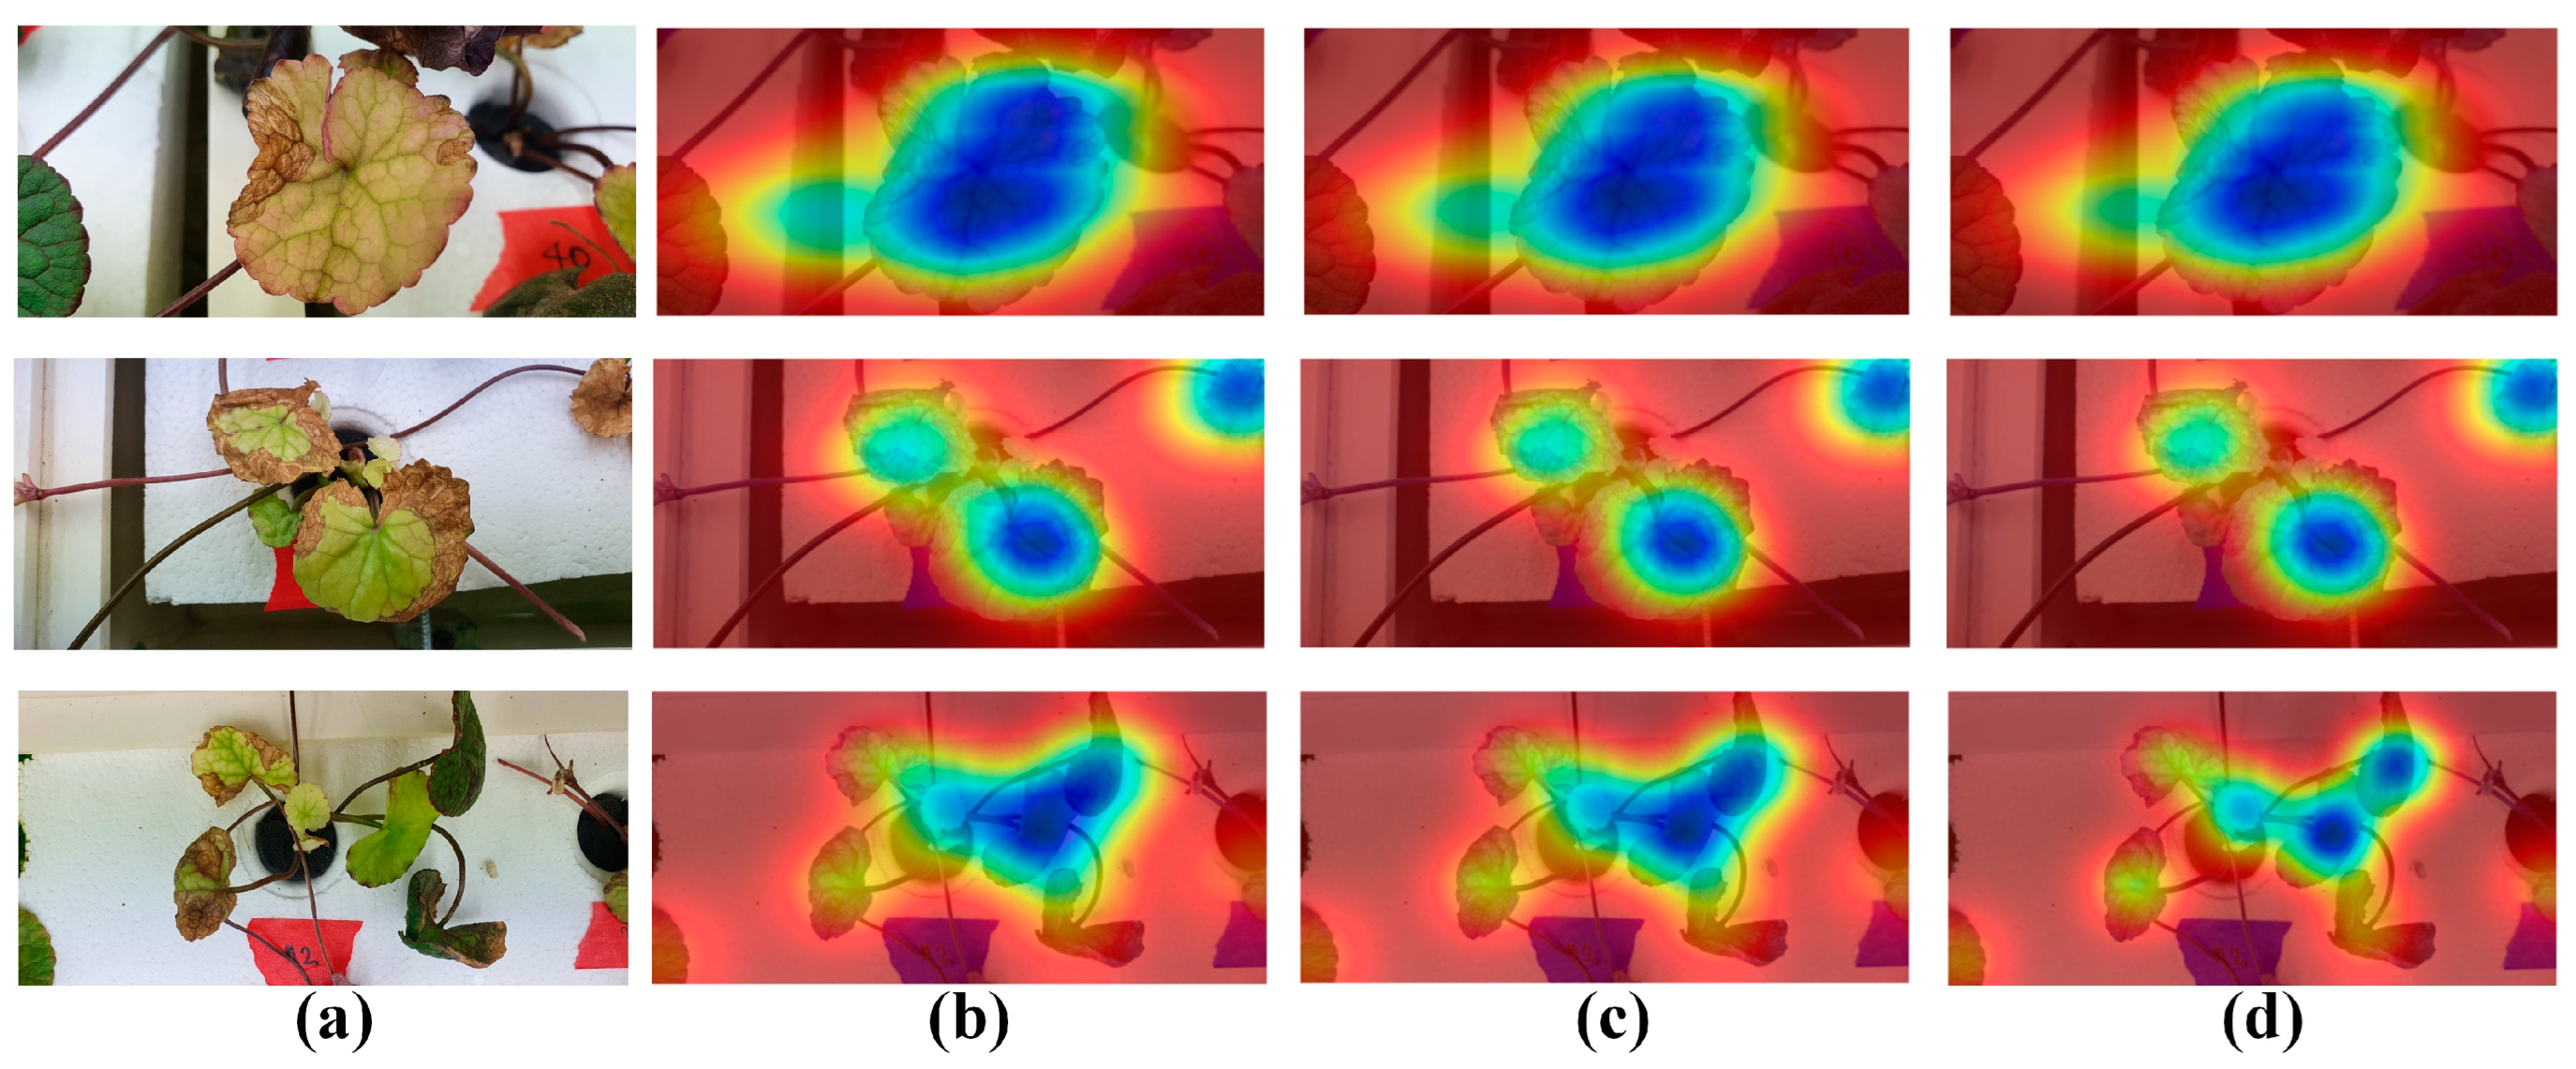
Example of different images with the heatmap are shown in Figure 11. Heatmap helps to better understand which regions the model focuses on during the segmentation and classification tasks. By visualizing the attention patterns, it can be clearly seen how different attention mechanisms, like CBAM and CA, improve the model’s ability to focus on relevant features. The standard Mask-RCNN ResNet-101 model primarily focuses the attention on the central portions of the leaves while neglecting finer details along the edges (Figure 11b). In contrast, the Mask-RCNN ResNet-101+CBAM sharpens attention on boundaries and intricate leaf structures, resulting in more precise segmentation (Figure 11c). However, the Mask-RCNN ResNet-101+CA distributed attention more evenly across the entire leaf. CA aids in capturing both central and peripheral features, enhancing the ability of the model to capture spatial dependencies. Together, CBAM boosts focus on finer details, particularly at the boundaries, while CA ensures a better and more balanced focus across the leaf structure, ultimately improving the segmentation performance of the model.

3.3. Defective Leaf Detection

The Mask R-CNN models, including the baseline Mask R-CNN and the Mask R-CNN integrated with CBAM and CA, effectively generated precise segmentation masks around defective pennywort leaves, clearly distinguishing them from healthy ones. Each model successfully identified defective leaves, demonstrating robustness in handling varied defect presentations.
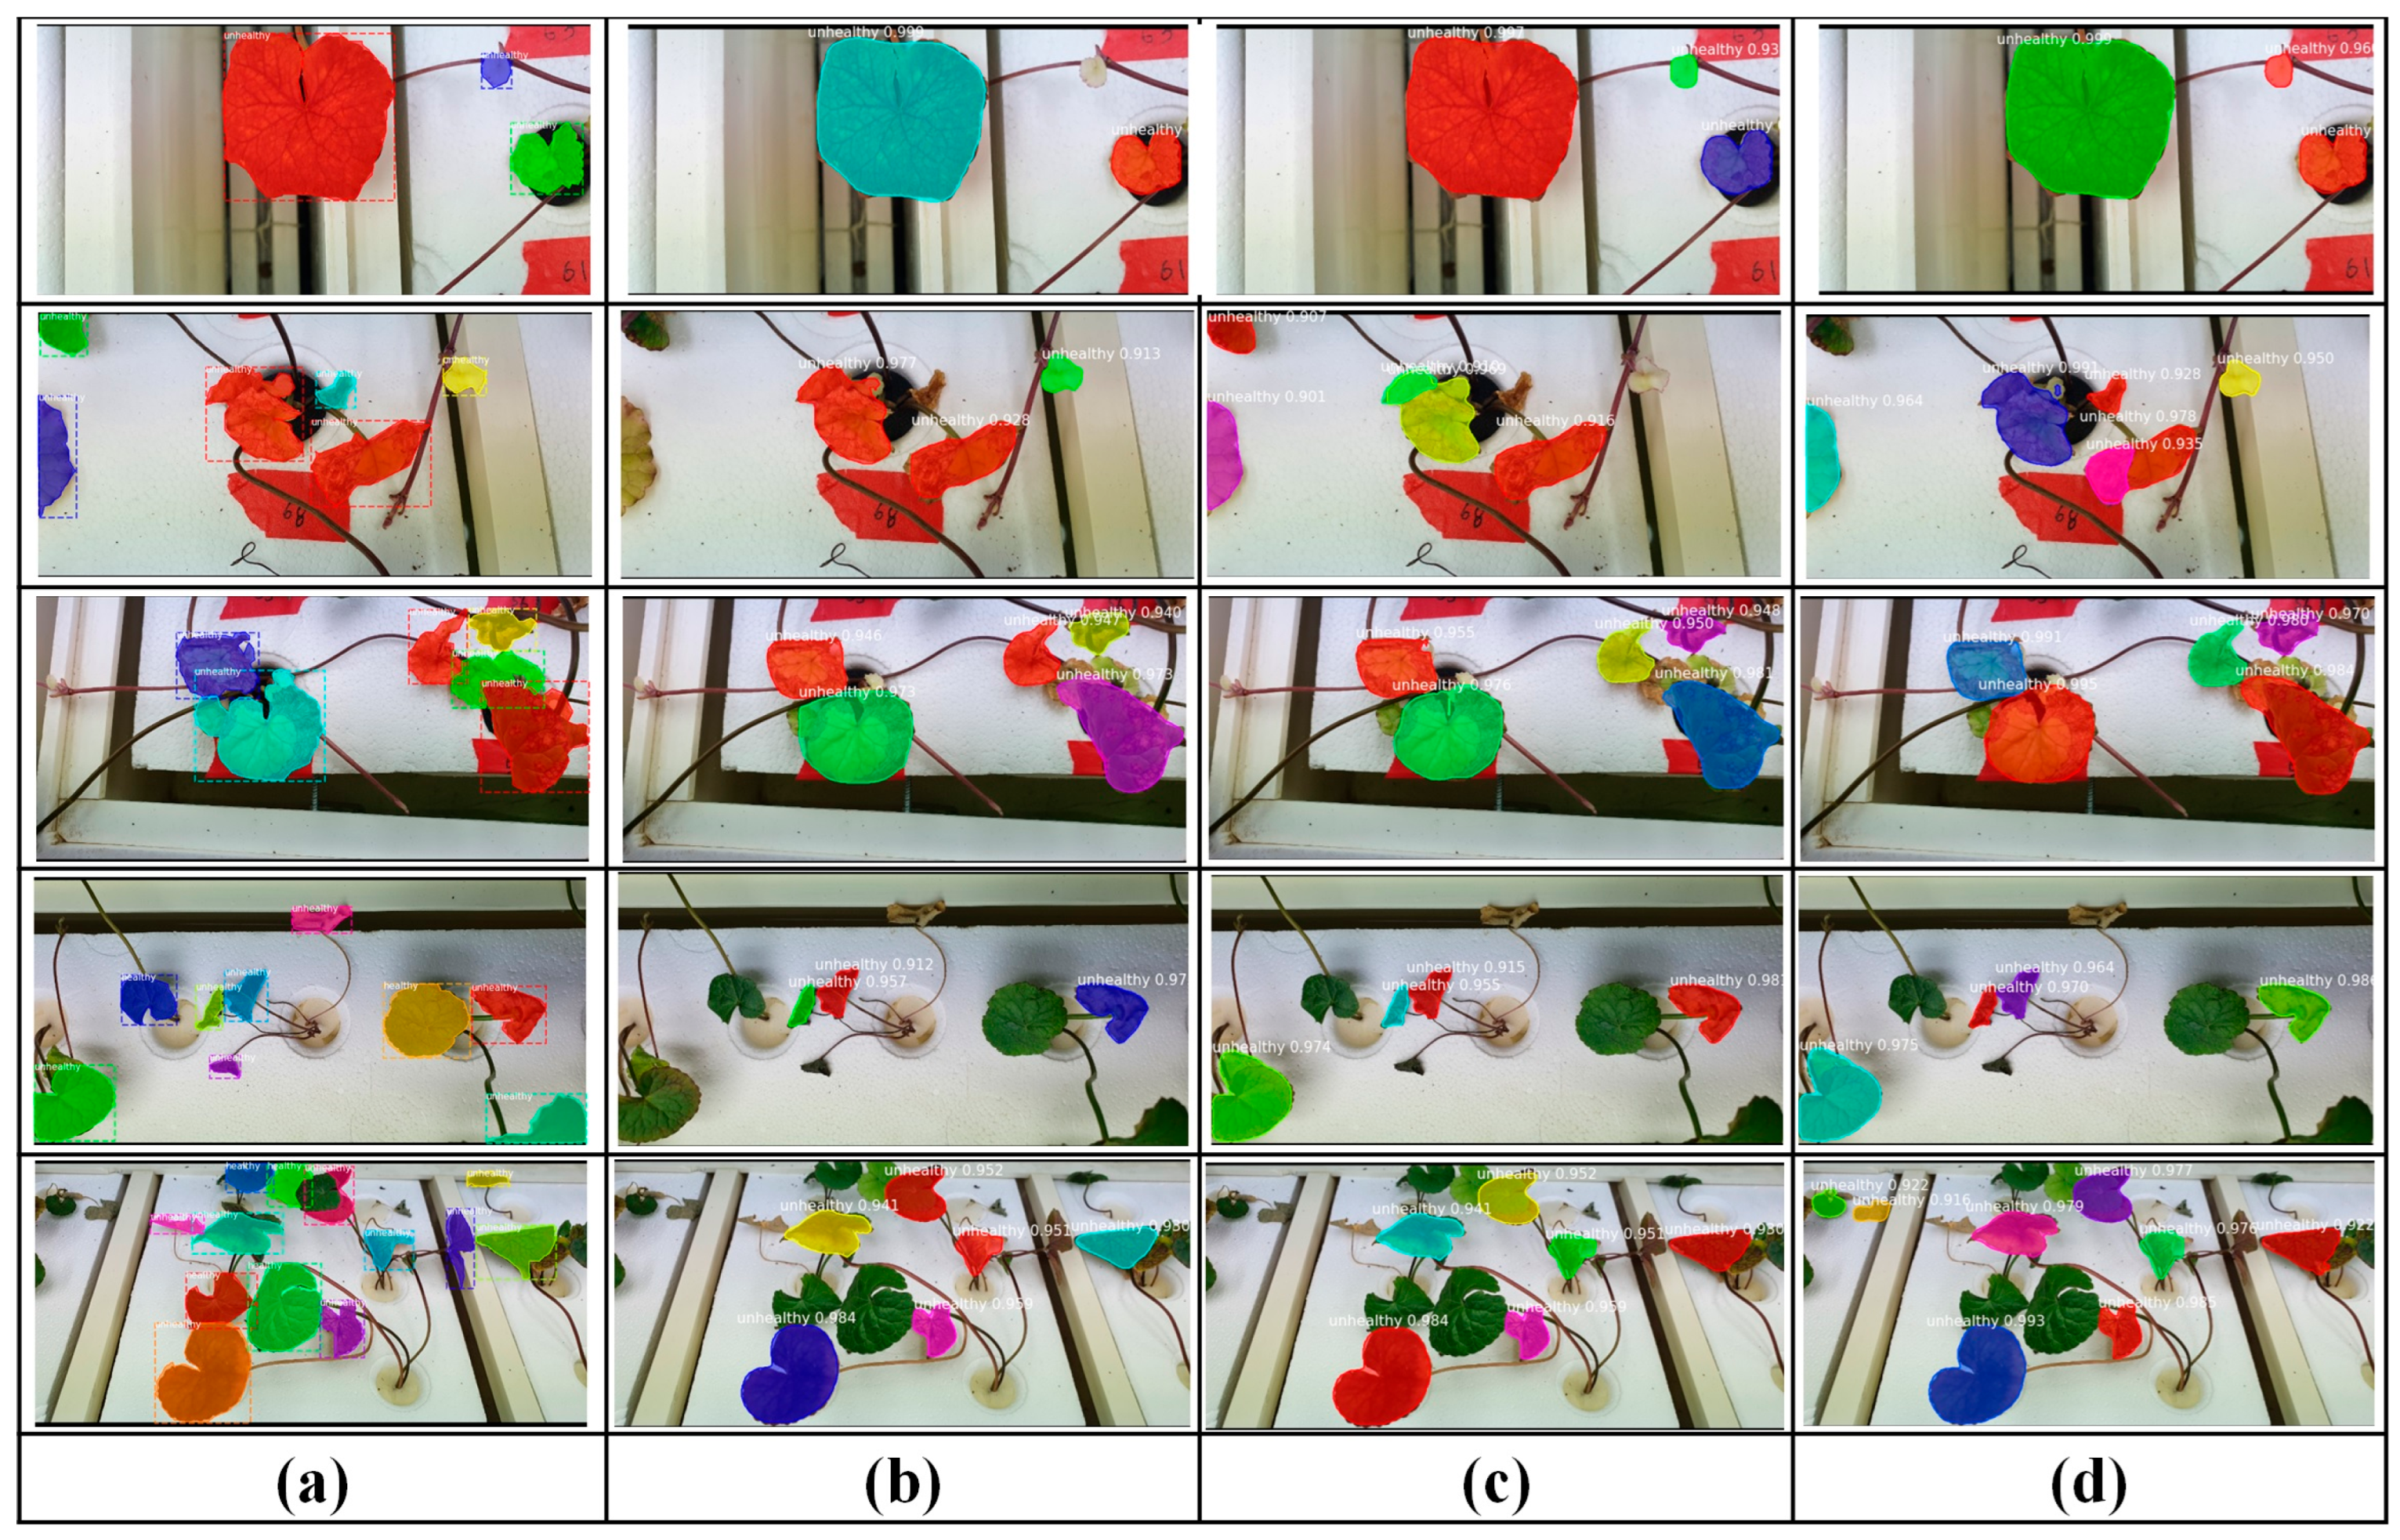
The proposed methods were evaluated for their ability to detect and segment defective pennywort leaves in RGB images. The results, illustrated in Figure 12, show the effectiveness of each model. In the visual outputs, the detected leaves are highlighted with distinct colored masks, while bounding boxes indicate the specific defective regions identified by the models. The anticipated detections are marked by square boxes, with leaves demonstrating a confidence level of at least 50% being selected for final segmentation. The incorporation of CBAM and CA in the Mask R-CNN framework further enhanced the accuracy and precision of the segmentation, as evidenced by the improved clarity and definition of the defective areas in the segmented output.
After 100 epochs, the Mask R-CNN ResNet-101 model achieved an average precision of 0.89, an average recall of 0.87, and an average F1-score of 0.89 as shown in Table 3. These metrics indicate a good performance in detecting defective leaves, and the F1-score of 0.89 reflects a well-balanced performance, ensuring robustness in both detecting and accurately identifying defective leaves.
When the CBAM attention mechanism was added to the Mask-R-CNN_ResNet-101 model, the performance improved, achieving an average precision of 0.92, an average recall of 0.89, and an average F1-score of 0.90. These enhancements indicate that the model with CBAM was better at correctly identifying defective leaves, with a higher overall accuracy and completeness. Further improvement was observed with the introduction of the CA attention mechanism, where the Mask-R-CNN_ResNet-101+CA model reached an average precision of 0.94, an average recall of 0.90, and an average F1-score of 0.92. This version of the model demonstrated the highest accuracy, with 94% precision and 90% recall, making it the most effective in detecting and correctly classifying defective leaves.
Overall, the addition of attention mechanisms, particularly CA, significantly enhanced the performance of the improved model. The segmentation masks produced by these models effectively differentiated all the seedlings from the image background and accurately resolved the structure of overlapping seedlings. This capability is particularly advantageous for applications such indoor vertical farming and transplanting machines in the controlled plant-growth chambers, where identifying overlapped seedlings is critical for efficient operation.
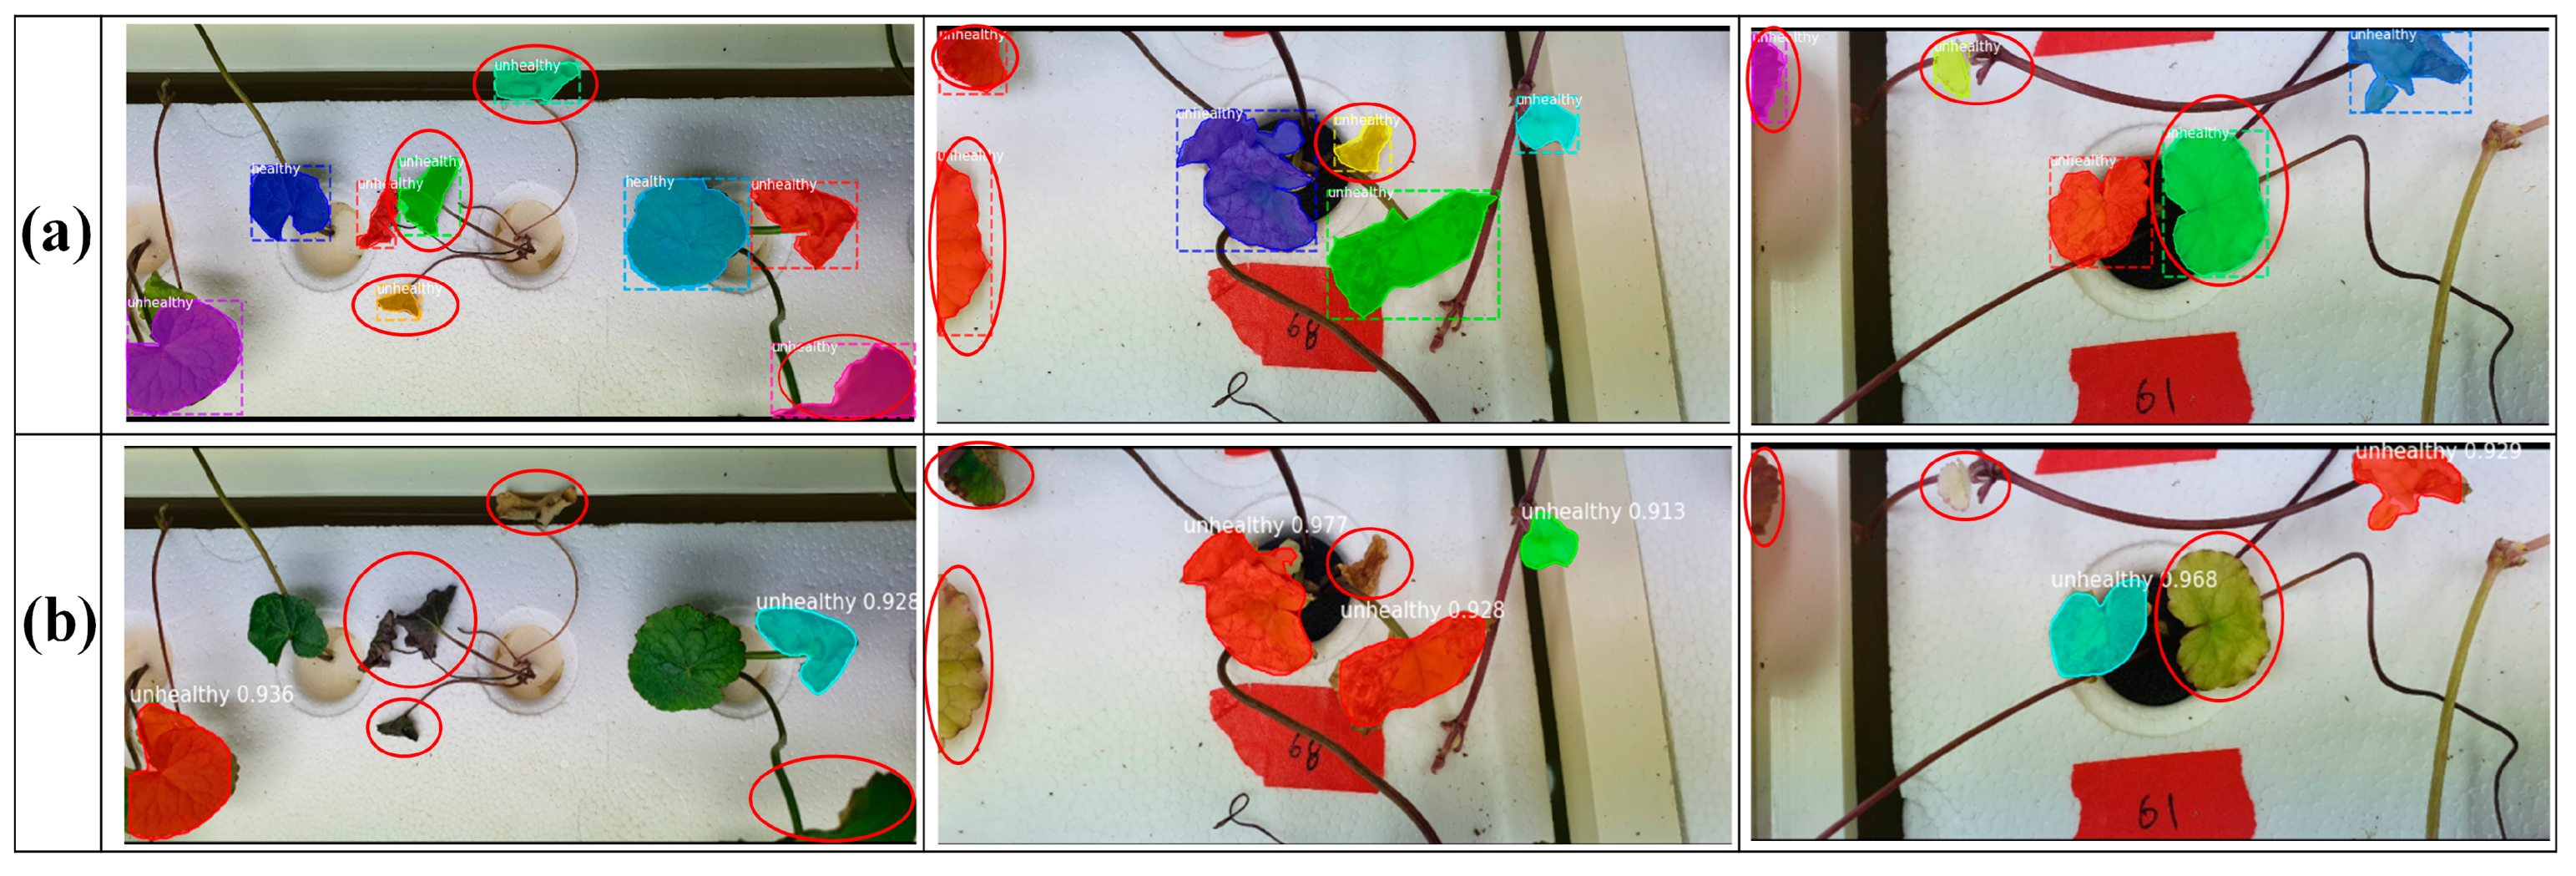
Despite the overall high performance of the model, certain inaccuracies were observed, particularly in the form of false positives and false negatives, as illustrated in Figure 13. The models were trained on a diverse set of images designed to recognize overlapping plants, plants that are stuck together, and small-sized seedlings. However, some challenges persisted, with a few plants either remaining undetected or being incorrectly identified.
These inaccuracies primarily arose from two sources. First, false positives occurred when healthy leaves were mistakenly classified as defective. This misclassification was likely due to subtle variations in texture, color, or other visual cues that the model misinterpreted as defects. This suggests that the model’s sensitivity to minor visual cues may be too high, leading to over-classification of defects. Second, false negatives arose when the model failed to detect defective leaves, which could be attributed to the defects being too minor, subtle, or visually ambiguous for the model to recognize effectively. To address the limitations of the approach, a more detailed error analysis should be conducted to identify the specific conditions under which false positives and false negatives occur, such as particular textures, colors, or plant overlap.
Addressing these issues would involve further refinement of the models. One potential approach is to enhance the quality and diversity of the training dataset. By including a wider variety of defect presentations, as well as more examples of defective and healthy leaves with subtle variations, particularly those that capture challenging conditions, the models could be trained to better distinguish between genuine defects and benign variations. Additionally, increasing the size and variability of the dataset would likely improve the ability to detect even the most subtle defects, thereby reducing the occurrence of both false positives and false negatives and enhancing the overall accuracy and robustness of the model.
Computational speed is a key performance metric for machine learning models, especially for real-time agricultural field applications. The inference time for Mask R-CNN in single-class segmentation was 16.3 ms, equating to approximately 79 FPS. The inference times for the Mask-RCNN ResNet-101+CBAM and Mask-RCNN ResNet-101+CA models were slightly higher due to increased model complexity and improved segmentation accuracy, particularly in identifying defective leaves. Despite this, the models still maintained relatively fast processing times, making them suitable for real-time use in agriculture.
To determine the most suitable base network for the detection of defective pennywort, a comprehensive evaluation of various models was conducted using several well-established machine learning algorithms, including the two different variations of Mask RCNN with ResNet-50 and ResNet-101. Each of these models was trained and tested on the pennywort leaf dataset, which allowed their effectiveness in detecting and classifying defective levels of the pennywort plants to be assessed. The mAP metric provides a comprehensive view of the model’s precision and recall, making it ideal for comparing performance across different detection tasks. The results of these experiments are shown in Table 4. By analyzing the mAP results, we were able to compare the detection accuracy of each model and its ability to generalize across defective leaf detection.
Table 4 shows that the performance of the Mask-RCNN ResNet-101 model achieved a higher mAP (0.893) and accuracy (0.887) than the other models. Mask-RCNN ResNet-50 followed, with a mAP of 0.875 and an accuracy of 0.864. Integrating attention mechanisms, such as CBAM and CA, further improved the performance. Mask-RCNN ResNet-101+CBAM achieved an mAP of 0.918 and accuracy of 0.922, while Mask-RCNN ResNet-101+CA attained the highest results, with an mAP of 0.931 and accuracy of 0.937. The mAP of the Mask-RCNN_ResNet-101 model was 1.8%, 4.9%, 6.1%, and 7.2% higher than the Mask-RCNN_ResNet-50, YOLOv3 [35], Solo V2 [36], and BlendMask [37] models, respectively. This highlights that Mask-RCNN_ResNet-101 is the most effective model for achieving high precision and accuracy.

3.4. Visual Segmentation

This section presents a comparative analysis of the visual segmentation results obtained using the Mask R-CNN, the improved Mask R-CNN enhanced with CBAM, and the improved Mask R-CNN enhanced with CA models. These results pertain to the segmentation of defected leaves within the dataset, as shown in Figure 14. The segmentation output for each method was subjected to binarization using a threshold value of 0.5 [38].
The enhanced models demonstrated an improvement in boundary delineation, particularly in the segmentation of defective regions of the leaves. The integration of attention mechanisms, CBAM and CA within the Mask R-CNN framework contributed to more precise edge detection, which is vital for accurately identifying the extent of defects. Although none of the methods provided flawless segmentation across all images, the Mask R-CNN model incorporating CBAM and CA showed better performance compared to the baseline Mask R-CNN. Furthermore, the improved Mask R-CNN model with CA provided higher segmentation accuracy. The CA effectively recalibrated the feature maps by emphasizing the most informative channels, which resulted in better differentiation of subtle defects and finer details in the leaf structure. This improvement was particularly evident in scenarios where the defects were less pronounced or more challenging to detect.
Overall, the improved Mask R-CNN model with CA exhibited the highest accuracy in segmenting defective leaves, especially in handling intricate details and achieving sharper segmentation boundaries. These enhancements suggest that incorporating attention mechanisms like CBAM and CA into the Mask R-CNN architecture can significantly boost the performance in complex image segmentation tasks, particularly in agricultural applications where precision is critical.

4. Discussion

The proposed method involved enhancing the Mask R-CNN ResNet-101 framework by incorporating the CBAM and CA attention mechanisms into its backbone to improve feature extraction. To assess the impact of the attention module, segmentation results and model parameters of Mask R-CNN with and without the attention module were compared on the test set, as detailed in Table 1 and Table 3. The F1 score and segmentation mAP demonstrated that the segmentation accuracy of the Mask R-CNN model significantly improved with the integration of the attention modules. This improvement indicated that the attention-enhanced Mask R-CNN was more effective at accurately segmenting pennywort leaves.
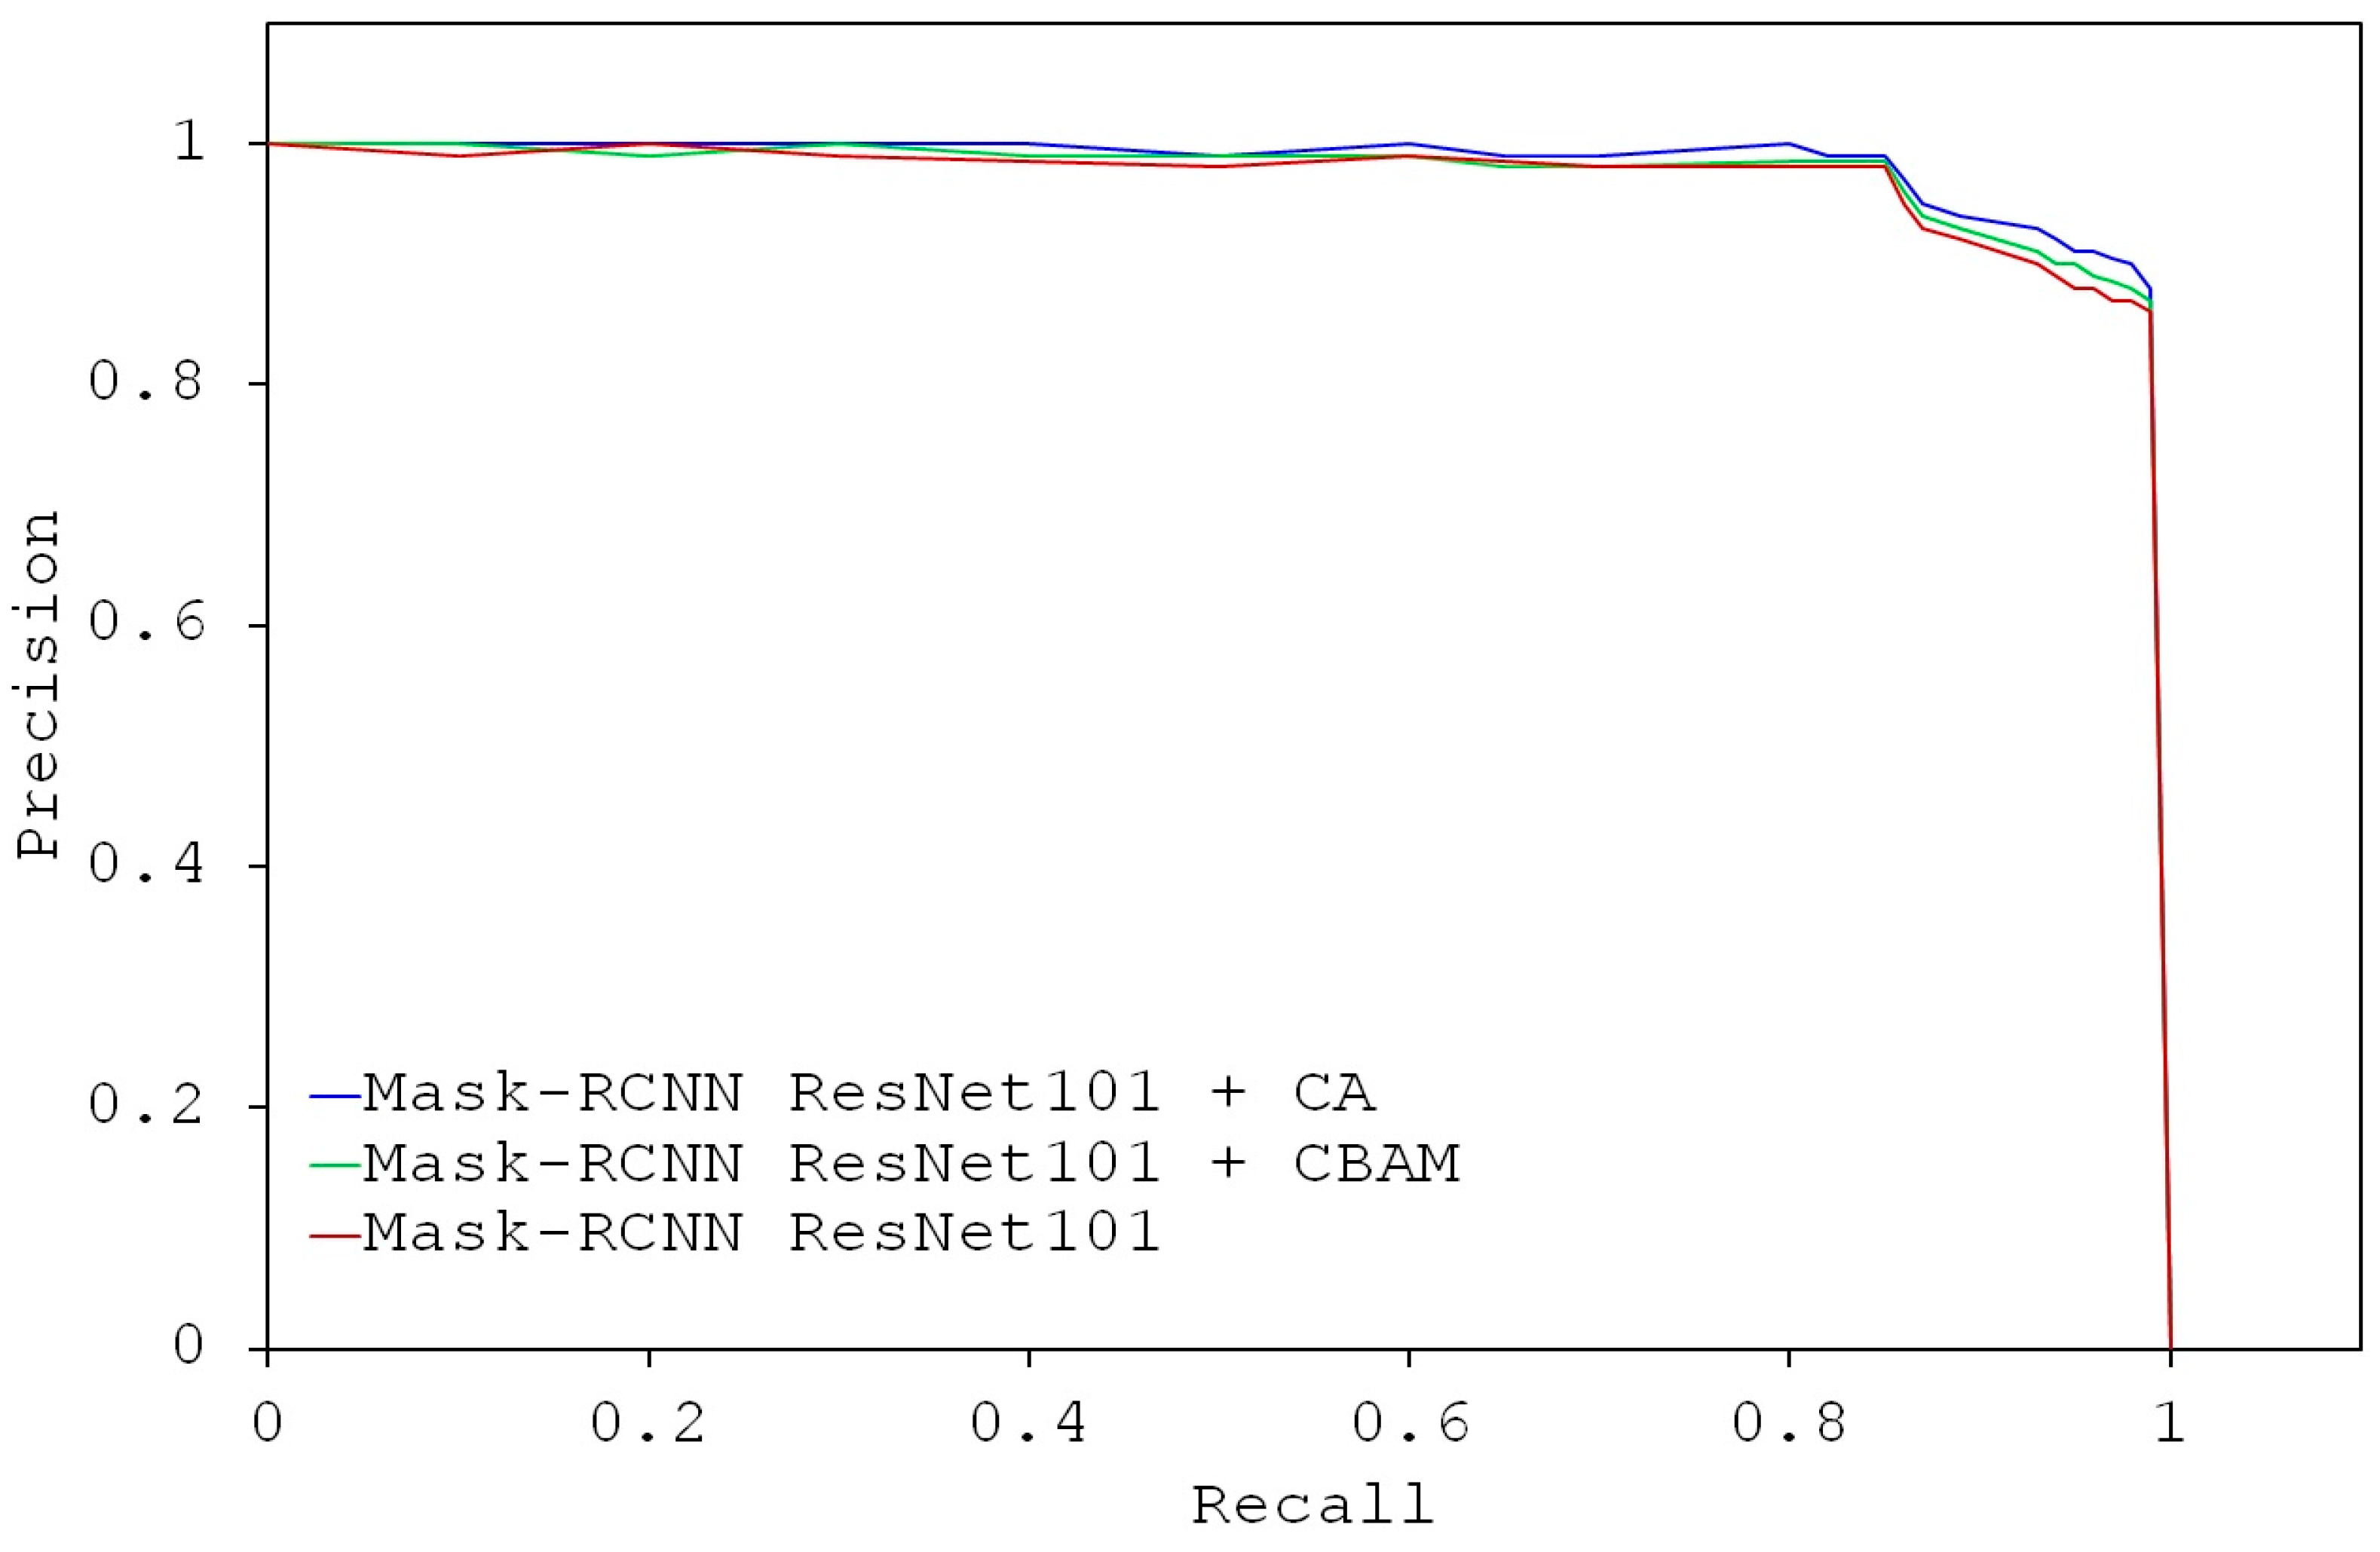
Figure 15 provides a Precision-Recall (P-R) curve representation of the performance improvement achieved by incorporating these attention mechanisms into the ResNet-101 backbone. The relative fluctuations in the curves highlight that both attention-enhanced models maintain high precision even as recall increases, indicating more effective feature extraction and segmentation accuracy in identifying defective pennywort leaves. The integration of attention mechanisms allows the models to handle subtle variations in the data more effectively, contributing to more reliable segmentation results. Although the model size increased due to the attention module, the segmentation accuracy during the pennywort growth period was also enhanced. Balancing accuracy with efficiency is important, especially in resource-limited environments. Techniques like model pruning or knowledge distillation can optimize the model for deployment while mitigating these challenges.
The comparison between the established models and other commonly used networks (Table 4) revealed that Mask RCNN ResNet-101 along with the attention mechanism performed better in both detecting and segmenting defective pennywort leaf detection by the addition of mask branches. ResNet101 was used as backbone networks to integrate different attention mechanism modules. With a deeper network, ResNet101, the receptive field increases, allowing the model to capture richer, more advanced features, resulting in improved detection performance compared to other models. Furthermore, Mask RCNN tackles the issue of misalignment between feature maps and original pixels by employing ROI alignment, which ensures that pixel-level accuracy is maintained during segmentation. This approach helps meet the precision demands for effective image segmentation in the task.
Different studies have explored the attention mechanism and compared established models with other common networks related to Mask R-CNN for detection and segmentation tasks. Li et al. [39] developed an enhanced Mask R-CNN algorithm incorporating attention mechanisms for grape bunch segmentation and maturity detection, using a dataset of 656 grape bunches captured in natural growing conditions. Among the three attention mechanisms—squeeze and excitation (SE), CBAM, and CA—the CA mechanism achieved the highest accuracy of 94.4% in detecting grape bunches and assessing their maturity levels. Shen et al. [40] proposed a new backbone network, ResNet-50-FPN-ED, to improve Mask R-CNN’s instance segmentation capabilities in complex environments. This enhancement addressed challenges such as cluster shape variations, leaf shading, trunk occlusion, and overlapping grapes. The integration of an efficient channel attention (ECA) mechanism into the backbone refined feature extraction, resulting in better grape cluster detection. The algorithm was validated on a large dataset of 682 annotated images, achieving an average precision (AP) of 60.1% for object detection and 59.5% for instance segmentation. Wang et al. [41] introduced an apple instance segmentation method based on an improved Mask R-CNN with attention mechanisms. This method effectively and accurately segmented red apples, green apples, apples with uneven colors, overlapping apples, and apples occluded by branches and leaves, achieving a segmentation mAP of 0.917 with an average runtime of 0.25 s per image. Zhang et al. [20] presented an enhanced Mask R-CNN model and a segmentation method using the segment anything model (SAM) to tackle challenges such as occlusion and fuzzy edges in leaf segmentation. The improved model achieved an average MIoU of 85.10%, representing an 11.10% improvement over the original algorithm.
When detecting defective pennywort leaves, the integration of CBAM and CA significantly improves the Mask R-CNN model ability to distinguish subtle differences between healthy and defective leaves. The Mask R-CNN with ResNet-101 backbone extracts image features, passes them through the RPN, and generates region proposals for classification and mask segmentation. CBAM, integrated into the deeper layers of the ResNet-101 backbone, enhances the network's ability to prioritize key features at the channel and spatial levels. It helps the model focus on relevant textures and patterns, such as surface irregularities or discolorations specific to defective pennywort leaves, while spatial attention guides the network to focus on damaged regions and ignore healthy areas. This targeted focus improves the model's sensitivity to defects, enhancing classification and segmentation. For CA captures long-range dependencies and preserves spatial relationships, helping the network maintain global context while focusing on localized defects. By encoding positional information, CA ensures that features are distinguished based on their location, improving defect localization and segmentation precision. By integrating of CBAM at deeper layers emphasize broader features, improving the ability of the model to focus on classification and segmentation. For the CA, which was applied in deeper layers, encoding spatial information to help the network localize key regions, such as defective spots, discolored location, etc. enhanced the mask generation and segmentation precision. Further analysis and experiment should investigate how the integration points of CBAM and CA within the Mask R-CNN architecture impact model performance. Applying CBAM in early layers may improve the capture of low-level details like texture and color, while deeper integration enhances focus on high-level features. Similarly, CA’s placement could affect the model’s ability to capture spatial relationships and long-range dependencies. Experimenting with these integration points can help optimize the detection of both localized defects and larger structural irregularities, improving segmentation and classification performance.
Islam et al. [42] developed an enhanced Mask R-CNN model for detecting lettuce seedlings in a plant factory environment. Their model achieved a top F1 score of 93%, with 92% precision and 95% recall when identifying lettuce seedlings from 150 test images. The study also analyzed the differences between actual and predicted seedling sizes at various growth stages. Chu et al. [43] introduced a new deep learning framework called suppression Mask R-CNN for apple detection. This model demonstrated high effectiveness in apple detection, achieving an F1 score of 90%, with 88% precision and 93% recall. Triki et al. [44] proposed a segmentation and measurement scheme for leaf morphological features using Mask R-CNN with an enhanced ResNet-50/101 backbone. Their model showed high precision and robustness, achieving an average relative error of 4.6% for leaf length and 5.7% for leaf width. López-Barrios et al. [45] developed a Mask R-CNN model for the automatic detection of sweet pepper peduncles and fruits, achieving precision, recall, and F1 scores of 78.16%, 66.86%, and 71.89%, respectively, in tests with 100 images. Tian et al. [19] created the MASU R-CNN, which enhances Mask Scoring R-CNN with a U-Net backbone for accurate instance segmentation of apple flowers at different growth stages. Utilizing ResNet-101 FPN as the feature extractor, MASU R-CNN delivered impressive results with 96.43% precision, 95.37% recall, and an F1 score of 95.90%, along with a mean average precision (mAP) of 0.594 and a mean intersection over union (mIoU) of 91.55%. Almazaydeh et al. [46] applied Mask R-CNN to develop a classification system for identifying medicinal plants, achieving an average accuracy of 95.7% in identifying 30 species from the Mendeley dataset. Afzaal et al. [47] introduced a Mask R-CNN-based model for instance segmentation of seven different strawberry diseases, utilizing a ResNet backbone and systematic data augmentation to achieve a mean average precision of 82.43%.
Comparing with the literature, the Mask R-CNN models enhanced with CBAM and CA (Table 3) outperform other methods. The CBAM-enhanced model shows a higher F1 score, while the CA-enhanced model achieves an even better F1 score of 94%. This demonstrates that integrating CBAM and CA significantly improves segmentation and detection performance, making these models competitive with other agricultural detection frameworks. The high precision and recall of CA-enhanced model further highlight its effectiveness in accurately detecting pennywort leaves, consistent with similar studies.
The impact of these attention mechanisms leads to sharper and more accurate segmentation, particularly in edge detection and the management of fine details, which are essential for tasks like defect segmentation. The technical advancements provided by CBAM and CA enhance the robustness and reliability of Mask R-CNN models, making them more suitable for applications in precision agriculture and other fields where high segmentation accuracy is vital. These studies demonstrate the flexibility and effectiveness of Mask R-CNN and its variants in agricultural applications, consistently achieving high precision, recall, and F1 scores across various fruit and vegetable detection tasks. This study seeks to further contribute to this area of research by improving detection accuracy and segmentation quality in similar or even more challenging scenarios, in comparison to these benchmarks.

5. Conclusions

The production of medicinal crops under controlled environmental conditions is rapidly increasing, but traditional crop health monitoring methods are struggling to keep pace. AI-based monitoring technologies are becoming increasingly popular due to their fast and precise performance. This study identified defective pennywort leaves using mask RCNN-based algorithms with integrated attention mechanisms. The CA-augmented model exhibited superior performance, achieving a mean average precision (mAP) of 0.931 and an accuracy of 0.937, with an F1-score reaching 0.92. These results highlight the effectiveness of the model in handling intricate details and subtle defects in complex agricultural tasks. However, some limitations were observed, particularly the occurrence of false positive and false negative detection of defective leaves due to the misclassification of healthy leaves as defective, and failure to detect very subtle defects. Addressing these limitations would require further refinement of the model, such as enhancing the quality and diversity of the training dataset. By incorporating a broader range of defect presentations and subtle variations, the robustness and accuracy of the model could be further improved, making it an even more valuable tool for precision farming technologies. This approach could be extended to other medicinal crops, such as lemon balm, ice plants, and wood sorrel. Deploying these models on edge devices, such as smartphones, allows end users like farmers and other stakeholders to capture real-time images of their affected crops and make informed decisions. However, to achieve even better outcomes, future evaluations should focus on advanced and hybrid R-CNN methods, incorporating features like growth prediction, yield estimation, and market value assessment.

Author Contributions

Conceptualization, M.C. and S.-O.C.; methodology, M.C., M.N.R., G.-J.L. and S.-O.C.; software, M.N.R. and H.J.; validation, M.C., M.N.R., H.J. and S.I.; formal analysis, H.J., S.I. and G.-J.L.; investigation, G.-J.L. and S.-O.C.; resources, S.-O.C.; data curation, M.C., M.N.R., H.J. and S.I.; writing—original draft preparation, M.C. and M.N.R.; writing—review and editing, M.C., M.N.R., S.I., G.-J.L. and S.-O.C.; visualization, M.C., M.N.R., H.J. and S.I.; supervision, S.-O.C.; project administration, S.-O.C.; funding acquisition, S.-O.C. All authors have read and agreed to the published version of the manuscript.

Funding

This work was supported by the Korea Institute of Planning and Evaluation for Technology in Food, Agriculture and Forestry (IPET) through the Smart Farm Innovation Technology Development Program, funded by Ministry of Agriculture, Food and Rural Affairs (MAFRA) (Project No. 421035-04), Republic of Korea.

Data Availability Statement

Data can be available on request.

Conflicts of Interest

The authors declare no conflicts of interest.

References

  1. Gohil, K.J.; Patel, J.A.; Gajjar, A.K. Pharmacological review on centella asiatica: A potential herbal cure-all. Indian J. Pharm. Sci. 2010, 72, 546–556. [Google Scholar] [CrossRef] [PubMed]
  2. Poddar, S.; Sarkar, T.; Choudhury, S.; Chatterjee, S.; Ghosh, P. Indian traditional medicinal plants: A concise review. Int. J. Bot. Stud. 2020, 5, 174–190. [Google Scholar]
  3. Sawicka, B.; Skiba, D.; Umachandran, K.; Dickson, A. Alternative and New Plants. In Preparation of Phytopharmaceuticals for the Management of Disorders; Academic Press: Cambridge, MA, USA, 2020; pp. 491–537. [Google Scholar]
  4. Rattanachaikunsopon, P.; Phumkhachorn, P. Use of asiatic pennywort centella asiatica aqueous extract as a bath treatment to control columnaris in nile tilapia. J. Aquat. Anim. Health 2010, 22, 14–20. [Google Scholar] [CrossRef] [PubMed]
  5. Yasurin, P.; Sriariyanun, M.; Phusantisampan, T. Review: The bioavailability activity of centella asiatica. KMUTNB Int. J. Appl. Sci. Technol. 2015, 9, 1–9. [Google Scholar] [CrossRef]
  6. Wang, D.; Chen, Y.; Li, J.; Wu, E.; Tang, T.; Singla, R.K.; Shen, B.; Zhang, M. Natural products for the treatment of age-related macular degeneration. Phytomedicine 2024, 130, 155522. [Google Scholar] [CrossRef] [PubMed]
  7. Chowdhury, M.; Gulandaz, M.A.; Islam, S.; Reza, M.N.; Ali, M.; Islam, M.N.; Park, S.-U.; Chung, S.-O. Lighting conditions affect the growth and glucosinolate contents of chinese kale leaves grown in an aeroponic plant factory. Hortic. Environ. Biotechnol. 2023, 64, 97–113. [Google Scholar] [CrossRef]
  8. Chowdhury, M.; Kiraga, S.; Islam, M.N.; Ali, M.; Reza, M.N.; Lee, W.-H.; Chung, S.-O. Effects of temperature, relative humidity, and carbon dioxide concentration on growth and glucosinolate content of kale grown in a plant factory. Foods 2021, 10, 1524. [Google Scholar] [CrossRef] [PubMed]
  9. Kabir, M.S.N.; Reza, M.N.; Chowdhury, M.; Ali, M.; Samsuzzaman; Ali, M.R.; Lee, K.Y.; Chung, S.-O. Technological trends and engineering issues on vertical farms: A review. Horticulturae 2023, 9, 1229. [Google Scholar] [CrossRef]
  10. Chowdhury, M.; Islam, M.N.; Reza, M.N.; Ali, M.; Rasool, K.; Kiraga, S.; Lee, D.; Chung, S.-O. Sensor-based nutrient recirculation for aeroponic lettuce cultivation. J. Biosyst. Eng. 2021, 46, 81–92. [Google Scholar] [CrossRef]
  11. Jones, J.B., Jr. Hydroponics: A Practical Guide for the Soilless Grower; CRC Press: Boca Raton, FL, USA, 2016. [Google Scholar]
  12. Hasanuzzaman, M.; Nahar, K.; Alam, M.M.; Roychowdhury, R.; Fujita, M. Physiological, biochemical, and molecular mechanisms of heat stress tolerance in plants. Int. J. Mol. Sci. 2013, 14, 9643–9684. [Google Scholar] [CrossRef]
  13. Darko, E.; Heydarizadeh, P.; Schoefs, B.; Sabzalian, M.R. Photosynthesis under artificial light: The shift in primary and secondary metabolism. Philos. Trans. R. Soc. Lond. B Biol. Sci. 2014, 369, 20130243. [Google Scholar] [CrossRef] [PubMed]
  14. Shi, Y.; Ke, X.; Yang, X.; Liu, Y.; Hou, X. Plants response to light stress. J. Genet. Genomes 2022, 49, 735–747. [Google Scholar] [CrossRef] [PubMed]
  15. Pandey, R.; Vengavasi, K.; Hawkesford, M.J. Plant adaptation to nutrient stress. Plant Physiol. Rep. 2021, 26, 583–586. [Google Scholar] [CrossRef]
  16. Li, H.; Zhang, M.; Gao, Y.; Li, M.; Ji, Y. Green ripe tomato detection method based on machine vision in greenhouse. Trans. Chin. Soc. Agric. Eng. 2017, 33, 328–334. [Google Scholar]
  17. Story, D.; Kacira, M. Design and implementation of a computer vision-guided greenhouse crop diagnostics system. Mach. Vision Appl. 2015, 26, 495–506. [Google Scholar] [CrossRef]
  18. Tian, Y.; Yang, G.; Wang, Z.; Li, E.; Liang, Z. Instance segmentation of apple flowers using the improved mask R–CNN model. Biosyst. Eng. 2020, 193, 264–278. [Google Scholar] [CrossRef]
  19. Tian, Z.; Ma, W.; Yang, Q.; Duan, F. Application status and challenges of machine vision in plant factory—A review. Inf. Process. Agric. 2022, 9, 195–211. [Google Scholar] [CrossRef]
  20. Zhang, X.; Bu, J.; Zhou, X.; Wang, X. Automatic pest identification system in the greenhouse based on deep learning and machine vision. Front. Plant Sci. 2023, 14, 1255719. [Google Scholar] [CrossRef]
  21. Yamamoto, K.; Guo, W.; Yoshioka, Y.; Ninomiya, S. On plant detection of intact tomato fruits using image analysis and machine learning methods. Sensors 2014, 14, 12191–12206. [Google Scholar] [CrossRef]
  22. Wang, Q.; Qi, F.; Sun, M.; Qu, J.; Xue, J. Identification of tomato disease types and detection of infected areas based on deep convolutional neural networks and object detection techniques. Comput. Intel. Neurosc. 2019, 2019, 9142753. [Google Scholar] [CrossRef]
  23. Islam, S.; Reza, M.N.; Chowdhury, M.; Islam, M.N.; Ali, M.; Kiraga, S.; Chung, S.O. Image processing algorithm to estimate ice-plant leaf area from rgb images under different light conditions. IOP Conf. Ser. Earth Environ. Sci. 2021, 924, 012013. [Google Scholar] [CrossRef]
  24. Liu, X.; Zhao, D.; Jia, W.; Ji, W.; Ruan, C.; Sun, Y. Cucumber fruits detection in greenhouses based on instance segmentation. IEEE Access 2019, 7, 139635–139642. [Google Scholar] [CrossRef]
  25. Story, D.; Kacira, M.; Kubota, C.; Akoglu, A.; An, L. Lettuce calcium deficiency detection with machine vision computed plant features in controlled environments. Comput. Electron. Agric. 2010, 74, 238–243. [Google Scholar] [CrossRef]
  26. Reza, M.N.; Chowdhury, M.; Islam, S.; Kabir, M.S.N.; Park, S.U.; Lee, G.-J.; Cho, J.; Chung, S.-O. Leaf area prediction of pennywort plants grown in a plant factory using image processing and an artificial neural network. Horticulturae 2023, 9, 1346. [Google Scholar] [CrossRef]
  27. Mohapatra, P.; Ray, A.; Sandeep, I.S.; Nayak, S.; Mohanty, S. Tissue-culture-mediated biotechnological intervention in centella asiatica: A potential antidiabetic plant. In Biotechnology of Anti-Diabetic Medicinal Plants; Gantait, S., Verma, S.K., Sharangi, A.B., Eds.; Springer: Singapore, 2021; pp. 89–116. ISBN 9789811635298. [Google Scholar]
  28. Mathavaraj, S.; Sabu, K.K. Genetic status of Centella asiatica (L.) Urb. (Indian pennywort): A review. Curr. Bot. 2021, 12, 150–160. [Google Scholar] [CrossRef]
  29. Ren, S.; He, K.; Girshick, R.; Sun, J. Faster R-CNN: Towards real-time object detection with region proposal networks. In Proceedings of the Advances in Neural Processing Systems, Montreal, QC, Canada, 7–12 December 2016; Curran Associates Inc.: Red Hook, NY, USA, 2016; Volume 28. [Google Scholar]
  30. He, K.; Zhang, X.; Ren, S.; Sun, J. Deep residual learning for image recognition. In Proceedings of the IEEE Conference on Computer Vision and Pattern Recognition, Las Vegas, NV, USA, 27–30 June 2016; pp. 770–778. [Google Scholar]
  31. Fang, S.; Zhang, B.; Hu, J. Improved mask R-CNN multi-target detection and segmentation for autonomous Driving in Complex Scenes. Sensors 2023, 23, 3853. [Google Scholar] [CrossRef]
  32. Woo, S.; Park, J.; Lee, J.-Y.; Kweon, I.S. CBAM: Convolutional block attention module. In Proceedings of the European Conference on Computer Vision (ECCV), Munich, Germany, 8–14 September 2018; pp. 3–19. [Google Scholar]
  33. Hou, Q.; Zhou, D.; Feng, J. Coordinate attention for efficient mobile network design. In Proceedings of the IEEE/CVF Conference on Computer Vision and Pattern Recognition, Nashville, TN, USA, 20–25 June 2021; pp. 13713–13722. [Google Scholar]
  34. Gul-Mohammed, J.; Arganda-Carreras, I.; Andrey, P.; Galy, V.; Boudier, T. A generic classification-based method for segmentation of nuclei in 3d images of early embryos. BMC Bioinform. 2014, 15, 9. [Google Scholar] [CrossRef]
  35. Redmon, J.; Farhadi, A. Yolov3: An Incremental Improvement. arXiv 2018, arXiv:180402767. [Google Scholar]
  36. Wang, X.; Zhang, R.; Kong, T.; Li, L.; Shen, C. Solov2: Dynamic and Fast Instance Segmentation. In Proceedings of the Advances in Neural Information Processing Systems Annual Conference on Neural Information Processing Systems, Virtual, 6–12 December 2020; Volume 33, pp. 17721–17732. [Google Scholar]
  37. Chen, H.; Sun, K.; Tian, Z.; Shen, C.; Huang, Y.; Yan, Y. BlendMask: Top-Down Meets Bottom-Up for Instance Segmentation. In Proceedings of the IEEE/CVF Conference on Computer Vision and Pattern Recognition, CVPR, Seattle, WA, USA, 14–19 June 2020. [Google Scholar]
  38. Huang, F.; Li, Y.; Liu, Z.; Gong, L.; Liu, C. A method for calculating the leaf area of pak choi based on an improved mask R-CNN. Agriculture 2024, 14, 101. [Google Scholar] [CrossRef]
  39. Li, Y.; Wang, Y.; Xu, D.; Zhang, J.; Wen, J. An improved mask RCNN model for segmentation of ‘Kyoho’ (Vitis labruscana) grape bunch and detection of its maturity level. Agriculture 2023, 13, 914. [Google Scholar] [CrossRef]
  40. Shen, L.; Su, J.; Huang, R.; Quan, W.; Song, Y.; Fang, Y.; Su, B. Fusing attention mechanism with mask R-CNN for instance segmentation of grape cluster in the field. Front. Plant Sci. 2022, 13, 934450. [Google Scholar] [CrossRef] [PubMed]
  41. Wang, D.; He, D. Fusion of mask RCNN and attention mechanism for instance segmentation of apples under complex background. Comput. Electron. Agric. 2022, 196, 106864. [Google Scholar] [CrossRef]
  42. Islam, S.; Reza, M.N.; Chowdhury, M.; Ahmed, S.; Lee, K.-H.; Ali, M.; Cho, Y.J.; Noh, D.H.; Chung, S.-O. Detection and segmentation of lettuce seedlings from seedling-growing tray imagery using an improved mask R-CNN method. Smart Agric. Technol. 2024, 8, 100455. [Google Scholar] [CrossRef]
  43. Chu, P.; Li, Z.; Lammers, K.; Lu, R.; Liu, X. Deep learning-based apple detection using a suppression mask R-CNN. Pattern Recognit. Lett. 2021, 147, 206–211. [Google Scholar] [CrossRef]
  44. Triki, A.; Bouaziz, B.; Gaikwad, J.; Mahdi, W. Deep Leaf: Mask R-CNN based leaf detection and segmentation from digitized herbarium specimen images. Pattern Recognit. Lett. 2021, 150, 76–83. [Google Scholar] [CrossRef]
  45. López-Barrios, J.D.; Escobedo Cabello, J.A.; Gómez-Espinosa, A.; Montoya-Cavero, L.-E. Green sweet pepper fruit and peduncle detection using mask r-cnn in greenhouses. Appl. Sci. 2023, 13, 6296. [Google Scholar] [CrossRef]
  46. Almazaydeh, L.; Salameen, R.; Elleithy, K. Herbal leaf recognition using mask-region convolutional neural network (mask R-CNN). J. Theor. Appl. Inf. Technol. 2022, 100, 3664–3671. [Google Scholar]
  47. Afzaal, U.; Bhattarai, B.; Pandeya, Y.R.; Lee, J. An instance segmentation model for strawberry diseases based on mask R-CNN. Sensors 2021, 21, 6565. [Google Scholar] [CrossRef]
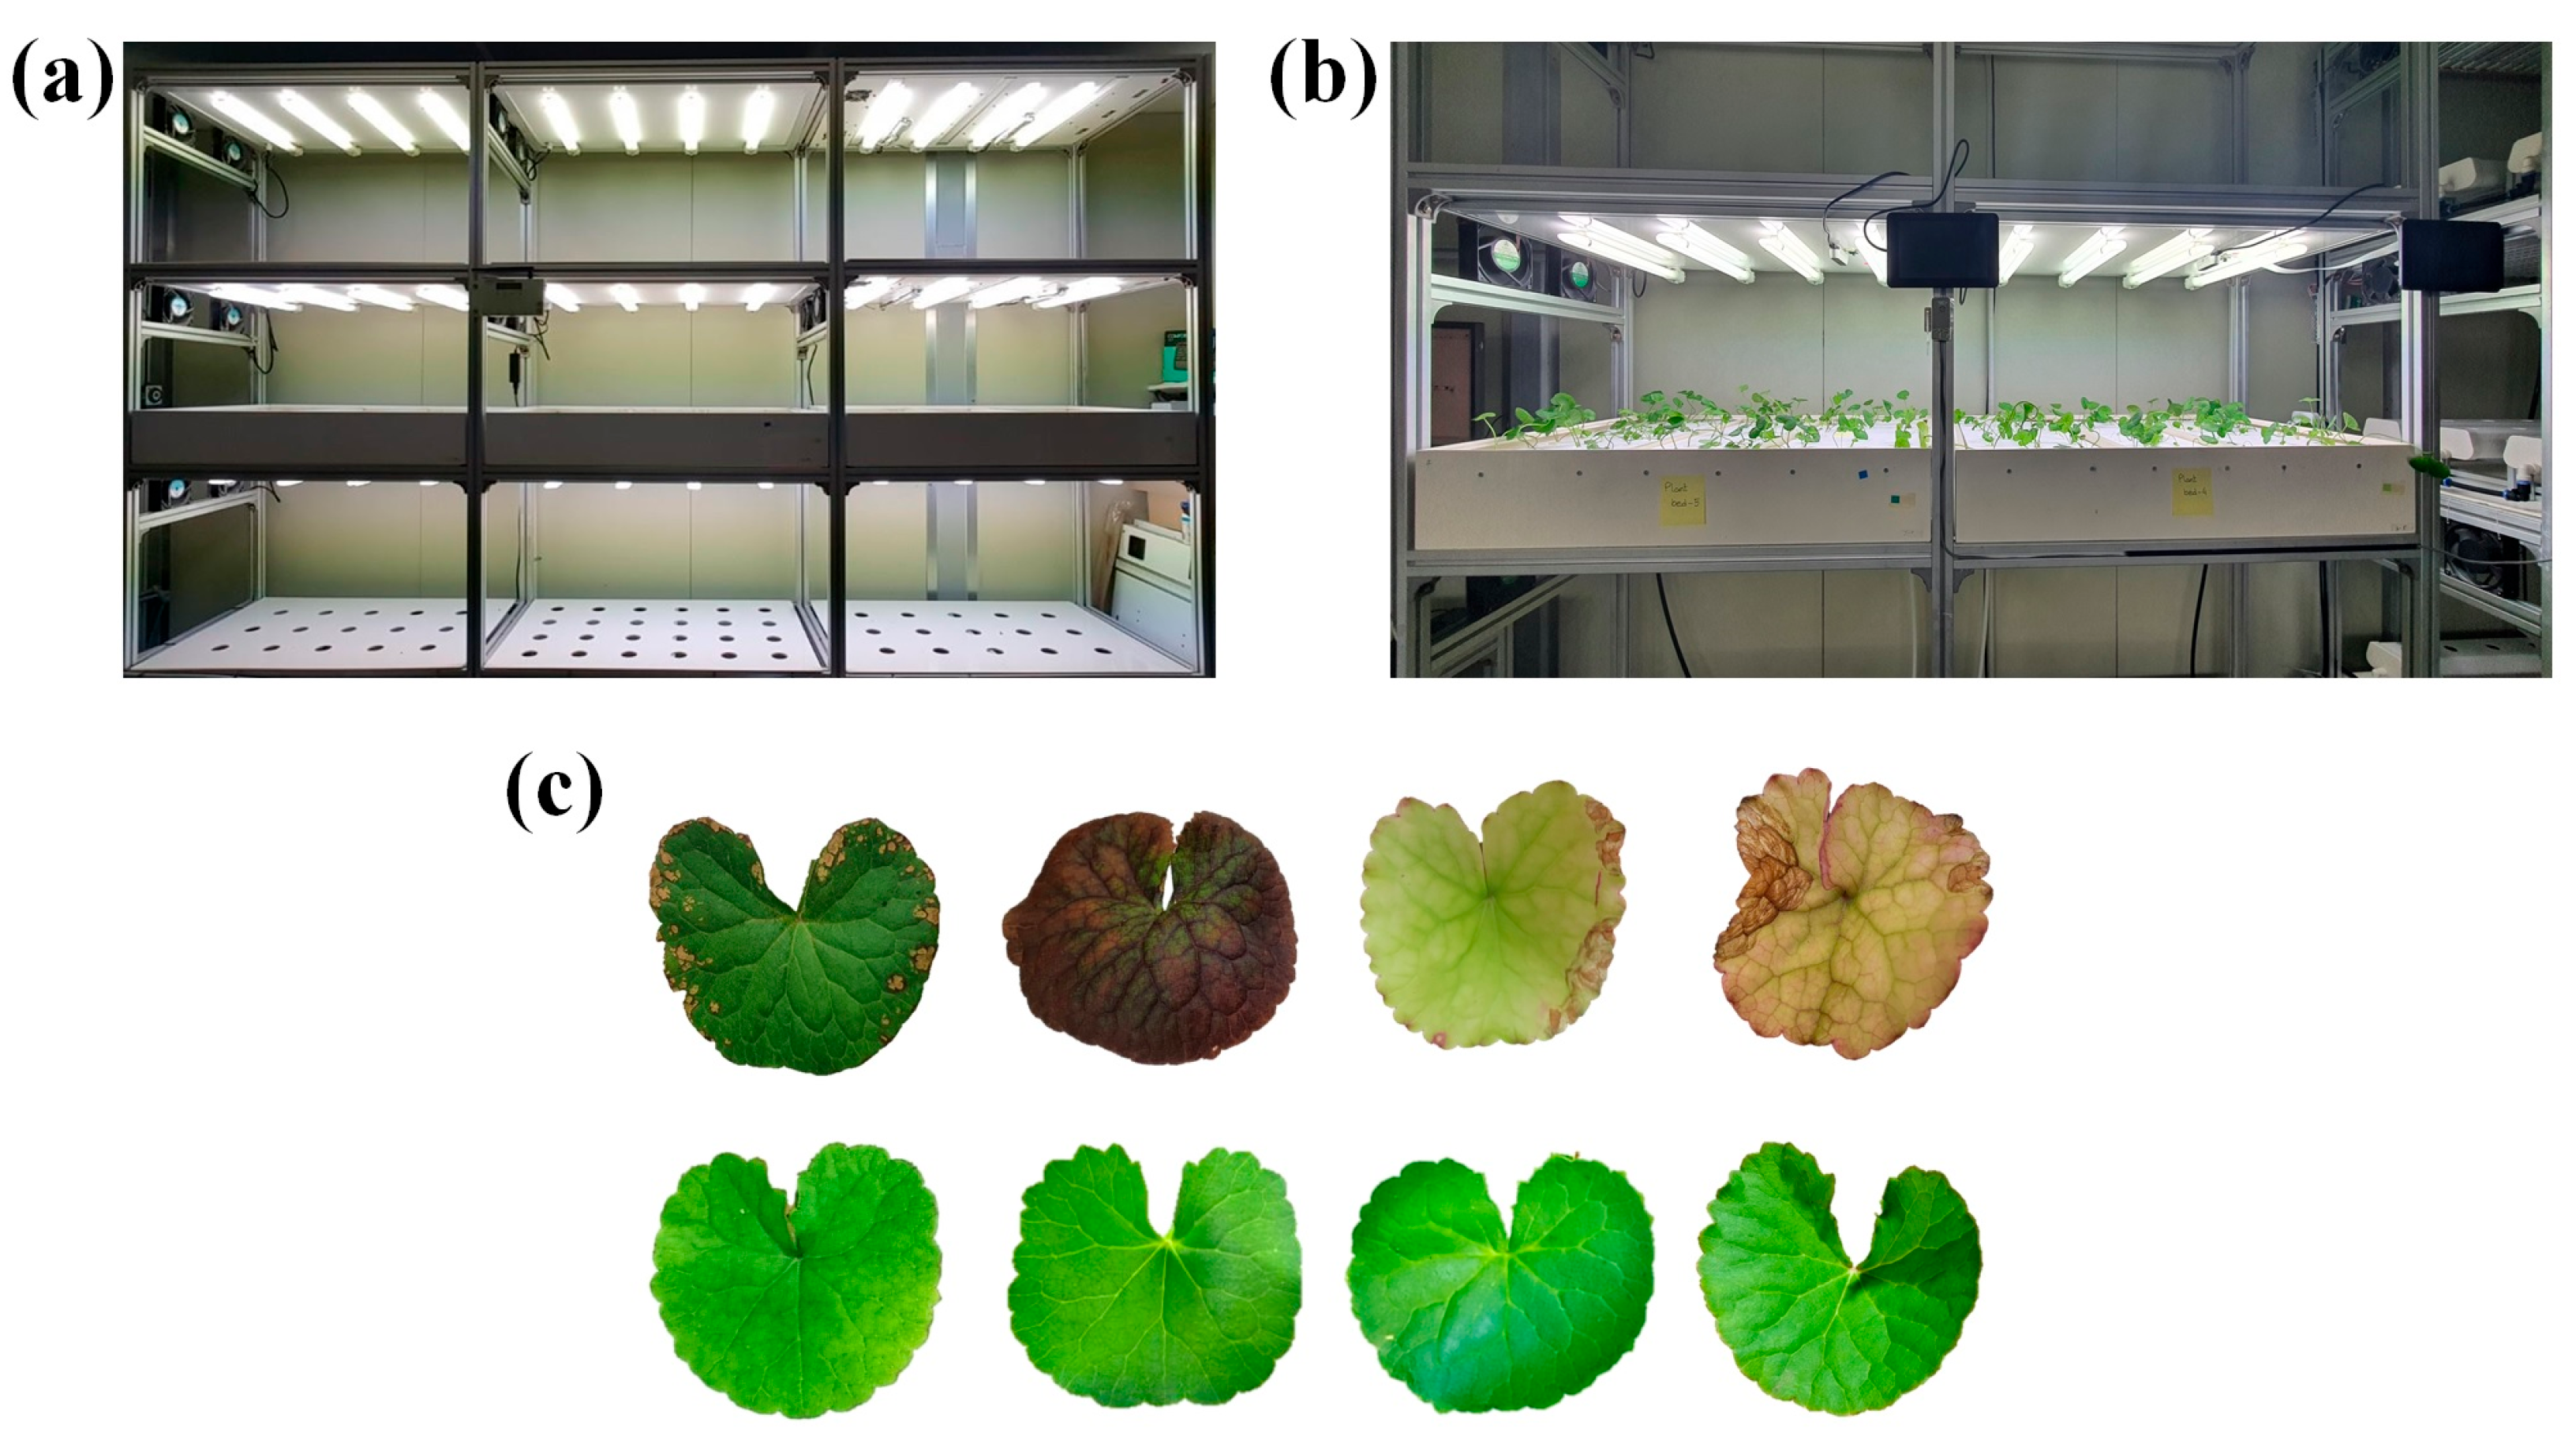
Figure 1. Experimental site and image acquisition: (a) cultivation shelf for pennywort seedling adaption with hydroponic system and ambient environment, (b) pennywort seedlings grown under fluorescent light, and (c) sample images of pennywort leaves grown in an ebb-and-flow type hydroponic system: malnourished leaves (top), healthy leaves (bottom).
Agronomy 14 02313 g001
Figure 2. Pennywort leaf annotation: (a) original image of affected pennywort plants taken during the experiment, and (b) manually masked healthy and unhealthy leaves.
Agronomy 14 02313 g002
Figure 3. Image augmentation: (a) original image, (b) horizontal flip, (c) vertical flip, (d) shift, (e) zoom, and (f) rotation.
Agronomy 14 02313 g003
Figure 4. The Mask R-CNN architecture with RPN and FPN was used in this study for detecting defective pennywort leaves.
Agronomy 14 02313 g004
Figure 5. (a) The backbone feature extraction network (modified from [31]), (b) anchor generation principle (modified from [29]), and (c) ROI Align output achieved through grid points of bilinear interpolation (modified from [30]), used in this study for detecting defective pennywort leaves.
Agronomy 14 02313 g005
Figure 6. Illustration of feature extraction through the implemented algorithm for defective pennywort leaves.
Agronomy 14 02313 g006
Figure 7. Illustration of CBAM model structure used in this study for detecting defective pennywort leaves: (a) convolutional block attention module, (b) channel attention module, and (c) spatial attention module.
Agronomy 14 02313 g007
Figure 8. Structure of the coordinate attention (CA) mechanism used in this study for detecting defective pennywort leaves.
Agronomy 14 02313 g008
Figure 9. Schematic diagrams for integrating ResNet-101 with attention mechanism modules: (a) ResNet-101+CBAM, and (b) ResNet-101+CA.
Agronomy 14 02313 g009
Figure 10. Loss and accuracy variation of the Mask-RCNN and improved Mask-RCNN models: (a) loss variation for Mask-RCNN_ResNet-101, Mask-RCNN_ResNet-101+CBAM, and Mask-RCNN_ResNet-101+CA, and (b) accuracy variation for Mask-RCNN_ResNet-101, Mask-RCNN_ResNet-101+CBAM, and Mask-RCNN_ResNet-101+CA.
Agronomy 14 02313 g010
Figure 11. Heatmap generated from the images and using the pre-trained models: (a) original image, (b) heatmap of Mask-RCNN_ResNet-101 model, (c) heatmap of Mask-RCNN_ResNet-101+CBAM, and (d) heatmap of Mask-RCNN_ResNet-101+CA model.
Agronomy 14 02313 g011
Figure 12. Output results of the defective pennywort leaf detection in the test images using: (a) an annotated image, (b) the Mask R-CNN model, (c) the improved Mask-RCNN model with CBAM, and (d) the improved Mask-RCNN model with CA.
Agronomy 14 02313 g012
Figure 13. Detection inaccuracies in test images: (a) annotated image and (b) false negative detection from the Mask RCNN model and the improved Mask RCNN models.
Agronomy 14 02313 g013
Figure 14. Visualization of defective leaf segmentation results; (a) original annotated image, (b) ground truth, (c) segmentation result of Mask-RCNN model, (d) segmentation result of improved Mask-RCNN model with CBAM, and (e) segmentation result of improved Mask-RCNN model with CA.
Agronomy 14 02313 g014
Figure 15. Precision- Recall (P-R) curve to evaluate the proposed models performance used in this study.
Agronomy 14 02313 g015
Table 1. Comparison of performances of models established by Mask-RCNN ResNet-101 and improved Mask-RCNN with the CBAM and CA attention mechanisms.
ModelmAPmAP (0.75) *Accuracy
Mask-RCNN ResNet-1010.8930.8860.887
Mask-RCNN ResNet-101+CBAM0.9180.9070.922
Mask-RCNN ResNet-101+CA0.9310.9240.937
* The mAP (0.75) refers to the mean Average Precision (AP) at an IoU threshold of 0.75.
Table 2. Comparative analysis between Mask-RCNN model with the improved Mask-RCNN model with CBAM and CA attention mechanisms.
ModelmAPAccuracy
Mask-RCNN ResNet-101--
Mask-RCNN ResNet-101+CBAM4.8%7.3%
Mask-RCNN ResNet-101+CA5.8%8.7%
Table 3. Pennywort leaf detection accuracy using the Mask R-CNN model and the improved Mask RCNN model using CBAM and CA attention mechanisms.
ModelEvaluation ParameterAverageBest-Fit
Mask-RCNN ResNet-101Precision rate0.890.92
Recall rate0.870.90
F1 score0.890.91
Mask-RCNN ResNet-101+CBAMPrecision rate0.920.93
Recall rate0.890.92
F1 score0.900.93
Mask-RCNN ResNet-101+CAPrecision rate0.940.96
Recall rate0.900.93
F1 score0.920.94
Table 4. Performance evaluation of the Mask-RCNN_ResNet-101 model with other established machine learning models.
ModelmAPAccuracy
BlendMask0.8210.813
Solo V20.8320.834
Yolo V30.8440.826
Mask-RCNN ResNet-500.8750.864
Mask-RCNN ResNet-101 (this study)0.8930.887
Mask-RCNN ResNet-101+CBAM (this study)0.9180.922
Mask-RCNN ResNet-101+CA (this study)0.9310.937
Disclaimer/Publisher’s Note: The statements, opinions and data contained in all publications are solely those of the individual author(s) and contributor(s) and not of MDPI and/or the editor(s). MDPI and/or the editor(s) disclaim responsibility for any injury to people or property resulting from any ideas, methods, instructions or products referred to in the content.