1. Introduction
Plant factories represent an advanced setup that has received a great deal of research attention in recent years due to their controlled environmental parameters [
1]. The key technology employed in a plant factory is seedling cultivation technology [
2]. The emergence of plant seedling breeding has changed the original extensive agricultural management mode and has significantly improved the efficiency of agricultural production [
3].
Light is one of the most important environmental factors during the plant growth stage [
4]. The amount of light (fluence), its type (wavelength), and its duration (photoperiod) can be changed individually or in combination to influence the traits of plants using today’s sophisticated techniques [
5]. Studies have shown that blue light (450–490 nm) results in morphological changes, producing, for instance, thick, dark green leaves with thick stems [
6], while red light (635–700 nm) results in thin, light green leaves with slender stems [
7]. Moreover, the intensity and quality of light are critical for plant growth, morphogenesis, and other physiological responses [
8,
9]. Plants growing in low-light conditions are often more susceptible to light suppression than plants growing under a high light intensity. An increase in the net photosynthetic rate (Pn) correlates with an increase in the light intensity [
10]. However, a high level of light intensity results in a decrease in the net photosynthesis rate, and low light levels may result in an increase in the specific leaf area (SLA) and plant height [
11,
12].
Traditional lighting instruments, such as metal halide lamps, high-pressure sodium lamps, and incandescent lamps, can be used as energy sources [
13]. Compared with the above lighting equipment, the use of LED devices has the advantages of facilitating environmental protection, providing a flexible and adjustable spectrum, and providing concentrated and efficient lighting, thus solving the problems related to the traditional single light’s quality, non-adjustable light intensity, and miscellaneous bands [
14]. Using LED plant factories as artificial lighting sources can lead to greater progress in agricultural development. The results of previous experiments have shown that the effects of the continuous irradiation of a pulse LED light source and an ordinary LED light source for 12 h on the growth, development, and phenotype of seedlings are roughly the same [
15].
Most existing research has focused on the effects of light on the genotype and substance content of crops such as grapes [
16], lettuce [
17], kiwifruit [
18], tomatoes [
19], and cucumber [
20]. Cucumbers have been widely used in the past four decades to study the regulating effects of light on the development and physiology of plants due to their sensitivity to the quality of light, their fast growth rate, and their importance as a food crop [
21,
22,
23,
24]. Extensive research has been undertaken to study the effects of light on cucumber seedlings. Kwack et al. studied the effects of the seedling stage and light intensity on the growth of cucumber grafted seedlings from seed to planting [
25]. Yan et al. studied the growth response of cucumber varieties to different light environments [
26]. Hwang et al. studied the effects of photoperiod, light intensity, and temperature on the seedling quality and flower truss of tomato and pepper seedlings [
27]. Zheng et al. studied the effect of the light type and light intensity on the seedling growth of tomato [
28]. Few studies have evaluated the phenotype of cucumber seedlings during different growth stages. It is necessary to study the effects of light on the phenotype of cucumber seedlings in order to select the optimal light intensity.
It is hypothesized that various light intensities have different effects on the phenotype of cucumber, and that there is an optimal light intensity that is able to provide enough light and save energy. This paper examines the effects of LED light intensities on the phenotypic parameters and health index of seedlings during different development stages. This enabled us to determine the dynamic response of the cucumber seedling phenotypes to the light intensity during different growth stages. It also determines the optimal light intensity during the three stages of cucumber seedling growth, thus providing references regarding the light required during the cultivation of cucumber seedlings.
2. Materials and Methods
2.1. Experiment Materials
The photoregulation experiment was carried out in the plant factory of the Institute of Facility Agriculture, Guangdong Academy of Agricultural Sciences, Guangzhou, Guangdong Province (113°21′22.76″ E, 23°8′56.32″ N). In this study, the cucumber variety “Jinchun No. 5” was used as the test object. An LED lamp was used as the light source in this study in order to more accurately control the light intensity and save energy. The LED lamp was composed of white, red, and blue light beads. The white light spectrum range is 380 nm~760 nm, and the peak wavelength of the white light spectrum is 660 nm, which corresponds to the second peak of the spectrogram. The peak wavelength of the blue light spectrum is 450 nm, and the peak wavelength of the red light spectrum is 625 nm.
The nutrient solution was formulated using Hoagland nutrient solution, as shown in
Table 1. Twice the concentration of the nutrient solution was used in the three stages of seedling growth, and the daily evaporation from the seedlings was calculated during the preliminary experiment. Pre-tests conducted prior to the experiment showed that the evaporation from the seedlings and matrix was about 5 g/d (gram/day, g/d) in a single pot with a diameter of 5.8 cm and a height of 5.8 cm. The whole nutrient solution was irrigated via drip irrigation, with a 10 mL drip irrigation being performed once every two days from the CF to the OBTL stage. The pH of the nutrient solution was between 5.5 and 6.5, and the EC was between 1.0 and 1.4 mS/cm.
2.2. Experimental Methods
Unbroken cucumber seeds were disinfected, soaked, and sprouted, and then planted in a single pot containing a matrix of a 3:1:1 mixture of turf, vermiculite, and perlite. The experiment was designed to track and collect the phenotypic data for each plant from 17 June 2022. This was combined with the phenotypic parameter (plant height, stem diameter, leaf area, leaf circumference, biomass, and health index) responses collected on that day and the environmental factor data collected by the sensor. The parameter measurements started at 9 a.m. in the test stage, and the test periods of the three stages were 4 days, 6 days, and 5 days, respectively.
The PPFD (photosynthetic photon flux density) is the main influencing factor in the plant factory environment and determines the growth condition of the seedlings [
29,
30]. Environmental parameters such as the indoor ambient temperature, relative humidity, nutrient solution concentration, and soil moisture were determined using the recommended parameters to avoid interference from irrelevant factors. The phenotypic parameters and seedling health index of the cucumber seedlings were measured by setting up different light intensity treatments during the different growth stages. Finally, the optimal light intensity and energy-saving decision-making scheme to be implemented across the three stages were obtained.
Based on existing research and the general rules regarding changes in the response of crops to light, the PPFD gradient was set as follows: 30 (L1), 60 (L2), 90 (L3), 120 (L4), 150 (L5), 180 (L6), and 210 (L7) µmol·m−2·s−1. These values were measured using a handheld plant lighting detector (UPRtek PG200N). The plants in the cotyledon flattening (CF), one bud and one leaf (OBOL), and one bud and two leaves (OBTL) stages that were treated with light at L1–L7 gained sufficient light strength to be regarded as the invariants for the next experiment. Considering the demand for light during seedling growth, for this experiment, we selected cucumber seedlings with a constant light PPFD of 150 µmol·m−2·s−1 in the 3 stages and an irradiation duration of 14 h/d for transplantation as the control group (CK).
2.2.1. Experimental Platform
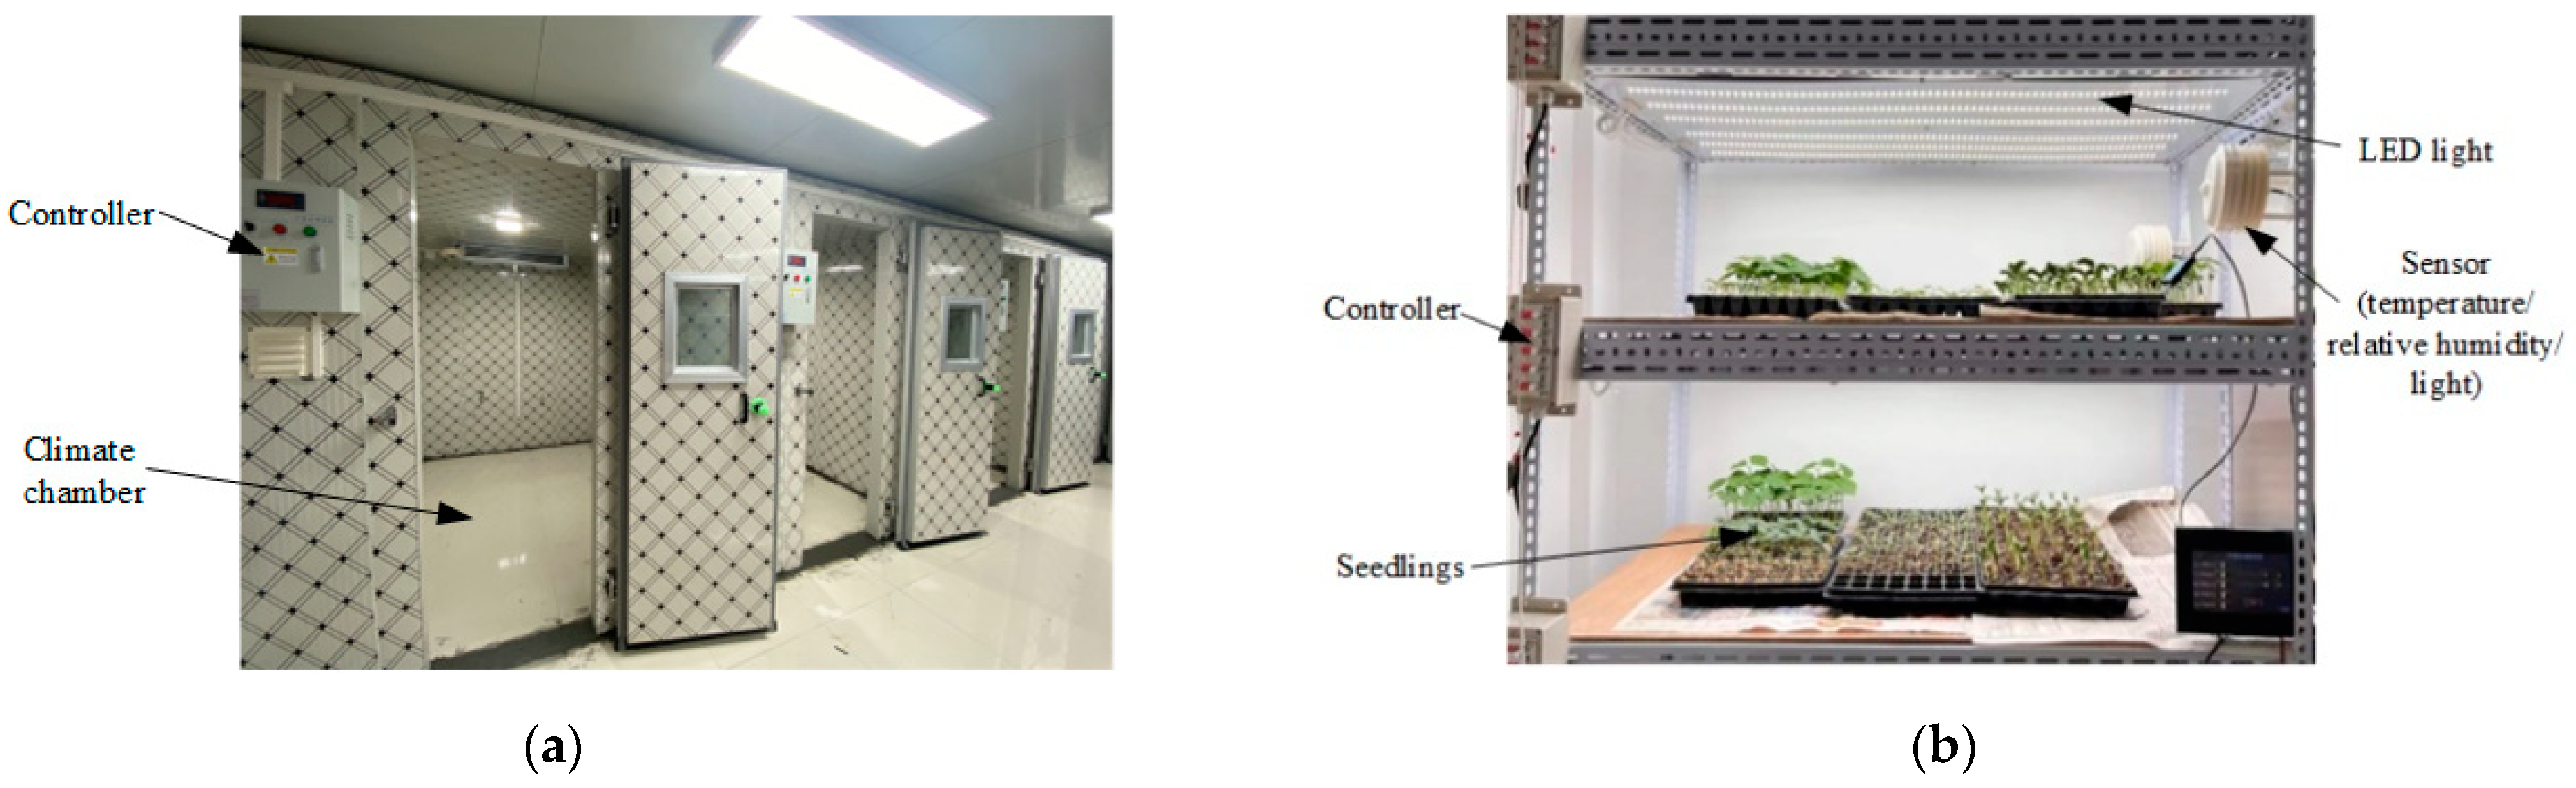
In order to prevent the surrounding environment from influencing the growth of the cucumber seedlings, the experiment was performed in an artificial climate chamber. The indoor temperature was set to 26 °C ± 0.5 °C, the humidity was set to 75% ± 5%, and the CO
2 concentration was selected as the natural indoor CO
2 concentration; this met the requirements for the normal growth of cucumber seedlings across the three stages under environmental conditions. In this experiment, a simple constant-height cultivation platform was established, and 35 cm was selected as the control height (
Figure 1).
2.2.2. Plant Parameter Measurements
Three replicates were produced for each treatment, with 10 strains being selected and numbered for each replicate to collect the growth data. The phenotypic parameters and strong seedling indicators of the samples at different growth stages were measured as follows:
The plant height was measured using Vernier calipers, which determined the length (mm) from the bowl plane to the highest growth point of the seedlings.
To determine the stem diameter, the diameter of the hypocotyl for the lower 20 mm of the cotyledon segment was marked during seedling budding; this was used as the stem diameter data (mm) for each measurement. In order to prevent irregular axis diameters from having an influence on the data, each measurement was taken for the longitudinal axis of the seedling.
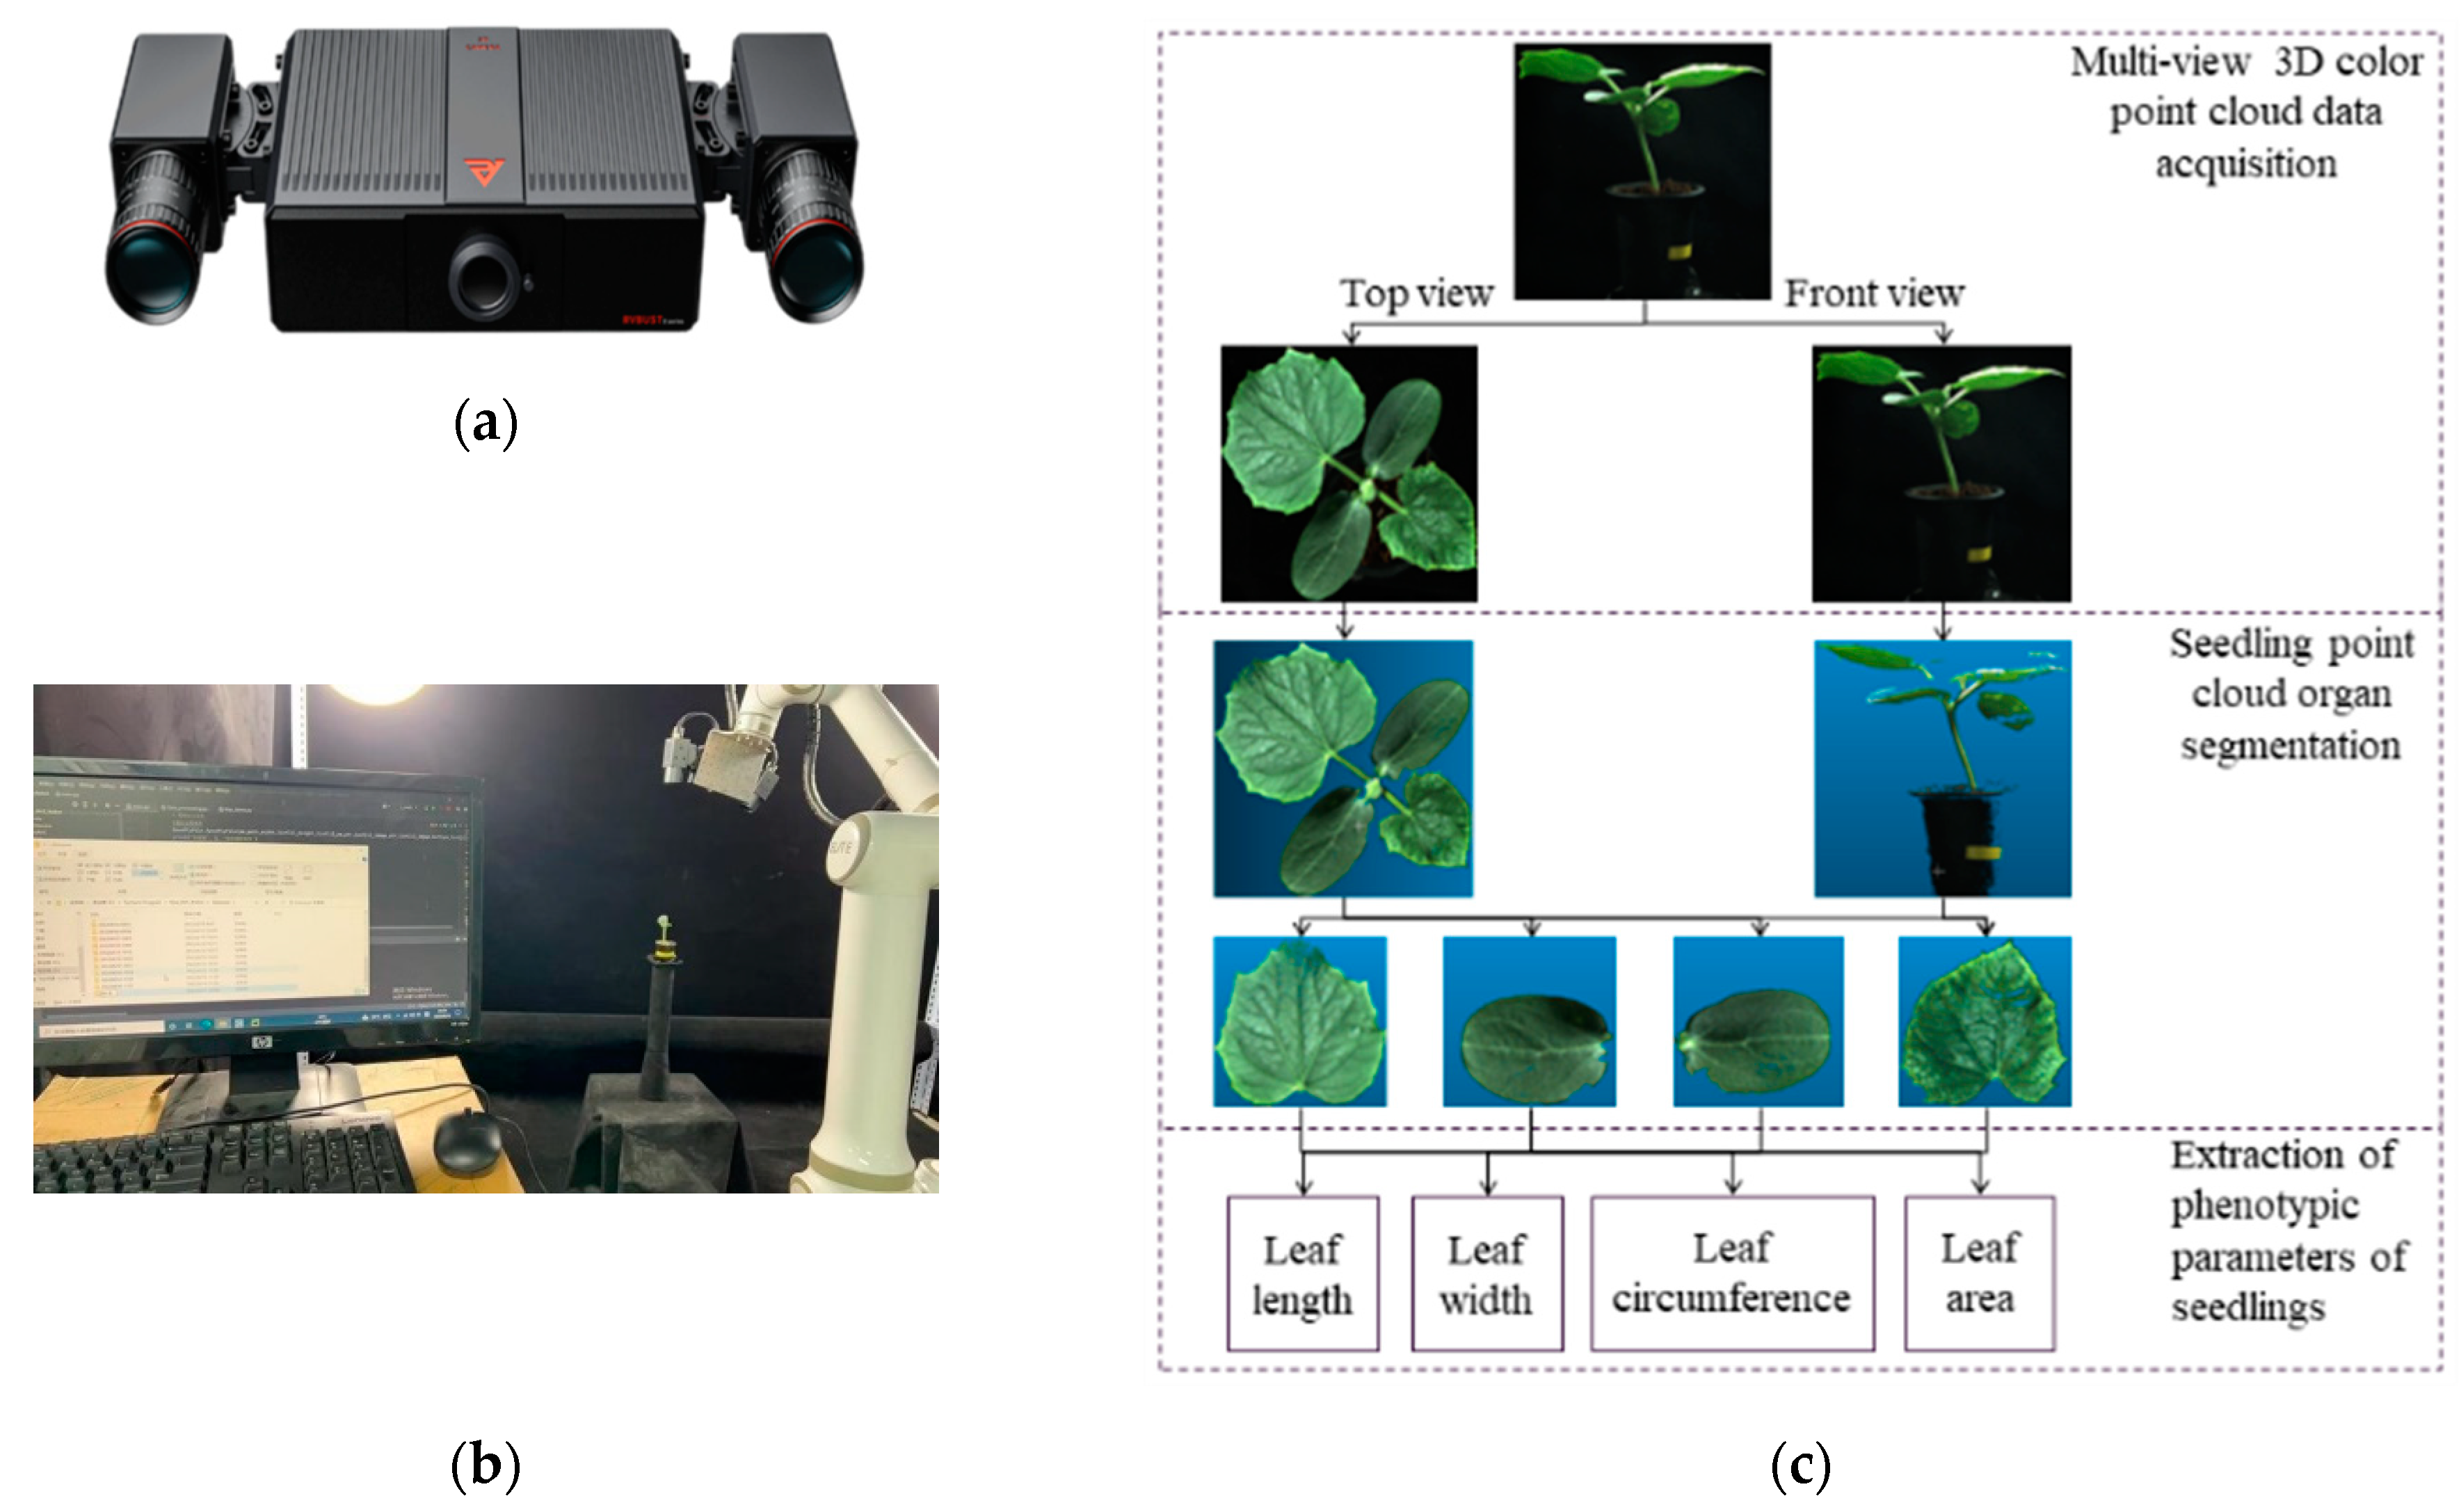
For the leaf area and leaf circumference, the dynamic three-dimensional point cloud parameters (cotyledon and true leaves) of the cucumber leaves were collected in a nondestructive manner using a structured light three-dimensional point cloud acquisition robot, which was developed by the laboratory. The leaf area and leaf circumference were obtained via the calculation of the leaf point cloud data using the Python code available in the laboratory (
Figure 2).
The fresh seedling weight and dry seedling weight of the plant seedlings, which were mainly divided into the whole seedling weight and aerial parts’ weight, were determined as follows. The fresh seedlings were cleaned and wiped, and all parts and organs were cut. The fresh seedling weight was measured using a high-precision electronic balance (1/1000), and then the seedlings were put into an oven at 105 °C for a 15 min defoliation treatment. Then, the oven was rapidly cooled to 70 °C to dry the seedlings to constant weight, and their dry matter weight was determined.
The health index (
HI) includes the fresh seedling weight and dry seedling weight; this is an important index used to assess the health of seedlings. The specific calculation formula is as follows:
where
SD is the stem diameter, mm;
PH is the plant height, mm;
FRW is the fresh root weight, g;
RUFW is the fresh aerial parts’ weight, g; and
FPW is the fresh plant weight, g. Similarly,
where
DRW is the dry root weight, g;
RUDW is the dry aerial parts’ weight, g; and
DPW is the dry plant weight, g.
2.3. Statistical Analyses
Microsoft Excel 2021 was used to process the data and draw charts. SPSS 17 software was used to conduct a single-factor analysis of the test data. The LSD method was used to analyze the significance (p < 0.05).
3. Results
3.1. Effects of Light Intensity on Plant Height and Stem Diameter
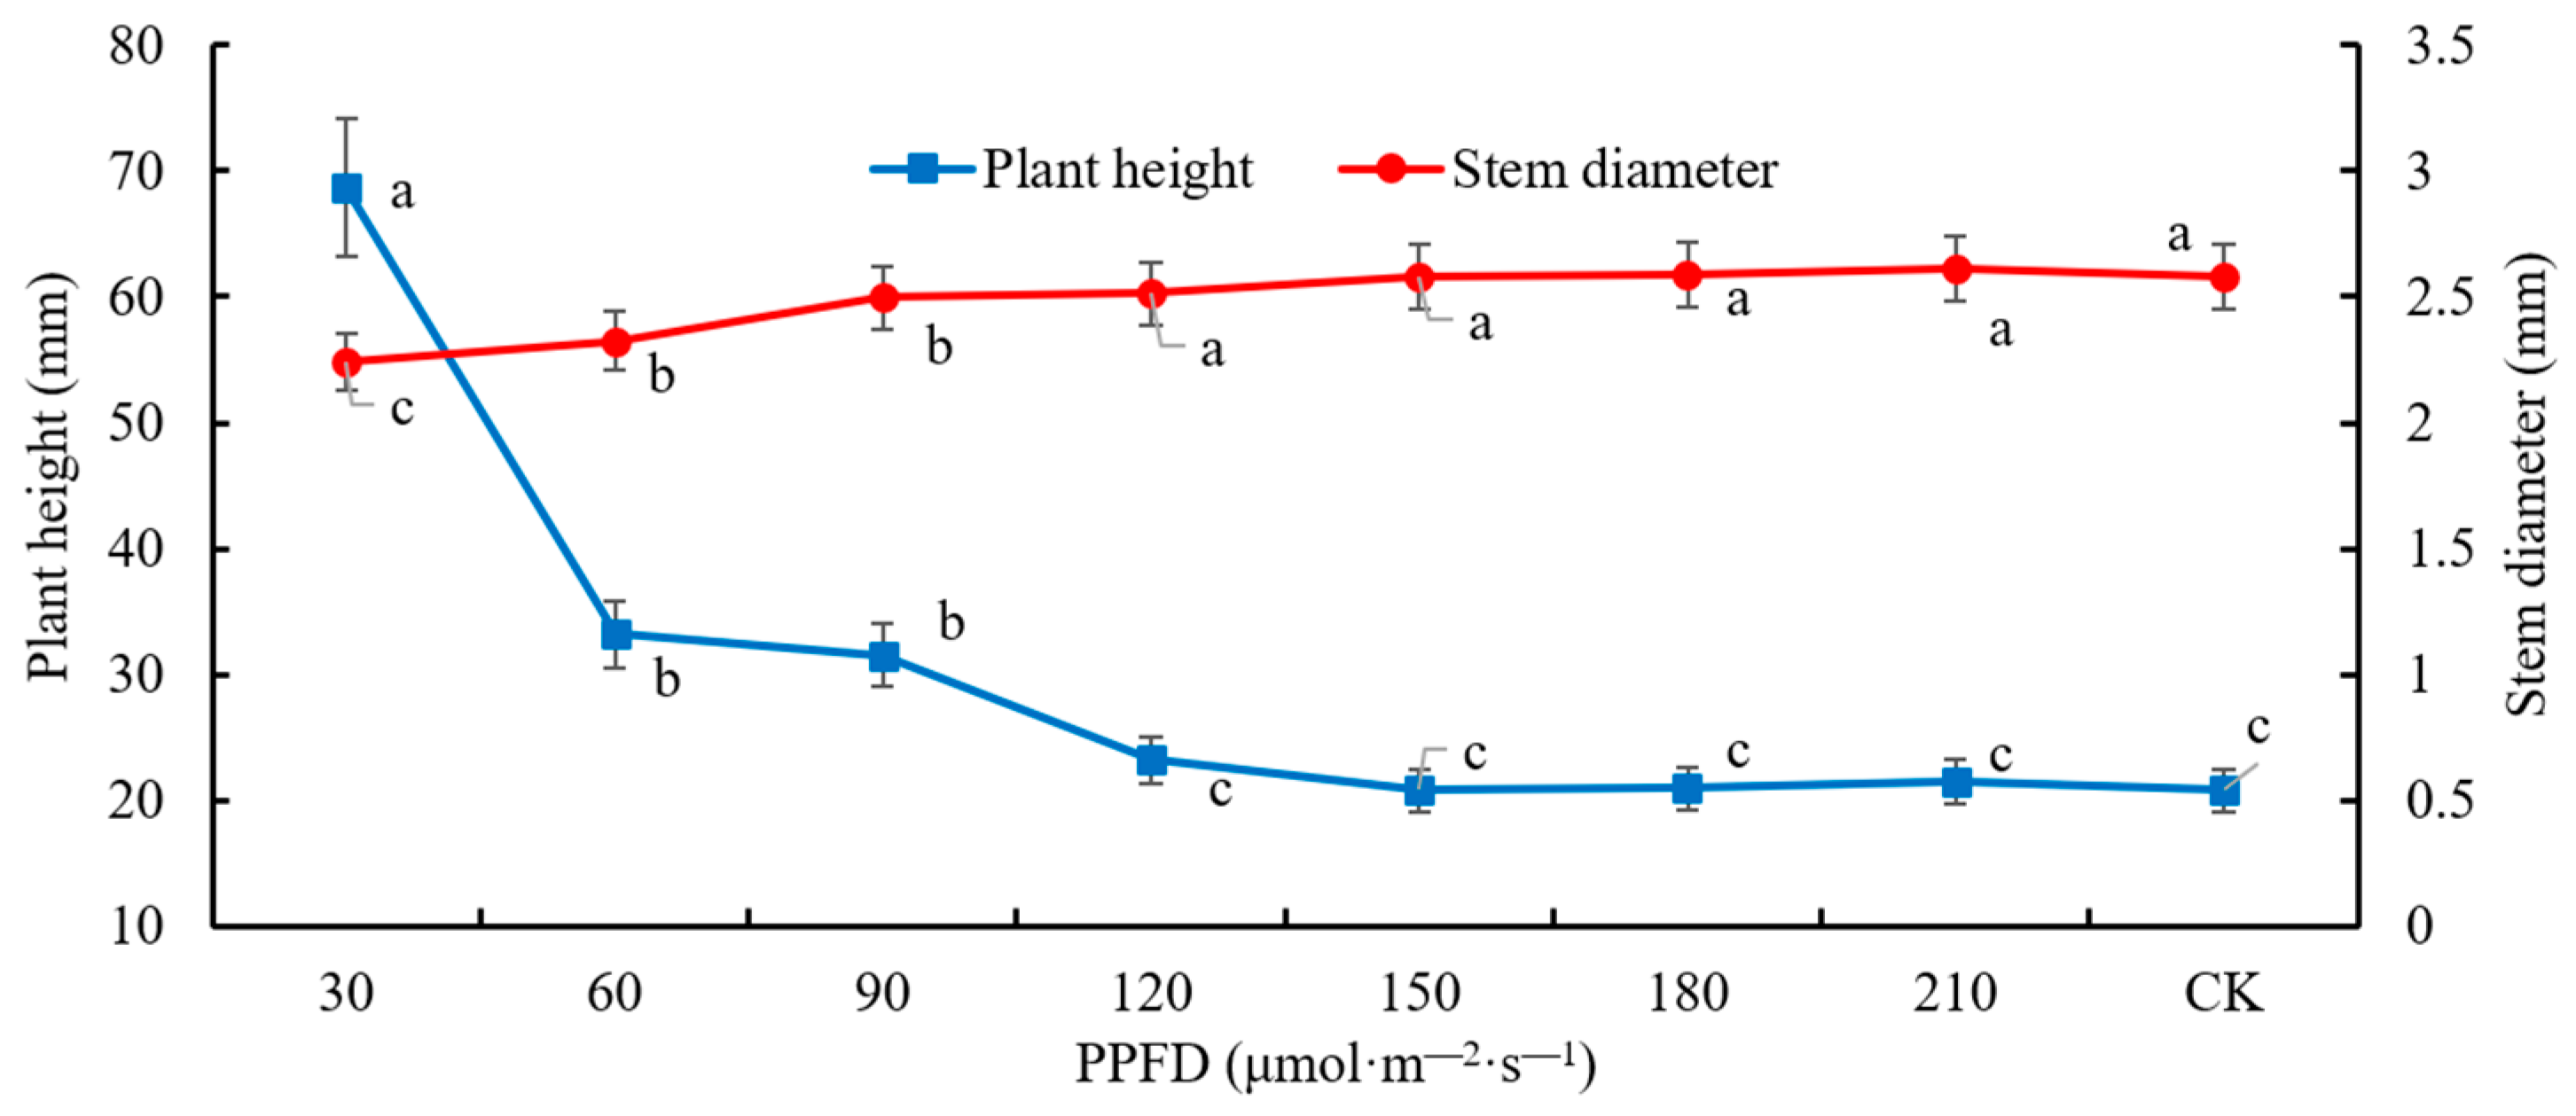
The effects of different light intensity treatments on the plant height and stem diameter of the cucumber seedlings were observed when the cotyledon flattening (CF) stage was reached 7 d after seeding. The CK treatment (150 µmol·m−2·s−1) during the cotyledon flattening (CF) stage was the same as the L5 treatment, so the L5 treatment was adopted as the CK treatment during this stage.
Figure 3 shows the effects of the light intensity on the plant height and stem diameter of the cucumber seedlings at the cotyledon flattening (CF) stage. The figure shows that the plant height for each treatment tended to decrease as the light intensity increased to 150 µmol·m
−2·s
−1. A significant difference in the plant height under different light intensity treatments was observed (
p < 0.05). The L1, L2, and L3 treatments exhibited significant differences compared with the CK treatments; the L1 treatment showed the most significant difference, with an average plant height of 68.71 mm, which was 230% higher than that of the CK treatment. There was no significant difference between the L4, L6, and L7 treatments and the CK treatment.
The stem diameter produced by each treatment tended to increase with an increase in the light intensity in the cotyledon flattening (CF) stage, and there was a significant difference under different light treatments (
Figure 3). The size relationship was L7 > L6 > L5 = CK > L4 > L3 > L2 > L1; the stem diameter of the L7 treatment was the largest, with an average value of 2.61 mm. There was no significant difference between the CK treatment and the L4, L6, and L7 treatments, but there was a significant difference between the CK treatment and the L1, L2, and L3 treatments. The stem diameter for the CK treatment increased by 15% compared with that for L1 and decreased by 1% compared with that for L7.
The cucumber seedlings reached unity in the one bud and one leaf (OBOL) stage at 12 days after planting. The germination stage lasted 13 days; when no light supplement was given, the period between the budding and cotyledon flattening (CF) stages lasted 7 days. At this time, the selected light intensity treatment was based on the light response “turning point” of 120 µmol·m−2·s−1 in the cotyledon flattening (CF) stage, which was used as the control variable. The nondestructive collection of data regarding the seedling leaf area began on the seventh day and stopped during the one bud and one leaf (OBOL) stage; this was when the CK control group was treated with 150 µmol·m−2·s−1 of constant light from germination until the one bud and one leaf (OBOL) stage was reached.
Figure 4 shows the changes in the plant height and stem diameter of the cucumber seedlings under different light treatments in the one bud and one leaf (OBOL) stage. As shown in the figure, the different light intensity treatments had little effect on the plant height in the one bud and one leaf (OBOL) stage.
Under the different light intensity treatments applied during the one bud and one leaf (OBOL) stage, the stem diameter tended to increase with an increase in the light intensity (
Figure 4). This was consistent with the trend observed in the stem diameter under different light intensity treatments applied during the cotyledon flattening (CF) stage. The maximum stem diameter appeared under the L7 treatment, with an average value of 3.19 mm. There was no significant difference between the L5 and L6 treatments and the CK treatment, but the other treatment groups showed significant differences when compared with the CK treatment. The CK treatment resulted in increases of 25% compared with L1, 3% compared with L5, 5% compared with L7, and 1% compared with L6.
Figure 5 shows the changes in the plant height and stem diameter of the cucumber seedlings under the light treatments applied from the one bud and one leaf (OBOL) stage to the one bud and two leaves (OBTL) stage. The plant height of the cucumber seedlings increased first and then decreased with the increase in the light intensity. The maximum value was detected for plants under the L6 light intensity treatment, and the minimum value was found for the L1 light intensity treatment. The order of the plant height observed for all treatments, from largest to smallest, was L6 > L5 > CK > L7 > L4 > L3 > L2 > L1, and there was no significant difference between the groups.
The change in the stem diameter was the same as that for the plant height during the at one bud and one leaf (OBOL) stage. The stem diameter of the cucumber seedlings increased first and then decreased as the light intensity increased. The order of the stem diameter, from largest to smallest, was L6 > L5 > CK > L7 > L4 > L3 > L2 > L1. The maximum value was obtained when the L6 treatment was applied, and the minimum value was obtained when the L1 treatment was applied. There was no difference between the L2, L3, L4, L5, L7, and CK treatments.
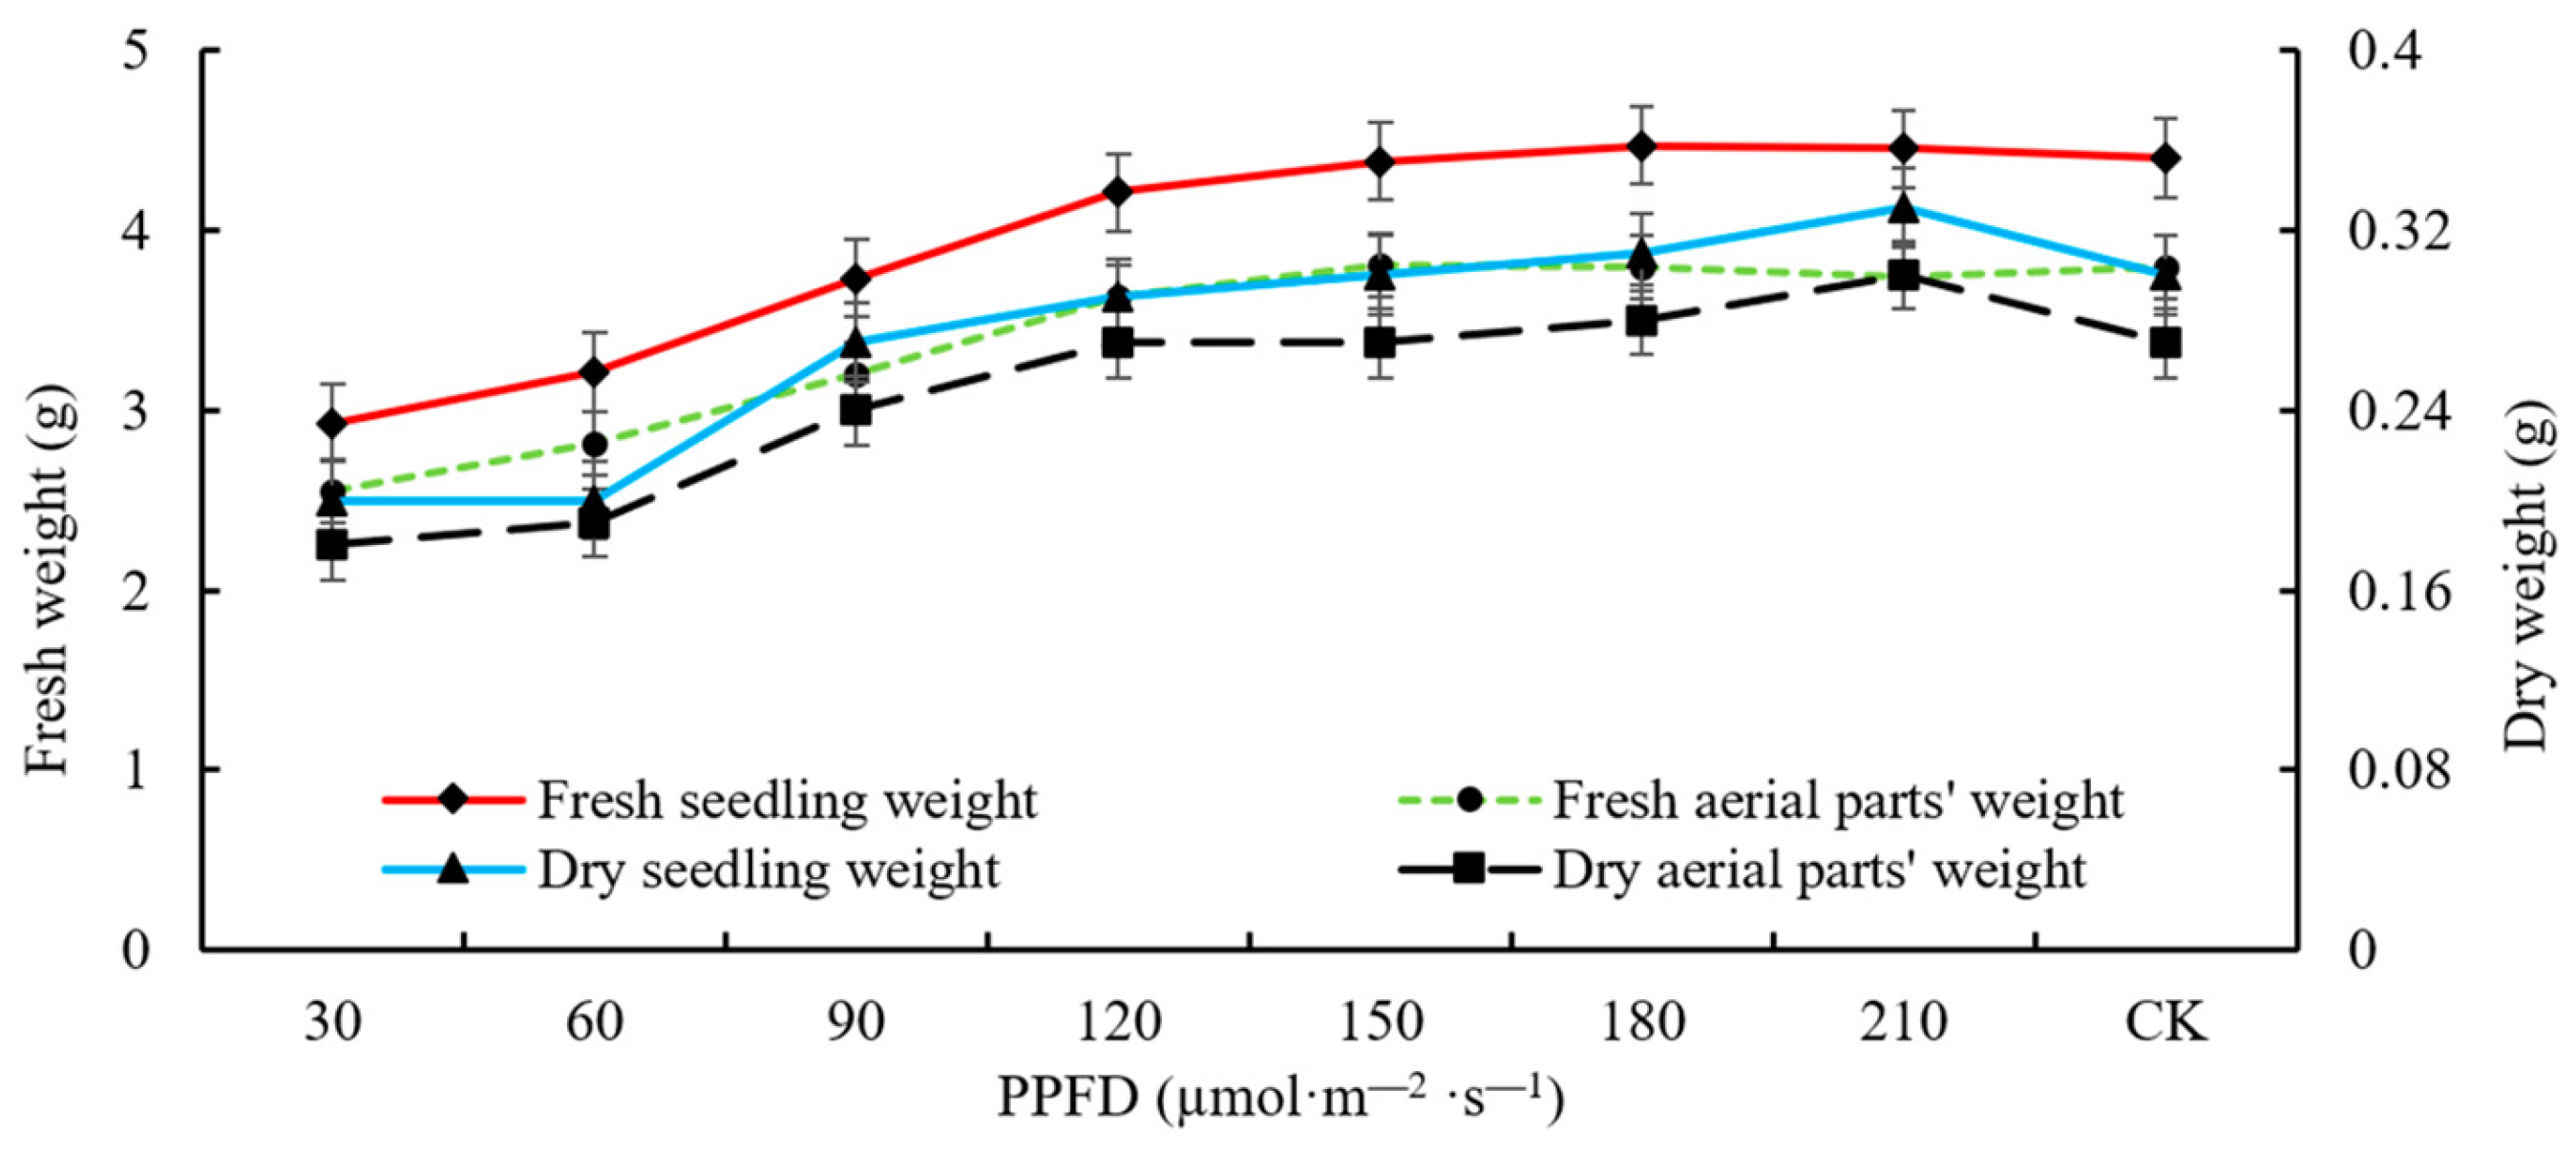
3.2. Effects of Light Intensity on the Biomass of Cucumbers
The balance between the accumulation of biomass and nutrient compounds is related to the ratio of red and blue light [
31].
Figure 6 shows the effects of light intensities on the biomass of the cucumbers in the cotyledon flattening (CF) stage. The biomass of the cucumber seedlings increased with an increase in the light intensity (
Figure 6). The fresh seedling weight, dry seedling weight, fresh aerial parts’ weight, and dry aerial parts’ weight reached the maximum value when the L7 treatment was applied, and the parameters of L7 were significantly different from those in the other treatment groups. Under the L7 treatment, the fresh seedling weight, dry seedling weight, fresh aerial parts’ weight, and dry aerial parts’ weight were significantly increased by 43%, 97%, 36%, and 122%, respectively, compared with the L1 treatment. Compared with the L5 treatment, the values increased by 17%, 25%, 15%, and 22%, respectively. The results show that the accumulation of biomass in the cucumber seedlings was promoted when the light intensity did not increase in a certain range.
Figure 7 shows the effects of different light intensities on the biomass of the cucumbers during the OBOL stage. The fresh seedling weight, dry seedling weight, fresh aerial parts’ weight, and dry aerial parts’ weight tended to increase with an increase in the light intensity (
Figure 7). When the light intensity was 210 µmol·m
−2·s
−1 (L7), the fresh seedling weight, dry seedling weight, fresh aerial parts’ weight, and dry aerial parts’ weight reached their maximum values, which were 3.30 g, 0.23 g, 2.67 g, and 0.20 g, respectively. Compared with those for the CK treatment, these values were significantly increased by 15%, 10%, 13%, and 11%, respectively. Increasing the light intensity within a certain range was conducive to the accumulation of seedling biomass.
Figure 8 shows the effects of different light intensities on the biomass of cucumbers during the one bud and two leaves (OBTL) stage. It can be seen that the biomass of the cucumber seedlings increased with an increase in the light intensity. The minimum values for the fresh seedling weight, dry seedling weight, fresh aerial parts’ weight, and dry aerial parts’ weight of the cucumber seedlings under the seven treatments were found when the L1 treatment was applied, and their maximum values were found when the L6 and L7 treatments were applied. There were significant differences in the biomass of the cucumber seedlings under the L1, L2, and L3 treatments compared with the CK group, while there were no significant differences in the biomass of the cucumber seedlings under the L4–L7 treatments compared with CK. However, L4–L7 were more conducive to the accumulation of cucumber seedling biomass than the L1–L3 light treatments. Considering the research objective of this experiment, the light intensity applied during the L4 treatment was able to ensure the robust growth of seedlings, thus improving the efficient utilization of light energy and reducing the cost of seedlings.
3.3. Effects of Light Intensity on Leaf Parameters
Figure 9 depicts the variations in the leaf area and leaf circumference during the cotyledon flattening (CF) stage. It is evident that these parameters tended to increase with an increase in the light intensity, and they also show certain nonlinear characteristics. The seedlings in the budding stage, which was from day 8 to day 11, were highly sensitive to the light intensity, and a reasonable light intensity at this time was able to accelerate the development of the leaf area and leaf circumference. However, a high light intensity had no significant beneficial effects on the growth and development of the seedlings. An increase in the light intensity resulted in a significant difference in the leaf area and leaf circumference of the cotyledon when treatments L1 to L4 were applied. However, there was no significant difference in the leaf area and leaf circumference of the cotyledon when the light intensity increased under treatments L4 to L7. Compared with the CK group, when the L4 treatment was applied, the leaf area decreased by 2% and the leaf circumference decreased by 1%.
Figure 10 shows the variations in the leaf area and leaf circumference during the one bud and one leaf (OBOL) stage. Before day 12, the same 120 µmol·m
−2·s
−1 light intensity treatment was used. The cucumber seedlings were in the first-true-leaf germination stage from day 12 to 17. The leaf area also gradually increased during this time (
Figure 10a). In the early stages, the first-true-leaf expansion rate is affected by the light intensity. When the irradiation time remains the same, the true leaf area increases with an increase in the light intensity. The leaf area values that were obtained under treatments L1 to L7 and the CK treatment, as well as the average leaf area at the end of the one bud and one leaf (OBOL) stage, were 30.33 cm
2, 36.92 cm
2, 44.24 cm
2, 48.00 cm
2, 55.37 cm
2, 57.68 cm
2, 60.67 cm
2, 56.07 cm
2, and 48.66 cm
2, respectively.
The leaf circumference values obtained under treatments L1 to L7 and the CK treatment (
Figure 10b), as well as the average leaf circumference at the end of the one bud and one leaf (OBOL) stage, were 24.23 cm, 27.58 cm, 31.73 cm, 33.56 cm, 37.12 cm, 38.51 cm, 39.71 cm, 37.74 cm, and 33.77 cm, respectively. The leaf area and leaf circumference increased with an increase in the light intensity and reached their maximum value at 210 µmol·m
−2·s
−1, representing increases of 8% and 5% compared with the CK treatment, respectively. There was no significant difference between CK and treatments L5 and L6 in terms of the area and circumference of the leaves. The results indicated that the combinations of light intensities applied during the cotyledon flattening (CF) stage and the one bud and one leaf (OBOL) stage, namely, treatments of 150 + 150 µmol·m
−2·s
−1, 120 + 150 µmol·m
−2·s
−1, and 120 + 180 µmol·m
−2·s
−1, had a similar effect on the leaf area and leaf circumference.
Figure 11 shows the variations in the leaf area and leaf circumference during the one bud and two leaves (OBTL) stage. The leaf area and leaf circumference of the cucumber seedlings during the one bud and one leaf (OBOL) stage were approximately the same when the same treatment was applied (
Figure 11). In addition, the data obtained at this time were approximately the same as those obtained for the CK control group. The leaf area was ordered from largest to smallest as follows: L6 > L5 > CK > L7 > L4 > L3 > L2 > L1. The leaf area of the L1, L2, L3, and L4 treatments was significantly lower than that of the other treatment groups, which may be due to the insufficient uptake of light energy during the growth of the seedlings; this results in an increased likelihood of infections caused by pest stress, a reduction in all hormones, accelerated water evaporation, and the leaves beginning to curl. The maximum values for the leaf area and leaf circumference appeared in the L5 and L6 treatment groups; these values were 63.91 cm
2 and 51.54 cm, respectively. There was no significant difference between the CK treatment group and the other treatment groups, except for the L1 treatment. In other words, the six light intensity treatments of L2–L7 were able to increase the leaf area and leaf circumference of the cucumber seedlings, but their effect was weak.
3.4. Effects of Light Intensity on HI
Figure 12 shows the effects of various light intensities on the
HI during the one bud and two leaves (OBTL) stage. The
HIDry of the three developmental stages increased with an increase in the light intensity. The highest values appeared in the L7 (210 µmol·m
−2·s
−1) treatment, for which the
HI values in the three stages were 0.0239, 0.054, and 0.051, respectively (
Figure 12a). According to the trends observed in the data, the parameter that changed the most for the 120 µmol·m
−2·s
−1, 150 µmol·m
−2·s
−1, and 120 µmol·m
−2·s
−1 treatments was the light response. On this basis, this parameter’s influence decreased as the light intensity continued to increase, and the curve gradually flattened out, except in the one bud and one leaf (OBOL) stage. According to the linear characteristics of the curve, the dry health index of the cucumber seedlings during the three stages produced a “turning point” in the light response curve; this was near the light intensities of 120 µmol·m
−2·s
−1, 150 µmol·m
−2·s
−1, and 120 µmol·m
−2·s
−1, respectively. Under these light intensities, the seedlings jumped from the rapid growth stage to the stable stage, and they gradually approached the light saturation point.
Figure 12b shows the effects of various light intensities on the
HIFresh. As the light intensity increased, the fresh health index increased. The highest value appeared when the L7 (210 µmol·m
−2·s
−1) treatment was applied; the
HI values in the three stages were 0.1334, 0.88, and 0.91, respectively. According to the linear characteristics of the curve, the fresh and dry health index values of the cucumber seedlings during the three stages produced a “turning point” in the light response curve; this was near the light intensities of 120 µmol·m
−2·s
−1, 150 µmol·m
−2·s
−1, and 120 µmol·m
−2·s
−1, respectively. Under these light intensities, the seedlings jumped from the rapid growth stage to the stable stage, and they gradually approached the light saturation point.
4. Discussion
It is impossible to use a single fixed target value to control the demand for light during crop growth due to the various light intensities required by seedlings during the different stages of growth [
32]. A low light intensity weakens the photosynthetic effect of the plant height and stem diameter between the seed budding and cotyledon flattening (CF) stages (
Figure 3); the plant height and stem diameter of the seedlings gradually reach a saturation state as the light intensity increases [
33,
34].
When cucumber seedlings are exposed to weak light during the early stages of growth (
Figure 4), an adaptive response is generated in order to achieve increased photosynthesis, and the growth height increases to maximize the available light energy. However, the efficiency of photosynthesis can be affected when cucumber seedlings grow to a certain height. Therefore, when cucumber seedlings reach a certain height under a weak light intensity, the seedlings adjust their growth strategies and start to reduce their growth height to increase their leaf area and improve their photosynthetic efficiency [
35,
36].
When cucumber seedlings grow to a certain height and are placed in a low-light environment, their internal physiological environment begins to adjust the plant’s growth strategy and supply other organs by reducing the height to which the plant will grow [
37]. As the light intensity increases, the quantity of chlorophyll and the photosynthetic capacity of the seedlings are enhanced, and the stem diameter is increased (
Figure 3,
Figure 4 and
Figure 5). However, when the light intensity exceeds the light saturation point, the photosynthesis of some of the seedlings’ organs is supersaturated, which results in the inhibition of growth; this is a phenomenon commonly known as light inhibition [
38].
With the growth of the seedlings, the growth rate of the true leaf area gradually increases, which may be because the seedlings need to expend a significant amount of energy in the initial stage to establish roots and growth points; after the formation of the growth points, they can devote more energy to the growth of true leaves and to photosynthesis. Many studies have shown that enhancing a certain light can increase the leaf area [
39].
The light intensity of 150 µmol·m
−2·s
−1 was selected as the light intensity regulation scheme applied from the cotyledon flattening (CF) stage to the one bud and one leaf (OBOL) stage; this met the control basis for energy savings compared with the CK treatment (
Figure 12). The turning point of the light response of the one bud and two leaves (OBTL) stage appeared at 120, and the light intensity combination of the one bud and two leaves (OBTL) stage at 120 + 150 + 120 (L4) and 150 + 150 + 150 (CK) exhibited no significant differences between each phenotype and the seedling strength index. Therefore, the light intensity of 120 µmol·m
−2·s
−1 was selected as the energy-saving control strategy for the cucumber seedlings during the period between the OBOL stage and the one bud and two leaves (OBTL) stage; the results were similar to those obtained in An’s research [
40].
5. Conclusions
The effects of light intensities on the phenotypic parameters and health index of cucumber seedlings at three developmental stages were examined in order to determine the dynamic response of the cucumber seedling phenotypes and to obtain the light intensity demand scheme. The results showed the following:
In the cotyledon flattening (CF) stage, the height of the L1-treated plants was the highest at 68.71 mm. The L7 treatment resulted in the largest stem diameter, the highest biomass, the largest leaf area, and the largest leaf circumference, with values of 3.19 mm, 0.85 g, 16.11 cm2, and 17.96 cm, respectively.
In the one bud and one leaf (OBOL) stage, the plant height in the L1 treatment was the highest at 47.61 mm. The L7 treatment resulted in the largest stem diameter, the highest biomass, the largest leaf area, and the largest leaf circumference, which were 2.61 mm, 3.3 g, 60.67 cm2, and 39.71 cm, respectively.
In the one bud and two leaves (OBTL) stage, the plant height, stem diameter, leaf circumference, and biomass in the L6 treatment were the highest at 68.37 mm, 3.09 mm, 51.54 cm, and 4.47 g, respectively. L5 resulted in the largest leaf area of 63.91 cm2. The seedling index of the three stages showed an inflection point at the L4 level.
It can be concluded that the light intensities required by cucumber seedlings during the three stages from the cotyledon flattening (CF) stage to the one bud and two leaves (OBTL) stage are 120 µmol·m−2·s−1, 150 µmol·m−2·s−1, and 120 µmol·m−2·s−1, respectively.
Author Contributions
Conceptualization, B.L. and X.W.; Data curation, X.C.; Formal analysis, X.Z. and F.Y.; Funding acquisition, H.L.; Investigation, F.Y. and J.Z.; Methodology, B.L. and J.Z.; Project administration, X.Z.; Software, X.C.; Supervision, H.L.; Validation, X.C.; Visualization, X.W.; Writing—original draft, X.W.; Writing—review and editing, B.L. All authors have read and agreed to the published version of the manuscript.
Funding
The Project of Collaborative Innovation Center of GDAAS (XTXM202201); Guangdong Province Key Areas R&D Plan Project (2023B0202110001); Guangzhou Science and Technology Plan Project (2023A04J0830); Innovation Fund Project of Guangdong Academy of Agricultural Sciences (202202).
Data Availability Statement
Data are contained within the article.
Conflicts of Interest
We confirm that the manuscript has been read and approved by all named authors and that there are no other persons who satisfied the criteria for authorship but are not listed. We further confirm that the manuscript has been approved by all authors.
References
- Hendrawan, Y.; Riza, D.F.A.; Murase, H. Applications of Intelligent Machine Vision in Plant Factory. IFAC-Pap. 2014, 47, 8122–8127. [Google Scholar] [CrossRef]
- Kameoka, T.; Hashimoto, A. Assessment from Food Science. In Plant Factory Using Artificial Light; Elsevier: Amsterdam, The Netherlands, 2019. [Google Scholar] [CrossRef]
- Kwon, S.; Ryu, S.; Lim, J. Design and implementation of an integrated management system in a plant factory to save energy. Clust. Comput. 2014, 17, 727–740. [Google Scholar] [CrossRef]
- Fukuda, N.; Fujita, M.; Ohta, Y.; Sase, S.; Nishimura, S.; Ezura, H. Directional Blue Light Irradiation Triggers Epidermal Cell Elongation of Abaxial Side Resulting in Inhibition of Leaf Epinasty in Geranium under Red Light Condition. Sci. Hortic. 2007, 115, 176–182. [Google Scholar] [CrossRef]
- Mansoori, M.; Wu, B.S.; Addo, P.W.; MacPherson, S.; Lefsrud, M. Growth Responses of Tomato Plants to Different Wavelength Ratios of Amber, Red, and Blue Light. Sci. Hortic. 2023, 322, 112459. [Google Scholar] [CrossRef]
- Liu, X. Regulation of the Growth and Photosynthesis of Cherry Tomato Seedlings by Different Light Irradiations of Light Emitting Diodes (LED). Afr. J. Biotechnol. 2012, 11, 6169–6177. [Google Scholar] [CrossRef]
- Wollaeger, H.M.; Runkle, E.S. Growth and Acclimation of Impatiens, Salvia, Petunia, and Tomato Seedlings to Blue and Red Light. HortScience 2015, 50, 522–529. [Google Scholar] [CrossRef]
- Li, Q.; Kubota, C. Effects of Supplemental Light Quality on Growth and Phytochemicals of Baby Leaf Lettuce. Environ. Exp. Bot. 2009, 67, 59–64. [Google Scholar] [CrossRef]
- Li, T.; Liu, H.; Zhou, F. Effects of Light Intensity and Photoperiod on the Fresh Locking and Quality of Hydroponic Arugula in the Harvesting Period. Agronomy 2023, 13, 1667. [Google Scholar] [CrossRef]
- Fan, X.X.; Xu, Z.G.; Liu, X.Y.; Tang, C.M.; Wang, L.W.; Han, X.l. Effects of Light Intensity on the Growth and Leaf Development of Young Tomato Plants Grown under a Combination of Red and Blue Light. Sci. Hortic. 2013, 153, 50–55. [Google Scholar] [CrossRef]
- Bowes, G.; Ogren, W.L.; Hageman, R.H. Light Saturation, Photosynthesis Rate, RuDP Carboxylase Activity, and Specific Leaf Weight in Soybeans Grown Under Different Light Intensities. Crop Sci. 1972, 12, 77–79. [Google Scholar] [CrossRef]
- Al-Khatib, K.; Paulsen, G.M. Enhancement of Thermal Injury to Photosynthesis in Wheat Plants and Thylakoids by High-Light Intensity. Plant Physiol. 1989, 90, 1041–1048. [Google Scholar] [CrossRef] [PubMed]
- Bantis, F.; Koukounaras, A.; Siomos, A.S.; Fotelli, M.N.; Kintzonidis, D. Bichromatic Red and Blue LEDs during Healing Enhance the Vegetative Growth and Quality of Grafted Watermelon Seedlings. Sci. Hortic. 2019, 261, 109000. [Google Scholar] [CrossRef]
- Bourget, C.M. An Introduction to Light-emitting Diodes. HortScience 2008, 43, 1944–1946. [Google Scholar] [CrossRef]
- Song, S.; Kusuma, P.; Carvalho, S.D.; Li, Y.; Folta, K.M. Manipulation of Seedling Traits with Pulsed Light in Closed Controlled Environments. Environ. Exp. Bot. 2019, 166, 103803. [Google Scholar] [CrossRef]
- Dong, T.; Zhang, P.; Hakeem, A.; Liu, Z.; Su, L.; Ren, Y.; Pei, D.; Xuan, X.; Li, S.; Fang, J. Integrated Transcriptome and Metabolome Analysis Reveals the Physiological and Molecular Mechanisms of Grape Seedlings in Response to Red, Green, Blue, and White LED Light Qualities. Environ. Exp. Bot. 2023, 213, 105441. [Google Scholar] [CrossRef]
- Endo, M.; Fukuda, N.; Yoshida, H.; Fujiuchi, N.; Yano, R.; Kusano, M. Effects of Light Quality, Photoperiod, CO2 Concentration, and Air Temperature on Chlorogenic Acid and Rutin Accumulation in Young Lettuce Plants. Plant Physiol. Biochem. 2022, 186, 290–298. [Google Scholar] [CrossRef]
- Xiaoying, L.; Mingjuan, Y.; Xiaodong, X.; Abm, K.; Atak, A.; Caihong, Z.; Dawei, L. Effect of Light on Growth and Chlorophyll Development in Kiwifruit Ex Vitro and in Vitro. Sci. Hortic. 2021, 291, 110599. [Google Scholar] [CrossRef]
- Utasi, L.; Kovács, V.; Gulyás, Z.; Marcek, T.; Janda, T.; Darko, E. Threshold or Not: Spectral Composition and Light-Intensity Dependence of Growth and Metabolism in Tomato Seedlings. Sci. Hortic. 2023, 313, 111946. [Google Scholar] [CrossRef]
- Palma, C.F.F.; Castro-Alves, V.; Morales, L.O.; Rosenqvist, E.; Ottosen, C.O. Metabolic Changes in Cucumber Leaves Are Enhanced by Blue Light but Differentially Affected by UV Interactions with Light Signaling Pathways in the Visible Spectrum. Plant Sci. 2022, 321, 111326. [Google Scholar] [CrossRef] [PubMed]
- Krizek, D.T.; Mirecki, R.M.; Britz, S.J. Inhibitory Effects of Ambient Levels of Solar UV-A and UV-B Radiation on Growth of Cucumber. Physiol. Plant. 1997, 100, 886–893. [Google Scholar] [CrossRef]
- Qian, M.; Kalbina, I.; Rosenqvist, E.; Jansen, M.A.; Teng, Y.; Strid, Å. UV Regulates the Expression of Phenylpropanoid Biosynthesis Genes in Cucumber (Cucumis sativus L.) in an Organ and Spectrum Dependent Manner. Photochem. Photobiol. Sci. 2019, 18, 424–433. [Google Scholar] [CrossRef] [PubMed]
- Morales, L.O. Effects of UV Radiation on Transcript and Metabolite Accumulation Are Dependent on Monochromatic Light Background in Cucumber. Physiol. Plant. 2021, 173, 750–761. [Google Scholar] [CrossRef]
- Shinkle, J.R.; Edwards, M.C.; Koenig, A.; Shaltz, A.; Barnes, P.W. Photomorphogenic Regulation of Increases in UV-absorbing Pigments in Cucumber (Cucumis sativus) and Arabidopsis thaliana Seedlings Induced by Different UV-Band and UV-C Wavebands. Physiol. Plant. 2010, 138, 113–121. [Google Scholar] [CrossRef] [PubMed]
- Kwack, Y.; Park, S.W.; Chun, C. Growth and development of grafted cucumber transplants as affected by seedling ages of scions and rootstocks and light intensity during their cultivation in a closed production system. Hortic. Sci. Technol. 2014, 32, 600–606. [Google Scholar] [CrossRef][Green Version]
- Yan, Z.; Wang, L.; Dai, J.; Liu, Y.; Lin, D.; Yang, Y. Morphological and Physiological Responses of Cucumber Seedlings to Different Combinations of Light Intensity and Photoperiod with the Same Daily Light Integral. HortScience 2021, 56, 1430–1438. [Google Scholar] [CrossRef]
- Hwang, H.; An, S.; Pham, M.D.; Cui, M.; Chun, C. The combined conditions of photoperiod, light intensity, and air temperature control the growth and development of tomato and red pepper seedlings in a closed transplant production system. Sustainability 2020, 12, 9939. [Google Scholar] [CrossRef]
- Zheng, J.; Gan, P.; Ji, F.; He, D.; Yang, P. Growth and Energy Use Efficiency of Grafted Tomato Transplants as Affected by LED Light Quality and Photon Flux Density. Agriculture 2021, 11, 816. [Google Scholar] [CrossRef]
- Yan, Z.; He, D.; Niu, G.; Zhai, H. Evaluation of growth and quality of hydroponic lettuce at harvest as affected by the light intensity, photoperiod and light quality at seedling stage. Sci. Hortic. Amst. 2019, 248, 138–144. [Google Scholar] [CrossRef]
- Kang, J.H.; KrishnaKumar, S.; Atulba, S.L.S.; Jeong, B.R.; Hwang, S.J. Light intensity and photoperiod influence the growth and development of hydroponically grown leaf lettuce in a closed-type plant factory system. Hortic. Environ. Biotechnol 2013, 54, 501–509. [Google Scholar] [CrossRef]
- Zhang, Y.T.; Ji, J.Z.; Song, S.W.; Su, W.; Liu, H.C. Growth, nutritional quality and health-promoting compounds in Chinese kale grown under different ratios of red: Blue LED lights. Agronomy 2020, 10, 1248. [Google Scholar] [CrossRef]
- Cui, J.; Song, S.; Yu, J.; Liu, H. Effect of Daily Light Integral on Cucumber Plug Seedlings in Artificial Light Plant Factory. Horticulturae 2021, 7, 139. [Google Scholar] [CrossRef]
- Lord, D.; Morissette, S.; Allaire, J. Influence de l’intensité lumineuse, de la température nocturne de l’air et de la concentration en CO2 sur la croissance de semis d’épinette noire (Piceamariana) produits en récipients en serres. Can. J. For. Res. 1993, 23, 101–110. [Google Scholar] [CrossRef]
- Carvalho, N.; Pelacani, C.; Rodrigues, M.; Crepaldi, I. Crescimento inicial de plantas de licuri (Syagrus coronata (Mart.) Becc.) em diferentes níveis de luminosidade. Rev. Arvore 2006, 30, 351–357. [Google Scholar] [CrossRef]
- García-Caparrós, P.; Sabio, F.; Barbero, F.J.; Chica, R.M.; Lao, M.T. Physiological Responses of Tomato and Cucumber Seedlings under Different Light–Dark Cycles. Agronomy 2020, 10, 945. [Google Scholar] [CrossRef]
- Martel, A.B.; Taylor, A.E.; Qaderi, M.M. Individual and interactive effects of temperature and light intensity on canola growth, physiological characteristics, and methane emissions. Plant Physiol. Biochem. 2020, 157, 160–168. [Google Scholar] [CrossRef]
- Dong, C.; Fu, Y.; Liu, G.; Liu, H. Low Light Intensity Effects on the Growth, Photosynthetic Characteristics, Antioxidant Capacity, Yield and Quality of Wheat (Triticum aestivum L.) at Different Growth Stages in BLSS. Adv. Space Res. 2014, 53, 1557–1566. [Google Scholar] [CrossRef]
- Hernández, R.; Kubota, C. Growth and Morphological Response of Cucumber Seedlings to Supplemental Red and Blue Photon Flux Ratios under Varied Solar Daily Light Integrals. Sci. Hortic. 2014, 173, 92–99. [Google Scholar] [CrossRef]
- He, R.; Zhang, Y.; Song, S.; Su, W.; Hao, Y.; Liu, H. UV-A and FR irradiation improves growth and nutritional properties of lettuce grown in an artificial light plant factory. Food Chem. 2021, 345, 128727. [Google Scholar] [CrossRef] [PubMed]
- An, S.; Hwang, H.; Chun, C.; Jang, Y.; Lee, H.J.; Wi, S.H.; Yeo, K.-H.; Yu, I.-H.; Kwack, Y. Evaluation of Air Temperature, Photoperiod and Light Intensity Conditions to Produce Cucumber Scions and Rootstocks in a Plant Factory with Artificial Lighting. Horticulturae 2021, 7, 102. [Google Scholar] [CrossRef]
Figure 1.
Experiment platform: (a) artificial climate chamber; (b) seedling cultivation shelf.
Figure 1.
Experiment platform: (a) artificial climate chamber; (b) seedling cultivation shelf.
Figure 2.
Structure light point cloud 3D data acquisition system: (a) 3D structured light camera; (b) phenotypic collection system; (c) data acquisition process.
Figure 2.
Structure light point cloud 3D data acquisition system: (a) 3D structured light camera; (b) phenotypic collection system; (c) data acquisition process.
Figure 3.
Effects of light intensity on the plant height and stem diameter at the cotyledon flattening (CF) stage. Note: Different letters in the figure represent significant differences at the 5% level (p < 0.05); the error bars in the figure were calculated by SE (the same below).
Figure 3.
Effects of light intensity on the plant height and stem diameter at the cotyledon flattening (CF) stage. Note: Different letters in the figure represent significant differences at the 5% level (p < 0.05); the error bars in the figure were calculated by SE (the same below).
Figure 4.
Effects of light intensity on the plant height and stem diameter at the one bud and one leaf (OBOL) stage. Note: Different letters in the figure represent significant differences at the 5% level (p < 0.05); the error bars in the figure were calculated by SE.
Figure 4.
Effects of light intensity on the plant height and stem diameter at the one bud and one leaf (OBOL) stage. Note: Different letters in the figure represent significant differences at the 5% level (p < 0.05); the error bars in the figure were calculated by SE.
Figure 5.
Effects of the light intensity on the plant height and stem diameter at the one bud and two leaves (OBTL) stage. Note: Different letters in the figure represent significant differences at the 5% level (p < 0.05); the error bars in the figure were calculated by SE.
Figure 5.
Effects of the light intensity on the plant height and stem diameter at the one bud and two leaves (OBTL) stage. Note: Different letters in the figure represent significant differences at the 5% level (p < 0.05); the error bars in the figure were calculated by SE.
Figure 6.
Effects of various light intensities on the biomass of the cucumbers at the cotyledon flattening (CF) stage. Note: Different letters in the figure represent significant differences at the 5% level (p < 0.05); the error bars in the figure were calculated by SE.
Figure 6.
Effects of various light intensities on the biomass of the cucumbers at the cotyledon flattening (CF) stage. Note: Different letters in the figure represent significant differences at the 5% level (p < 0.05); the error bars in the figure were calculated by SE.
Figure 7.
Effects of various light intensities on the biomass of the cucumbers at the one bud and one leaf (OBOL) stage. Note: Different letters in the figure represent significant differences at the 5% level (p < 0.05); the error bars in the figure were calculated by SE.
Figure 7.
Effects of various light intensities on the biomass of the cucumbers at the one bud and one leaf (OBOL) stage. Note: Different letters in the figure represent significant differences at the 5% level (p < 0.05); the error bars in the figure were calculated by SE.
Figure 8.
Effects of various light intensities on the biomass of the cucumbers at the one bud and two leaves (OBTL) stage. Note: Different letters in the figure represent significant differences at the 5% level (p < 0.05); the error bars in the figure were calculated by SE.
Figure 8.
Effects of various light intensities on the biomass of the cucumbers at the one bud and two leaves (OBTL) stage. Note: Different letters in the figure represent significant differences at the 5% level (p < 0.05); the error bars in the figure were calculated by SE.
Figure 9.
Effects of various light intensities on the leaf parameters at the cotyledon flattening (CF) stage: (a) leaf area; (b) leaf circumference.
Figure 9.
Effects of various light intensities on the leaf parameters at the cotyledon flattening (CF) stage: (a) leaf area; (b) leaf circumference.
Figure 10.
Effects of various light intensities on the leaf parameters at the one bud and one leaf (OBOL) stage: (a) leaf area; (b) leaf circumference.
Figure 10.
Effects of various light intensities on the leaf parameters at the one bud and one leaf (OBOL) stage: (a) leaf area; (b) leaf circumference.
Figure 11.
Effects of various light intensities on the leaf parameters at the one bud and two leaves (OBTL) stage: (a) leaf area; (b) leaf circumference.
Figure 11.
Effects of various light intensities on the leaf parameters at the one bud and two leaves (OBTL) stage: (a) leaf area; (b) leaf circumference.
Figure 12.
Effects of various light intensities on the HI at the three developmental stages: (a) HIDry; (b) HIFresh. Note: The markers with purple color are the turning points of optimal light intensity.
Figure 12.
Effects of various light intensities on the HI at the three developmental stages: (a) HIDry; (b) HIFresh. Note: The markers with purple color are the turning points of optimal light intensity.
Table 1.
Hoagland nutrient solution.
Table 1.
Hoagland nutrient solution.
| Basis | Dosage mg/L | pH | EC mS/cm |
|---|
| Ca(NO3)2 4 H2O | 945 | 6.0 ± 0.5 | 1.2 ± 0.2 |
| KNO3 | 607 |
| (NH4)3PO4 | 115 |
| MgSO4 | 493 |
| (NH4)6Mo7O24 | 0.03 |
| C10H12N2O8FeNa·3 H2O | 30 |
| H3BO3 | 3 |
| MnSO4 | 1.8 |
| ZnSO4 | 0.5 |
| CuSO4 | 0.1 |
| Disclaimer/Publisher’s Note: The statements, opinions and data contained in all publications are solely those of the individual author(s) and contributor(s) and not of MDPI and/or the editor(s). MDPI and/or the editor(s) disclaim responsibility for any injury to people or property resulting from any ideas, methods, instructions or products referred to in the content. |
© 2024 by the authors. Licensee MDPI, Basel, Switzerland. This article is an open access article distributed under the terms and conditions of the Creative Commons Attribution (CC BY) license (https://creativecommons.org/licenses/by/4.0/).


