Article

Mowing Height Effects on ‘TifTuf’ Bermudagrass during Deficit Irrigation

U.S. Arid-Land Research Center, U.S. Department of Agriculture, Agricultural Research Service, Maricopa, AZ 85138, USA
*
Author to whom correspondence should be addressed.
Agronomy 2024, 14(3), 628; https://doi.org/10.3390/agronomy14030628
Submission received: 27 February 2024 / Revised: 13 March 2024 / Accepted: 18 March 2024 / Published: 20 March 2024
(This article belongs to the Section Water Use and Irrigation)

Abstract

:
The development of management plans which lead to water efficient landscapes is a growing need in the turfgrass community. While deficit irrigation as a scheduling method can improve water conservation, more information is desired on how to best leverage other management practices, such as mowing height when deficit irrigation is imposed. The objectives of this study were to characterize actual evapotranspiration (ETa), turfgrass visual quality, clipping production, and root development of ‘TifTuf’ bermudagrass (Cynodon dactylon × C. transvaalensis Burt Davy) when irrigated at full (1.0 × ETa) and deficit levels (0.65 and 0.30 × ETa), and cut at four separate mowing heights (2.5, 5.0, 7.5, and 10.0 cm) over two 8-week experimental runs. An elevated ETa was observed at the 7.5 cm and 10.0 cm mowing heights compared to the 2.5 cm mowing height in both runs, and the 5.0 cm mowing height in one run. The visual quality decreased throughout both study periods and mostly for the deficit irrigation treatments, with visual quality falling below minimum acceptable levels at the lowest irrigation level (0.30 × ETa) 5 weeks into run A, and 8 weeks into run B. Despite an elevated ETa and a higher root dry weight at higher mowing heights (7.5 and 10.0 cm), clipping production and visual quality was generally higher at lower mowing heights (2.5 and 5.0 cm) for both full and deficit irrigation levels. These results demonstrate that mowing height can significantly influence bermudagrass water use, as well as responses to deficit irrigation. When maintaining ‘TifTuf’ bermudagrass at heights above 2.5 cm, the results from this study indicate a lower water use and improved response to deficit irrigation at mowing heights ≤ 5 cm.

1. Introduction

Urban green spaces are an integral part of sustainable development for the rapidly expanding metropolitan areas of the U.S. and other regions. When properly maintained, these turfgrass-dominated areas have positive impacts on human health, economic significance, and environmental benefits [1]. However, irrigation is usually required to maintain successful turfgrass function in the many regions where turfgrasses are utilized, since rainfall normally cannot supply the amount of water necessary [2]. Water shortage is a continuing challenge for the turfgrass community due to increasing demands from urbanized population growth, coupled with increased drought incidence and seasonality of water availability [3,4,5,6]. Therefore, the development of management practices leading to water-efficient turfgrass landscapes is important across an expanding constituency.
To efficiently utilize water for turfgrass, management practices should maintain turfgrass quality while using minimal water inputs. Mowing is among the most basic and routinely performed practice for maintaining turfgrass function, as it promotes dense stands and aesthetic appeal. The height at which a turfgrass area is mowed is often selected based on species adaptation, maintenance capabilities, monetary considerations, and how the site is utilized (e.g., residential lawns, parks, open spaces, golf course fairways, greens, roughs, and sports fields) [7]. Water use generally increases as mowing height increases due to additional transpiration from the increased leaf area, along with an increase in gas exchange from the rougher canopy surface [8]. Biran et al. 1981 found that evapotranspriation (ET) of both ‘Suwannee’ bermudagrass [Cynodon dactylon (L.) Pers.] and kikuyugrass (Pennisetum clandestinum Hochst. cv. Chiov.) rapidly increased when the mowing height was increased from 3 cm to 6 cm, until six weeks into the experiment when no significant differences for ET between mowing treatments were detected [9]. The evapotranspiration from St. Augustinegrass [Stenotaphrum secundatum (Walt.) Kuntze] increased when mowed at 8 cm compared to 5 cm [10]. Similar patterns have been observed for cool-season species such as Kentucky bluegrass (Poa pratensis L.), annual bluegrass (Poa annua L.), and creeping bentgrass (Agrostis stolonifera L.) [11,12]. While turfgrasses maintained at lower mowing heights may use less water, a higher mowing height can be favorable for maintaining growth or survival during times of drought, as it promotes increased root development by providing greater leaf area for photosynthetic activity [13]. For seashore paspalum (Paspalum vaginatum Swartz), higher mowing heights have been shown to enhance avoidance in moderate-to-high drought stress and improve turfgrass quality under drought conditions [14,15]. However, during drought the water use at higher mowing heights in other warm-season turfgrasses has been shown to increase during onset along with shortened survival times [16,17]. Therefore, more research is needed to understand how to best manage mowing height for turfgrass quality maintenance when water conservation strategies like deficit irrigation are implemented.
Deficit irrigation is a process in which water is intentionally applied to crops in quantities below their maximal consumptive use [18,19,20]. For turfgrass management, this can be an effective method to achieve water conservation goals when utilized during times of drought, or in areas where water availability is limited [21]. However, a sound understanding of the plant’s water needs is required to properly enact a deficit irrigation program, which are often based on estimates of plant evapotranspiration (ET, ETa) relative to site-specific measurements of reference ET (ETo). Field measurements of ETa utilizing weighing lysimeters, relative to ETo (from an onsite or nearby weather station), determines a crop coefficient (Kc) to assist in scheduling irrigation for productivity [22,23]. To irrigate at deficit levels, irrigation is applied utilizing a coefficient value below the predetermined Kc value for optimal growth.
Hybrid bermudagrass (Cynodon dactylon × C. transvaalensis Burt Davy) is a turfgrass species that is widely used, where crop coefficient values range between 0.52 to 0.89 × ETo showing a capacity to maintain acceptable performance at water deficit levels [20,24]. For instance, ‘Tifway’ bermudagrass was generally able to maintain acceptable turfgrass quality while receiving irrigation in the amounts of 0.3 × ETo during two consecutive summer periods in College Station, TX, USA [25]. However, tolerable levels of irrigation necessary to maintain hybrid bermudagrass quality were higher (0.66 to 0.75 × ETo) when deficit irrigation was implemented in a more arid region with higher evaporative demand for four hybrid bermudagrass cultivars: ‘Tifway’, ‘Tifsport’, ‘Tifgreen’, and ‘Midiron’ [26].
The need for improved management programs that reduce water use on turfgrass, combined with an understanding of how to best leverage mowing height for irrigation management, underscores an importance to further explore how mowing height impacts water use and tolerable levels of an irrigation deficit. To address this need, two greenhouse experiments were conducted over 8 week periods to characterize ETa, visual turfgrass quality, clipping production, and root production of ‘TifTuf’ bermudagrass (Cynodon dactylon × C. transvaalensis Burt Davy) while receiving irrigation at well-watered (1.0 × ETa) and deficit levels (0.65 and 0.30 × ETa), and cut at four separate mowing heights (2.5, 5.0, 7.5, and 10.0 cm).

2. Materials and Methods

A turfgrass experiment took place in two greenhouses at the U.S. Arid Land Agricultural Research Center (ALARC) in Maricopa, Arizona over 8-week periods during Fall 2023. Two experimental runs were conducted in separate greenhouses, which were both initiated 11 October 2023. Air temperatures in each greenhouse was measured using a HC2S3 probe (Rotronic Instrument Corp, Hauppauge, NY, USA) placed inside a 41003-5 10-plate radiation shield (R.M. Young Comp., Traverse City, MI, USA). The average daily temperature in each greenhouse was 28.6 °C and 29.6 °C for run A and run B, respectively. The average nightly temperature for run A and run B was 24.13 °C and 24.51 °C, respectively.
Seven weeks prior to each run, plugs of ‘TifTuf’ bermudagrass were extracted from sod, washed free of soil, and established in 72 lysimeters constructed from polyvinyl chloride pipe (15.2 cm diameter × 30.5 cm depth). TifTuf was co-released by the University of Georgia and the U.S. Department of Agriculture—Agricultural Research Service and was selected for this experiment having shown improved drought tolerance and enhanced adaptability in water-stressed environments [27,28]. The soil medium for the experiment was a U.S. Golf Association (USGA) specification sand [90:10 (vol:vol) sand:peat moss]. Each lysimeter was equiped with a drilled 10 mm drainage hole at the bottom over which a plant and seed guard cloth (DeWitt, Sikeston, MO, USA) was laid to avoid the loss of sand. Four weeks after the sod plugs were planted, all lysimeters were fertilized at a rate of 2.4 g N/m2 using a 21-7-14 fertilizer (Turf Royale, YaraMila, Tampa, FL, USA). All lysimeters were held in the same greenhouse until five weeks into the establishment period. At six weeks, 36 of the lysimeters remained in the original greenhouse constituting run A and the other 36 lysimeters were moved to an adjacent greenhouse for run B. To encourage establishment, water was routinely applied during the establishment period prior to the experiment’s initiation.
We employed a completely randomized design with three replications for each experiment. All possible combinations of three irrigation levels (1.0, 0.65 and 0.30 × ETa) and four mowing heights were used (2.5, 5.0, 7.5, and 10.0 cm). Two weeks after planting, 36 of the 72 lysimeters were cut with scissors to a height of 5.0 cm to represent the 2.5 cm and 5.0 cm treatments. Thereafter, cutting heights on 18 of those lysimeters were lowered by 0.5 cm each week to reach and then maintain a 2.5 cm cutting height for the 2.5 cm treatments. Lysimeters representing the 7.5 cm and 10 cm treatments were monitored weekly, until they reached their respective treatment heights and then were maintained at that height. Mowing height treatments were selected as a range in which ‘TifTuf’ bermudagrass is tolerant, and as representative of heights utilized for home-lawns, parks, and utility landscapes.
Immediately prior to each experiment’s initiation, each lysimeter was fully submerged in bucket of water until the release of air bubbles was no longer seen (≈4-min submersion) to attain saturation. Immediately after, field capacity was reached by allowing each lysimeter to drain freely for 30–36 h. Field capacity weights were then recorded to be used for future application during reweighing and irrigation events. Each lysimeter was irrigated twice during each week of the experiment. Irrigation levels included well-watered [1.0 × actual evapotranspiration (ETa)], and deficit treatments (0.65 and 0.30 × ETa).
Actual evapotranspiration (ETa) was determined by twice-weekly weighing and calculating the mean mass change of three well-watered (1.0 × ETa) lysimeters within each of the four mowing height treatments. Then irrigation was applied in amounts matching exact mass change for each of the well-watered lysimeters and average deficit (0.65 and 0.30 × ETa) replacement levels within each mowing height treatment.
Turfgrass visual quality assessments were conducted weekly on each lysimeter by a single observer for turfgrass quality using a modified National Turfgrass Evaluation Program (NTEP) visual quality ranking system (Scale 1–9; minimum quality = 5) [29]. The quality ratings accounted for a combination of color, density, and uniformity of the turfgrass canopy. For reference, a numeric rating of 1 would indicate completely fired and water stressed turf, and a rating of 9 would represent perfectly conditioned turf that is fully uniform and dark green in color.
Productivity was assessed through weekly clipping collections. Every 7 days and for each lysimeter, the turfgrass was trimmed to the predetermined mowing height treatment level (2.5, 5.0, 7.5, or 10.0 cm) using scissors and a ruler. After each collection, clippings were oven dried for 72 h at 65 °C and weighed to obtain dry weight values. For each period, dry weights were divided by the number of growing days to calculate a daily shoot growth for each lysimeter. The roots were harvested for each lysimeter at the conclusion of each study by washing the roots free of sand and by careful separation from stem tissue. The roots were then oven dried for 72 h at 65 °C and weighed to obtain dry weight values.
The data for all parameters were subjected to analysis of variance (ANOVA) in JMP 15.2.0 (SAS Institute, Cary, NC, USA). For instances where ANOVA indicated a significant run A and B effect, the parameters were presented by study. The mean separation procedures were performed using Tukey’s honestly significant difference test at p ≤ 0.05 level.

3. Results and Discussion

3.1. Effects of Mowing Height on ETa

Mowing height had a highly significant (p ≤ 0.001) effect on daily ETa in both runs (Table 1). Overall, average daily ETa for both run A (5.3 to 6.9 ± 0.18) and B (5.7 to 7.3 ± 0.23) across mowing heights within the 1.0 × ETa treatments were within the typical reported range of daily ETa for bermudagrass in well-watered conditions [20]. In run A, the daily ETa was lower in the turfgrass mowed at 5 cm and 2.5 cm, compared to both 7.5 cm (25 and 29% lower, respectively) and 10 cm (27 and 31% lower, respectively) (Figure 1). In run B, the daily ETa of the 2.5 cm turfgrass was lower than the 5 cm (19% lower), 7.5 cm (23% lower), and 10 cm (26% lower) (Figure 1). These results are consistent with prior research with bermudagrass, other warm-season turfgrass species, and ‘Merion’ Kentucky Bluegrass in which higher mowing resulted in greater ETa compared to shorter turfgrass [9,11,14,30]. Shahba et al. (2014) reported no differences in ET at full irrigation levels for three seashore paspalum cultivars at three different mowing heights; however, their range of mowing heights (2.5 cm to 4.5 cm) was smaller compared to the present study (2.5 cm to 10.0 cm) [15].

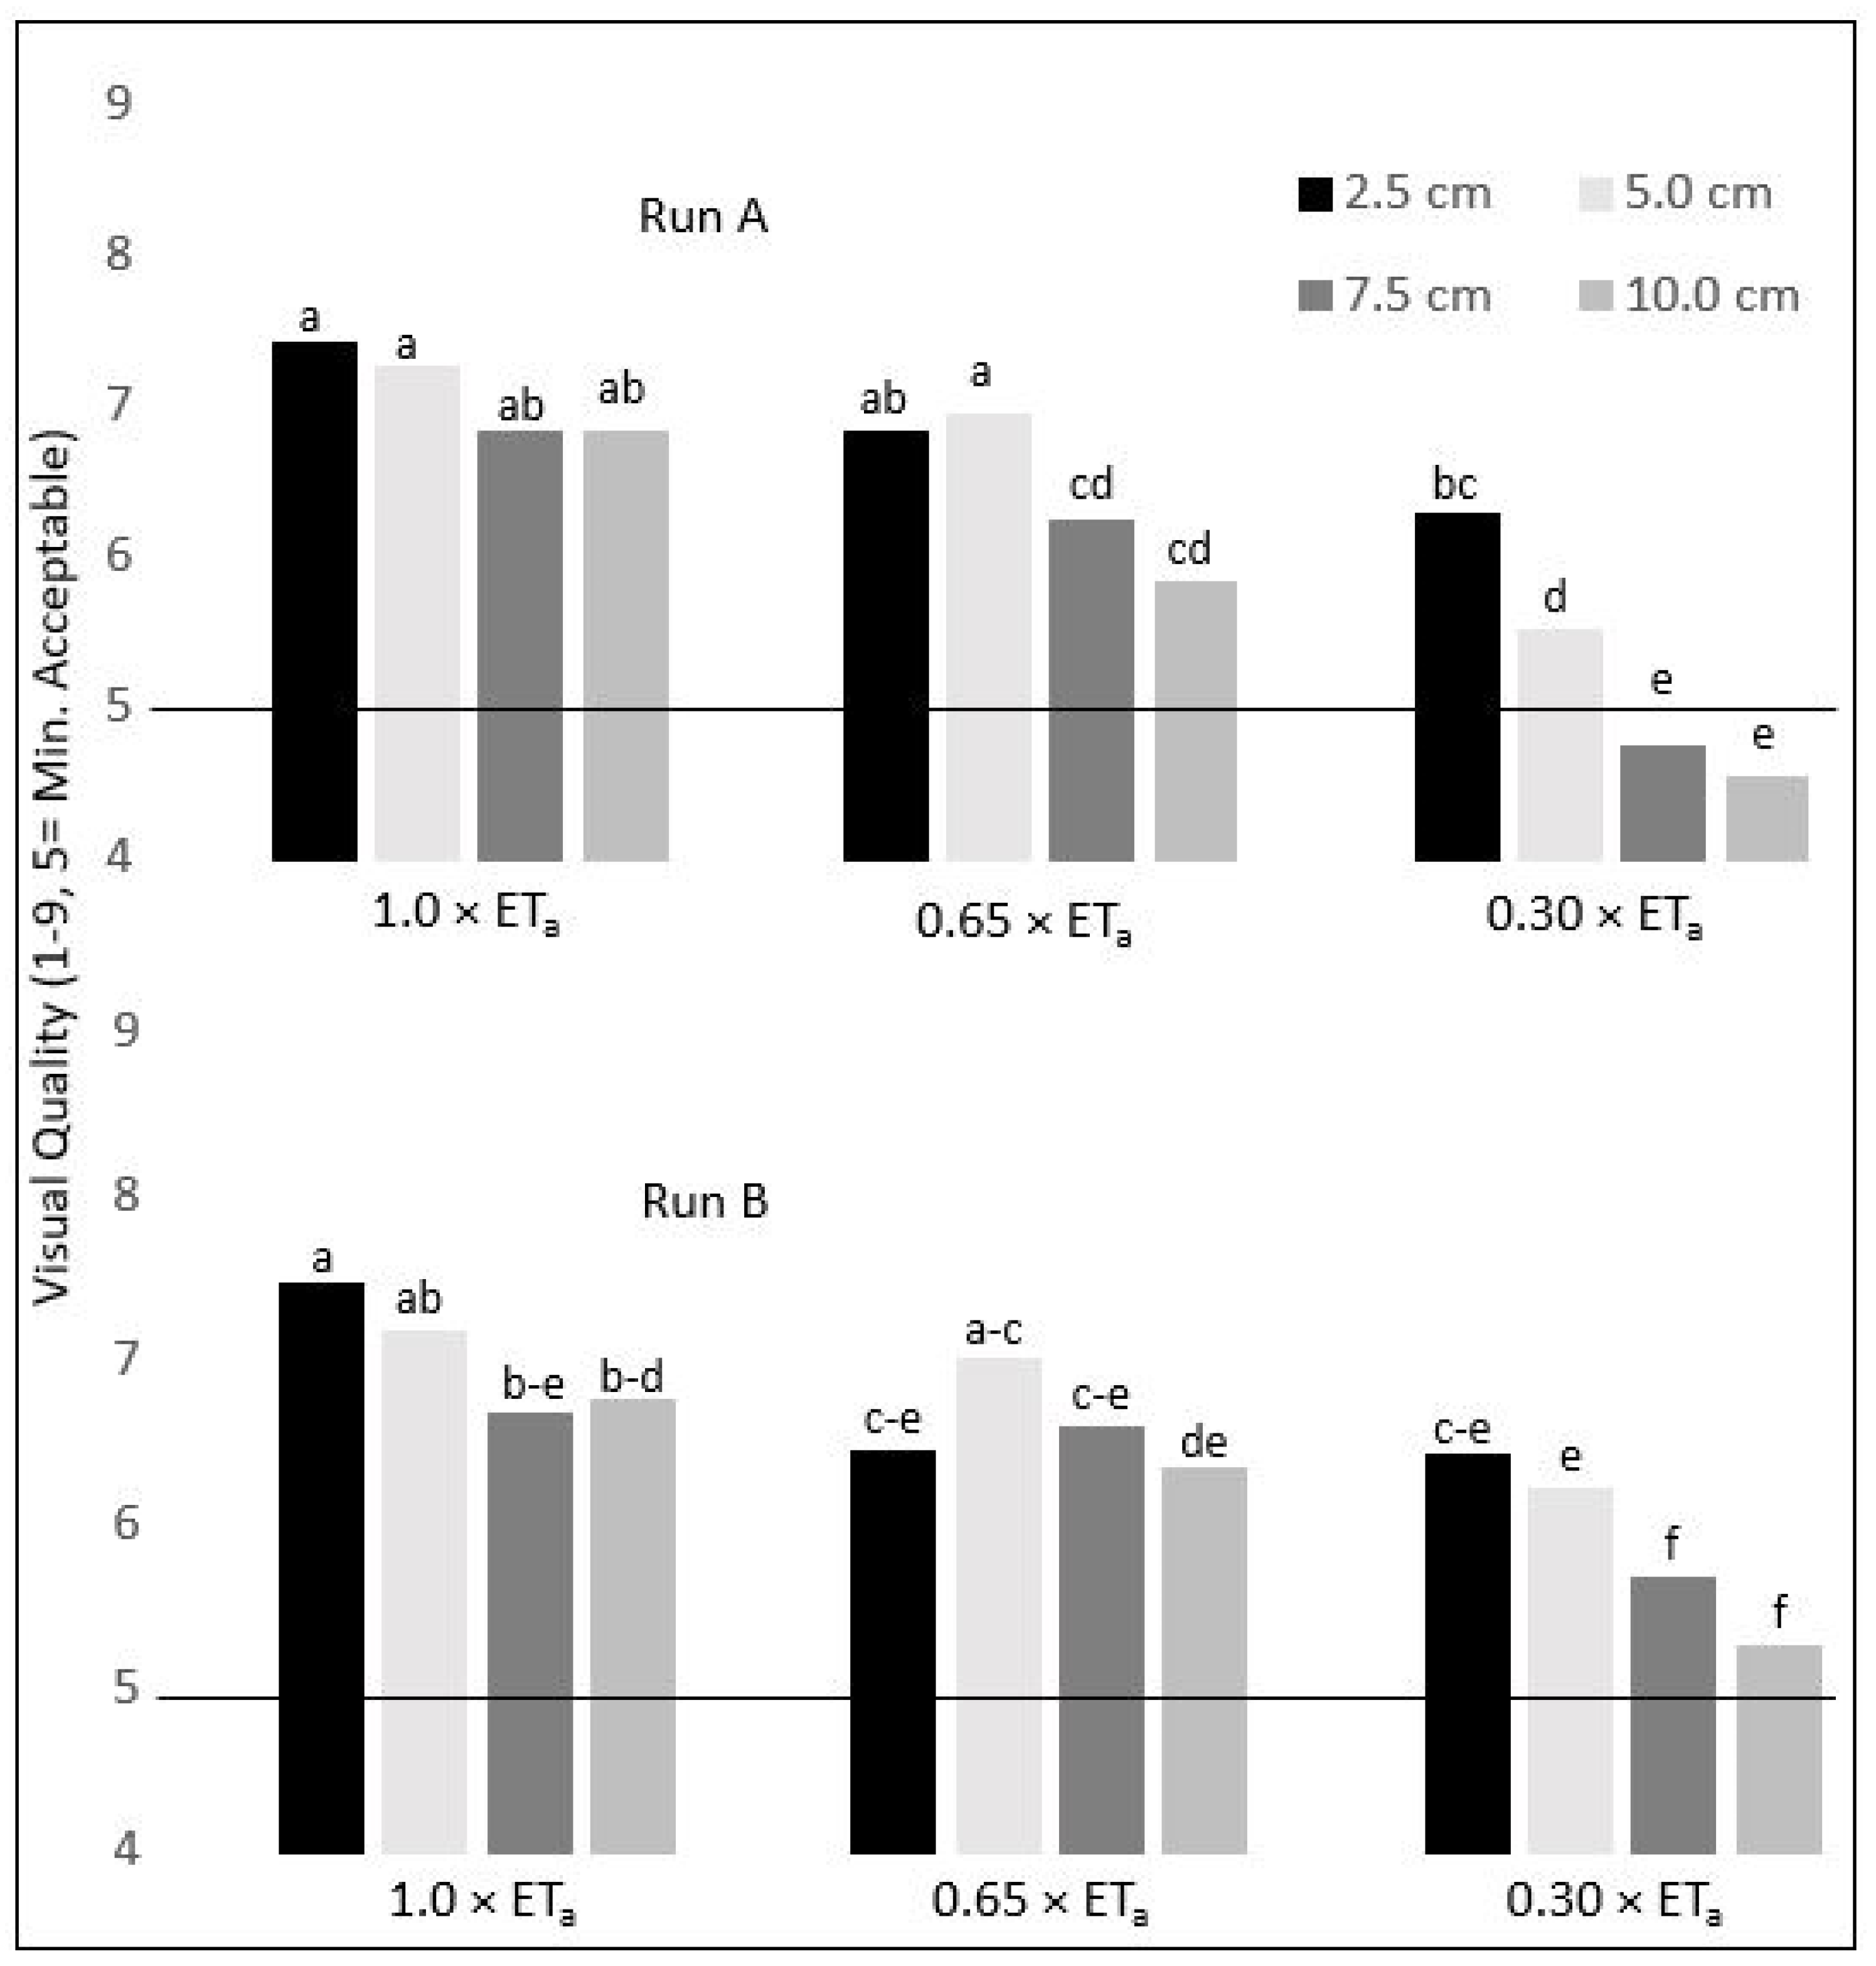
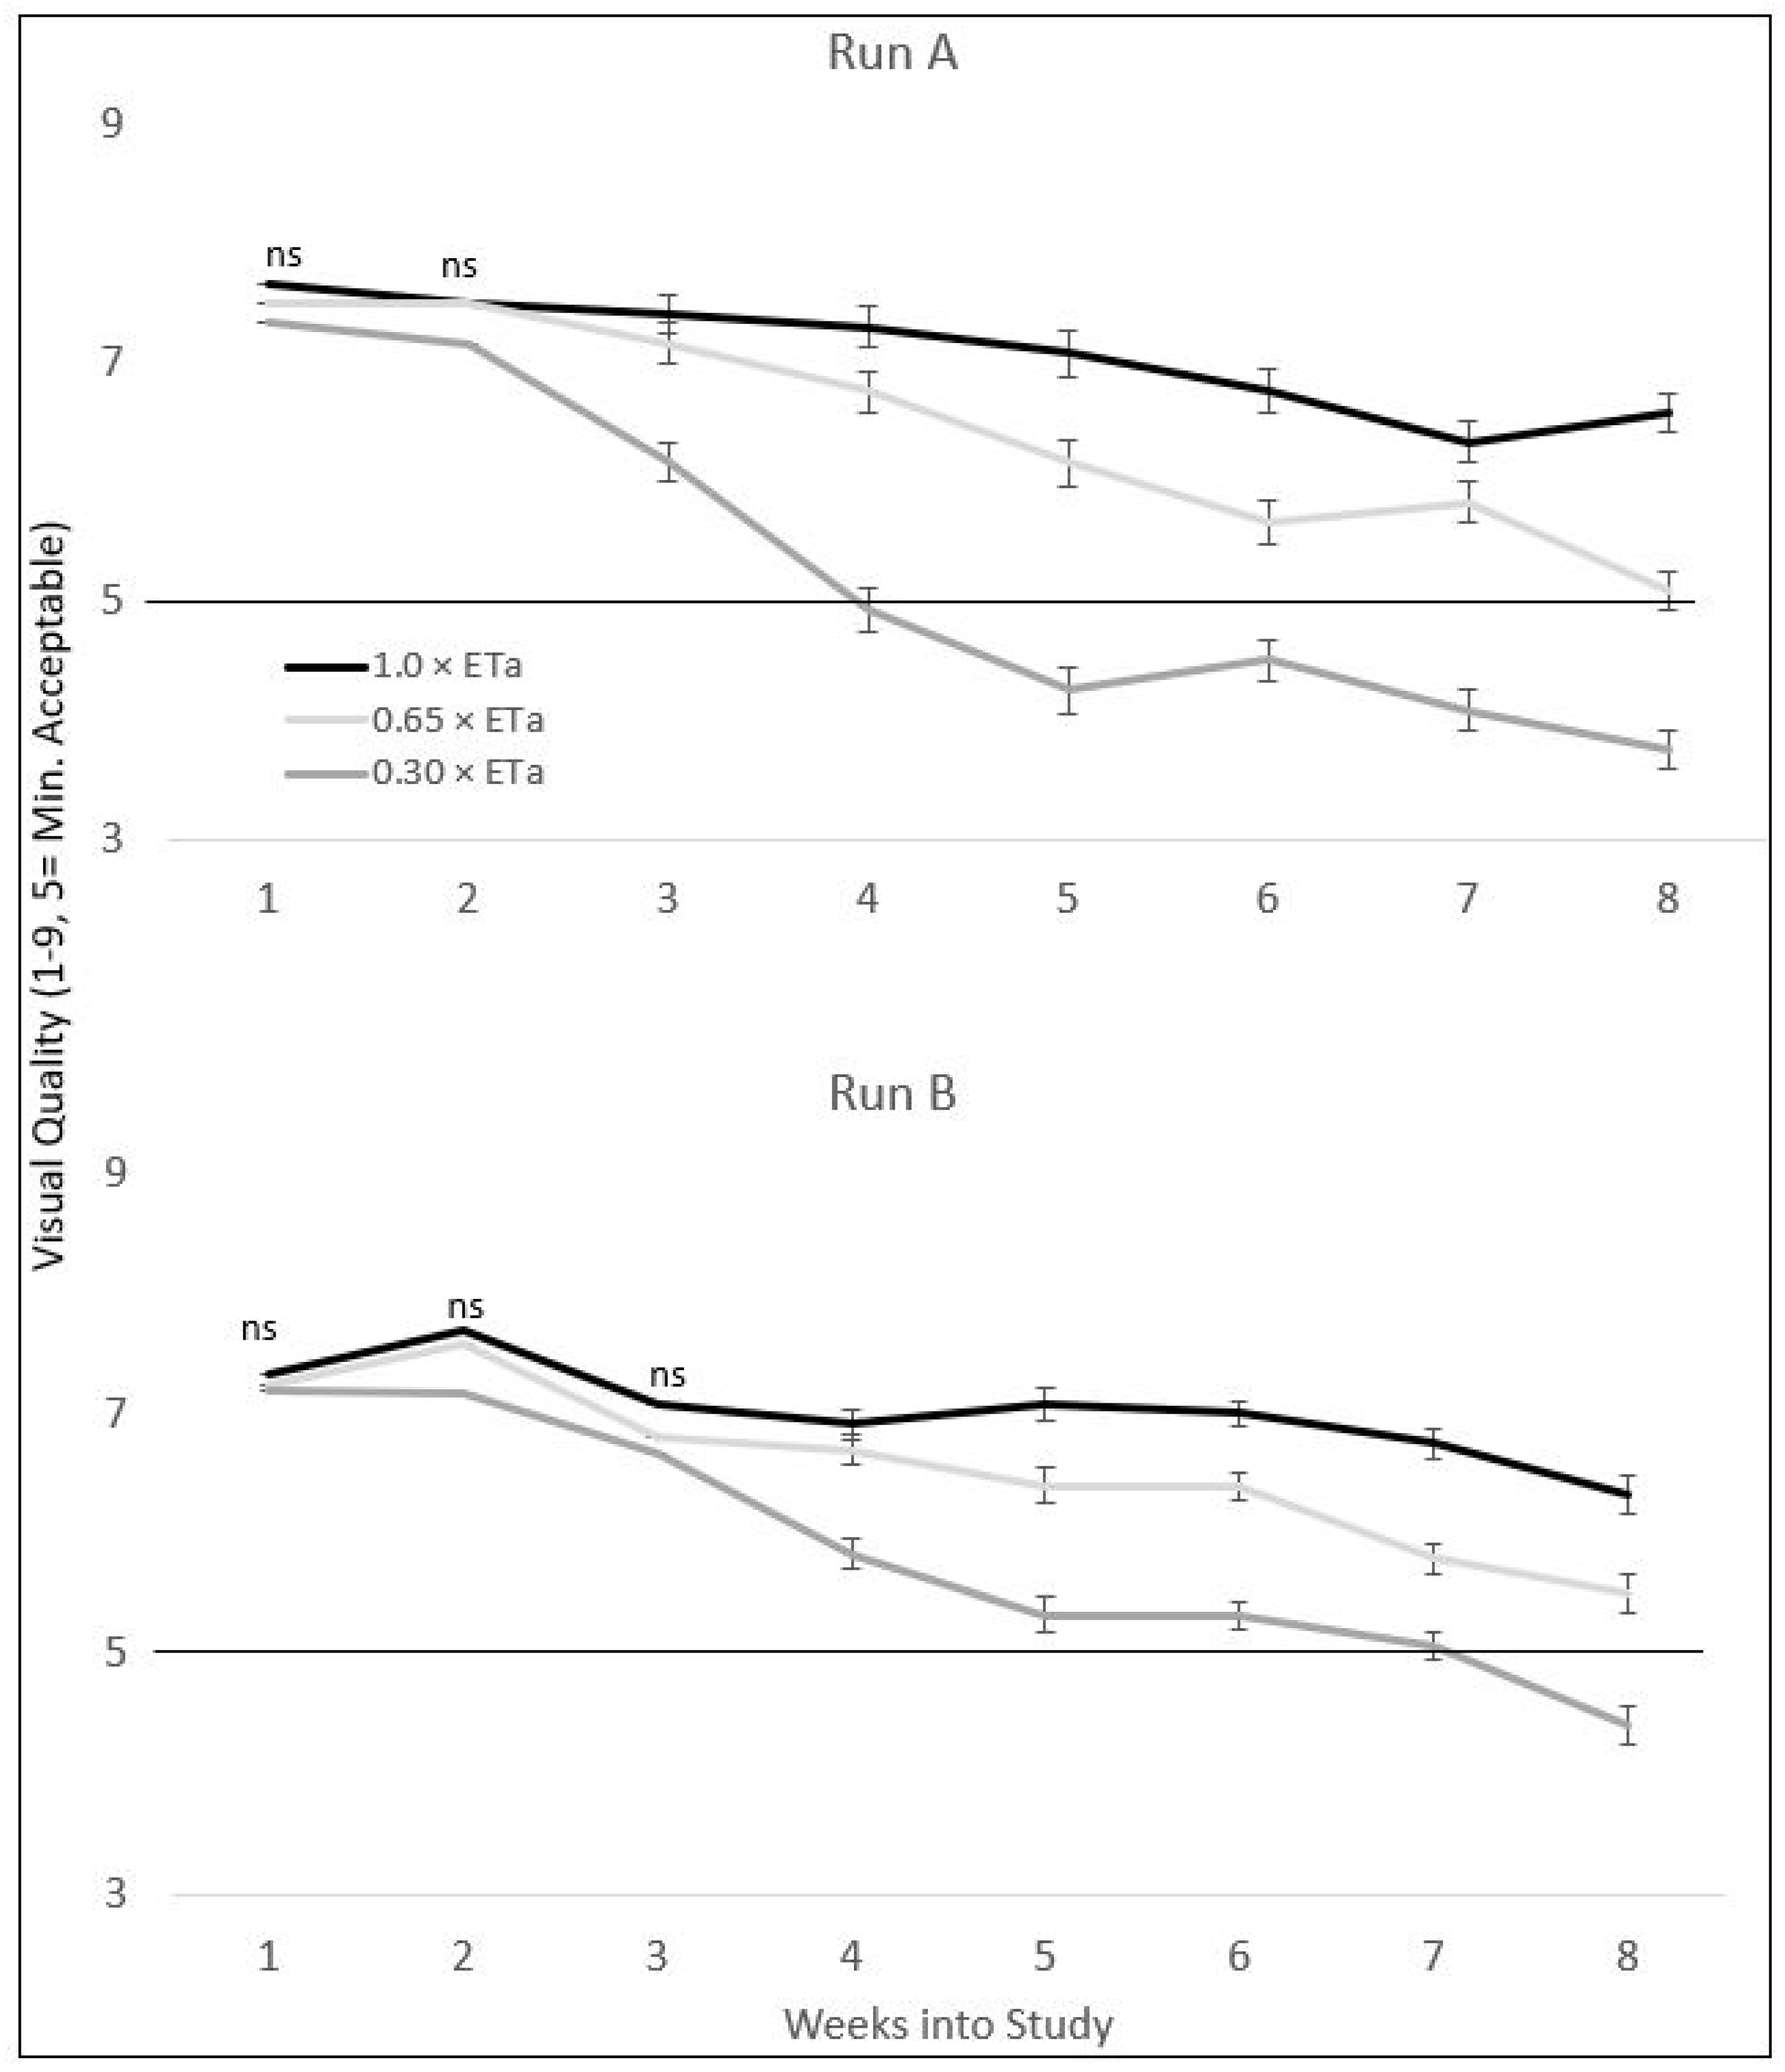
3.2. Mowing Height and Irrigation Level Effects on Visual Quality

There was a highly significant (p ≤ 0.001) mowing height × irrigation level interaction for the visual quality of both runs (Table 1). In run A, no significant differences were observed between all mowing heights at full irrigation levels (1.0 × ETa) (Figure 2). However, at both deficit levels in run A (0.3 and 0.65 × ETa), the average visual quality ratings for both 2.5 cm and 5.0 cm mowing heights were significantly higher than for the 7.5 cm and 10.0 cm mowing heights. Further, both average visual quality ratings fell below the minimum quality threshold (≥5) at the 0.3 × ETa irrigation level for both of the 7.5 cm and 10.0 cm mowing heights. For run B, the same general trend of average visual quality at lower mowing heights (2.5 cm and 5.0 cm) compared to higher mowing heights (7.5 cm and 10.0 cm) was observed. In run B, the 2.5 cm mowing height had a significantly higher average visual quality compared to the 7.5 cm and 10 cm at full irrigation levels (1.0 × ETa). Further, the visual quality was higher at the lower mowing heights (2.5 cm and 5.0 cm) with the lowest deficit irrigation level (0.3 × ETa) compared to the 7.5 cm and 10.0 cm, although the average visual quality did not fall below minimum acceptable levels (≥5) at the higher mowing heights like they did in run A (Figure 2). Shahba et al. (2014) reported lower visual quality at 0.50 × ETa of ‘Salam’ seashore paspalum at a 4.5 cm mowing height compared to 2.5 cm and 3.5 cm; however, ‘Excalibur’ seashore paspalum had a reduced visual quality at the 2.5 cm compared to 3.5 cm and 4.5 cm [15]. Considering most hybrid bermudagrasses are tolerant to mowing heights below 2.5 cm, the relative differences in the present study between the larger range of mowing heights on a hybrid bermudagrass affirm the need for further evaluation at mowing heights lower than 2.5 cm [31].
An analysis of variance also revealed an irrigation level × date interaction for the visual quality (Table 1). When averaging across mowing heights, there was a general decline in visual quality within the deficit treatments compared to the well-watered treatments (1.0 × ETa) in which mean separation occurred after week 2 in run A, and week 3 in run B (Figure 3). Average visual quality of the 0.65 × ETa treatment remained above the minimum quality threshold throughout the study period while average visual quality of the of the lowest deficit level (0.3 × ETa) fell below the minimum quality threshold in week 4 of run A, but not until week 8 in run B (Figure 3). Similar results for greenhouse studies have also been reported in which the average visual quality of ‘Tifway’ bermudagrass irrigated at 0.3 × ETa fell below the minimum quality threshold 6-weeks into the study period [32]. Wherley (2011) reported ‘Empire’ zoysiagrass (Zoysia japonica Steud.) irrigated at 0.20 × ETa drastically fell to below the minimum quality threshold 2–3 weeks into the study period, while the visual quality of the 0.4 × ETa treatment fell below the minimum quality at 5–6 weeks [33].

3.3. Effects of Mowing Height and Deficit Irrigation on Clipping Production

Clipping production showed a significant (p ≤ 0.05) mowing height × irrigation level interaction, along with a significant mowing height × date interaction (Table 1). Since no run effect was observed, the results averaged across run A and B are presented.
A significantly higher clipping production was observed for turfgrass at all irrigation levels for the 2.5 cm and 5.0 cm grass height, compared to 7.5 cm turfgrass at the lowest irrigation level (0.3 × ETa) (Table 2). Further, clipping production was highest for 2.5 cm turfgrass irrigated at well-watered levels and 5 cm turfgrass at the 0.65 × ETa irrigation level, compared to 7.5 cm turfgrass at deficit levels (0.3 and 0.65 × ETa) and the 10 cm turfgrass at all irrigation levels (0.3 and 1.0 × ETa) (Table 2).
While there was a slight increase in clipping production at 4 to 6 weeks, clipping production generally declined for all mowing heights throughout the study period (Figure 4). Further, there were three rating dates in which more clipping production occurred for turfgrass mowed at 2.5 cm compared to 7.5 cm and 10.0 cm, and multiple rating dates in which clipping production was higher for 5.0 cm mowed turfgrass compared to either 7.5 cm or 10 cm mowed turfgrass (Figure 4).
Increased ETa is normally accompanied by increased biomass accumulation as observed in multiple studies [32,33,34]. However, our results show a conflicting trend in which a lower ETa of grasses mowed at lower mowing heights was accompanied by an elevated shoot growth when compared to the higher mowing heights. This difference may be explained by more turbulent gas exchange of bulk air within the higher turfgrass canopies. Therefore, higher canopy resistance between the canopy surface and the bulk air would have occurred at the lower mowing heights, which contributed to a more efficient utilization of water inputs as evidenced through increased visual quality and elevated clipping production.

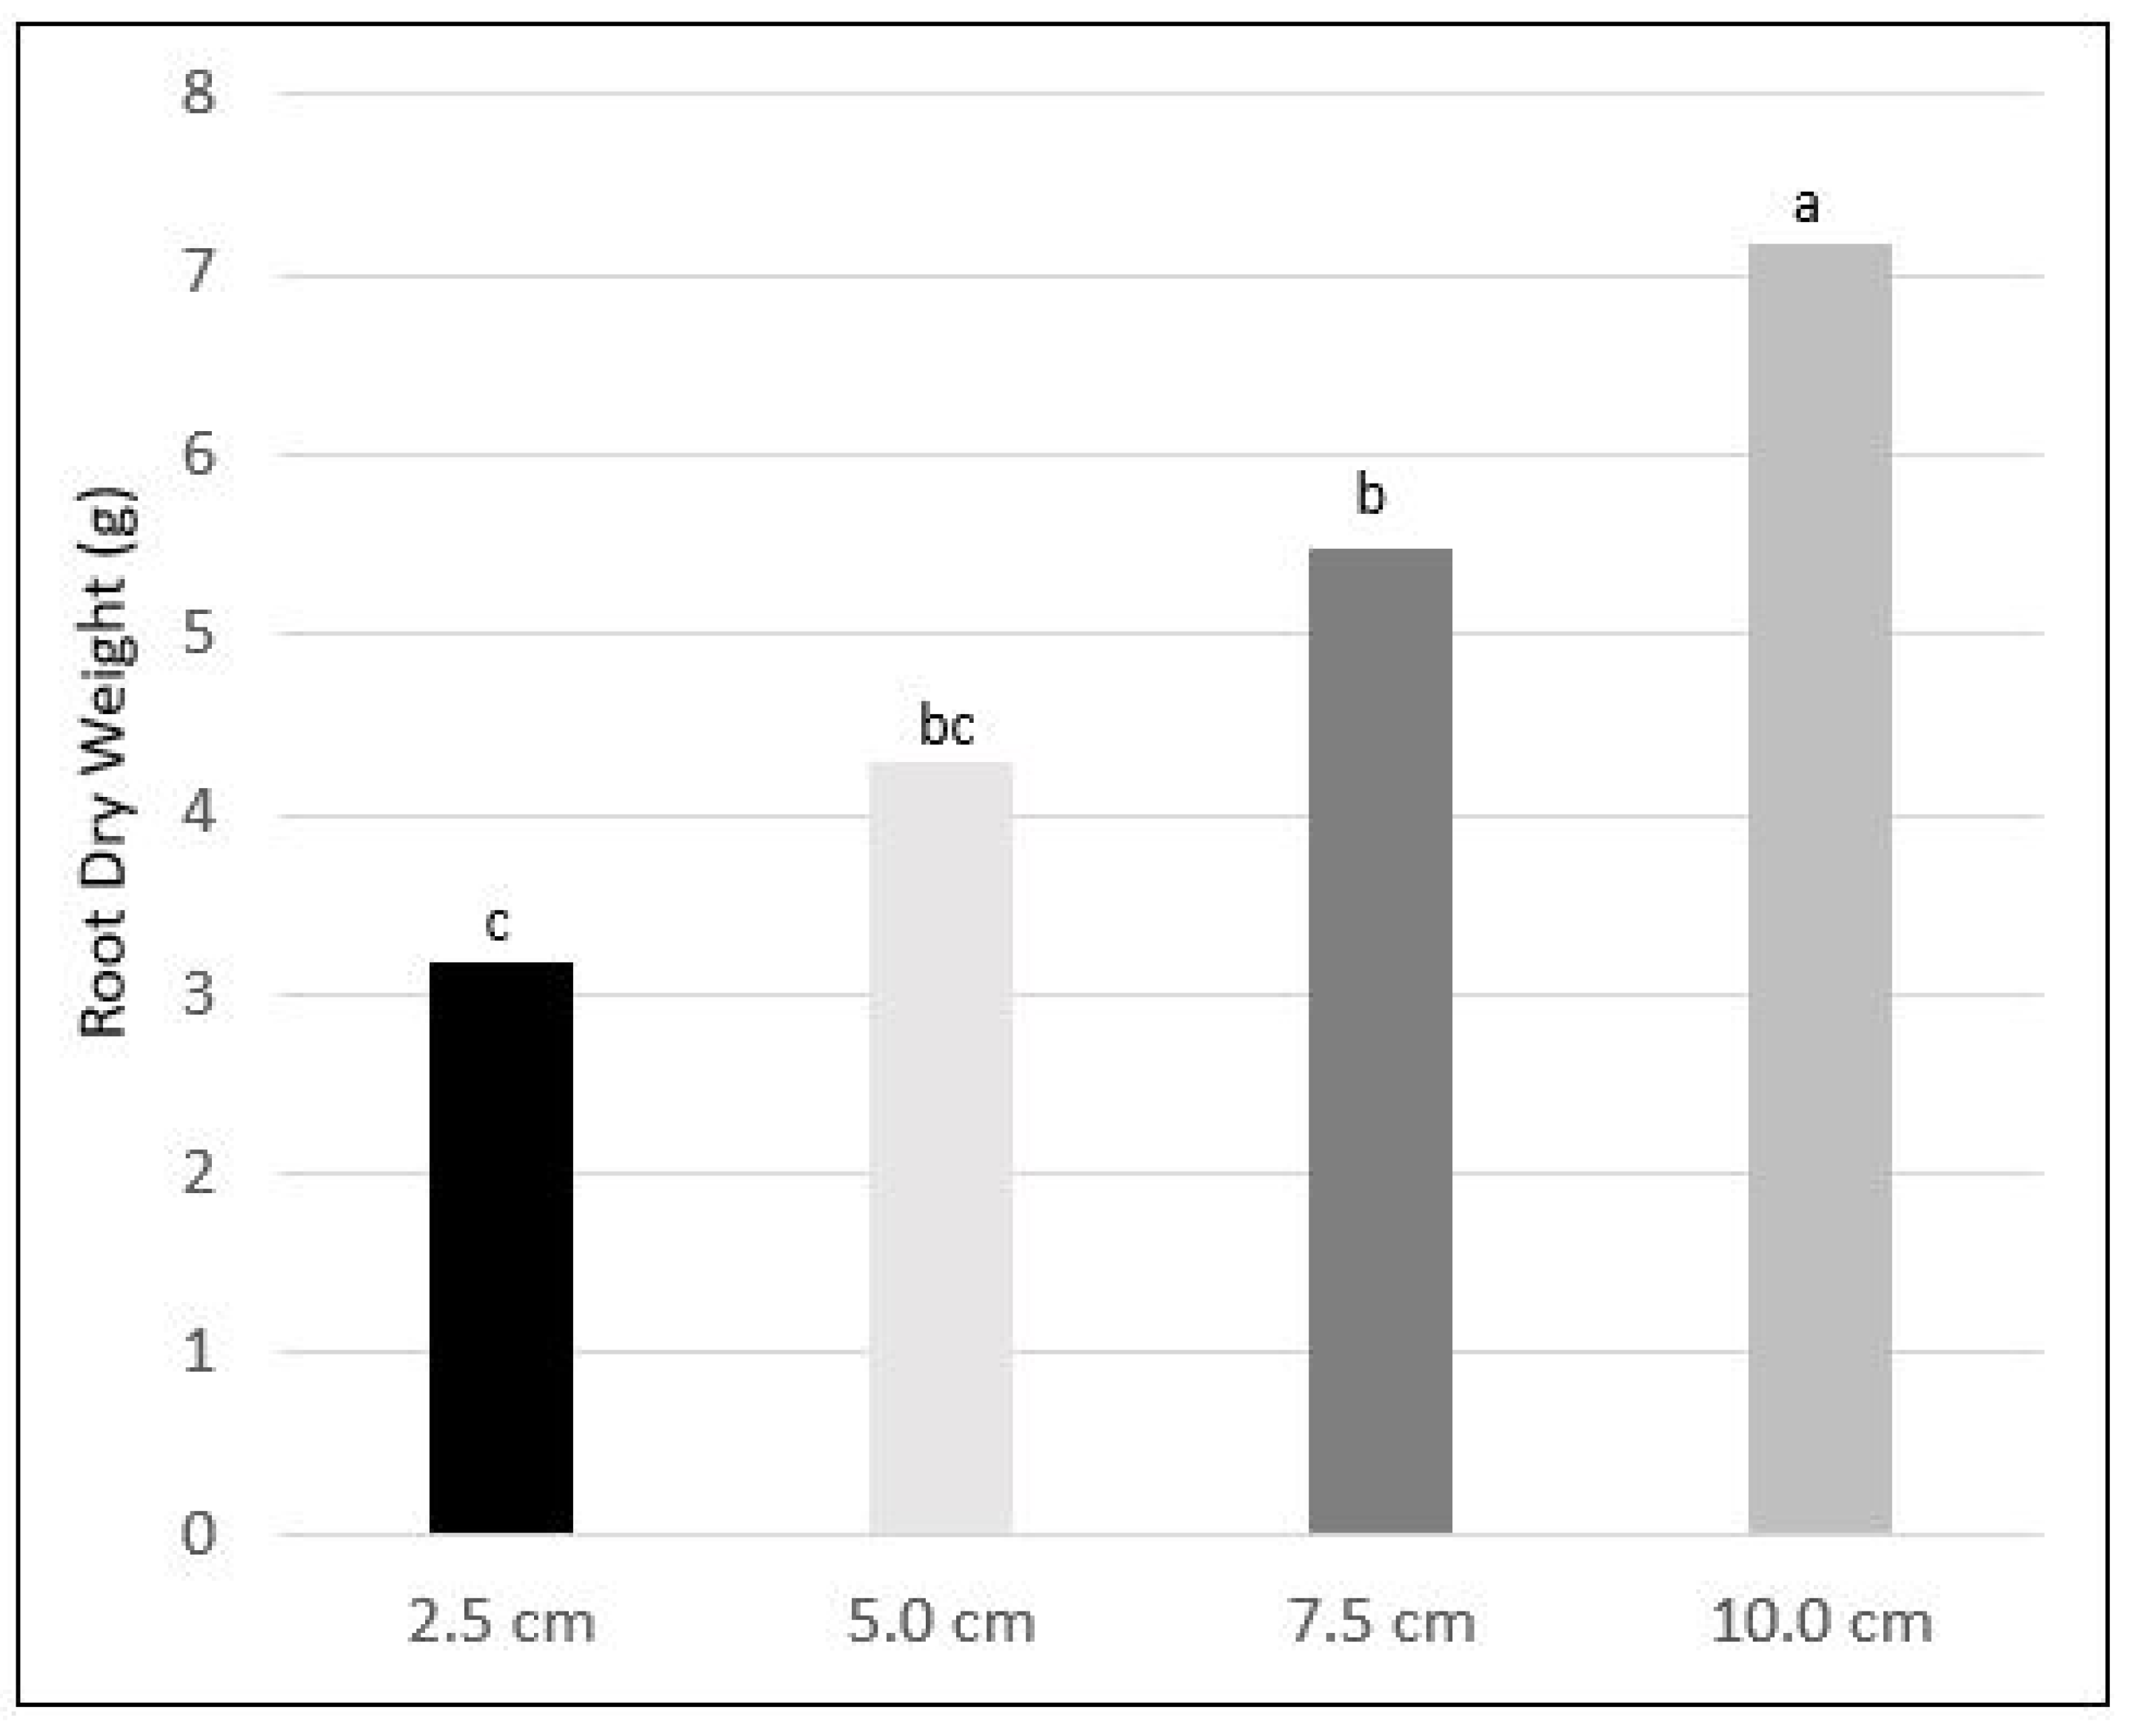
3.4. Mowing Height Effects on Root Dry Weight

For the root dry weight, no run effect was observed so the results are presented as an average across runs. While ANOVA detected no significant differences due to irrigation level, there was a highly significant (p ≤ 0.001) effect for root dry weight due to mowing height (Table 1). When averaging across irrigation level, the root dry weight increased linearly with increased mowing height (Figure 5). Root dry weight was significantly higher at the 10.0 cm mowing height treatment compared to all other mowing heights, and the root dry weight was also significant for the 7.5 cm treatment compared to the 2.5 cm (Figure 5). These results are consistent with prior studies that report that increased root production can accompany higher mowing heights [14]. Increased root biomass with increased cut height is likely due to a greater capacity for photosynthetic activity from an increased leaf surface area [13]. However, this did not lead to increased roots at higher mowing heights in the deficit irrigation treatments, as reported in other studies [15,35]. Given our research was conducted in a soil volume limiting rootzone (limited soil profile), the advantages of higher root development at higher mowing heights could possibly be better realized in nonlimiting soil volume conditions (unlimited soil profile). Thus, a need for similar mowing height studies conducted in field conditions is apparent.

4. Conclusions

As the need for water conservation in turfgrass landscapes increases, it is important to examine how cultural management factors, such as mowing height, influence water use and other critical elements governing growth and quality during deficit irrigation. For bermudagrass landscapes maintained at heights ≥ 2.5 cm, our results indicate a shorter mowing height (≤5 cm) could be favorable for water conservation due to the observed general trend of decreased water use at the lower mowing heights and improved quality and growth responses given deficit irrigation. Improved root production as seen by higher root dry weights at the highest mowing height, highlight the need for similar research conducted under field conditions to evaluate mowing height ranges below 2.5 cm. Further, more information is needed regarding required mowing frequencies and associated costs with management findings.

Author Contributions

Conceptualization, R.W.H.; methodology, R.W.H. and M.M.C.; software, R.W.H. and M.M.C.; validation, R.W.H. and M.M.C.; formal analysis, R.W.H. and M.M.C.; investigation, R.W.H. and M.M.C.; resources, R.W.H., C.F.W., D.D.S. and M.M.C.; data curation, R.W.H. and M.M.C.; writing-original draft preparation, R.W.H.; writing-review and editing, R.W.H., M.M.C., C.F.W. and D.D.S.; visualization, R.W.H., D.D.S. and M.M.C.; supervision, R.W.H. and M.M.C.; project administration, C.F.W., D.D.S. and R.W.H.; funding acquisition, C.F.W., D.D.S. and R.W.H. All authors have read and agreed to the published version of the manuscript.

Funding

This research was part of USDA-ARS National Program 215: Pastures, Forage, and Rangeland Systems.

Data Availability Statement

All data has been included in the main text.

Acknowledgments

The authors wish to express appreciation to Sharette Rockholt for valuable technical support.

Conflicts of Interest

The authors declare no conflicts of interest.

References

  1. Beard, J.B.; Green, R.L. The role of turfgrasses in environmental protection and their benefits to humans. J. Environ. Qual. 1994, 23, 452–460. [Google Scholar] [CrossRef]
  2. Emmons, R. Turfgrass Science and Management; Delmar Publishers: Albany, NY, USA, 1995. [Google Scholar]
  3. Arfanuzzaman, M.; Rahman, A.A. Sustainable water demand management in the face of rapid urbanization and ground water depletion for social-ecological resilience building. Glob. Ecol. Conserv. 2017, 10, 9–22. [Google Scholar] [CrossRef]
  4. Hajek, O.L.; Knapp, A.K. Shifting seasonal patterns of water availability: Ecosystem responses to an unappreciated dimension of climate change. New Phytol. 2021, 233, 119–125. [Google Scholar] [CrossRef]
  5. Hatfield, J. Turfgrass and climate change. Agron. J. 2017, 109, 1708–1718. [Google Scholar] [CrossRef]
  6. Shaddox, T.W.; Unruh, J.B.; Johnson, M.E.; Brown, C.D.; Stacey, G. Water use and management practices on U.S. golf courses. Crop Forage Turf. Manag. 2022, 8, e20182. [Google Scholar] [CrossRef]
  7. Soldat, D.J.; Brosnan, J.T.; Chandra, A.; Gaussoin, R.E.; Kowalewski, A.; Leinauer, B.; Rossi, F.S.; Stier, J.C.; Unruh, J.B. Estimating economic minimums of mowing, fertilizing, and irrigating turfgrass. Agric. Environ. Lett. 2020, 5, e20032. [Google Scholar] [CrossRef]
  8. Huang, B.; Fry, J.D. Turfgrass evapotranspiration. J. Crop Prod. 2000, 2, 317–333. [Google Scholar] [CrossRef]
  9. Biran, I.; Bravdo, B.; Bushkin-Harav, I.; Rawitz, E. Water consumption and growth rate of 11 turfgrasses as affected by mowing height, irrigation frequency, and soil moisture. Agron. J. 1981, 73, 85–90. [Google Scholar] [CrossRef]
  10. Johns, D.; Beard, J.B.; van Bavel, C.H.M. Resistances to evapotranspiration from a St. Augustinegrass turf canopy. Agron. J. 1983, 75, 419–422. [Google Scholar] [CrossRef]
  11. Feldhake, C.M.; Danielson, R.E.; Butler, J.D. Turfgrass evapotranspiration. I. Factors influencing rate in urban environments. Agron. J. 1983, 75, 824–830. [Google Scholar] [CrossRef]
  12. Fry, J.D.; Butler, J.D. Annual bluegrass and creeping bentgrass evapotranspiration rates. HortScience 1989, 24, 268–271. [Google Scholar] [CrossRef]
  13. Beard, J.B. Turfgrass root basics. Turfax 2001, 9, 4–5. [Google Scholar]
  14. Elansary, H.O.; Yessoufou, K. Growth regulators and mowing heights enhance the morphological and physiological performance of seaspray turfgrass drought conditions. Acta Physiol. Plant. 2015, 37, 232. [Google Scholar] [CrossRef]
  15. Shahba, M.A.; Abbas, M.S.; Alshammary, S.F. Drought resistance strategies of seashore paspalum at different mowing heights. HortScience 2014, 49, 221–229. [Google Scholar] [CrossRef]
  16. Zhou, Y.; Lambrides, C.J.; Kearns, R.; Ye, C.; Cao, N.; Fukai, S. Selecting for drought tolerance among Australian green couch grasses (Cynodon spp.). Crop Pasture Sci. 2009, 60, 1175–1183. [Google Scholar] [CrossRef]
  17. Zhou, Y.; Lambrides, C.J.; Kearns, R.; Ye, C.; Fukai, S. Water use, water use efficiency and drought resistance among warm-season turfgrasses in shallow soil profiles. Funct. Plant Biol. 2012, 39, 116–125. [Google Scholar] [CrossRef] [PubMed]
  18. Feldhake, C.M.; Danielson, R.E.; Butler, J.D. Turfgrass evapotranspiration. II. Responses to deficit irrigation. Agron. J. 1984, 76, 85–89. [Google Scholar] [CrossRef]
  19. Braun, R.C.; Bremer, D.J.; Ebdon, J.S.; Fry, J.D.; Patton, A.J. Review of cool-season turfgrass water use and requirements: I. Evapotranspiration and responses to deficit irrigation. Crop Sci. 2022, 62, 1661–1684. [Google Scholar] [CrossRef]
  20. Colmer, T.D.; Barton, L. A review of warm-season turfgrass evapotranspiration, responses to deficit irrigation, and drought resistance. Crop Sci. 2017, 57, S-98–S-110. [Google Scholar] [CrossRef]
  21. Fu, J.; Fry, J.; Huang, B. Minimum water requirements of four turfgrasses in the transition zone. HortScience 2004, 39, 1740–1744. [Google Scholar] [CrossRef]
  22. Allen, R.G.; Pereira, L.S.; Raes, D.; Smith, M. Crop evapotranspiration: Guidelines for computing crop water requirements. In FAO Irrigation and Drainage Paper 56; FAO: Rome, Italy, 1998. [Google Scholar]
  23. Wherley, B.; Dukes, M.D.; Cathey, S.; Miller, G.; Sinclair, T. Consumptive water use and crop coefficients for warm-season turfgrass species in the southeastern United States. Agric. Water Manag. 2015, 156, 10–18. [Google Scholar] [CrossRef]
  24. Wherley, B.; Heitholt, J.; Chandra, A.; Skulkaew, P. Supplemental irrigation requirements of zoysiagrass and bermudagrass cultivars. Crop Sci. 2014, 54, 1823–1831. [Google Scholar] [CrossRef]
  25. Hejl, R.W.; Wherley, B.G.; White, R.H.; Thomas, J.C.; Fontanier, C.H. Deficit irrigation and simulated traffic on ‘Tifway’ bermudagrass summer performance and autumn recovery. Crop Sci. 2016, 56, 809–817. [Google Scholar] [CrossRef]
  26. Banuelos, J.B.; Walworth, J.L.; Brown, P.W.; Kopec, D.M. Deficit irrigation of Seashore Paspalum and Bermudagrass. Agron. J. 2011, 103, 1567–1577. [Google Scholar] [CrossRef]
  27. Hanna, W.W.; Schwartz, B.M. Bermudagrass Named ‘DT-1’. U.S. Patent 27392P2, 15 November 2016. [Google Scholar]
  28. Schwartz, B.M.; Hanna, W.W.; Baxter, L.L.; Raymer, P.L.; Waltz, F.C.; Kowalewski, A.R.; Chandra, A.; Genovesi, D.; Wherley, B.G.; Miller, G.L.; et al. ‘DT-1’, a drought-tolerant triploid turf bermudagrass. HortScience 2018, 53, 1711–1714. [Google Scholar] [CrossRef]
  29. Morris, K.N.; Shearman, R.C. NTEP turfgrass evaluation guidelines. In Proceedings of the NTEP Turfgrass Evaluation Workshop, Beltsville, MD, USA, 17 October 1998; pp. 1–5. Available online: https://www.ntep.org/pdf/ratings.pdf (accessed on 9 October 2023).
  30. Madison, J.H.; Hagan, R.M. Extraction of soil moisture by ‘Merion’ bluegrass (Poa pratensis ‘Merion’) turf, as affected by irrigation frequency, mowing height, and other cultural operations. Agron. J. 1962, 54, 157–160. [Google Scholar] [CrossRef]
  31. Hanna, W.W.; Braman, S.K.; Schwartz, B.M. ‘ST-5’, a shade-tolerant turf bermudagrass. HortScience 2010, 45, 132–134. [Google Scholar] [CrossRef]
  32. Hejl, R.W.; Wherley, B.G.; Thomas, J.C.; White, R.H. Irrigation water quality and trinexapac-ethyl effects on bermudagrass response to deficit irrigation. HortScience 2015, 50, 1081–1087. [Google Scholar] [CrossRef]
  33. Wherley, B. Turfgrass growth, quality, and reflective heat load in response to deficit irrigation practices. In Evapotranspiration; Labedzki, L., Ed.; InTech: Rijeka, Croatia, 2011; pp. 419–430. [Google Scholar]
  34. Hejl, R.W.; Williams, C.F.; Monaco, T.A.; Serba, D.D.; Conley, M.M. Hybrid bermudagrass responses to impaired water sources. HortScience 2023, 58, 907–914. [Google Scholar] [CrossRef]
  35. Dernoeden, P.H.; Butler, J.D. Drought resistance of Kentucky bluegrass cultivars. HortScience 1978, 13, 667–668. [Google Scholar] [CrossRef]
Figure 1. Daily evapotranspiration (ETa) of ‘TifTuf’ bermudagrass as affected by mowing height during run A and B for the well-watered treament. Bars with the same letter for either run A or run B are not significantly different based on Tukey’s HSD at p ≤ 0.05.
Agronomy 14 00628 g001
Figure 2. Visual quality as affected by mowing height and irrigation levels averaged across all rating dates for both run A and B. Bars with the same letter for either run A or run B are not significantly different based on Tukey’s HSD at p ≤ 0.05. A solid horizontal line denotes the minimum acceptable quality.
Agronomy 14 00628 g002
Figure 3. Visual turfgrass quality as affected by irrigation level averaged across mowing heights for both run A and B. Bars represent standard error. Solid horizontal line denotes minimum acceptable quality. ns denotes nonsignificant at p ≤ 0.05.
Agronomy 14 00628 g003
Figure 4. Turfgrass clipping production averaged across both run A and B as affected by mowing height. Bars represent standard error. ns denotes nonsignificant at p ≤ 0.05.
Agronomy 14 00628 g004
Figure 5. Root dry weight averaged across both run A and B as affected by mowing height. Bars with the same letter are not significantly different based on Tukey’s HSD at p ≤ 0.05.
Agronomy 14 00628 g005
Table 1. ANOVA table for mowing height, irrigation level, and measuring date effects on evapotranspiration, visual quality, clipping production, and root dry weight for run A and B.
p Values
EvapotranspirationVisual QualityClipping
Production
Root
Dry wt
ABAB
Mowing (M)******************
Irrigation (I)--*********NS
Date (D)***************-
M × I--*******NS
M × DNSNSNSNSNS-
I × D--*******-
M × I × D--NSNSNS-
Parameters were separated by study where a main study effect was found. NS, *, *** Nonsignificant or significant at p ≤ 0.05 or 0.001, respectively.
Table 2. Turfgrass clipping production as affected by mowing height and irrigation level averaged across run A and run B. Means with the same letter are not significantly different based on Tukey’s HSD at p ≤ 0.05.
Mowing
Height
Irrigation
Level
Clipping Production
(mg d−1)
2.5 cm1.0 × ETa31.77 a
0.65 × ETa31.05 ab
0.30 × ETa 27.34 a–c
5.0 cm1.0 × ETa28.29 a–c
0.65 × ETa31.96 a
0.30 × ETa 24.34 a–c
7.5 cm1.0 × ETa24.71 a–c
0.65 × ETa21.83 cd
0.30 × ETa 15.39 d
10.0 cm1.0 × ETa23.40 bc
0.65 × ETa21.54 cd
0.30 × ETa 23.19 c
p value *
*, significant at p ≤ 0.05.
Disclaimer/Publisher’s Note: The statements, opinions and data contained in all publications are solely those of the individual author(s) and contributor(s) and not of MDPI and/or the editor(s). MDPI and/or the editor(s) disclaim responsibility for any injury to people or property resulting from any ideas, methods, instructions or products referred to in the content.

