Abstract
Fungal spores that cause infectious fungal diseases in rice are mainly transmitted through air. The existing fixed, portable or vehicle-mounted fungal spore collection devices used for rice infectious diseases have several disadvantages, such as low efficiency, large volume, low precision and incomplete information. In this study, a mobile fungal spore collection device is designed, consisting of six filters called “Capture-A”, which can collect spores and other airborne particles onto a filter located on a rotating disc of six filters that can be rotated to a position allowing for the capture of six individual samples. They are captured one at a time and designed and validated by capturing spores above the rice field, and the parameters of the key components of the collector are optimized through fluid simulation and verification experiments. The parameter combination of the “Capturer-A” in the best working state is as follows: sampling vessel filter screen with aperture size of 0.150 mm, bent air duct with inner diameter of 20 mm, negative pressure fan with 1500 Pa and spore sampling of cylindrical shape. In the field test, the self-developed “Capturer-A” was compared with the existing “YFBZ3” (mobile spore collection device made by Yunfei Co., Ltd., Zhengzhou, China). The two devices were experimented on at 15 sampling points in three diseased rice fields, and the samples were examined and counted under a microscope in the laboratory. It was found that the spores of rice blast disease and rice flax spot disease of rice were contained in the samples; the number of samples collected by a single sampling vessel of “Capturer-A” was about twice that of the device “YFBZ3”in the test.
1. Introduction
More than 50 kinds of rice fungal diseases, 6 kinds of bacterial diseases, 11 kinds of viral and mycoplasmosis, and 4 kinds of nematode diseases have been found in China [1,2,3]. The common diseases mainly include rice blast, sheath blight, white leaf blight, flax spot, rice stalk, rice grain smut and bad seedling [4,5,6]. The infection of rice by airborne spores is an important factor causing rice infection [5,7,8,9]. The determination of spores in the air is an indispensable part in the analysis of the degree of disease occurrence, early warning and prevention [10,11,12,13]. To monitor the process of airborne sporogenesis, it is necessary to have an effective collection device to monitor the temporal and spatial dynamics of pathogens [11,12,14,15].
The collection technology of rice fungal spores is the basis of pathogen identification and monitoring, as well as the premise of disease control [16,17]. The traditional devices for acquiring microorganisms such as rice infectious fungal spores are large and heavy, as shown in Table 1 [18,19]. The efficiency of the existing mobile spore collection device is low, and only one sample can be collected at a time, which cannot meet the requirements of efficient and intelligent modern agriculture [20,21]. In view of the problems of the existing spore capture instruments, the work efficiency and application range of the spore capture instrument need to be improved [22,23].

Table 1.
Specifications of existing spore collection devices used in China.
There are several potential aspects that can be considered:
- (1)
- Lighter weight and smaller sizes need to be adopted to make the spore collection device smaller and more lightweight [24,25,26,27].
- (2)
- The existing fixed spore capture equipment can obtain spores in glass slides, Eisenhoff bottles, scotch tape or bottle containers (as shown in Table 1), and the design of sample carriers also has room for research [28,29].
- (3)
- We improve the work efficiency of mobile spore collection device by enhancing the ability of a single device that supports multiple sample collection tasks [21,30].
- (4)
- Integrating with contemporary UAV technology, the development of versatile mobile spore collection devices broadens the utility of spore capture devices [31,32,33].
In order to improve the collection effectiveness of rice infectious fungal spores, and explore a rice infectious fungal spores collection device suitable to be mounted on UAV, this study proposes a design scheme of a mobile rice infectious fungal spore collection device named “Capturer-A”, which uses air flow to collect biological particles, such as spores, onto filters. In this study, the features of key components of the developed device were simulated, and the key parameters affected were analyzed and optimized.
2. Working Principle and Structure Design of Spore Collection Device
To collect the rice fungal spores more efficiently, a UAV-borne mobile collecting device named “Capturer-A” was designed according to the characteristics of spores [19]. “Capturer-A” is mainly composed of air intake, sample collection vessel cover, sample collection vessel shell, fan and turntable shell, motor and microprocessor shell, sample collection filter vessel, spore sample filter vessel-positioning turntable, angle-positioning motor, bent air duct, negative-pressure fan, air outlet, microprocessor, motor and battery, etc., as shown in Figure 1.
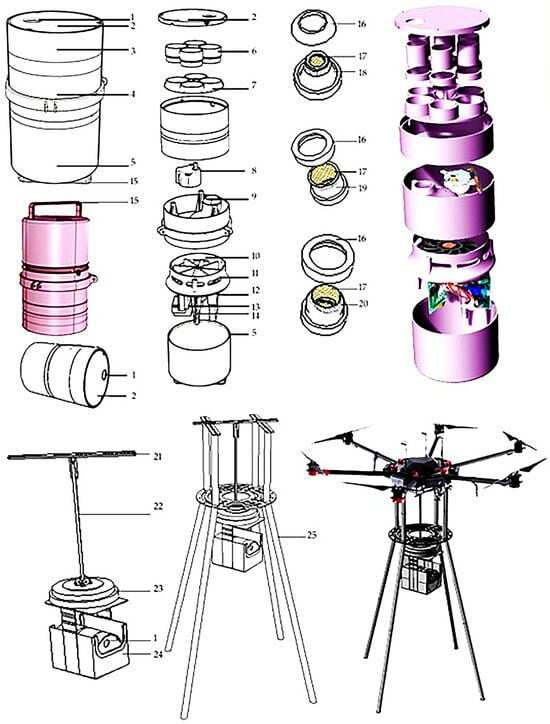
Figure 1.
Structure diagram of the fungal spore collection device. Note: 1. air intake; 2. sample collection cover; 3. sample collection shell; 4. fan and turntable shell; 5. motor and microprocessor shell; 6. spore collection; 7. spore sample filter-positioning turntable; 8. angle-positioning motor; 9. bent air duct; 10. negative-pressure fan; 11. air outlet; 12. microprocessor; 13. motor; 14. battery; 15. lifting handle; 16. screen-fixing cover; 17. sample screen; 18. truncated cone sampling; 19. cylindrical sampling; 20. hemisphere-shaped sampling; 21. aluminum alloy beam; 22. electric telescopic rod; 23. electric turntable; 24. waterproof frame; 25. aluminum alloy bracket.
The negative-pressure fan rotates to form negative pressure in the capture bin, and the air containing spores outside is inhaled by the air intake, through the air duct and the filter vessel, and the spores and other microbial particles will be attached to the filter of the filter vessel, so as to complete the capture of spores. After completing the sample collection, the filter vessel is rinsed with pure water in the laboratory; then, the fungal spores can be further observed and analyzed.
The workflow of the field experiment of the UAV-borne mobile rice fungal spore collection device is as follows:
(1) The rice fungal spore collection device starts to work at a fixed position in the field. The device uses suction to sample airborne particles such as spores in the air into the first filter vessel through a negative-pressure fan.
(2) When the fungal spore collection device is transferred to the second collection point, the filter flow vessels changed to the second air filter for the collection of fungal spores.
(3) When the working process needs to enter the next collection point, it is necessary to switch the sample collection filter through the remote control or timer for sample collection.
3. Design and Simulation of Key Components of the Fungal Spore Collection Device
Since the sample collection efficiency may be affected by several main factors, this study analyzed different simulation results of the “Capturer-A”, assessing the following effects: inner diameter of bent air duct, wind pressure, sample filter vessel shape and aperture size of sampling vessel filter screen. Microbial particles in paddy fields include inorganic particles, organic particles and a small number of mixed particles, which usually exist in the form of dust in the crown of rice, with a diameter of about 0.001 μm to 10 μm. The simulation process is described below.
3.1. Simulation of Inner Diameter of Bent Air Duct
Since the key step of collecting spores in the “Capturer-A” is that the air containing spores is sucked by negative-pressure wind into the sampling vessels with filter nets through the bent air duct, the diameter of the bent air duct has a certain influence on the collection efficiency of “Capturer-A”. Due to the limited overall size of “Capturer-A”, the space to accommodate the bent air duct is limited, and the shape of the bent air duct will change slightly due to the size change, which has a certain impact on its spore-catching ability. ANSYS 23 (ANSYS Inc., Canonsburg, PA, USA) was used to simulate the inner diameter of the bent air duct in “Capturer-A”. By establishing a simplified model to compare and simulate the bent air duct with different diameters, the flow field changes of “Capturer-A” during operation were analyzed, and the optimal inner diameter of the bent air duct was determined.
The velocity cloud of the flow simulation situation with the inner diameter of the bent air duct of 15 mm is shown in Figure 2a. It can be found that the maximum velocity is mainly concentrated at the waist of the bend and the exit, and the velocity begins to increase from the waist. Changes in the mass flow at the outlet monitored during the simulation calculation are shown in Figure 3. It can be seen that the minimum flow at the outlet is 4.633 L/min. This value is maintained when the calculation conditions are stable.
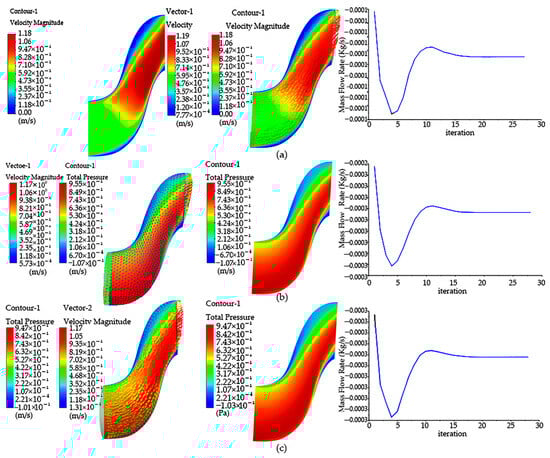
Figure 2.
Compare and simulate the bent air duct of different diameters: (a) velocity cloud image, pressure cloud image and outlet mass flow image of bent air duct of 15 mm; (b) velocity cloud image, pressure cloud image and outlet mass flow image of bent air duct of 20 mm diameters; (c) velocity cloud image, pressure cloud image and outlet mass flow image of bent air duct of 25 mm diameters.
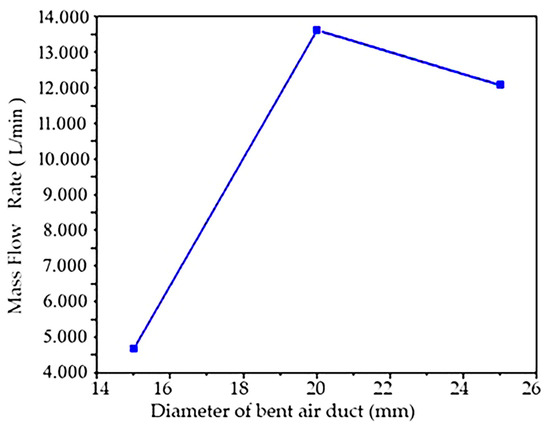
Figure 3.
Numerical simulation of the influence of diameter variable on air flow rate.
A simulation of the flow field with an inner diameter of 20 mm of the bent air duct is shown in Figure 2b. It can be seen from the cloud image that the flow field pressure increases from the entrance, and the flow speed is mainly concentrated at the exit. When other conditions remain unchanged, it can be found that the maximum velocity is the smallest compared with that of 15 mm, but through the outlet flow ratio, it is found that the outlet mass flow of 20 mm with an inner diameter is about 13.693 L/min, and the outlet mass result of the bent air duct with an inner diameter of 20 mm is greater.
A simulation of the flow field with the bent air duct with an inner diameter of 25 mm is shown in Figure 2c. It can be seen from the cloud image that the flow field pressure increases from the entrance, and the flow speed is mainly concentrated at the exit. If other conditions remain constant, compared with bent air ducts with an inner diameter of 25 mm and 20 mm, it can be found that the corresponding bent air duct with an inner diameter of 25 mm whose maximum velocity is less than 20 mm has the same velocity as a diameter of 20 mm. However, through the outlet flow ratio, it is found that the outlet mass flow of the bent air duct with an inner diameter of 25 mm is about 13.216 L/min, and the result of the bent air duct with an inner diameter of 25 mm is very close to the outlet mass of the bent air duct with an inner diameter of 20 mm.
In order to compare the air flow state under different diameters more accurately, other variables can be kept consistent through numerical simulation, as shown in Figure 3. Only the influence of diameter variables on the air flow rate was simulated and studied, while other variables remained unchanged. Three kinds of bent air ducts with different inner diameters were designed, and the influence of diameter on air flow was analyzed through the mass ratio of the outlet.
From Figure 3, it can be seen that the suction mass flow of the bent air duct with an inner diameter of 20 mm and 25 mm is much higher than that of 15 mm, and the outlet mass flow of the bent air duct with an inner diameter of 20 mm and 25 mm is very similar; the outlet mass flow of the bent air duct with an inner diameter of 20 mm is slightly higher than the outlet mass flow of the bent air duct with an inner diameter of 25 mm, so an inner diameter of 20 mm was selected as the optimal diameter.
3.2. Simulation Analysis of the Wind Speed of Fungal Spore Collection Device
In order to verify the influence of the parameters of the negative-pressure fan on the spore sample collection effect of the equipment, the sampling effect of the negative-pressure fan working under different wind pressures was simulated and analyzed in this study. ANSYS 23 (ANSYS Inc., Canonsburg, Pennsylvania, America) was used to simulate the air flow during the negative fan of the “Capturer-A” operation, pressure distribution cloud diagram and the velocity distribution cloud diagram (Figure 3). Since the above simulation results show that the bent air duct with a diameter of 20 mm is the most efficient, in order to ensure the compatibility of “Capturer-A”, the interior diameter of the sampling vessel is consistent with the diversion duct with an inner diameter of 20 mm.
In order to simulate accurately and conveniently, a simplified model of the “Capturer-A” was built in Workbench in advance. The simplified model only retains important components, such as negative-pressure fan, air duct and sample collection filter vessel. The performance of the whole device can be evaluated through simulation analysis of the simplified model.
In this simulation, a turbulent model was adopted for simulation. In this model, the turbulent kinetic energy k and turbulent dissipation rate ε are defined as:
The turbulent viscosity can be expressed as a function of k and ε, namely:
Cμ is the empirical constant, where the transport equation for k and is:
where C1ε = 1.44, C2ε = 1.92, Cμ = 0.09, δk = 1.0, δε = 1.3.
The standard model is a complete turbulence model, which is mainly used to solve the turbulence core region. For the solution of the region near the wall where turbulence is not fully developed, the wall function method needs to be adopted:
The change in wind pressure, temperature and humidity will affect the density of air. When the temperature is 20 °C, the absolute pressure is 760 mmHg, and this state is generally 1.293 kg. In this study, due to the high humidity of the air collected in the rice field and the possibility of a small amount of dust in the rice cluster, the air density ρ = 1.295 kg/m3. If the wind pressure of the negative-pressure fan is represented by N, the wind speed of the negative-pressure fan is represented by V, the rotation speed of the negative-pressure fan is represented by Y and the fan blade length is represented by J; then, the wind speed is converted to wind pressure by the following formula:
The formula of rotation speed of the negative-pressure fan is:
By fitting the relationship data between velocity and pressure difference, the fitting graph shown in Figure 4 is obtained. Because the microbial particles suspended in the air move in a Boolean manner in a small area in the absence of wind, when the negative-pressure fan of the device does not work, there is also a small air flow inside the device in the absence of wind. When the negative-pressure fan of the equipment is working, the microbial particles suspended in the air will move in a large range when there is wind action.
Figure 4.
Fitting graph of speed of negative-pressure fan and wind pressure.
Through the setting of boundary conditions, the simulation results of the model were analyzed when the negative fan was not working, as shown in Figure 5. According to the cloud image analysis obtained through the simulation results in the figure, when the negative-pressure fan of the spore collection device does not rotate, the flow rate in the suction movement channel can pass through the bent air channel, and the maximum flow rate appears near the lower exit. The entire static suction motion obstructs the fluid in the device channel, causing it to flow around the phenomenon, and the velocity behind the movement is very small. In the case that the front negative-pressure fan does not rotate, the fluid can only pass through one inlet, and the device cannot complete the spore collection work.
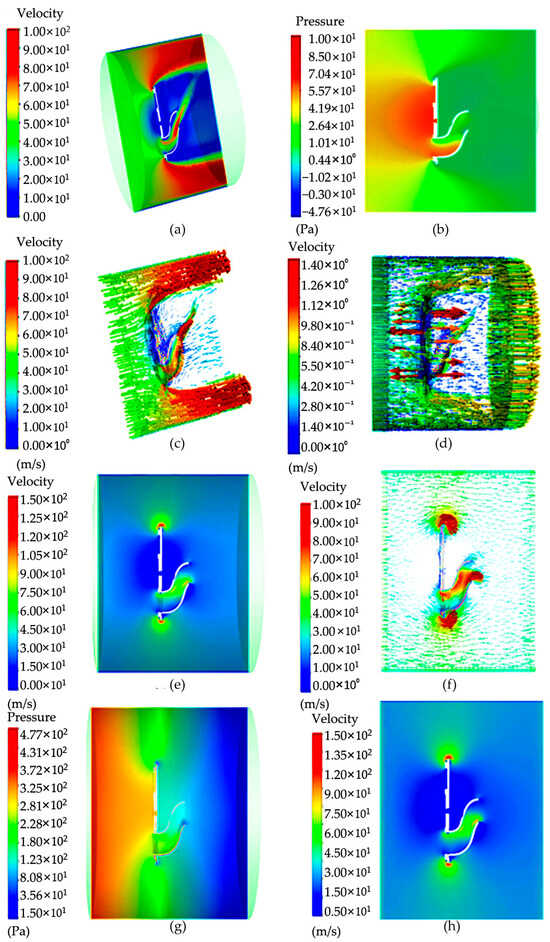
Figure 5.
Pressure and velocity distribution cloud diagram: (a) velocity cloud image inside the “Capturer-A” before the negative-pressure fan starts; (b) pressure image inside the “Capturer-A” when the negative-pressure fan starts; (c) velocity vector image inside the “Capturer-A” when the negative-pressure fan starts; (d) velocity cloud image inside the “Capturer-A” when the negative-pressure fan starts; (e) velocity cloud image inside the “Capturer-A” after the negative-pressure fan starts; (f) vector velocity image inside the “Capturer-A” after the negative-pressure fan starts; (g) pressure cloud image; (h) cross-section pressure image inside the “Capturer-A” after the negative-pressure fan starts.
The analysis of model simulation results during fan rotation is shown in Figure 5. As can be seen from the pressure cloud map, the maximum pressure is mainly concentrated in the front of the moving negative-pressure fan, and there is no large pressure on the back. Combining the flow velocity cloud image and the pressure cloud image, it can be seen that this is mainly due to the lack of rotation in the front disk, so this non-uniformity appears. Through the above simulation of the non-rotating negative-pressure fan, it is found that the flow field before and after the fan is not uniform. Now, the fixed disc of the six filter slots in front of the movement rotates, and the negative-pressure fan rotates at a speed of 5000 revolutions per minute; that is, when the wind speed is 2.62 m/s, cloud image data can be obtained. There is no large speed distribution phenomenon at the top of the movement of the spore collection device, only a small part of local movement. There is no obvious large jet phenomenon in the bent duct, and the speed becomes smaller. At the same time, in order to obtain the data change diagram, a straight line is drawn at the movement position of the negative-pressure fan, and the simple model of “Capturer-A” is observed by the speed and pressure changes on the straight line. Through the data monitoring chart, it can be found that the maximum peak speed appears at both ends of the fixed turntable of the filter vessel. In the cloud image, the flow rate corresponds to the maximum position, and there is symmetry.
From the results, when the negative-pressure fan works, the internal pressure of the device is negative, and the bent air duct of the on-site spore-trapping device will produce negative pressure, so that the outside air is forced into the bent air duct, and the surrounding air is absorbed into the bent air duct, so as to achieve the effect of inhaling spores. From the cloud image, it can be seen that the speed and pressure are relatively high only at a short distance in front of the tube outlet, indicating that if the tube outlet of the device is far from the spores, it may not be able to create air flow delivering spores or guide the spores into the tube. In order to solve this problem, the speed of the fan can be increased, and the attraction range of the outlet of the bent air duct can be expanded.
It can be seen from the results that when the negative-pressure fan of the spore collection device rotates, the bent air duct of the rice fungus spore-sampling device will produce negative pressure, so that the outside air will be forced into the bent air duct, so as to achieve the effect of inhaling spores. From the velocity cloud map, it can be seen that the gas pressure in the bent air duct line reaches 450–1500 Pa, which is enough to adsorb spores in the bent air duct line. However, it can be seen from the cloud image that the speed and pressure of the bent air duct entrance are relatively high only at a short distance in front of the bent air duct entrance, which indicates that if the bent air duct entrance of the device is far from the spores, it may not be possible to guide the spores into it. In order to solve this problem, the speed of the fan can be increased, and the attraction range of the bent air duct hole can be expanded.
3.3. Simulation of Sample Filter Vessel Shape
In order to verify the influence of the shapes of the sampling vessels on the spore sample collection effect of “Capturer-A”, this study simulated the working state and working effect of different shapes of sampling vessels. According to the actual filter model settings, the geometric model is established by Workbench (ANSYS Inc., Canonsburg, PA, USA). Since the above simulation results show that the bent air duct with a diameter of 20 mm is the most efficient, in order to ensure the compatibility of “Capturer-A”, the interior diameter of the sampling vessel is consistent with the diversion duct with an inner diameter of 20 mm. The exterior diameter of the sampling vessel cylinder is 22 mm, and the interior diameter sampling vessel cylinder is 20 mm. The truncated cone sampling collection vessels with filter nets were installed in an inverted way; the top exterior diameter was 22 mm, the top interior diameter was 20 mm, the bottom exterior diameter was 18 mm and the bottom interior diameter was 16 mm. The model consists of three parts: inlet fluid region, porous media region and outlet fluid region.
For meshing of the above model, Fluent meshing is used as the meshing tool, and the mesh is a polyhedral mesh. In practice, the problem of porous media is often encountered, such as filter containers, filters, soil, air, etc., which is characterized by a large number of geometric pores. This problem is usually simplified in fluid simulation calculation, and the porous region is simplified to the fluid region with increased resistance source, thus avoiding the trouble of establishing porous geometry. The air sample in this study also belongs to porous media, and the simplified method usually provides a velocity-dependent momentum source in the porous region, which is expressed as:
Si is the source term of the momentum equation in the i (x, y, z) direction; V is the speed value; D and C are the specified matrices. In the formula, the first term on the right is the viscosity loss term, and the second term is the inertia loss term.
For uniform porous media, it can be rewritten as:
α is permeability; C2 is the inertial drag coefficient. The matrix D is 1/α. The momentum acts on the fluid to create a pressure gradient,
Δn is the thickness of the porous media domain. If the above two formulas are connected, they can be uniformly expressed as the following formula:
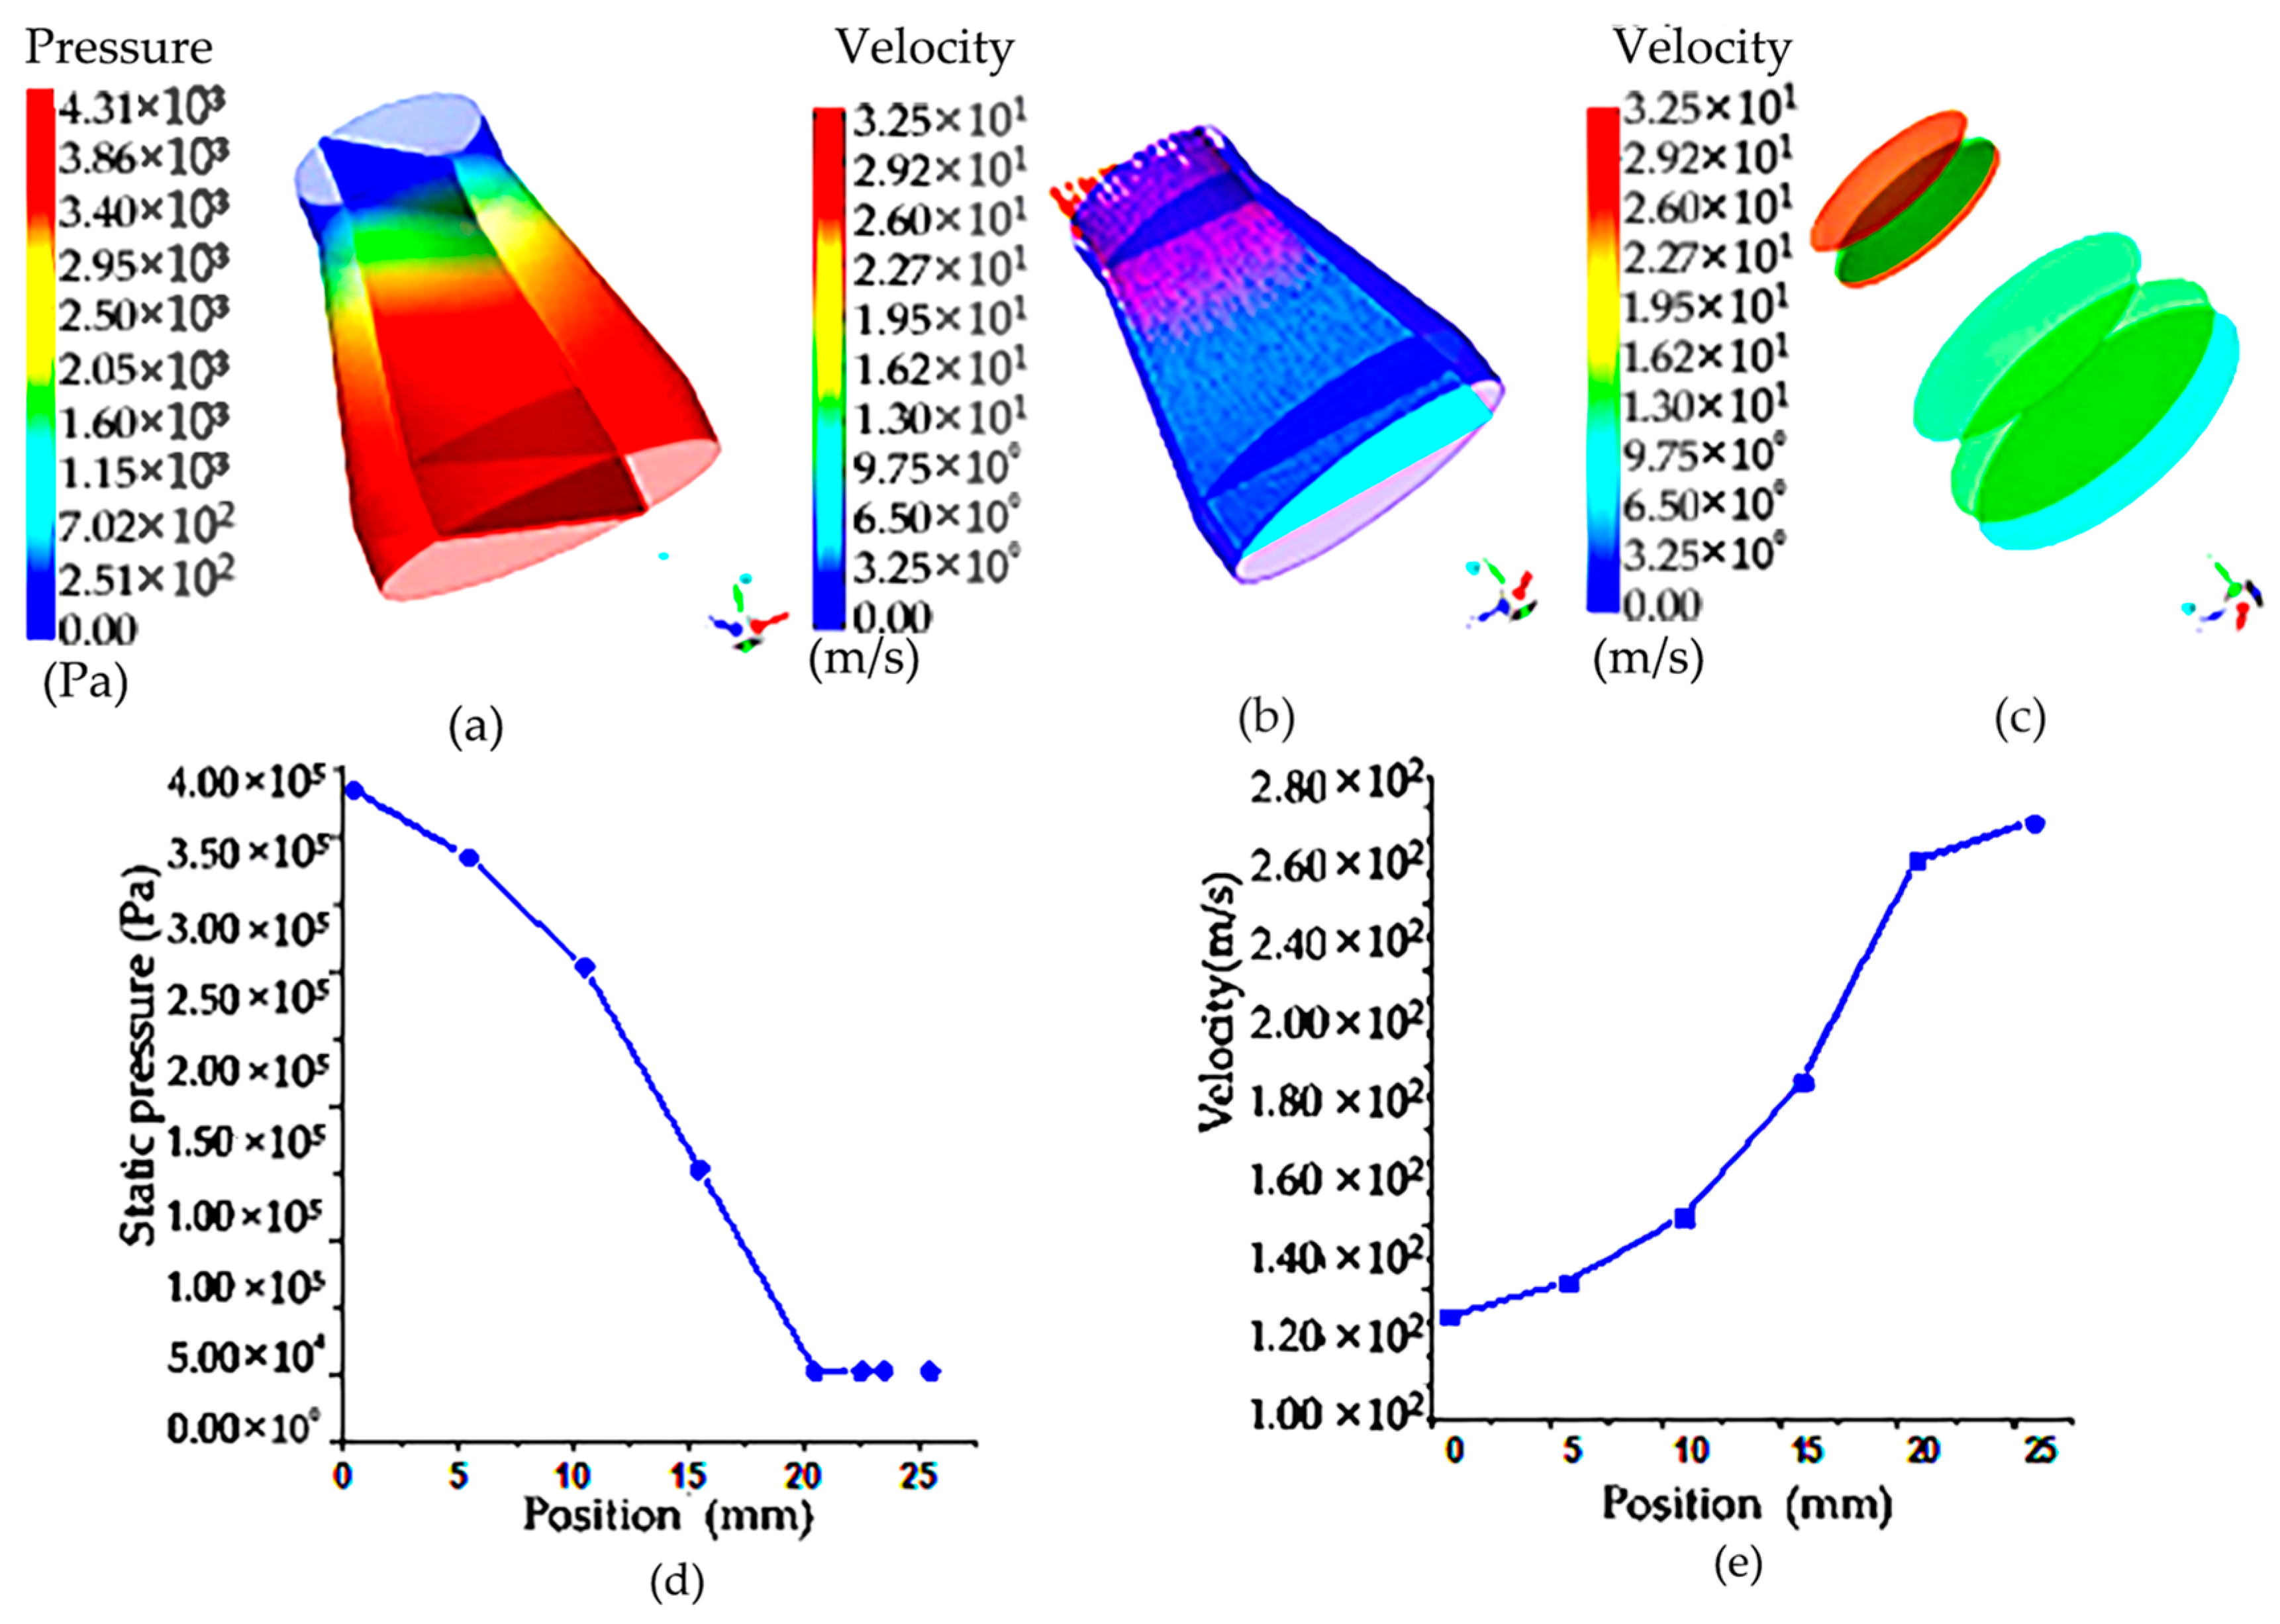
From the flow field velocity cloud in Figure 6, it can be seen that because the sample filter vessel of the circular table is inverted on the rotary table, the inlet is large, and the outlet radius is small, so it can be seen that in the sample filter vessel of the circular table shape, the existence of porous media will cause the velocity distribution in this hierarchical gradient, and there is a velocity difference. From the flow rate area product flow formula, it can be seen that the outlet diameter becomes smaller and the velocity increases, so even if there is a porous medium obstruction, the air in the roundtable shape of the filter net still has the maximum speed at the outlet. Figure 6a is a velocity distribution cloud map of the porous media model on different sections corresponding to the circular platform, and it can be seen that the maximum velocity reaches 300 m/s.

Figure 6.
Pressure cloud diagram and cloud image of upstream field and velocity at different sections of the truncated cone sampling vessel with filter net: (a) pressure cloud image of truncated cone sampling vessel with a filter net; (b) velocity cloud image of truncated cone sampling vessel with a filter net; (c) velocity cloud image of flow field on different sections of truncated cone sampling with a filter net; (d) pressure distribution on the symmetric line of truncated cone sampling vessel with a filter net; (e) velocity distribution on the symmetric line of truncated cone sampling vessel with a filter net.
According to the pressure distribution cloud map in the circular platform porous media model, the existence of porous areas makes the pressure drop obvious. The maximum pressure at the entrance is 400,000 Pa, the pressure in the middle is 240,000 Pa and the pressure drop is 160,000 Pa. As can be seen from the velocity and pressure distribution diagram on the symmetric line in Figure 6b, the velocity on the symmetric line gradually increases with the position change, but the pressure decreases along the symmetric line. To sum up, it can be seen that because of the shape of the filter net, the outlet flow rate is large, and the influence of the porous area on it is not very large. Compared with the cylindrical shape, the porous area is not dominant, and the cylindrical shape of the filter net is dominant.
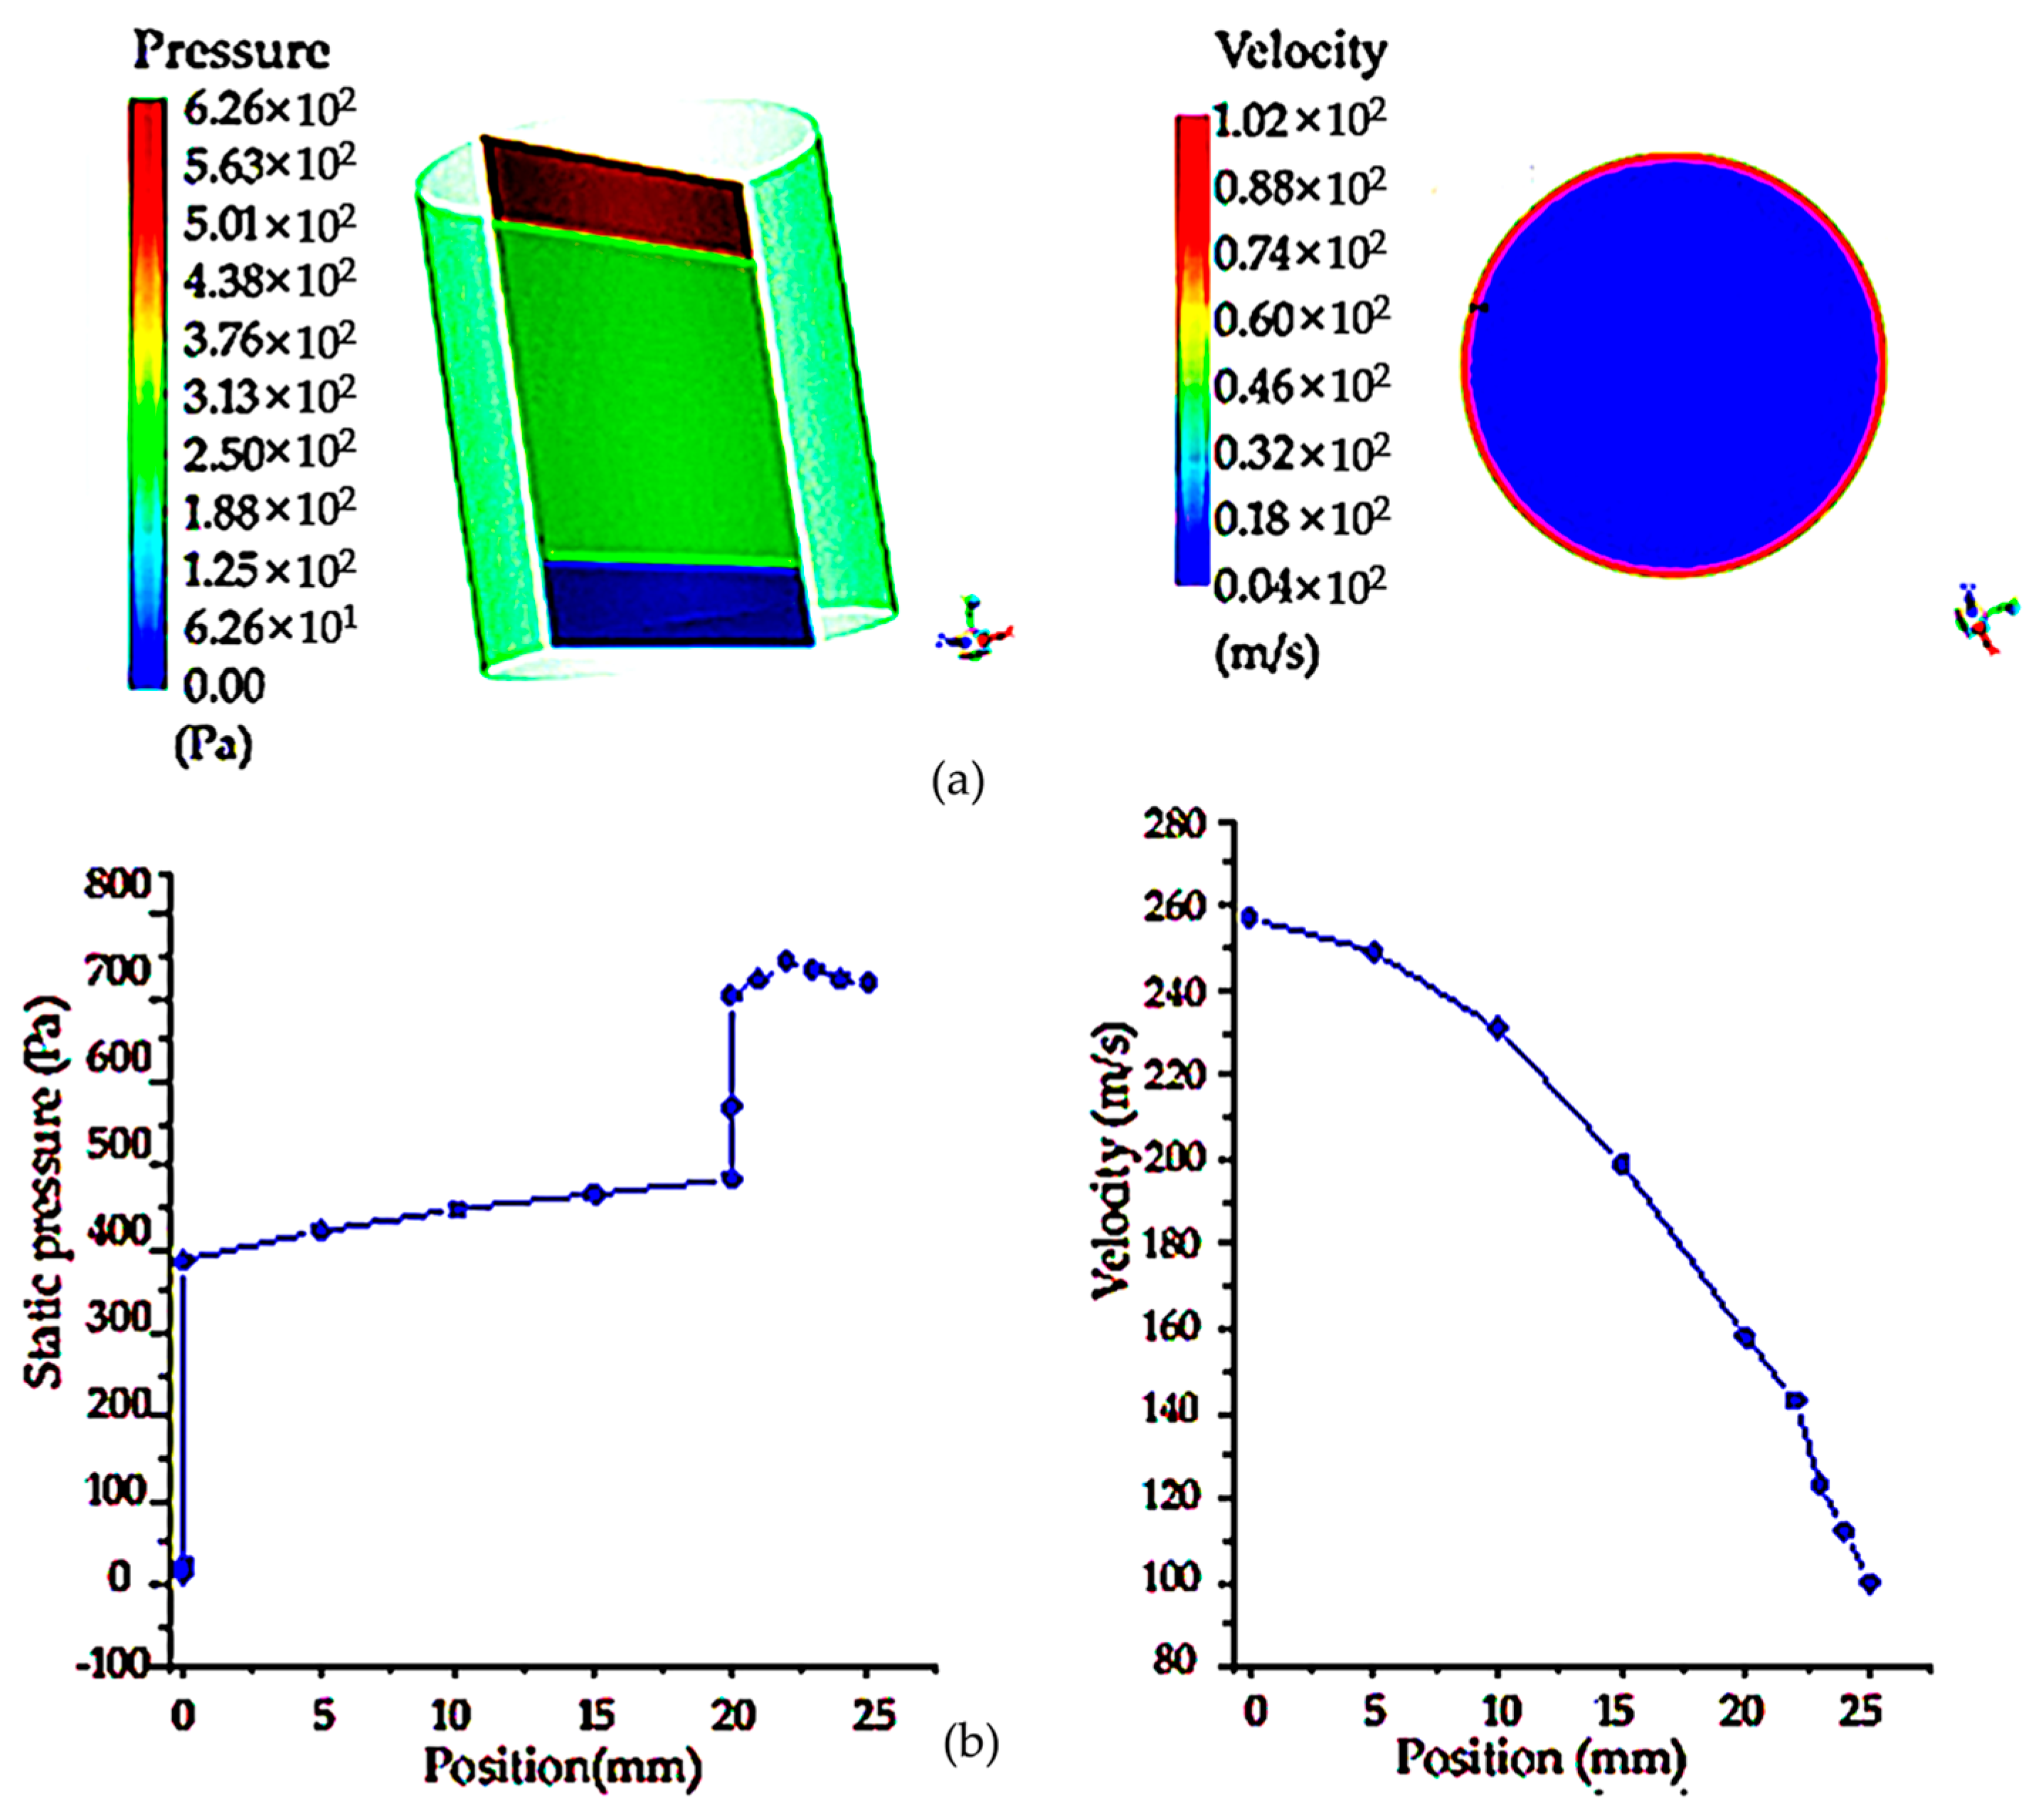
The following is the simulation analysis of the cylindrical filter net. Because the section size and radius of the entrance and exit of the cylinder are the same, the pressure distribution cloud map shows that the existence of porous areas makes the pressure drop obvious. The maximum pressure at the entrance is 30,000 Pa, and the pressure drop at the middle is 18,000 Pa. However, due to the existence of porous regions, the pressure drop of the flow is larger than that of the flow without porous media, and there is a well-defined pressure change, as shown in Figure 7a below. Compared with the circular shape, it can be seen that the pressure drop generated by the porous region of the cylindrical-shape filter is smaller than that of the circular-shape filter under the same boundary conditions. As shown in Figure 7b, the velocity and pressure distribution diagram on the symmetric line shows that the velocity on the symmetric line gradually decreases with the change in position, which is mainly due to the existence of the porous region in the middle, which obstructs the flow and makes the velocity smaller. The pressure on the symmetric line is in the form of a piece wise function, and the outlet pressure increases due to the obstruction of the porous region.

Figure 7.
Pressure cloud image and flow field cloud image of cylindrical shaped sampling vessel with filter net and velocity and pressure distribution on the symmetry line of the cylindrical section: (a) pressure cloud diagram and velocity cloud image of upstream field velocity at different sections of cylinder sampling vessel with filter net; (b) pressure and velocity distribution on the symmetry line of the diagram of cylindrical sampling vessel with filter net.
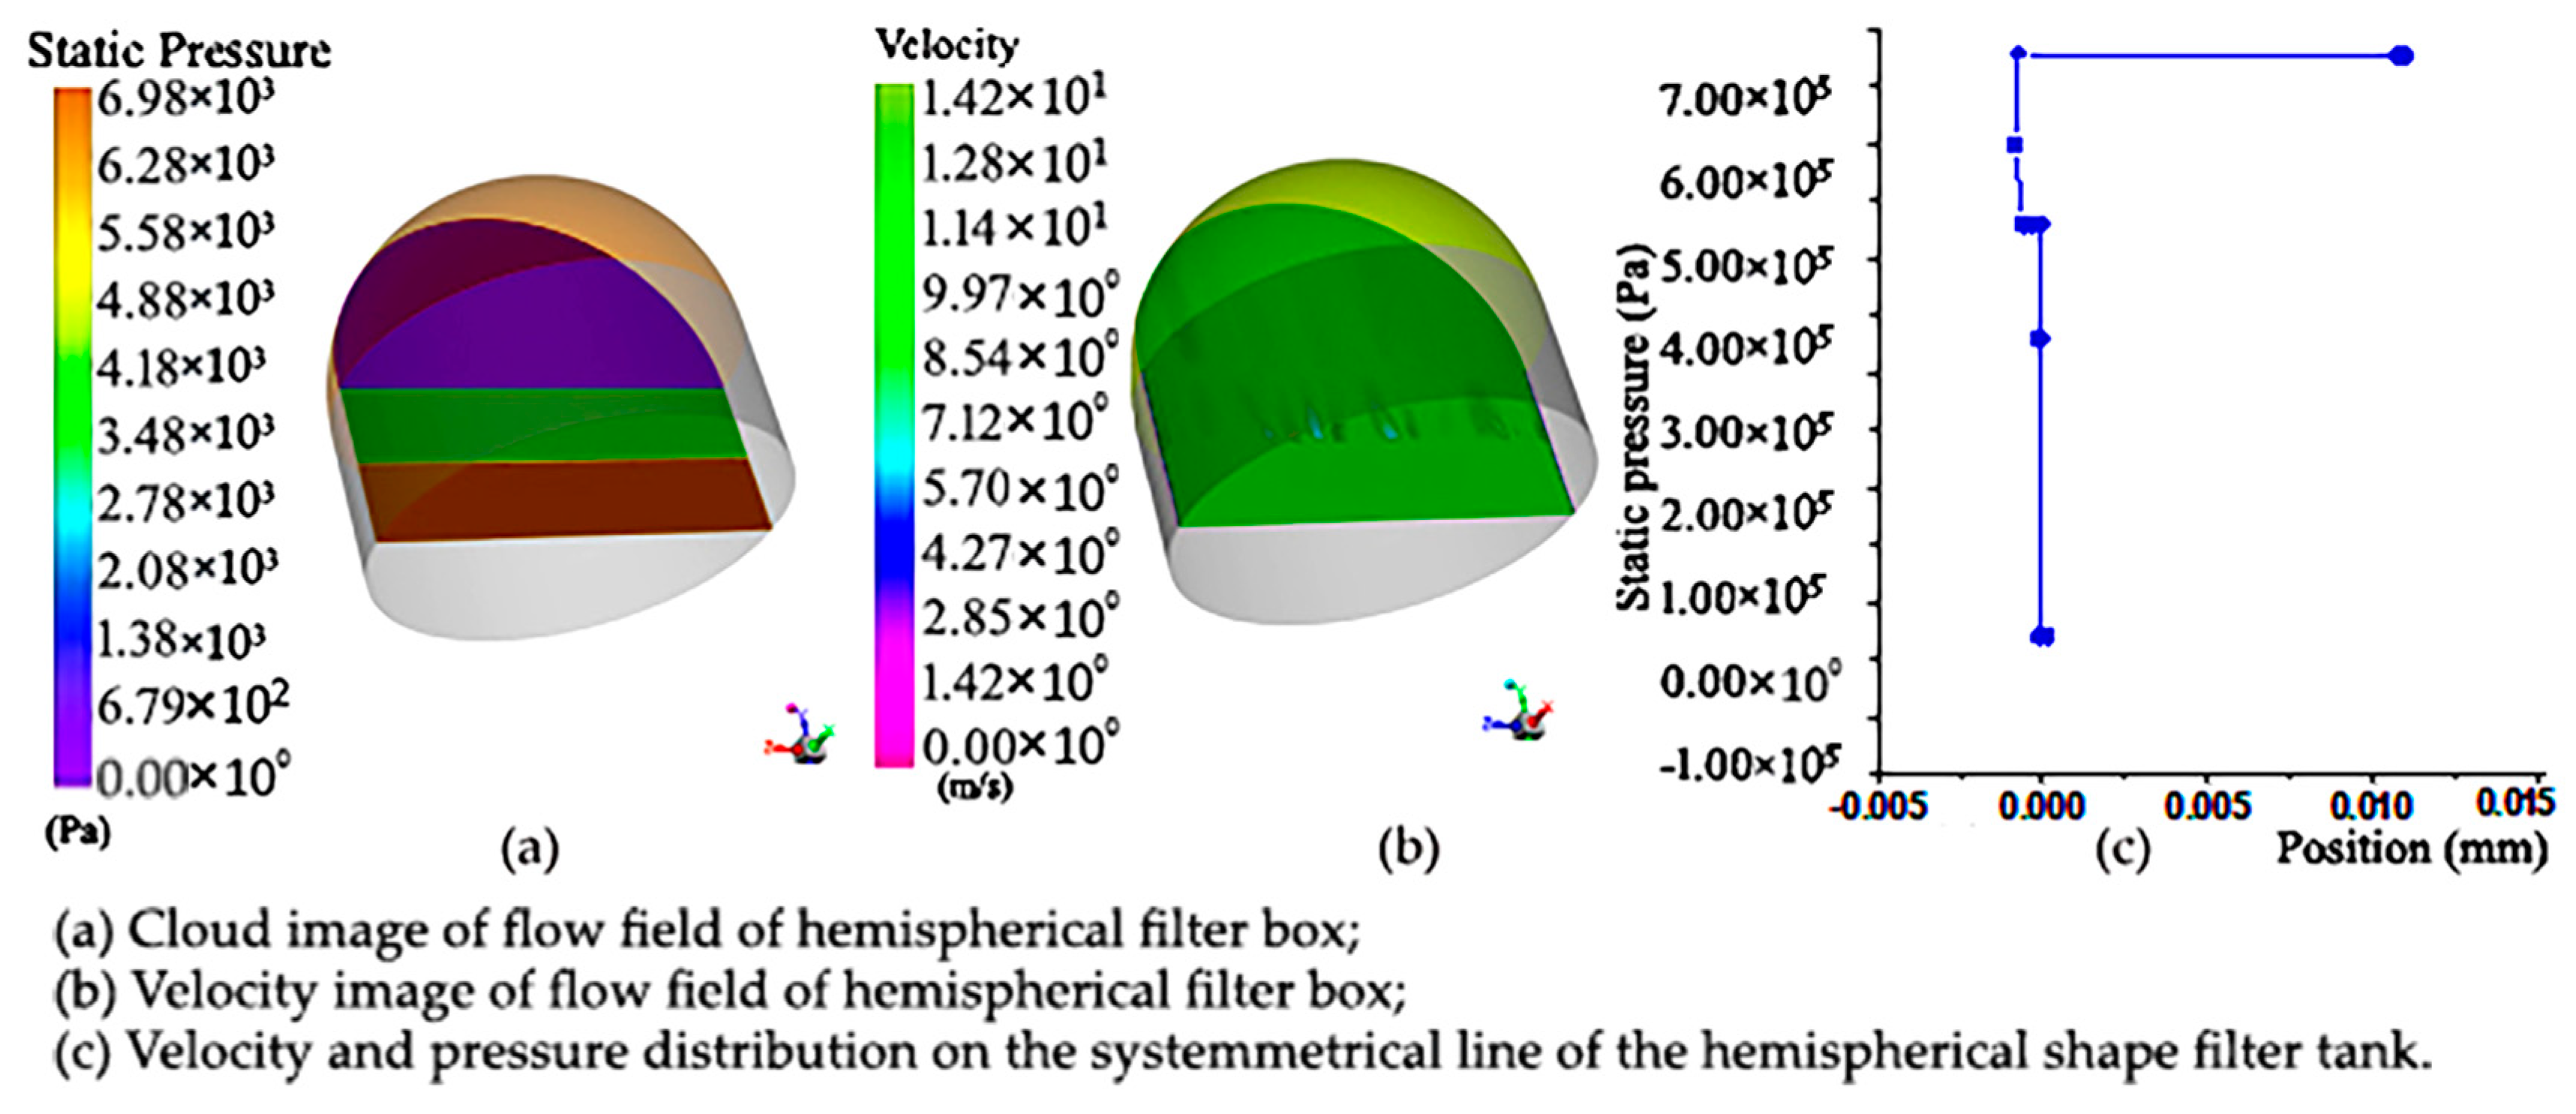
The following is the simulation analysis of the hemispherical sampling vessel with a filter net. It can be seen from the pressure distribution cloud map that the existence of porous regions makes the pressure drop obvious. However, due to the presence of porous regions, the flow has a greater pressure drop than the flow of a medium without pores, and there is a significant pressure change, as shown in Figure 8a below. Compared with the hemisphere-shaped sampling vessel with a filter net, it can be seen that under the same boundary conditions, the pressure drop generated by the porous region of the cylindrical filter is smaller than that of the hemisphere-shaped sampling vessel with a filter net.
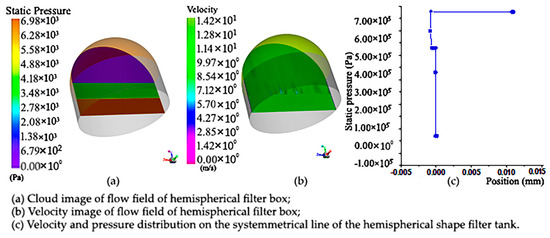
Figure 8.
Pressure cloud diagram and cloud image of upstream field velocity at different sections and velocity and pressure distribution diagram of symmetry line of section of hemisphere-shaped sampling vessel with filter net: (a) pressure cloud diagram of hemisphere-shaped sampling vessel with filter net; (b) cloud image of upstream field velocity at different sections of hemisphere-shaped sampling vessel with filter net; (c) velocity and pressure distribution diagram of symmetry line of section of hemisphere-shaped sampling vessel with filter net.
In order to accurately reflect the changes in the flow field in the hemisphere, we make a symmetrical line and observe the changes in velocity and pressure on the line. Figure 8b below shows the velocity pressure distribution on a symmetric line. It can be seen that the velocity on the symmetric line gradually decreases with the change in position, mainly due to the existence of porous regions in the middle, which hinders the flow and makes the velocity smaller. The pressure on the symmetric line is in the form of a piecewise function, and the outlet pressure is reduced due to the obstruction of the porous area, which was found to be different from the cylindrical-shaped sampling vessel with filter net.
3.4. Simulation of Aperture Size of Sampling Filter Screen
In order to verify the effect of the aperture size of the sampling filter screen on spore sample collection of “Capturer-A”, the working state and working effect of filter nets with different aperture sizes of sampling filter screens installed in the sampling vessels were simulated and analyzed.
Since the above simulation results show that the bent air duct with a diameter of 20 mm is the most efficient, in order to ensure the compatibility of “Capturer-A”, the interior diameter of the sampling vessel is consistent with the diversion duct with an inner diameter of 20 mm. According to the model setting of the actual filter net, a geometric model was established in Workbench (ANSYS Inc., Canonsburg, PA, USA), as shown in Figure 9. The cylinder has an outer diameter of 22 mm and an inner diameter of 20 mm. The circular table is installed in a reverse way, and the top is the same as the cylindrical sampling vessel with an outer diameter of 22 mm and an inner diameter of 20 mm. The bottom has an 18 mm outside diameter and 16 mm inside diameter. The model consists of three parts: inlet fluid region, porous media region and outlet fluid region.

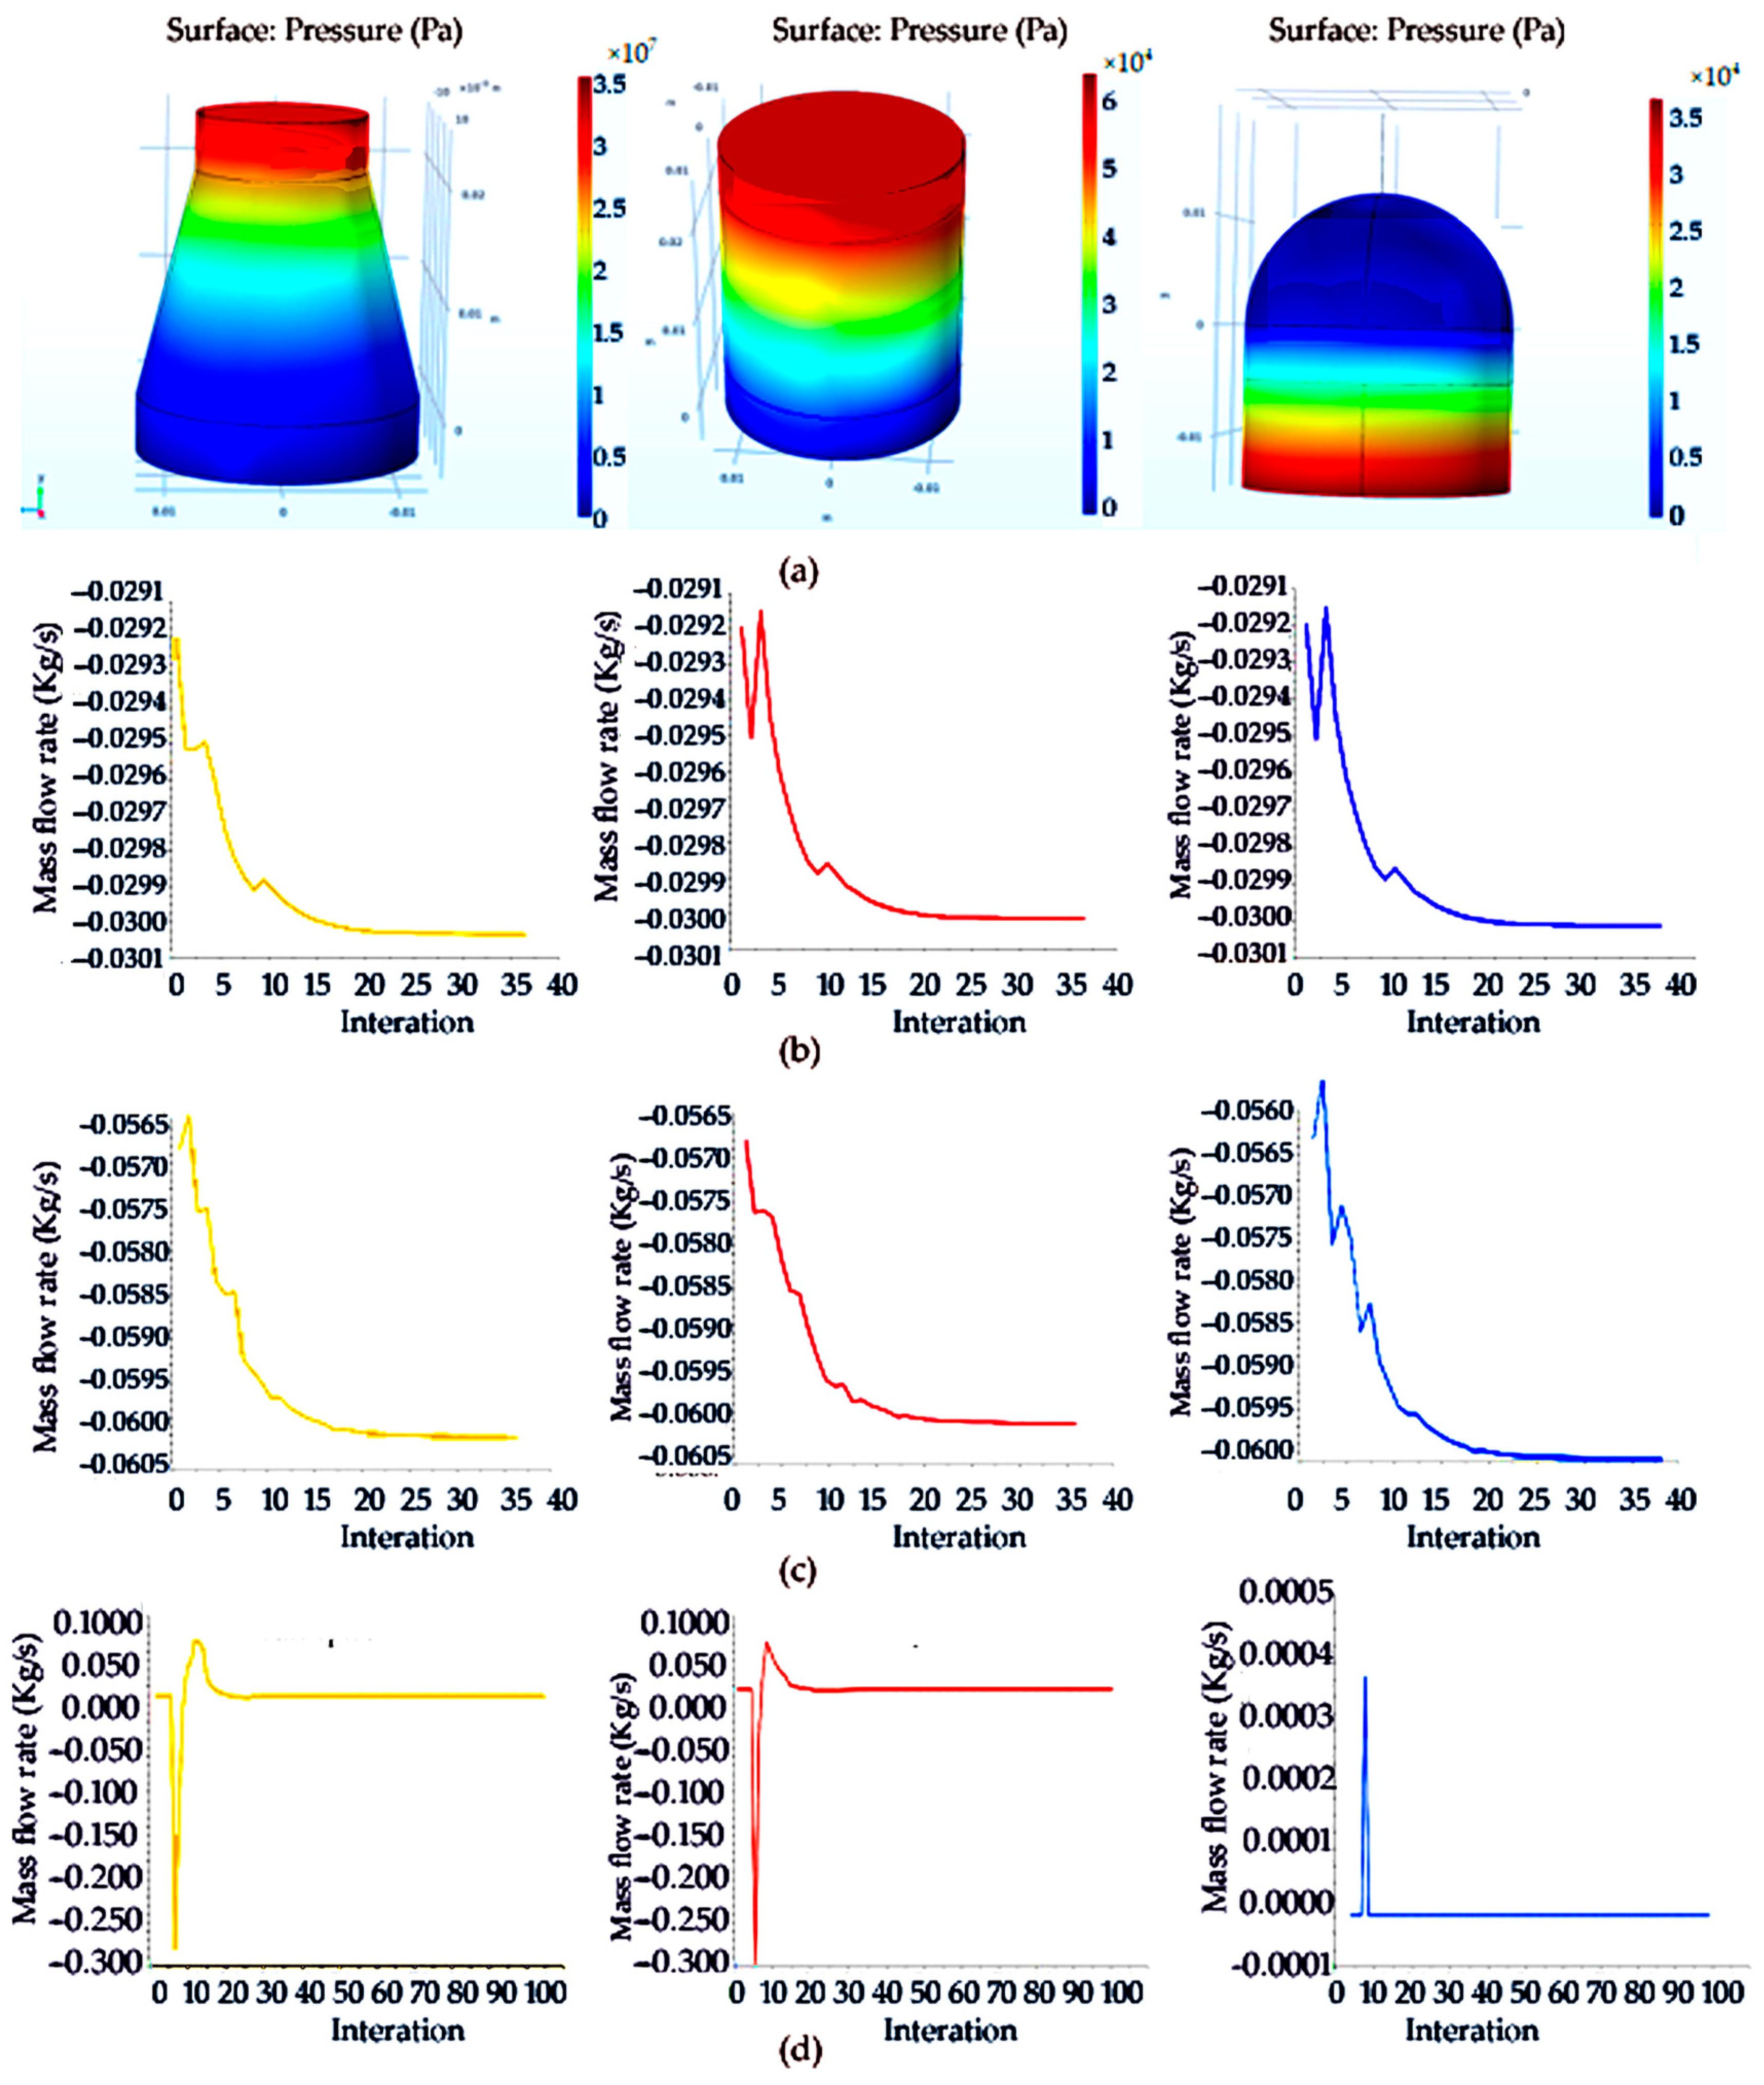
Figure 9.
Model of three different shapes of sample collection vessels with filter net and analysis of microparticle mass flow: (a) model of truncated cone, cylindrical, hemisphere-shaped sampling collection vessel with filter net; (b) analysis of microparticle mass flow of truncated cone-, cylindrical-, hemisphere-shaped sampling filter screen with aperture size of 0.180 mm; (c) analysis of microparticle mass flow of truncated cone-, cylindrical-, hemisphere-shaped sampling filter screen with aperture size of 0.150 mm; (d) analysis of microparticle mass flow of truncated cone-, cylindrical-, hemisphere-shaped sampling filter screen with aperture size of 0.0750 mm.
The monitoring data of microparticle mass flow at the outlet of the truncated cone sampling collection vessel with a filter net in the simulation process are shown in Figure 9b. The three groups of working conditions when the aperture sizes of the sampling filter screen of filter nets are 0.180 mm, 0.150 mm or 0.0750 mm are installed in the sampling vessels. It can be seen from the monitoring chart that the mass flow at the outlet fluctuates mainly due to the existence of porous media and finally reaches stability. It was found that the fluctuation in the sampling vessel when installing the filter net with an aperture size of 0.180 mm was gentle, and the obstruction was relatively large.
Three different aperture sizes of sampling filter screens in the cylindrical sampling vessel with a filter net were simulated and compared, and it can be seen from the monitoring chart that the mass flow at the outlet between them fluctuates mainly due to the existence of porous media and finally reaches stability, as shown in Figure 9c. Compared with the three different aperture sizes of sampling filter screens, it is found that the fluctuation is still flat, and the fluctuation in the sampling vessel when installing the filter net with an aperture size of 0.150 mm was gentle and the obstruction was relatively large.
For the comparative monitoring of the three aperture sizes of sampling filter screens in the hemisphere-shaped sampling vessel with a filter net, it can be seen from the monitoring chart that the mass flow at the outlet between them fluctuates mainly due to the existence of porous media and finally reaches stability, as shown in Figure 9d. Compared with the three different aperture sizes of sampling filter screens, it is found that the fluctuation was flat, and the fluctuation in the collection vessel when installing the filter net with an aperture size of 0.0750 mm was gentle and the obstruction was relatively large.
This simulation mainly compares the sample collection capability of filter nets with different aperture sizes, so it is mainly through the porous media of the filter net to distinguish and simulate the filtration capacity of filter nets with different aperture sizes. Through the pressure distribution of the model of truncated cone-, cylindrical- and hemisphere-shaped sampling vessels with filter screens in the simulation of porous media, it can be found that the pressure distribution under the cylindrical filter is the largest, which is distributed in a step to the outlet.
3.5. Summary Findings of the Simulations
According to the above simulation results, if “Capturer-A” is equipped with an aperture sampling vessel filter screen of 0.150 mm, bent air duct with an inner diameter of 20 mm, negative-pressure fan of 1500 Pa and cylindrical spore-sampling vessel, “Capturer-A” can complete the spore sample collection more efficiently.
4. Verification Test of Prototype
In order to verify the effectiveness of “Capturer-A” in collecting spores, a prototype was designed and field test conducted with reference to the model parameters and simulation results above (as shown in Figure 10). The size and weight parameters of the prototype are shown in Table 2. The prototype test was used to verify the effect of several important parameters on the collection of microbial particles such as spores, and the validity of the parameters of simulation analysis was verified.
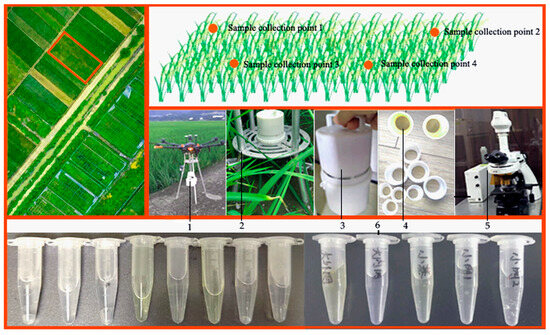
Figure 10.
Verification test of prototype. Note: 1. pre-flight status of the drone carrying Capturer-A; 2. status of Capturer-A when it is installed on an aluminum alloy bracket; 3. portable prototype; 4. sample collection filter; 5. microscope; 6. sample diluent.
Table 2.
Size and weight parameters of “Capturer-A”.
4.1. Test Method
4.1.1. Test Methods for Prototype
The rice fungus spore collection device “Capture-A” was used to sample the suspected diseased paddy field. First of all, the collection points were planned, so that “Capture-A” could operate at several collection points within a certain distance from the rice crown cluster for a certain period of time. “Capture-A” has six sampling vessels with filter nets, each sampling vessel works for a certain period of time and the collected samples are tested and counted under a microscope to analyze the microbial information contained in the samples. During the validation test of the equipment, diseased rice fields of different growth stages were selected for the experiment.
4.1.2. Counting of Rice Disease Spore Information in Laboratory
(1) Put the sample into water, shake it in a conical bottle to disperse the conidia, then filter and rinse with multi-layer gauze, making sure that the filter residue does not contain spores, and dilute to 100 mL [16,34,35,36].
(2) Take one drop of dilute liquid, drop it on the calculation grid of the blood cell counting board, then gently press the cap from side to side, so that the cap is completely close to the counting board, and there are no bubbles in the liquid; use filter paper to absorb the excess suspended spore liquid, and let it sit for a few minutes until the spores settle [12,37].
(3) Observe the sample with a microscope. Since the spores in the dilution are in different spatial positions on the hemocytometer and can only be seen at different focal lengths, the micro-spiral must be mobilized one by one when counting, so as not to miss it. Spores are usually located on the lines of a large grid and should be counted on both sides and discarded on the other side to reduce errors. Each sample is observed and counted no less than two times, and its average value is taken [22,35].
4.2. Analysis of Experimental Results
4.2.1. Influence of Negative-Pressure Fan Power of the “Capture-A” on Sample Collection Effect
In order to ensure the reliability of the test data, under the same other conditions, “Capturer-A” equipped with negative-pressure fans of different wind pressures (450 Pa, 800 Pa, 1500 Pa) was used to sample the four sampling points of eight different rice fields affected by rice blast, and the sampling time was 5 min (as shown in Figure 10). Collected samples were counted under a laboratory microscope to obtain the number of disease spores in each sample. It can be seen from the figure that the fan power is positively correlated with the number of spores collected (as shown in Figure 11).

Figure 11.
Comparison of numbers of samples collected by negative-pressure fans with different wind pressures in the prototype test: (a) number of spores collected by “Capturer-A” at 4 sampling sites in the first blast rice field; (b) number of spores collected by “Capturer-A” at 4 sampling sites in the second blast rice field; (c) number of spores collected by “Capturer-A” at 4 sampling sites in the third blast rice field; (d) number of spores collected by “Capturer-A” at 4 sampling sites in the fourth blast rice field; (e) number of spores collected by “Capturer-A” at 4 sampling sites in the fifth blast rice field; (f) number of spores collected by “Capturer-A” at 4 sampling sites in the sixth blast rice field; (g) number of spores collected by “Capturer-A” at 4 sampling sites in the seventh blast rice field; (h) number of spores collected by “Capturer-A” at 4 sampling sites in the eighth blast rice field.
4.2.2. Comparative Test of Equipment Installation of Different Parameter Components
In order to optimize the fungal spore collection device parameters, a comparative test of equipment installation of different parameter component orthogonal experiments are carried out in this study. The test scheme and test results are as follows:
Four factors (aperture size of filter net, size of sampling vessel, shape of sampling vessel and air pressure of negative-pressure fan) that have an impact on the results were selected, and three levels were determined for each factor. The L9 (34) orthogonal test was used to determine the optimal formulation process based on the results as an index. Orthogonal test factors and level design are shown in Table 3.
Table 3.
Orthogonal experimental factors and levels.
The self-developed rice fungal spore collection device named “Capturer-A” was used to assemble different components in a rice field with suspected disease. In the same area of the paddy field, the device maintain a certain distance from the rice crown cluster and runs for the same period of time through a negative-pressure fan against each spore sample collection filter vessel at the inlet of the device. The rice fungus spore collection device is equipped with sample collection vessels of different sizes, sample collection vessels of different shapes, filter nets of different aperture sizes and different wind pressure brought by different negative fans with different pressures. The collected samples are monitored and counted in the laboratory and then analyzed using orthogonal tests. Several parameters affecting the device are set as factors and levels in the orthogonal test. Specific test factors and levels are shown in Table 3.
According to the range analysis of the orthogonal test, the most suitable combination is A3B2C1D3. The device can meet the requirements of rice disease information collection when the pressure of the negative-pressure fan is 450 Pa to 1500 Pa. If the aperture size of the sampling filter screen is 0.150 mm, sampling vessel size is 20 mm, sampling vessel shape is cylindrical and the pressure of the negative-pressure fan is 1500 Pa, the sampling effect is the best.
In orthogonal test analysis, ki is the sum of the i level test index values in the corresponding factors, ki represents the mean value of the i level test index values in the corresponding factors and the r value represents the difference between the maximum and minimum values of ki in the fixed factors. The larger the r value is, the greater the influence of different levels of the factor settings on the evaluation indicators. Therefore, it shows that the greater the influence of this factor on the evaluation index, and vice versa, the smaller the influence of this factor on the experimental results. Through orthogonal analysis of the results, the results of four columns of tests A, B, C and D in Table 4 show that the change in test results caused by the change in parameters of A is the largest, and the change in test results caused by the change in parameters of B is followed by C and then D. It can be seen from the range (r-value) analysis in Table 4 that the influence degree of the four factors on the results is successively A > B > C > D (the aperture size of the sampling vessel filter net > an inner diameter of bent air duct > the shape of the sampling vessel > the wind pressure of the negative-pressure fan), with the maximum result as the optimization objective. From the size analysis of k1, k2 and k3, the optimal condition of the result is A3B2C1D3. The experiment was carried out according to the L9 (34) orthogonal design table, and the results are shown in Table 4.
Table 4.
Orthogonal experimental results.
The data were processed by the R language data processing program (Lucent Technologies Co., LTD., Hangzhou, China). The results of ANOVA for a single factor showed that factor A had a significant impact on the results (p < 0.01), while factors B, C and D had no statistically significant impacts on the results (p > 0.05).
The analysis of variance is used to test the actual situation of the influence of various factors on the results. The larger the sum of squares of deviation for the factor, the greater the difference between the test results and the greater the influence of the factor on the test results. p < 0.01 indicates a very significant effect, and p < 0.05 indicates a significant effect (as shown in Table 5).
Table 5.
Variance analysis of situation of the influence of various factors on the results.
The sum of squares of deviation for each factor and error is calculated, and then the degree of freedom, mean square and F-value are obtained; the F-test is then carried out. The specific calculation process is as follows:
SST refers to the sum of squares of the total deviation, which is used to reflect the total difference change in data during the test. The sum of squares of deviation reflects the degree of influence of various factors on the experimental results. The larger the sum of squares of deviation is, the greater the influence of selected factors on the test results.
The sum of squares of deviation of each factor reflects the degree of influence of each factor on the test results. The larger the sum of squares of deviation of the factor, the greater the difference between the test results when the factor is taken to different levels, and the greater the influence of the factor on the test results. The sum of squares of deviations for each factor is calculated as follows:
SSB, SSC and SSD were processed in the same way. The variance results of each factor on the results are shown in Table 6. It can be seen from Table 6 that the aperture size of the spore sampling filter net has a very significant impact on the results (p < 0.01), while the shape of the sampling vessel, the air pressure of the negative-pressure fan and the size of the sampling vessel have no significant impacts on the results (p > 0.05). The order of influence of the four factors is as follows: number of filter meshes > size of sampling vessel > shape of sampling vessel > air pressure of negative-pressure fan. Considering the influence of the four factors on the results, the optimal combination is A3B2C1D3; that is, when the aperture size of the filter net is 0.150 mm, the diameter of the sampling vessel is 20 mm, the shape of the sampling vessel is cylindrical and the air pressure of the negative-pressure fan is 1500 Pa, the maximum result is obtained.
Table 6.
Validation test of orthogonal test result.
In order to verify the reliability of the L9 (34) orthogonal test results, three parallel tests were carried out under the conditions of the aperture size with a filter net of 0.0750 mm, sampling vessel with diameter of 20 mm, the shape of the sampling vessel of cylinder and air pressure of negative-pressure fan of 1500 Pa. The verification results are shown in Table 6, and the obtained results are 900.33 ± 8.5. The results were higher than those of the single factor test and orthogonal test group, indicating that the optimal condition (A3B2C1D3) obtained the by L9 (34) orthogonal test was stable and reasonable.
4.3. Comparison Test between Self-Developed Device and Existing Market Device
In order to verify the sampling effect of “Capturer-A”, the sampling effect of “Capturer-A” and “YFBZ3” are compared and tested. The two devices were placed at the same sampling point in the same plot, at the same time. In order to avoid mutual influence, the two devices were 2 m apart. The “Capturer-A” (aperture sizes of filter net of sampling with 0.150 mm, bent air duct with an inner diameter of 20 mm, negative-pressure fan with 1500 Pa, sampling of cylindrical shape) and the mobile spore collection device of “YFBZ3” (YunFei Co., Ltd., Zhengzhou, China) were used to carry out five-point sampling on rice fields suspected of diseases. The two devices were simultaneously placed on the ridge of the same sampling point in the same plot, and the distance between the two devices and the rice was 250 mm. Analyzing the microbial information contained in the sample, a test process field diagram and results are shown in Figure 12.
Figure 12.
Test comparison of spore catching ability between self-developed device and portable spore trap (YFBZ3): (a) comparison of the “Capturer-A” and the mobile spore collection (YFBZ3) and sample diluent from a single test; (b) the number of spores collected by the ”Capturer-A” and mobile spore collection device (YFBZ3) working in field A for 1 min, 3 min, 5 min, 10 min; (c) the number of spores collected by the ”Capturer-A” and mobile spore collection device (YFBZ3) working in field B for 1 min, 3 min, 5 min, 10 min; (d) the number of spores collected by the” Capturer-A” and mobile spore collection (YFBZ3) working in field C for 1 min, 3 min, 5 min, 10 min.
According to the test data, there was a certain difference in the number of spore samples collected by A and B at the same sampling point in the same period of time. The two devices were operated at fifteen points for 1 min, 3 min, 5 min and 10 min, respectively.
Through paired T-test analysis in the R language data processing program (Lucent Technologies Co., LTD., Hangzhou, China), it was found that there were significant differences between “Capturer-A” and “YFBZ3” in 1 min, 3 min, 5 min and 10 min collection at field A (p < 0.05), and the value collected by “Capturer-A” was significantly higher than that by “YFBZ3” (as shown in Table 7).
Table 7.
Paired t test analysis table of “Capturer-A” and “YFBZ3”.
At 1 min, 5 min and 10 min collection at field B, there were significant differences between “Capturer-A” and “YFBZ3” (p < 0.05), and the value of “Capturer-A” was significantly higher than that of “YFBZ3”. There was no significant difference between “Capturer-A” and “YFBZ3” at 3 min (p > 0.05).
It was found that there were significant differences between “Capturer-A” and “YFBZ3” at 1 min, 3 min, 5 min and 10 min collection at field C (p < 0.05), and the value collected by “Capturer-A” was significantly higher than that by “YFBZ3”.
The comprehensive analysis shows that no matter on field A, field B or field C, the acquisition time is 1 min, 3 min, 5 min and 10 min, and the value collected by “Capturer-A” is higher than that collected by “YFBZ3”.
5. Conclusions and Prospects
5.1. Main Conclusions
This study mainly studied the rapid detection of spores of rice infectious fungal diseases in scattered, numerous and geographically remote plots, and it solved the shortcomings of the existing spore detection methods, such as high cost, low intelligence and long detection cycle. After the prototype development and field test, the conclusions were as follows:
(1) A rice fungal spore collection device is developed, which is suitable for mobile field operation. The mobile spore collection device is small and easy to carry, and it can be carried by hand, vehicle or UAV. In operation, the system can complete the collection of fungal spores from multiple sample collection points at one time, realize the collection of spores from multiple points in the monitoring plot and comprehensively monitor the disease situation of the field. The mobile spore collection device has the advantages of reasonable structure, safety and lightweight, convenient operation, small size, overall mass less than 2 kg and can be mounted on the UAV.
(2) A rice fungal spore collection device is designed. The microcomputer controls the stepper motor to rotate the fixed plate of the sampling vessel for collecting spores by writing a program, so that the sampling vessel on the fixed plate of the sampling vessel can rotate to the working position within a set time and start collecting spores. After the collection task of a collection point is completed, the stepper motor can be controlled by a programmed microcomputer to make the next sampling vessel reach the working position, and so on, so that the collection task of multiple collection points can be continuous. The prototype produced in this study was equipped with six sampling vessels to achieve the efficient collection of fungal disease spores.
(3) After the simulation and test analysis of the components of the mobile rice infectious fungal disease collection device, it was found that the aperture size of the sampling vessel filter net, the inner diameter of bent air duct, the shape of the sampling vessel, the wind pressure of the negative-pressure fan and other parameters were basically selected. The scheme is as follows: when the device adopts 450 Pa, 800 Pa or 1500 Pa negative-pressure fans, the sampling filter vessel shape adopts a cylinder, truncated cone or hemisphere form, and the aperture sizes of the sampling spore filter net are 0.180 mm, 0.150 mm, 0.0750 mm, bent air duct with an inner diameter of 15 mm, 20 mm and 25 mm, “Capturer-A” can meet the functional requirements of rice infectious fungal spore collection. The parameter combination of “Capturer-A” in the best working state is as follows: the aperture size of the sampling filter net with 0.150 mm, the inner diameter of the bent air duct is 20 mm, the shape of the sampling vessel of cylinder and the wind pressure of the negative-pressure fan is 1500 Pa. In the field test, the self-developed “Capturer-A” (inner diameter of bent air duct of 20 mm, the shape of the sampling vessel of cylinder and the aperture size of the sampling spore filter is 0.150 mm, the wind pressure of the negative-pressure fan 450 Pa) was compared with the existing “YFBZ3” (mobile spore collection device made by Yunfei Co., Ltd., Zhengzhou, China) fungal spore collection device in the market. Samples were collected from 15 sampling points in three suspected diseased rice fields. The two devices were operated at fifteen collection points for 1 min, 3 min, 5 min and 10 min. The samples were examined and counted under a microscope in the laboratory, and it was found that the spores of rice blast disease and rice flax spot disease of rice were contained in the samples. It was found that under the same conditions, “Capturer A” was about twice that of the existing spore collection device “YFBZ3” (mobile spore collection device made by Yunfei Co., Ltd., Zhengzhou, China).
(4) The field test of the prototype showed that the device could effectively collect spore information on rice crown bush disease when working within a certain distance from the crown bush. If the spore collection work needs to be expanded, the parameters of the device should be adjusted to meet the functional requirements.
5.2. Prospects
In this study, the rapid collection of rice fungal spores and microorganisms in rice crown and rapid image collection of rice crop phenotypic information were studied. Some research achievements and new technical progress were made. Due to the limitation of personal ability and research time, there are still many problems in this project that need further research and exploration:
(1) The prototype test in this study only verified the working effect of the prototype with a certain range of parameters in the rice crown cluster and did not verify the working effect of the prototype in a larger range. The prototype produced in this study was equipped with 4–6 sampling vessels; more sampling vessels can be installed in order to achieve the efficient collection of fungal disease spores. The performance of ”Capturer-A” needs to be further optimized in future work.
(2) The self-developed rice fungal spore collection device needs to conduct follow-up monitoring, data statistics and processing of samples through a microscope in the laboratory after collecting information, and the intelligence level is not high. It is hoped that an integrated spore information monitoring function can be added in follow-up work.
(3) The hardware structure of “Capturer-A” needs to be further optimized. Since water resistance needs to be considered in the work of rice crown clusters, it is necessary to add shells and metal brackets when installing on mobile devices such as drones, and the volume and weight will further increase. The further research direction of this topic is to further optimize the structure and make the whole system more convenient.
Author Contributions
Methodology, X.G.; software, X.G., Y.O. and K.D.; validation, X.G.; formal analysis, Y.O.; investigation, X.G.; resources, X.G. and X.F.; data curation, X.G. and X.F.; writing—original draft preparation, Y.O. and K.D.; writing—review and editing, R.J.; visualization, X.G.; supervision, R.J. and Z.Z.; project administration, Z.Z. All authors have read and agreed to the published version of the manuscript.
Funding
This work was supported by the National Key R&D Program of China (2022YFD2001501) and the Laboratory of Lingnan Modern Agriculture Project (NT2021009); in part by Science and Technology Plan of Jian City of China (20211-055316 and 2022-051252-02), Science and Technology Plan of Guangdong Province of China (2023B10564002 and 2021B1212040009), Innovative Research Team of Agricultural and Rural Big Data in Guangdong Province of China (2019KJ138), and China Scholarship Council (202308440394).
Data Availability Statement
The authors confirm that the data supporting the findings of this study are available within the article.
Conflicts of Interest
The funders had no role in the design of the study; in the collection, analyses, or interpretation of data; in the writing of the manuscript; or in the decision to publish the results.
Correction Statement
This article has been republished with a minor correction to the readability of Table 3. This change does not affect the scientific content of the article.
References
- Hibino, H. Biology and epidemiology of rice viruses. Annu. Rev. Phytopathol. 1996, 34, 249–256. [Google Scholar] [CrossRef] [PubMed]
- Azizi, M.; Lau, H. Advanced diagnostic approaches developed for the global menace of rice diseases: A review. Can. J. Plant Pathol. 2022, 44, 627–651. [Google Scholar] [CrossRef]
- Callaway, E. Devastating wheat fungus appears in Asia for first time. Nature 2016, 532, 421–422. [Google Scholar] [CrossRef] [PubMed]
- Kim GwanWon, K.G. An analysis on spatial spillover effects of rice pest and disease damages under climate change. J. Rural. Dev. 2018, 41, 51–81. [Google Scholar]
- Zhang, H.L. Study on the Germination and Pathogenicity of Small Conidium of Blast Fungus; Northwest A&F University: Beijing, China, 2017. [Google Scholar]
- Sesma, A.; Osbourn, A.E. The rice leaf blast pathogen undergoes developmental processes typical of root-infecting fungi. Nature 2004, 431, 582–586. [Google Scholar] [CrossRef] [PubMed]
- Oh, J.Y.; Jee, S.N.; Nam, Y.; Lee, H.; Ryoo, M.I.; Kim, K.D. Populations of Fungi and Bacteria Associated with Samples of Stored Rice in Korea. Mycobiology 2007, 35, 36–44. [Google Scholar] [CrossRef] [PubMed]
- Mousanejad, S.; Alizadeh, A.; Safaie, N. Effect of Weather Factors on Spore Population Dynamics of Rice Blast Fungus in Guilan Province. J. Plant Prot. Res. 2009, 49, 319–329. [Google Scholar] [CrossRef]
- Ordynets, A.; Keßler, S.; Langer, E. Geometric morphometric analysis of spore shapes improves identification of fungi. PLoS ONE 2021, 16, e0250477. [Google Scholar] [CrossRef] [PubMed]
- Traore, M.D. Abiotic transmission of Rice yellow mottle virus through soil and contact between plants. Pak. J. Biol. Sci. 2008, 11, 900–904. [Google Scholar] [CrossRef]
- Robertson, L.; Brandys, R. A multi-laboratory comparative study of spore trap analyses. Mycologia 2011, 103, 226–231. [Google Scholar] [CrossRef]
- Gómez-Noguez, F.; Pérez-García, B.; Mendoza-Ruiz, A.; Orozco-Segovia, A. A Pluviometric Fern Spore, Fungal Spore, and Pollen Trap. Bioone. Am. Fern J. 2014, 104, 1–6. [Google Scholar] [CrossRef]
- Suzuki, H. The falling of Piricularia oryzae-spore by rain. Annu. Rep. Soc. Plant Prot. 1965, 16, 135–139. [Google Scholar]
- Valent, B.; Chumley, F.G. Molecular genetic analysis of rice blast fungus, Magnaporth grisea. Annu. Rev. Phytopathol. 1991, 29, 443–467. [Google Scholar] [CrossRef]
- Leal, P.L.; Carvalho, T.S.; Siqueira, J.O.; Moreira, F. Assessment of the occurrence and richness of arbuscular mycorrhizal fungal spores by direct analysis of field samples and trap culture—A comparative study. An. Da Acad. Bras. De Ciências 2018, 2, 2–19. [Google Scholar] [CrossRef] [PubMed]
- Pityn, P.J.; Anderson, J. Air sampling of mold spores by slit impactors: Yield comparison. J. Environ. Sci. Health 2013, 11, 22–34. [Google Scholar] [CrossRef] [PubMed]
- Huang, C.M.; Liao, D.J.; Wu, H.S.; Shen, W.C.; Chung, C.L. Cyclone-based spore trapping, quantitative real-time polymerase chain reaction and high-resolution melting analysis for monitoring airborne inoculum of Magnaporthe oryzae. Ann. Appl. Biol. 2016, 169, 75–90. [Google Scholar] [CrossRef]
- Huang, J.; Pan, W.; Ni, W. Application of Spore Capture Technology to Guide green disease control in wheat. Shanghai Agric. Sci. Technol. 2016, 2, 119–120. [Google Scholar]
- Berruyer, R.; Poussier, S.; Mosquera, G. Quantification of the invasion of rice leaves by Magnaporthe grisea using a direct extraction method and Q-PCR. Phytopathology 2005, 95, S9–S10. [Google Scholar]
- Qi, L.; Ma, X.; Liang, B. Research status of rice blast surveillance and prediction methods and establishment of epidemic risk assessment system. Chin. Agric. Sci. Bull. 2011, 27, 213–216. [Google Scholar]
- Wang, C. Development of Pulse Cloud Intelligent Spore Catcher and Remote Monitoring of Wheat Rust Disease; Shandong Agricultural University: Jinan, China, 2018. [Google Scholar]
- Xia, X. Research on Microscopic Image Acquisition and Processing System of Field Plant Fungi Spores; Agricultural University of Hebei: Shijiazhuang, China, 2015. [Google Scholar]
- Lei, Y. Hyperspectral Detection of Wheat Stripe Rust and Monitoring Method of Summer Spore in Air; Northwest A&F University: Xi’an, China, 2019. [Google Scholar]
- Reddy, P.S.K.; Nagaraju, C. Weight optimization and finite element analysis of composite automotive drive shaft for maximum stiffness. Mater. Today 2017, 4, 2390–2396. [Google Scholar] [CrossRef]
- Li, Y.; Xu, Z.; Zhang, L. Lightweight design of soybean harvesting locomotive frame. J. Chongqing Univ. 2019, 42, 14–21. [Google Scholar]
- Zhang, N. Lightweight design of high-speed rice transplanter frame. Trans. Chin. Soc. Agric. Eng. 2012, 28, 55–59. [Google Scholar]
- Font-Llagunes, J.M.; Lugrís, U.; Clos, D.; Alonso, F.J.; Cuadrado, J. Design, Control, and Pilot Study of a Lightweight and Modular Robotic Exoskeleton for Walking Assistance After Spinal Cord Injury. J. Mech. Robot. Trans. ASME 2020, 12, 031008. [Google Scholar] [CrossRef]
- Duan, X.; Cao, X.; Zhou, Y. Application of a fixed-volume spore trap in the Study of Plant disease Epidemiology. In Proceedings of the 2008 Annual Conference of the Chinese Society for Plant Pathology, Guangzhou, China, 21–24 July 2008. [Google Scholar]
- Bao, Y.; Li, H.; Luo, P. Technology Development and Development of Network Remote Control of pathogen spore capture System. In Proceedings of the 2010 International Agricultural Engineering Congress, Shanghai, China, 17–21 September 2010. [Google Scholar]
- Cao, X.; Zhou, Y.; Duan, X. Dynamic monitoring of conidia concentration of wheat Powderomyces in air. In Proceedings of the Chinese Society for Plant Pathology, Changsha, China, 15–18 August 2010. [Google Scholar]
- Wu, Y. Design of Agricultural Monitoring System Based on Rotary-Wing UAV; China Jiliang University: Hangzhou, China, 2018. [Google Scholar]
- Ding, L.; Liu, G. Positioning analysis and error correction of DJI M600 UAV equipped with D-RTK GNSS. Geospat. Inf. 2020, 18, 16–20. [Google Scholar]
- Wang, P. Review of key technologies for remote sensing information acquisition based on micro-UAV. Chin. J. Agric. Eng. 2014, 30, 1–12. [Google Scholar]
- Greer, C.; Webster, R. Occurrence, Distribution, Epidemiology, Cultivar Reaction and Management of Rice Blast Disease in California. Plant Dis. 2001, 85, 1096–1102. [Google Scholar] [CrossRef] [PubMed]
- Wiwattanapatapee, R.; Chumthong, A.; Pengnoo, A.; Kanjanamaneesathian, M. Preparation and evaluation of Bacillus megaterium alginate microcapsules for control of rice sheath blight disease. World J. Microbiol. Biothechnol. 2013, 29, 1487–1497. [Google Scholar] [CrossRef] [PubMed]
- Karlsson, M.; Elfstrand, M.; Stenlid, J.; Olson, Å. A fungal cytochrome P450 is expressed during the interaction between the fungal pathogen Heterobasidion annosum sensu lato and conifer trees. J. DNA Seq. Mapp. 2008, 19, 455–469. [Google Scholar]
- Li, J.; Zhang, T.; Liao, Y. Farmland Information sampling method and aircraft platform design. J. Vib. Meas. Diagn. 2013, 3, 465–481. [Google Scholar]

Disclaimer/Publisher’s Note: The statements, opinions and data contained in all publications are solely those of the individual author(s) and contributor(s) and not of MDPI and/or the editor(s). MDPI and/or the editor(s) disclaim responsibility for any injury to people or property resulting from any ideas, methods, instructions or products referred to in the content. |
© 2024 by the authors. Licensee MDPI, Basel, Switzerland. This article is an open access article distributed under the terms and conditions of the Creative Commons Attribution (CC BY) license (https://creativecommons.org/licenses/by/4.0/).