Article

Uptake of Thallium(I) by Rice Seedlings Grown in Different Soils: Key Soil Properties Determining Soil Thallium Availability

Department of Agricultural Chemistry, National Taiwan University, Taipei 106319, Taiwan
*
Author to whom correspondence should be addressed.
Agronomy 2024, 14(4), 718; https://doi.org/10.3390/agronomy14040718
Submission received: 9 March 2024 / Revised: 24 March 2024 / Accepted: 28 March 2024 / Published: 29 March 2024
(This article belongs to the Special Issue Soil Pollution and Remediation in Sustainable Agriculture)

Abstract

:
This study investigated the uptake of thallium (Tl) by rice seedlings grown in different soils with varying physiochemical properties and Tl levels to elucidate the key factors governing soil Tl availability and accumulation in rice plants. The bioconcentration factors of Tl in rice roots (2.5–25.6) and shoots (1.5–14.7) indicated high soil Tl availability and efficient uptake and translocation of Tl in rice plants, with significant variations across soil types. Growth suppression and visual toxic symptoms, such as stem buckling, yellowish leaf tips, and withering leaf edges, occurred at low soil Tl levels due to high Tl toxicity. The accumulation of Tl by rice plants was influenced by both soil and plant-related factors. Cation exchange reactions primarily influenced the concentration of Tl in soil solution, with potassium ions (K+) acting as competitors for cation exchange sites with Tl+ ions and effective inhibitors of Tl uptake by rice plants. Increasing soil K content may mitigate soil Tl availability in contaminated soils by reducing soil Tl(I) adsorption and plant uptake. This study elucidates the key mechanisms governing soil Tl bioavailability and highlights potential management strategies to reduce Tl accumulation in crops.

1. Introduction

Thallium (Tl) is a toxic element frequently encountered in the environment, yet its environmental behavior remains incompletely characterized. The natural abundance of Tl ranges from 0.2 to 2.8 mg kg−1 in the soil [1]. Human activities such as mining and refining major metals have caused the release of Tl into the environment, often accompanying the transport of these metals [2,3,4]. In recent years, Tl has become a technology-critical element because of its utilization in semiconductor and electro-optical industries, which may contribute to new sources of Tl released to the environment [5,6]. When released into the soil, Tl can be taken up by plants and then enter the human food chain [7,8,9,10,11]. The background level of Tl in edible plants is generally low, ranging from 0.03 to 0.3 mg kg−1 [12]. In areas with high Tl levels, the Tl contents of edible plants could be much higher [9,11,13,14]. For example, as high as 500 mg kg−1 of Tl in green cabbage was detected in a Tl-contaminated area in China [15]. The uptake and accumulation of Tl in plants can pose serious health risks to humans, but the key factors and reactions determining Tl bioavailability in soils are not yet fully understood. Identifying these key factors is essential for devising effective methods to reduce the environmental hazards associated with soil Tl contamination.
The speciation of metals in soils, including Tl, is influenced by various physicochemical soil properties such as pH, redox conditions, organic matter content, and mineral composition [16]. Thallium occurs in two oxidation states, Tl(I) and Tl(III), but Tl(I) is thermodynamically stable and more common in the surface environment [17]. Due to its high solubility, Tl(I) adsorption plays a crucial role in reducing its mobility and bioavailability, while precipitation reactions are less significant [18,19,20]. The adsorption of Tl(I) by soils is influenced by the contents of clay, organic matter, and oxides of Al, Fe, and Mn [19,21,22,23,24,25]. Specifically, clay minerals can adsorb Tl+ ions to a greater extent due to the high affinity of their cation-exchange sites toward Tl+ ions [18,24,25]. However, the adsorption of Tl(I) by soils is reversible and depends on the compositions of 2:1 clay minerals and exchangeable cations in the soils [18,24]. Accordingly, if Tl(I) is retained predominantly by clays in soils, the bioavailability of soil Tl(I) is expected to be high. In addition to adsorption, Mn oxide minerals like birnessite can oxidize adsorbed Tl(I) to Tl(III), which consequently precipitate as Tl2O3 or Tl(OH)3 [19,26,27]. Thus, the presence of Mn oxides is expected to enhance the immobilization of Tl, but contradictory findings have been reported showing insignificant effects of Mn oxides on the Tl retention by soils [19,28,29]. Moreover, there has been a limited understanding of plant Tl uptake in soils with different properties in a mechanistic manner. Therefore, further research is needed to understand better the intricate interactions and processes involved in soil Tl availability, which could contribute to clarifying the underlying mechanisms controlling plant Tl uptake.
This study aims to explore the influence of soil properties on soil Tl(I) availability and its uptake by plants, particularly rice seedlings. Recognizing the pivotal role of rice as a global staple, especially in regions like Taiwan where high-tech industries utilize Tl, raises serious concerns about the risk of soil Tl contamination via the intake of rice harvested from Tl-contaminated soils. Meanwhile, paddy rice cultivation requires submergence conditions maintained by intensive irrigation, which may facilitate the transport of Tl into the paddy soils and exacerbate the risks of Tl pollution. In this study, rice seedlings were also employed as bio-indicators to assess the impact of soil Tl concentrations on plant growth and to elucidate the soil mechanisms governing Tl uptake by plants. Seven different soils, spiked with varying concentrations of Tl(I) to replicate conditions of anthropogenic pollution, were utilized to dissect the influence of soil properties on Tl(I) bioavailability. The results could provide essential information for assessing the environmental risks of Tl and developing effective strategies to mitigate Tl pollution in agricultural systems, ensuring the safety and security of our food supply.

2. Materials and Methods

2.1. Soil Preparation and Characterization

Surface soils (0–20 cm) were collected from seven soil series in Taiwan, including the Pinchen series (Pc; Typic Hapludox), Potu series (Pu; Typic Plinthudult), Tainan series (Tn; Typic Dystrudept), Lukang series (Lu; Aquic Dystrudept), Homei series (Hm; Typic Udorthent), Fenglo series (Fl; Aquic Dystrudept), and Kuanshan series (Ks; Typic Halpudult). The soils were air-dried, ground, and passed through a 2 mm sieve before use.
Soil pH was measured in suspensions of 1:1 soil/deionized water ratio using the electrode method [30]. Soil organic matter content (OM) was determined using the Walkley–Black wet oxidation method [31]. Soil texture was classified based on the sand, silt, and clay contents determined using the hydrometer method [32]. The mineral composition of the clay fraction was further analyzed using the X-ray diffraction (XRD) method. The detailed procedures of the sample preparation and XRD analysis are described in Supplementary Materials. Amorphous and free oxides of Fe and Al (Feo and Alo; Fed and Ald) were extracted with an oxalate/ammonium oxalate solution (pH 4) in the dark, and a mixture of dithionite-citrate-bicarbonate (DCB) solution, respectively [33]. Cation exchange capacity (CEC) and exchangeable Ca, Mg, K, and Na contents (Caex, Mgex, Kex, and Naex) were determined using the ammonium acetate method [34]. The pseudo-total content of Tl in soils was extracted with aqua regia at 180 °C using microwave digestion (Multiwave GO microwave digest system, Anton Paar GmbH, Graz, Austria). The metal concentrations in various extracts were determined using an inductively coupled plasma-atomic emission spectrometer (ICP-AES; Perkin Elmer Optima 5300, Markham, ON, Canada). All the analyses of soil properties were triplicated, and the acceptable level of analytical uncertainty was set to 10%, except for the analysis of clay mineral composition.

2.2. Preparation of Rice Seedlings

Rice grains (Oryza sativa L. cv Taiken 9) were surface-sterilized with a mixture of 10% sodium hypochlorite and 30% hydrogen peroxide (volume ratio 1:1) for 30 min and then rinsed with deionized water. The rice grains were submerged in the dark at 37 °C for five days; subsequently, the germinated grains were grown with the half-strength modified Kimura solution (Table S1) at 25/20 °C (day/night; 12 h/12 h) in a plant growth chamber until the three-leaf stage.

2.3. Growth of Rice Seedlings in Tl-Spiked Soils

The tested soils were submerged and then spiked with 1000 mg L−1 TlNO3 solution (CAS No. 10102-45-1; Sigma-Aldrich, Merck kGaA, Darmstadt, Germany) to reach the soil Tl concentrations (Tlsoil) of 0, 1, 5, 10, 20, and 50 mg kg−1 (hereafter referred to as the treatments of Tl0, Tl1, Tl5, Tl20, and Tl50). These spiked soils were mixed thoroughly, incubated for four weeks under submergence, and air-dried at room temperature. After two wet–dry cycles, the soils were homogenized and used for the pot experiment.
In each 1 L polyethylene container, 0.5 kg of Tl-spiked soil was mixed with 0.4 L of deionized water and then sat for three days. Subsequently, ten healthy rice seedlings at the three-leaf stage were transplanted into each pot and grown at 25 °C/20 °C (day/night) and 85% relative humidity for 18 days in a growth chamber. Each Tl treatment was carried out in triplicate. Soil pore water was collected using the Rhizon samplers (Rhizosphere Research Products, Wageningen, The Netherlands) and then passed through a 0.22 µm filter to collect the filtrate in a test tube containing concentrated nitric acid. The metal concentrations in the filtrates were determined using ICP-AES.

2.4. Analysis of Rice Plant

After the Tl exposure, rice seedlings were washed with deionized water, and the lengths of shoots and roots were measured. The rice seedlings were oven-dried at 70 °C to constant and then weighed. The roots and shoots were separated, weighed, and ground. Subsequently, 0.2 g of roots or shoots was digested using microwave digestion with 9 mL concentrated HNO3 and 1.5 mL of 30% H2O2 at 185 °C. The digests were filtered, and the filtrates were analyzed for Tl concentration using ICP-MS (Agilent 7700×, Santa Clara, CA, United States). The Tl concentrations in roots (Tlroot) or shoots (Tlsoot) and the corresponding soil Tl concentrations (Tlsoil) were used to calculate the bioconcentration factors of roots (BCFR) and shoots (BCFS), i.e., BCFR = Tlroot/Tlsoil; BCFS = Tlshoot/Tlsoil.

2.5. Statistical Analysis of Data

The means and standard deviation of measured plant biomass were presented to indicate the trend difference between both groups of Tl treatments. One-way analysis of variance (ANOVA) was applied to show the effects of soil Tl levels, and the least significant difference (LSD) was performed to examine the statistically significant differences among Tl treatments using the statistical software R Studio (Version 2023.12.1+402). The absolute magnitudes of the observed correlation coefficients (i.e., |r|) were interpreted as “strong”, “moderate”, “weak”, and “negligible” correlations using the cutoffs 1.00–0.70, 0.70–0.40, 0.40–0.10, and 0.10–0.00, respectively [35].

3. Results and Discussion

3.1. Basic Properties of the Tested Soils

Table 1 presents the main soil properties of the seven tested soils selected for the pot experiment to investigate the factors controlling Tl uptake in rice seedlings. The soils ranged from highly weathered to less weathered and included two Ultisols (Pu and Ks), one Oxisol (Pc), three Inceptisols (Tn, Lu, and Fl), and one Entisol (Hm). The soil pH ranged from 4.6 to 8.0. Among the soils, Pc and Tn soils (pH 4.6 and 5.0) are very strongly acidic, Pu soil (pH 5.7) is moderately acidic, Hm soil (pH 6.1) is slightly acidic, Ks and Lu soils (pH 6.9 and 7.0) are neutral, and Fl soil (pH 8.0) is moderately alkaline, according to the USDA classification. The soil textures, from coarse to fine, included silty loam (Tn and Fl), silty clay (Pc and Lu), and clay loam (Pu, Hm, and Ks). The OM contents ranged from 9.8 to 27.8 g kg−1. The CEC values ranged from 5.5 to 29.8 cmolc kg−1. The exchangeable cation contents varied widely, including Caex (2.4–36.7 mmol kg−1), Mgex (0.8–75.2 mmol kg−1), Kex (0.9–4.0 mmol kg−1), and Naex (0.3–3.4 mmol kg−1). The soils also exhibited significant differences in free oxides (Fed: 0.33–1.24 g kg−1; Ald: 0.37–3.34 g kg−1) and poorly crystalline oxides (Feo: 0.93–4.77 g kg−1; Alo: 0.33–1.24 g kg−1). The native soil Tl concentration ranged from 0.23 to 0.88 mg kg−1 (Table 1), within the range of background Tl contents found in global soils (i.e., 0.2–2.8 mg kg−1) [1].

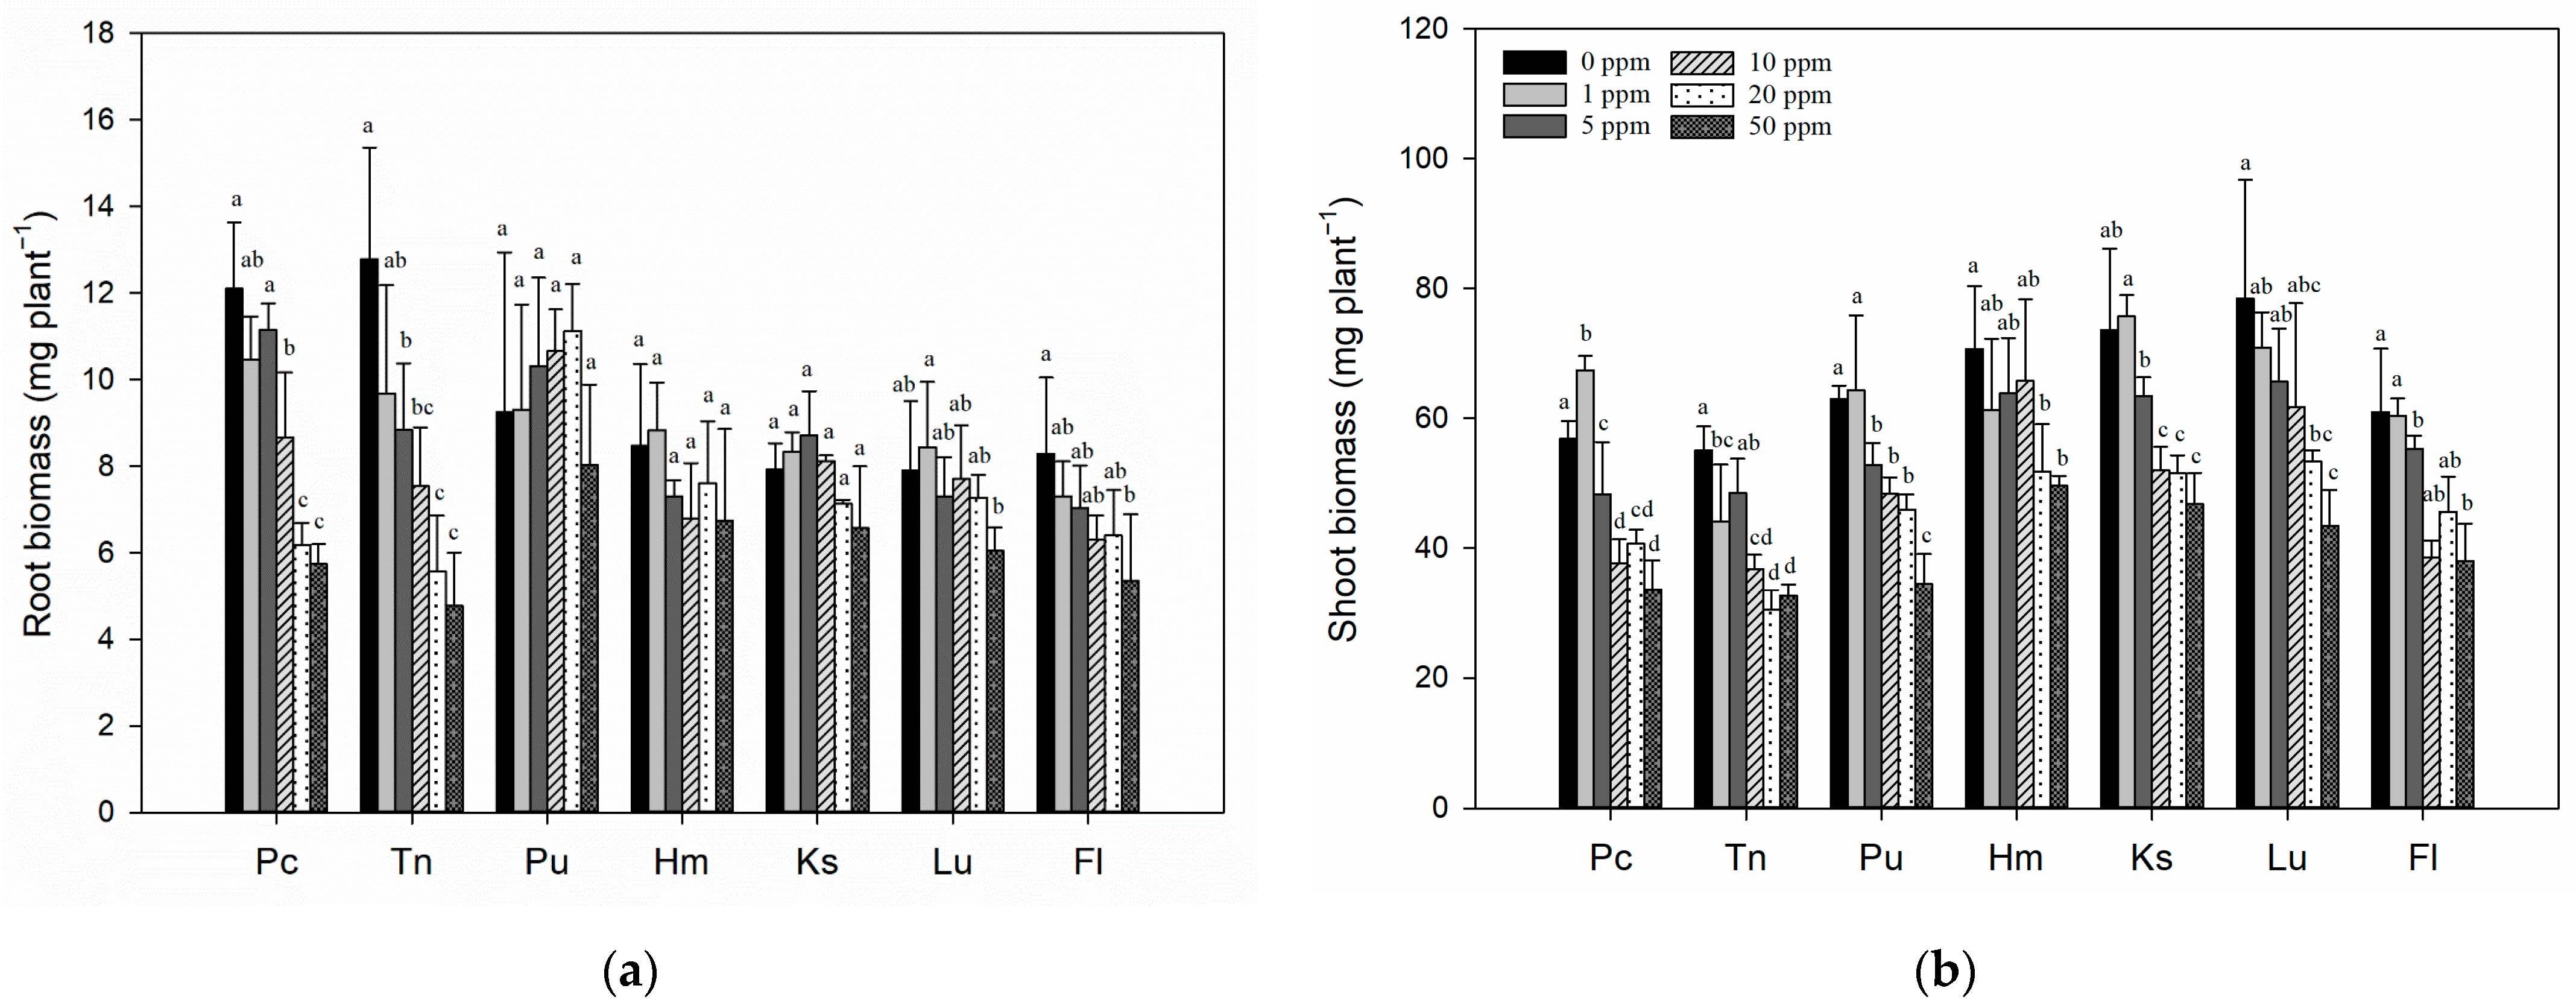
3.2. Effects of Tl Treatments on the Growth of Rice Seedlings in Different Soils

Figure 1 depicts the dry biomass of rice seedling roots and shoots after 18-day exposure to different Tl concentrations in the tested soils. The results indicate that both roots and shoots were affected by Tl toxicity, with a reduction in biomass as Tlsoil increased. The visual symptoms of Tl toxicity, such as stem buckling, yellowish leaf tips, and withering leaf edges, worsened as the soil Tl concentration increased (Figure S1). Based on the biomass changes and toxic symptoms, the shoots exhibited a higher sensitivity to Tl toxicity than the roots.
The extent of the decrease in root and shoot biomasses differed across the soils, as shown in Figure 1. Significant decreases in root biomass (p < 0.05) were observed at a soil Tl concentration of 10 mg kg−1 (i.e., Tl10) and above for Pc soil and 5 mg kg−1 (i.e., Tl5) and above for Tn soil compared with the corresponding controls; in contrast, the root samples in the other test soils exhibited more minor variations as the soil Tl concentration increased (Figure 1a). For the shoot samples, statistically significant decreases in shoot biomass appeared at Tl1 in Tn soil and Tl5 in Pc, Pu, and Ks soils, while such effects were less in Hm, Lu, and Fl soils (Figure 1b). These results demonstrate that the toxic effects of Tl on the growth of rice seedlings varied in different soils, which reflected the dependence of soil Tl availability and rice Tl uptake, as well as rice growth, on soil properties.

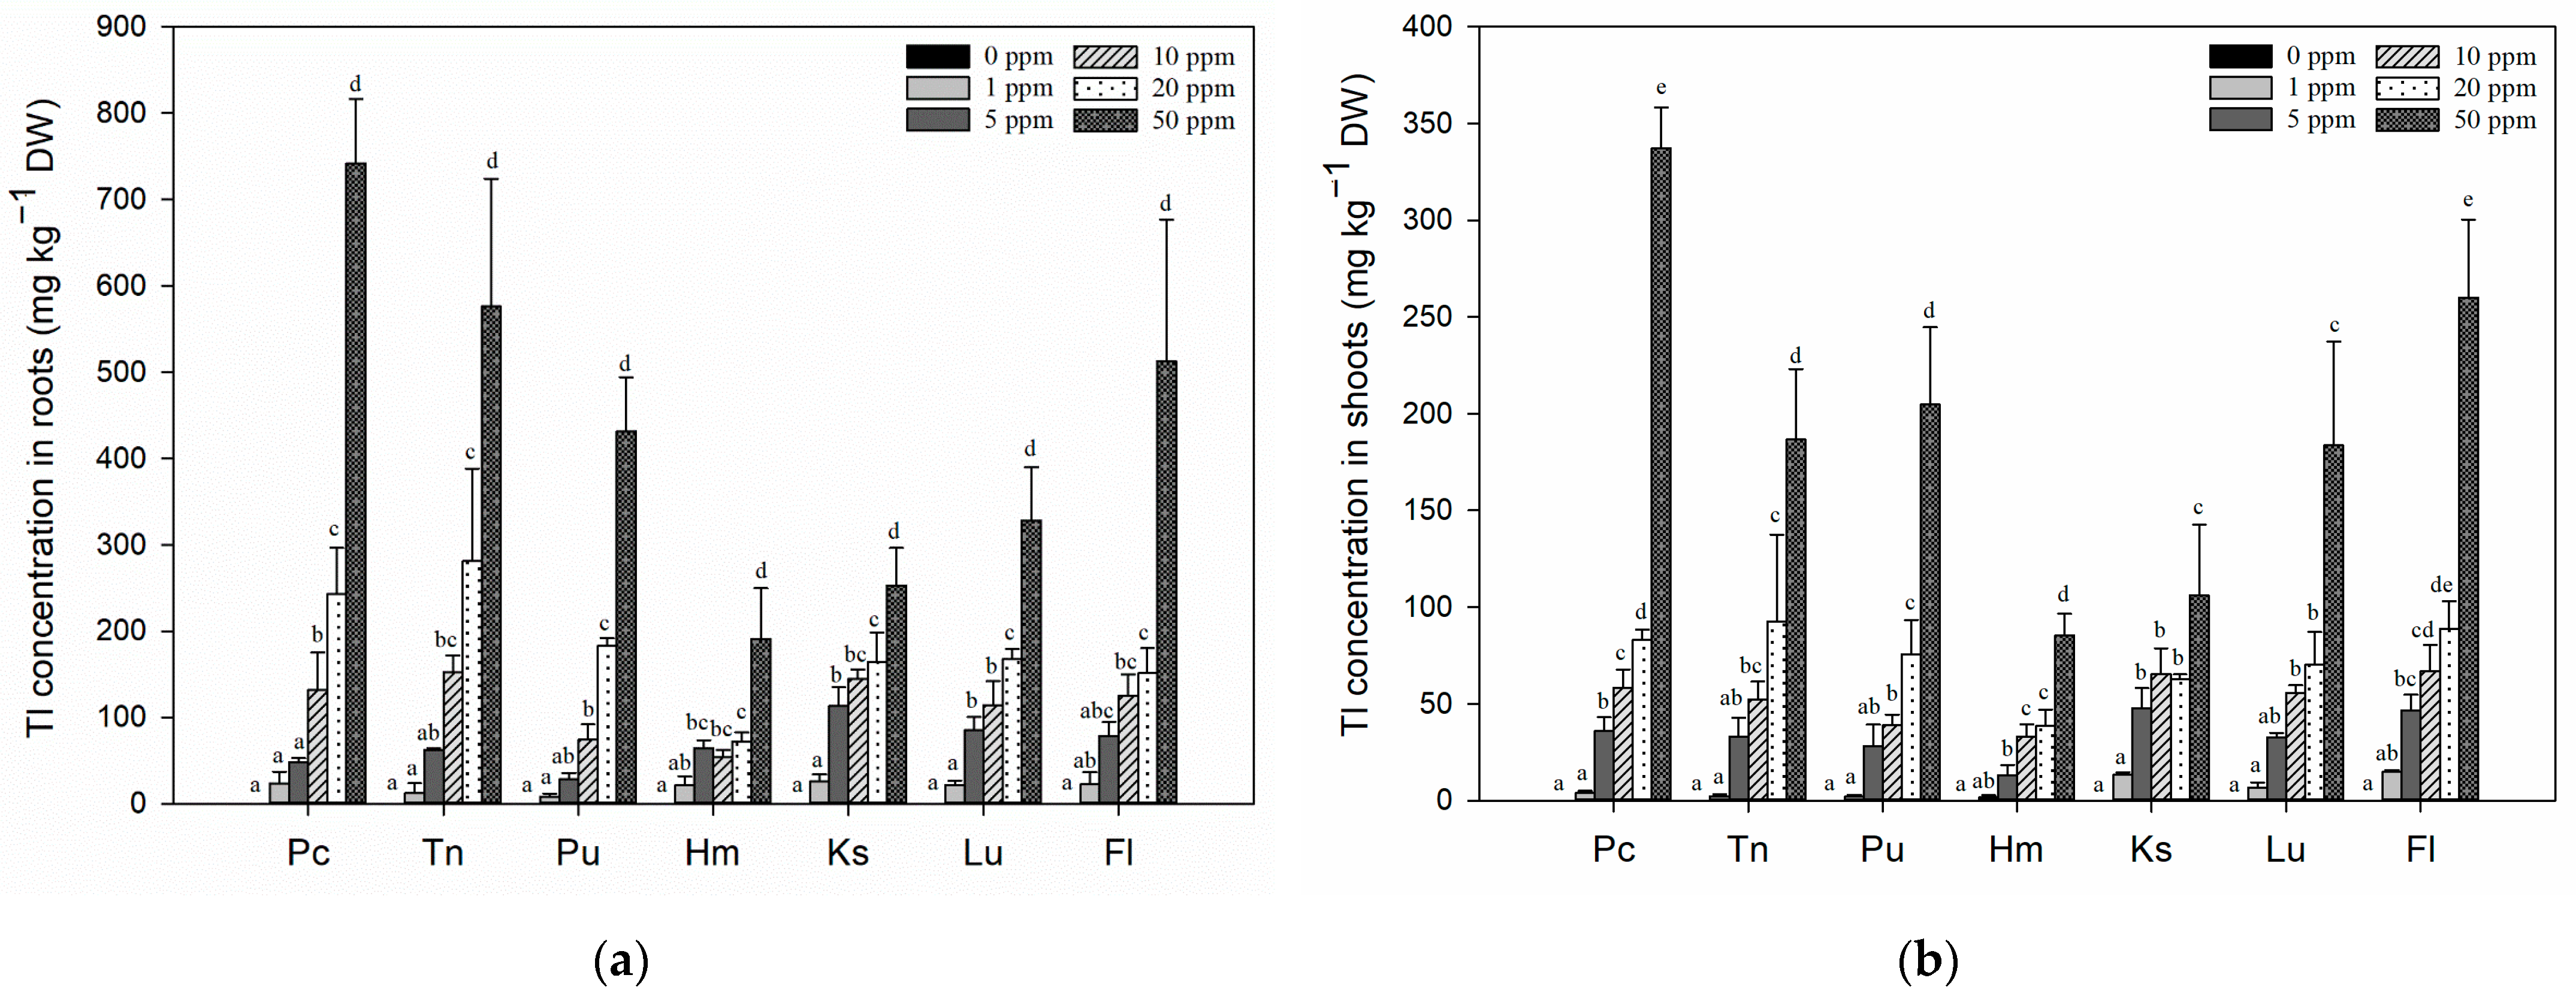
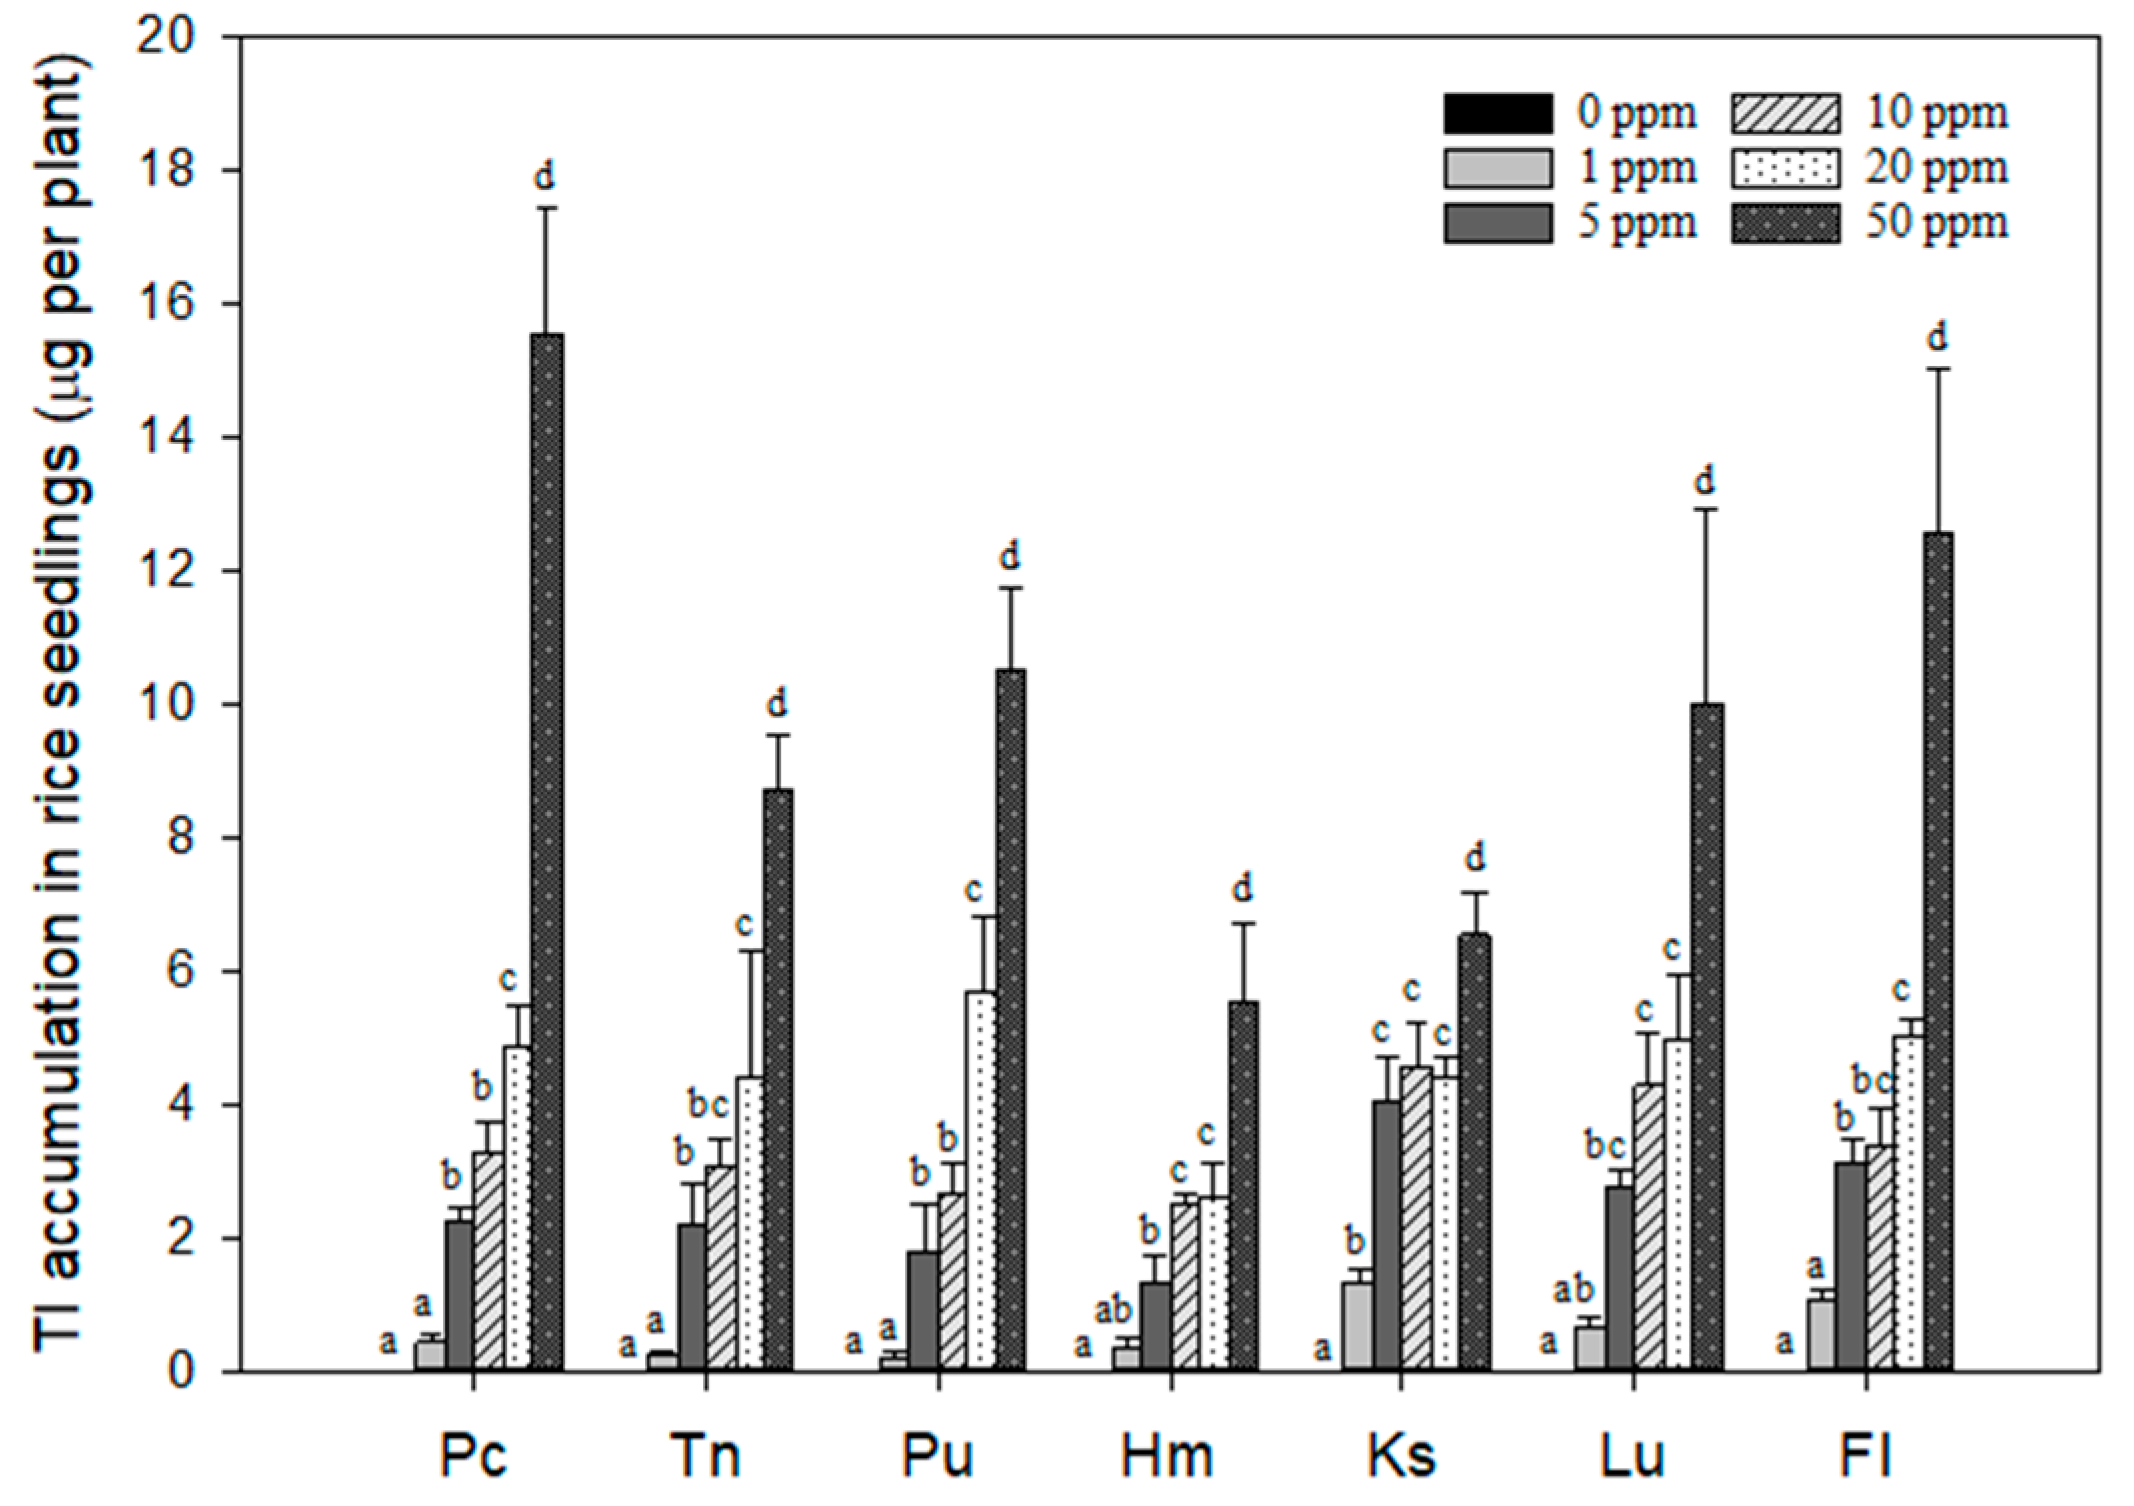
3.3. Effects of Tl Treatments on the Tl Contents in Rice Seedlings

Figure 2 illustrates the Tl concentrations in rice roots and shoots (i.e., Tlroot and Tlshoot) as a function of soil Tl content (i.e., Tlsoil). The Tlsoil values of the control soils were 0.23–0.88 mg kg−1. The rice seedlings grown in the controls exhibited negligible Tlroot and Tlshoot values, indicating the limited availability of geogenic Tl in the soils. In contrast, notable increases in the Tlroot and Tlshoot values were observed as the roots and shoots were exposed to the Tl treatment of 1 mg kg−1 (i.e., Tl1). These values exhibited an order of magnitude variation across different soils: Tlroot ranged from 8.0 mg kg−1 (Pu soil) to 25.6 mg kg−1 (Ks soil) (Figure 2a), and Tlshoot ranged from 1.5 mg kg−1 (Hm soil) to 14.7 mg kg−1 (Fl soil) in shoots (Figure 2b). Specifically, Ks, Pc, Fl, Lu, Hm, Tn, and Pu showed the highest to lowest Tlroot values (Figure 2a), and Fl, Ks, Lu, Pc, Tn, Pu, and Hm showed the highest to lowest Tlshoot values (Figure 2b).
Plant Tl uptake increased with increasing Tlsoil value (Figure 2). In the treatment with the highest soil Tl concentration (i.e., 50 mg kg−1; Tl50), the Tlroot and Tlshoot values were in the ranges of 190.6 mg kg−1 (Hm soil)–741.4 mg kg−1 (Pc soil) (Figure 2a) and 85.3 mg kg−1 (Hm soil)–337.3 mg kg−1 (Pc soil) (Figure 2b), respectively. The extents of Tlroot and Tlshoot values varied considerably across the soils, showing the smallest and largest variations observed in Hm soil (root: 21.3–190.6 mg kg−1; shoot: 1.5–85.3 mg kg−1) and Pc soil (root: 23.5–741.4 mg kg−1; shoot: 3.8–337.3 mg kg−1), respectively. Elevated soil Tl levels resulted in an increased Tl uptake by rice seedlings, leading to aggravated toxic effects on plant growth (Figure 1 and Figure S1). The combined impacts of reduced plant biomass (Figure 1) and increased Tl uptake by plants (Figure 2) resulted in abrupt increases in plant Tl concentration (i.e., plant Tl uptake per plant biomass) from Tl20 to Tl50 found in all the soils (Figure 2).
Table 2 displays the bioconcentration (or bioaccumulation) factors of roots and shoots (i.e., BCFR and BCFS) at different soil Tl levels. The BCFR and BCFS were in the ranges of 3.6–25.6 and 1.5–14.7, respectively. The BCF value for a soil contaminant serves as an indicator to assess the soil availability of the contaminant, influenced by both soil properties and plant physiology [36,37]. All BCF values were greater than unity across all soil types and soil Tl levels, suggesting high Tl availability in the soils and efficient uptake and translocation of Tl in rice plants. Compared to the BCF values of other heavy metals [36,37], rice seedlings displayed a more significant potential for Tl accumulation in both roots and shoots. Due to the considerable toxicity of Tl, the substantial accumulation of this element in rice plants could pose a notable environmental risk [36,38]. Meanwhile, the BCFS values also revealed that a portion of Tl taken up by rice roots could be translocated to aerial parts. Nevertheless, all the BCFS values were smaller than the corresponding BCFR values, indicating that the accumulated Tl was distributed more to rice roots than rice shoots. This accumulation in plant roots functions as a defensive mechanism that maintains chlorophyll activity and minimizes interruption of photosynthesis [39].
Among the soils, the BCFR value of Hm soil (21.3–3.6) and both the BCFR and BCFS values of Ks (25.6–5.1; 13.3–2.1), Lu (21.7–6.4; 6.7–3.5), and Fl (22.4–6.9; 14.7–4.2) soils exhibited a decreasing trend with increasing soil Tl concentration. This inverse correlation between BCF and Tlsoil values is attributed to the increase in Tl uptake by roots and shoots and the reduction in their biomasses due to aggravated Tl toxicity. This decreasing trend signifies the physiological adaptation of rice plants to counteract the detrimental consequences of Tl accumulation in the plants [37]. As the accumulation of Tl in plants and the physiological response to Tl toxicity interplay the causes and effects at higher soil Tl concentrations, the external factor of soil Tl availability plays a less significant role in plant Tl accumulation. Consequently, smaller increments in the Tlroot and Tlshoot values compared to the corresponding increase in the Tlsoil value led to the observed negative correlations between BCF and Tlsoil. Comparatively, the BCFR and BCRS values of Pc (9.6–23.5; 3.8–6.8), Tn (11.5–15.2; 2.2–6.6), and Pu (5.6–9.1; 1.9–5.6) soils did not exhibit apparent correlations with Tlsoil due to relatively more minor variations over the range of the Tlsoil values (Table 2). Intriguingly, the BCFR values of Pc soil (i.e., 9.6) at Tl5 and Tn and Pu soils (i.e., 12.2 and 7.9) at Tl1 were lower than the other soils at the same soil Tl level (21.3–25.6). This suggests that the content of Tl in rice plants exceeded the critical threshold of Tl toxicity even at lower Tl levels in those acidic soils (i.e., Pc, Tn, and Pu soils) compared to the other soils. This phenomenon may be attributed to enhanced soil metal availability due to lower adsorption and higher solubility of metals at lower soil pHs [16,40,41]. However, it is worth noting that soil pH is not the sole factor governing soil Tl availability. The sequence of the soils in Figure 2 proceeds from left to right with increasing soil pH, spanning from acidic to alkaline. Upon examining the changes of the Tlroot and Tlshoot values across different soils with increasing soil pH, a general trend showed a decline from Pc to Hm and a subsequent rise from Hm to Fl, revealing that other contributing factors are at play. Further exploration into the additional factors is therefore warranted.

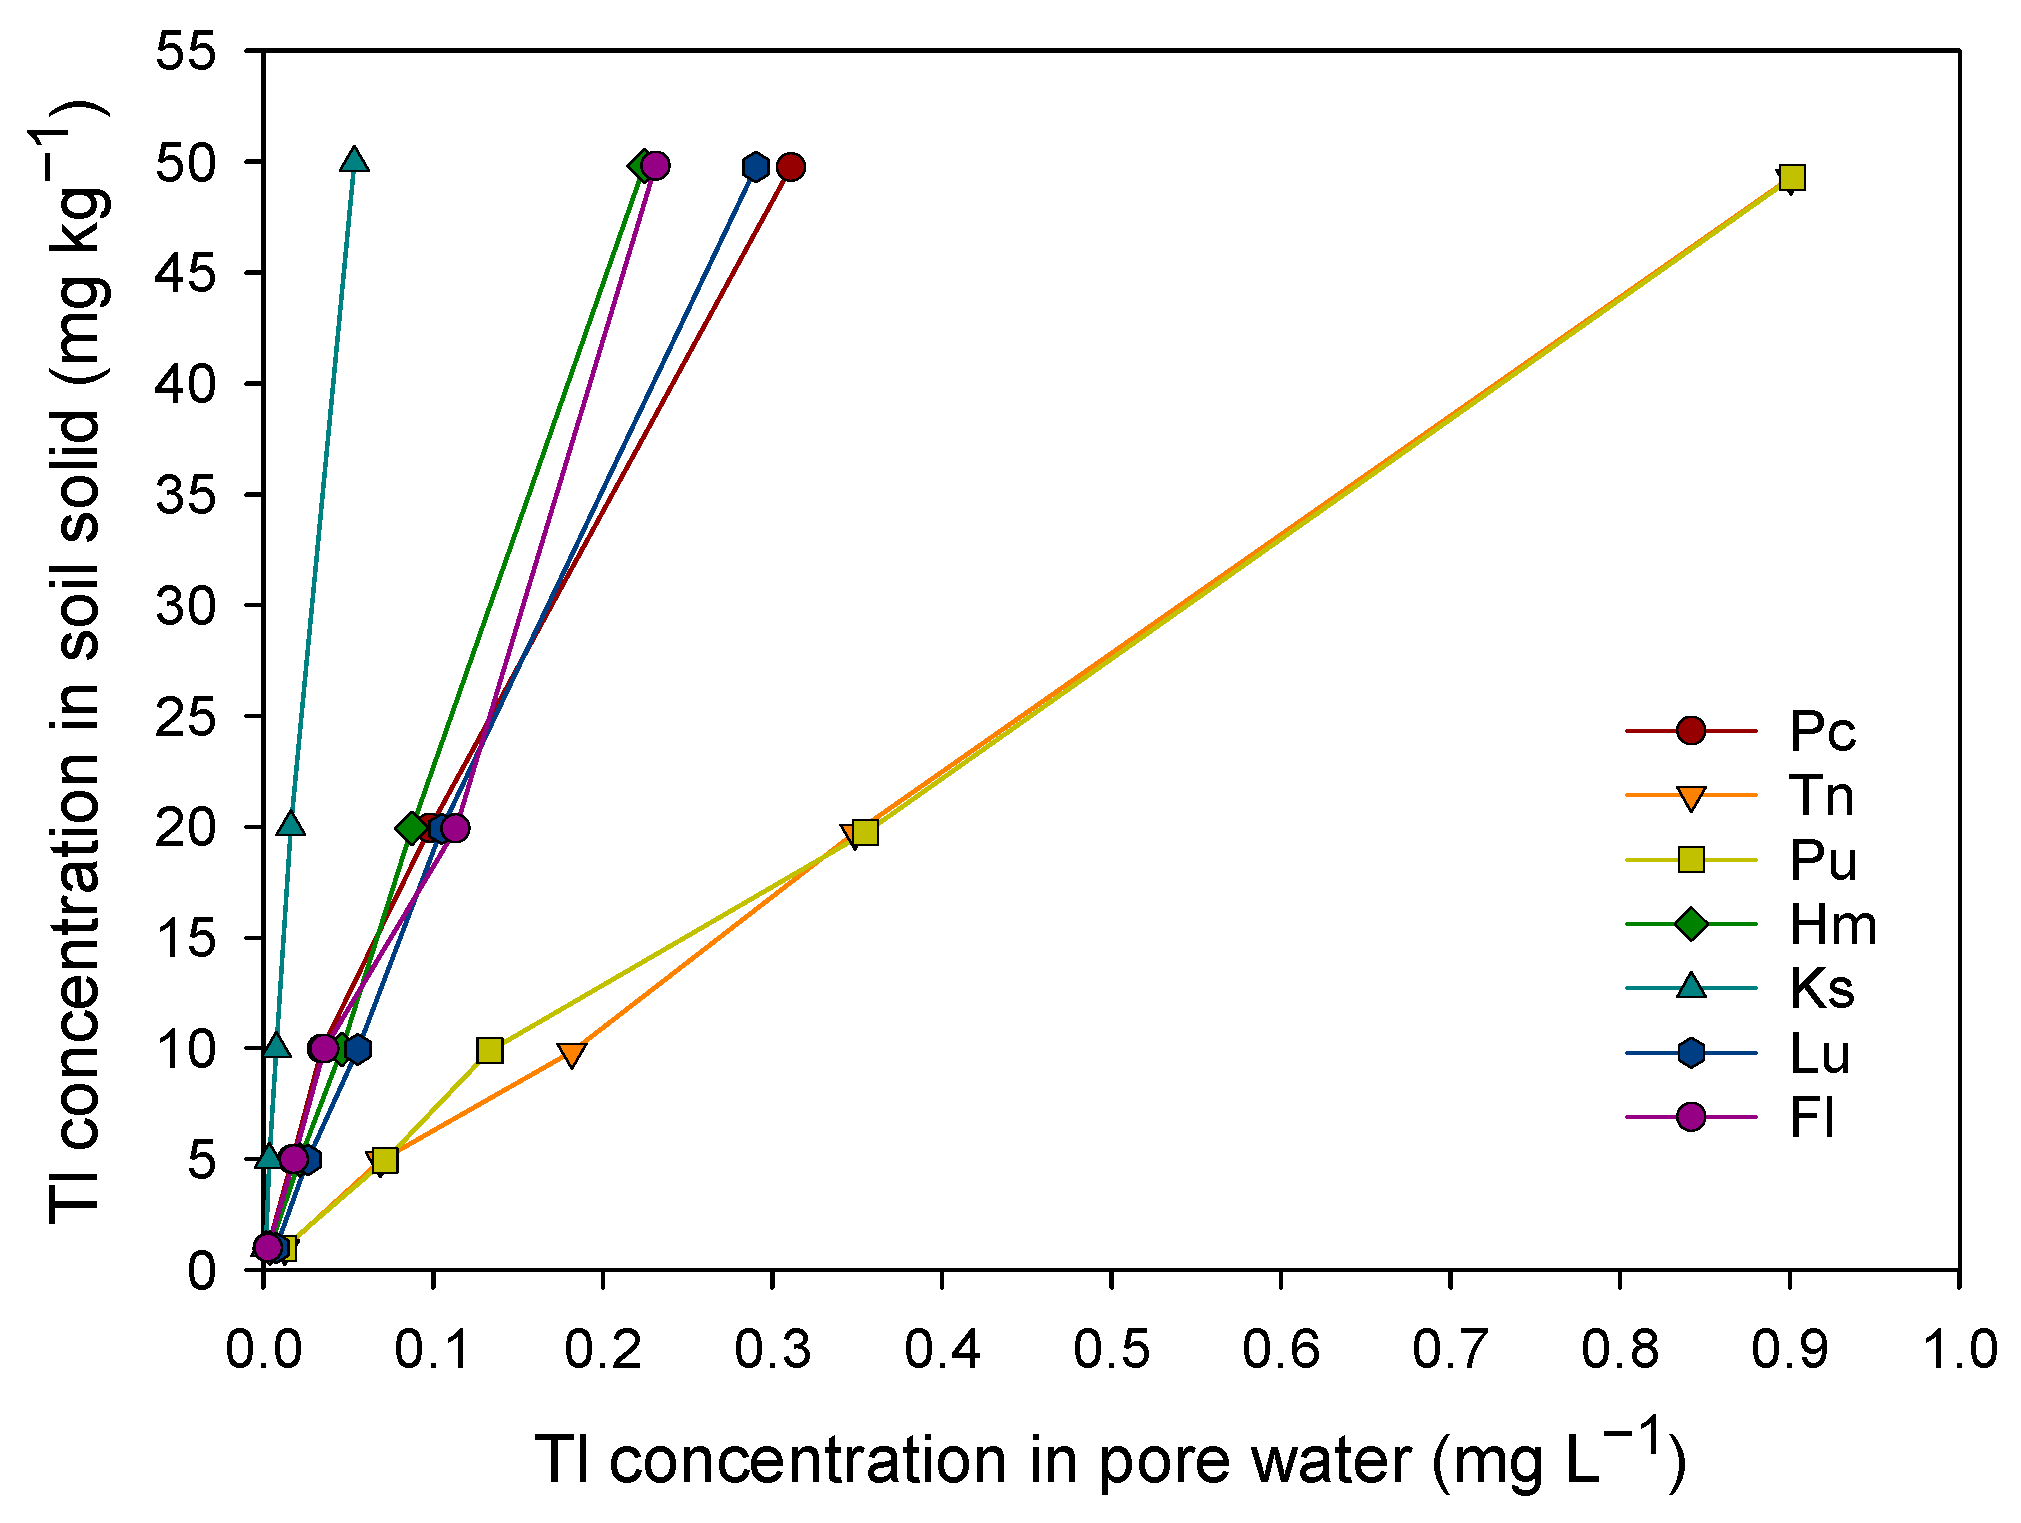
3.4. The Key Factors in Determining Soil Tl Availability

Figure 3 displays the total Tl accumulations of rice seedlings in various soils. To account for the high translocation rate of Tl in rice plants, the Tl accumulations in roots and shoots were combined to represent the overall soil Tl availability. At the lowest soil Tl level (i.e., Tl1), the Tl accumulation in the rice seedlings ranged from 0.20 (Pu soil) to 1.34 (Ks soil) μg per plant. At the highest soil Tl level (i.e., Tl50), the Tl accumulation ranged from 5.50 μg per plant (Hm soil) to 15.54 μg per plant (Pc soil) (Figure 3). Notably, there was a clear monotonic relationship between plant Tl accumulation and soil Tl level, but the correlation varied among the soils.
To identify the primary factors influencing soil Tl availability, the Pearson correlation analysis was conducted for the total Tl accumulation with various soil properties (Table 3). At Tl1, the Tl accumulation of rice seedlings is correlated with soil pH (r = 0.706), CEC (r = 0.583), Caex (r = 0.731), Mgex (r = 0.714), and Kex (r = −0.900). Statistically significant correlations were identified for Kex with p < 0.01 and pH, Caex, and Mgex with p < 0.05. However, with increasing soil Tl levels, the number of correlated soil properties and the corresponding correlation coefficient both decreased. For example, the Pearson correlation coefficient of plant Tl accumulation with Kex was −0.900 at Tl1, but it gradually decreased to −0.815 and −0.610 at Tl5 and Tl10 and eventually lost correlation at Tl20 and Tl50 (Table 3). Similar trends were also observed for pH, Caex, and Mgex. Plant Tl accumulation exhibited no statistically significant correlation with soil properties at Tl50, except for OM (r = −0.669; p < 0.05) (Table 3).
As Tl accumulation in rice seedlings increased at higher Tlsoil values, the loss of correlation with soil properties may be attributed to the dominance of physiological response to Tl toxicity in rice seedlings, as evidenced by the plant biomass and BCFs as a function of Tlsoil (Figure 1 and Table 2). Hence, at higher Tlsoil values, the toxic effects on plant growth make it challenging to observe the direct effects of soil properties on plant Tl accumulation across soil types. Conversely, the toxic effects of Tl accumulation in rice plants were least significant at lower Tlsoil values (such as Tl1 and Tl5), enabling the observation of the dependence of plant Tl accumulation on soil properties, such as soil pH, Caex, Mgex, and Kex, with statistical significances. Along with the strong intercorrelations among pH, Caex and Kex (r(pH/Caex) = 0.874; r(pH/Kex) = −0.730; r(Caex/Kex) = −0.735), and between CEC and Mgex (r = 0.967), cation exchange is determined to be the key process in determining the soil Tl availability (Table 3). This was consistent with the findings of previous research indicating that the primary mechanism responsible for the retention of Tl+ ions in soils is cation exchange reactions involving clay minerals, particularly 2:1 phyllosilicates such as smectite, vermiculite, and illite (Table S2) [18,24]. The structural layers of these 2:1 phyllosilicates contain negative surface charges, counterbalanced by exchangeable cations such as Na+, K+, Mg2+, and Ca2+ ions. They have a high retention capacity toward Tl+ ions via cation exchange reactions with the exchangeable cations [24].
Generally speaking, soil availability of metal contaminants depends on their distribution between solid and aqueous phases, predominantly regulated by the precipitation and adsorption reactions of metals in soils [16,41]. However, in the case of Tl(I), precipitation is less likely to occur in soils due to its high solubility [42]; thus, adsorption is the primary mechanism controlling the solid and aqueous distribution of Tl in soils [24,25]. This understanding aligns with the statistical correlation between rice Tl uptake and soil properties associated with cation exchange reactions (Table 3).
To delve deeper into the solid/aqueous distribution of soil Tl at different Tl levels, the Tl concentration in the pore water of each soil was plotted against the corresponding soil Tl concentration (Figure 4). The results show strong linear relationships (R2 > 0.97). The slopes of these linear relationships represent the in situ distribution coefficient Kd (L kg−1) as the indicator of the Tl partition between soil solid and aqueous phases. The Kd values followed the order Ks (967) > Hm (223) > Fl (209) > Lu (174) > Pc (166) > Pu (55.2) ~ Tn (55.0), showing significant variations among the soils, spanning approximately one order of magnitude. The Kd values were positively correlated with CEC (r = 0.938) and Mgex (r = 0.982) of the soils, both with statistical significance (p < 0.01) (Table 3). These correlations were consistent with previous findings that Tl(I) adsorption of soils is strongly dependent on the clay mineral content of the soils [18,24,25,43]. A previous study showed a negative correlation between Tl uptake in rice and CEC in contaminated areas irritated with mine drainage [44]. Soils with higher CEC exhibited higher Tl adsorptivity [24]. In this study, the clay soils with higher CEC and Mgex (such as Ks and Hm soils) exhibited higher Kd values compared to the soils with lower CEC and Mg (such as Tn and Pu soils) (Table 1; Figure 4). This further confirms the pivotal roles of cation exchange reactions on soil clay minerals in governing Tl(I) adsorption in soils [18,24].
Furthermore, the positive correlation of Kd with Mgex may imply the main binding sites of Tl+ ions to be the interlayers of vermiculite and smectite since a large fraction of interlayer cations are Mg2+ in vermiculite and smectite, as revealed in the previous study on the adsorption of Tl+ ions by soils [24]. Despite the strong affinity of illite toward Tl(I) [18,43], a previous study indicated that illite showed a limited effect on Tl retention in soils abundant in illite [19]. This may be attributed to the inhibitive effect of K+ ions on the adsorption of Tl+ ions by illite [18,24,29,43]. The inhibitive effects of interlayer K+ can also be observed from the negative correlation between Kd and Kex (r = −0.553), although this correlation is moderate and lacks statistical significance. As indicated by Martin et al. [18], the mobility of Tl(I) in soils is determined by the dual effects of the affinity of the binding sites toward Tl+ ions and the competition of background electrolytes (particularly K+) for the binding sites.
The parameter Kd obtained under specific Tl treatments could serve as an indicator of Tl in soil solution that is active for plant uptake. By employing the equation Csolution = Tlsoil/Kd (where Tl treatment is a constant among the soils), it becomes possible to normalize variations in soil properties. Accordingly, a contaminant with a higher Kd value is expected to be less mobile in soils and less available for plant uptake due to the inhibitive effect of soil adsorption reactions on its concentration in soil solution [40]. In the present study, the expectation of a negative correlation between plant Tl accumulation and Kd was partially supported by the correlations observed at Tl20 and Tl50, albeit with low correlations (Table 3). Therefore, higher Kd values associated with lower Tl accumulation in plants indicate reduced soil Tl availability for plant uptake. However, the surprising findings were the positive correlations of plant Tl uptake with Kd at Tl1 (r = 0.807; p < 0.01), Tl5 (r = 0.764; p < 0.05), and Tl10 (r = 0.684; p < 0.05) contradicting the expected negative trends (Table 3). Despite this contradiction, it is important to note that, for each soil, the plant Tl uptake did exhibit a clear increase with increasing Tl concentration in pore water, indicating the strong quantity–intensity relationship (Figure 5a). The discrepancy between the positive correlations of plant Tl uptake with Kd at lower Tlsoil values and the overall quantity–intensity relationship suggests the influence of unknown factors that govern rice Tl uptake, in addition to the cation exchange reactions that determine the release of Tl from soil solids into the pore water.
Plant uptake of Tl is regulated not only by the release of Tl(I) from soil solids to soil solution but also by its soil-to-root transfer process. Thus, the observed discrepancy in Tl uptake may be attributed to variations in the soil-to-root transfer process, which is dependent on the composition of the solution, soil reactions in plant rhizosphere, and the physiological and morphological properties of plant roots [45]. Plant roots act as the ultimate sink for soil elements in the plant rhizosphere [46]. Given the chemical similarity between Tl+ and K+ ions [47,48], plants could take up Tl+ ions as a replacement for K+ ions for the same transporter [49]. Previous studies on hydroponic cultures have demonstrated that the presence of K+ ions could inhibit Tl+ uptake by various plants [49,50,51]. To account for the competitive effects of K on plant Tl uptake, the ratio of Tl and K concentrations in pore water (i.e., [Tl]pore water/[K]pore water) was considered. This approach significantly improved the linear relationship of plant Tl uptake in different soils (R2 = 0.785) (Figure 5b), as compared to the relationship between plant Tl uptake and [Tl]pore water (R2 = 0.410) (Figure 5a). This finding suggests that the competition between K+ and Tl+ ions is the main plant-related factor in determining Tl soil-to-plant transfer and root Tl uptake, as the plant Tl uptake in different soils aligned well with a single linear relationship (Figure 5b). Therefore, the [Tl]pore water/[K]pore water ratio can be used as a predictive factor for plant Tl uptake. It is important to note that as plant roots take up K+ and Tl+ ions, their losses in soil solution are replenished by their releases from soil solids in the rhizosphere, which are controlled by their releases from soil solids via cation exchange reactions [45,46]. The correlations of plant Tl accumulation with the [Tl]pore water/[K]pore water ratio (Figure 5) and Kex (Table 3) both reflect the inhibitive role of K in the overall soil-to-plant transfer process of Tl uptake by rice plants.

4. Conclusions

This study showed the significant accumulation potential of Tl in rice seedlings across soils with diverse physicochemical properties. The BCF values consistently surpassed unity, indicating efficient uptake of Tl by rice roots and subsequent translocation to the shoots, irrespective of soil type and Tl concentration. The uptake and accumulation of Tl by rice seedlings were intricately linked to the release of Tl(I) from soil solids to soil solution and the soil-to-root transfer process, both controlled by cation exchange reactions involving Tl+ ions. Consequently, soil Tl availability for root uptake depended on the affinity of binding sites for Tl+ ions and the competition from background electrolytes for these binding sites. Among the various background electrolytes, the concentration of K+ ions in the soil solution and the exchangeable surface sites emerged as the key factors influencing the availability of Tl in the soil and its subsequent uptake by plants. Accordingly, soils with a low available K content exhibited higher Tl availability, posing a potential hazard in such environments. Conversely, increasing the K content through fertilization could be a viable strategy to reduce plant Tl accumulation under low levels of soil Tl contamination. This information is crucial for assessing the fate and risk of Tl in contaminated soils and developing effective strategies to mitigate soil Tl contamination for food safety purposes.

Supplementary Materials

The following supporting information can be downloaded at: https://www.mdpi.com/article/10.3390/agronomy14040718/s1, Table S1: The chemical composition of modified half-strength Kimura nutrient solution; Table S2: Clay mineral compositions of the tested soils; Figure S1: The toxic symptoms of rice seedlings as a function of soil Tl content; Analytical procedures of clay mineral composition of the tested soils [52,53,54].

Author Contributions

Conceptualization, L.-S.H.; methodology, P.-T.Y.; validation, Y.-A.L., W.-L.L. and T.-J.C.; formal analysis, P.-T.Y.; investigation, L.-S.H.; resources, S.-L.W.; data curation, Y.-A.L., T.-J.C. and W.-L.L.; writing—original draft preparation, L.-S.H.; writing—review and editing, S.-L.W.; visualization, L.-S.H. and Y.-A.L.; supervision, S.-L.W.; funding acquisition, S.-L.W. All authors have read and agreed to the published version of the manuscript.

Funding

This research was funded by the National Science and Technology Council, Taiwan (ROC) (Grant No. MOST-106-2313-B-002-017-MY3 and MOST-109-2313-B-002-048-MY3).

Data Availability Statement

The original contributions presented in the study are included in the article/Supplementary Materials. Further inquiries can be directed to the corresponding author.

Acknowledgments

The authors are grateful for the technical services provided by the National Synchrotron Radiation Research Center, a national user facility supported by the Ministry of Science and Technology of Taiwan (ROC).

Conflicts of Interest

The authors declare no conflicts of interest.

References

  1. Peter, A.L.; Viraraghavan, T. Thallium: A review of public health and environmental concerns. Environ. Int. 2005, 31, 493–501. [Google Scholar] [CrossRef] [PubMed]
  2. Viraraghavan, T.; Srinivasan, A. Thallium: Environmental Pollution and Health Effects. In Encyclopedia of Environmental Health; Nriagu, J.O., Ed.; Elsevier: Amsterdam, The Netherlands, 2011; pp. 325–333. [Google Scholar]
  3. Karbowska, B. Presence of thallium in the environment: Sources of contaminations, distribution and monitoring methods. Environ. Monit. Assess. 2016, 188, 640. [Google Scholar] [CrossRef]
  4. Liu, J.; Wang, J.; Chen, Y.H.; Shen, C.C.; Jiang, X.Y.; Xie, X.F.; Chen, D.Y.; Lippold, H.; Wang, C.L. Thallium dispersal and contamination in surface sediments from South China and its source identification. Environ. Pollut. 2016, 213, 878–887. [Google Scholar] [CrossRef]
  5. Cobelo-Garcia, A.; Filella, M.; Croot, P.; Frazzoli, C.; Du Laing, G.; Ospina-Alvarez, N.; Rauch, S.; Salaun, P.; Schafer, J.; Zimmermann, S. COST action TD1407: Network on technology-critical elements (NOTICE)—From environmental processes to human health threats. Environ. Sci. Pollut. Res. Int. 2015, 22, 15188–15194. [Google Scholar] [CrossRef]
  6. Willner, J.; Fornalczyk, A.; Jablonska-Czapla, M.; Grygoyc, K.; Rachwal, M. Studies on the Content of Selected Technology Critical Elements (Germanium, Tellurium and Thallium) in Electronic Waste. Materials 2021, 14, 3722. [Google Scholar] [CrossRef] [PubMed]
  7. Migaszewski, Z.M.; Gałuszka, A. Abundance and fate of thallium and its stable isotopes in the environment. Rev. Environ. Sci. Biotechnol. 2021, 20, 5–30. [Google Scholar] [CrossRef]
  8. LaCoste, C.; Robinson, B.; Brooks, R. Uptake of thallium by vegetables: Its significance for human health, phytoremediation, and phytomining. J. Plant Nutr. 2001, 24, 1205–1215. [Google Scholar] [CrossRef]
  9. Pavlickova, J.; Zbiral, J.; Smatanova, M.; Habarta, P.; Houserova, P.; Kuban, V. Uptake of thallium from naturally-contaminated soils into vegetables. Food Addit. Contam. 2006, 23, 484–491. [Google Scholar] [CrossRef]
  10. Lehn, H.; Schoer, J. Thallium-transfer from soils to plants—Correlation between chemical form and plant uptake. Plant Soil 1987, 97, 253–265. [Google Scholar] [CrossRef]
  11. Jiang, Y.; Wei, X.; He, H.; She, J.; Liu, J.; Fang, F.; Zhang, W.; Liu, Y.; Wang, J.; Xiao, T.; et al. Transformation and fate of thallium and accompanying metal(loid)s in paddy soils and rice: A case study from a large-scale industrial area in China. J. Hazard. Mater. 2022, 423, 126997. [Google Scholar] [CrossRef]
  12. Kabata-Pendias, A.; Szteke, B. Trace Elements in Abiotic and Biotic Environments; CRC Press: Boca Raton, FL, USA, 2015; p. 440. [Google Scholar]
  13. Jia, Y.L.; Xiao, T.F.; Zhou, G.Z.; Ning, Z.P. Thallium at the interface of soil and green cabbage (Brassica oleracea L. var. capitata L.): Soil-plant transfer and influencing factors. Sci. Total Environ. 2013, 450, 140–147. [Google Scholar] [CrossRef] [PubMed]
  14. Maluszynski, M.J.; Maluszynska, I. Evaluation of the soil quality from areas with varying degrees of pollution. Desalin. Water Treat. 2016, 57, 1034–1037. [Google Scholar] [CrossRef]
  15. Xiao, T.; Guha, J.; Boyle, D.; Liu, C.-Q.; Chen, J. Environmental concerns related to high thallium levels in soils and thallium uptake by plants in southwest Guizhou, China. Sci. Total Environ. 2004, 318, 223–244. [Google Scholar] [CrossRef] [PubMed]
  16. Violante, A.; Cozzolino, V.; Perelomov, L.; Caporale, A.G.; Pigna, M. Mobility and bioavailability of heavy metals and metalloids in soil environments. J. Soil Sci. Plant Nutr. 2010, 10, 268–292. [Google Scholar] [CrossRef]
  17. Madejon, P. Thallium. In Heavy Metals in Soils: Trace Metals and Metalloids in Soils and Their Bioavailability, 3rd ed.; Alloway, B.J., Ed.; Springer: New York, NY, USA, 2013; pp. 543–549. [Google Scholar]
  18. Martin, L.A.; Wissocq, A.; Benedetti, M.F.; Latrille, C. Thallium (Tl) sorption onto illite and smectite: Implications for Tl mobility in the environment. Geochim. Cosmochim. Acta 2018, 230, 1–16. [Google Scholar] [CrossRef]
  19. Vanek, A.; Komarek, M.; Vokurkova, P.; Mihaljevic, M.; Sebek, O.; Panuskova, G.; Chrastny, V.; Drabek, O. Effect of illite and birnessite on thallium retention and bioavailability in contaminated soils. J. Hazard. Mater. 2011, 191, 170–176. [Google Scholar] [CrossRef] [PubMed]
  20. Vanek, A.; Mihaljevic, M.; Galuskova, I.; Chrastny, V.; Komarek, M.; Penizek, V.; Zadorova, T.; Drabek, O. Phase-dependent phytoavailability of thallium—A synthetic soil experiment. J. Hazard. Mater. 2013, 250, 265–271. [Google Scholar] [CrossRef] [PubMed]
  21. Liu, J.; Lippold, H.; Wang, J.; Lippmann-Pipke, J.; Chen, Y. Sorption of thallium(I) onto geological materials: Influence of pH and humic matter. Chemosphere 2011, 82, 866–871. [Google Scholar] [CrossRef] [PubMed]
  22. Vanek, A.; Grosslova, Z.; Mihaljevic, M.; Ettler, V.; Chrastny, V.; Komarek, M.; Tejnecky, V.; Drabek, O.; Penizek, V.; Galuskova, I.; et al. Thallium contamination of soils/vegetation as affected by sphalerite weathering: A model rhizospheric experiment. J. Hazard. Mater. 2015, 283, 148–156. [Google Scholar] [CrossRef]
  23. Voegelin, A.; Pfenninger, N.; Petrikis, J.; Majzlan, J.; Plotze, M.; Senn, A.C.; Mangold, S.; Steininger, R.; Gottlicher, J. Thallium speciation and extractability in a thallium- and arsenic-rich soil developed from mineralized carbonate rock. Environ. Sci. Technol. 2015, 49, 5390–5398. [Google Scholar] [CrossRef]
  24. Lin, H.Y.; Chuang, T.J.; Yang, P.T.; Guo, L.Y.; Wang, S.L. Adsorption and desorption of thallium(I) in soils: The predominant contribution by clay minerals. Appl. Clay Sci. 2021, 205, 106063. [Google Scholar] [CrossRef]
  25. Wick, S.; Baeyens, B.; Fernandes, M.M.; Gottlicher, J.; Fischer, M.; Pfenninger, N.; Plotze, M.; Voegelin, A. Thallium sorption and speciation in soils: Role of micaceous clay minerals and manganese oxides. Geochim. Cosmochim. Acta 2020, 288, 83–100. [Google Scholar] [CrossRef]
  26. Bidoglio, G.; Gibson, P.N.; Ogorman, M.; Roberts, K.J. X-ray absorption spectroscopy investigation of surface redox transformations of thallium and chromium on colloidal mineral oxides. Geochim. Cosmochim. Acta 1993, 57, 2389–2394. [Google Scholar] [CrossRef]
  27. Cruz-Hernandez, Y.; Villalobos, M.; Marcus, M.A.; Pi-Puig, T.; Zanella, R.; Martinez-Villegas, N. Tl(I) sorption behavior on birnessite and its implications for mineral structural changes. Geochim. Cosmochim. Acta 2019, 248, 356–369. [Google Scholar] [CrossRef]
  28. Antic-Mladenovic, S.; Frohne, T.; Kresovic, M.; Stark, H.J.; Savic, D.; Licina, V.; Rinklebe, J. Redox-controlled release dynamics of thallium in periodically flooded arable soil. Chemosphere 2017, 178, 268–276. [Google Scholar] [CrossRef] [PubMed]
  29. Jacobson, A.R.; McBride, M.B.; Baveye, P.; Steenhuis, T.S. Environmental factors determining the trace-level sorption of silver and thallium to soils. Sci. Total Environ. 2005, 345, 191–205. [Google Scholar] [CrossRef]
  30. Thomas, G.W. Soil pH and soil acidity. In Methods of Soil Analysis. Part 3. Chemical Methods; Sparks, D.L., Ed.; Soil Science Society of America: Madison, WI, USA, 1996; pp. 475–490. [Google Scholar]
  31. Nelson, D.W.; Sommers, L.E. Total carbon, organic carbon, and organic matter. In Methods of Soil Analysis. Part 3. Chemical Methods; Sparks, D.L., Ed.; Soil Science Society of America: Madison, WI, USA, 1996; pp. 961–1010. [Google Scholar]
  32. Gee, G.W.; Bauder, J.W. Particle-size analysis. In Methods of Soil Analysis. Part 1. Physical and Mineralogical Methods, 2nd ed.; Klute, A., Ed.; Soil Science Society of America: Madison, WI, USA, 1986; pp. 383–411. [Google Scholar]
  33. Jackson, M.L.; Lim, C.H.; Zelazny, L.W. Oxides, hydroxides, and aluminosilicates. In Methods of Soil Analysis. Part 1. Physical and Mineralogical Methods, 2nd ed.; Klute, A., Ed.; Soil Science Society of America: Madison, WI, USA, 1986; pp. 101–150. [Google Scholar]
  34. Summer, M.E.; Miller, W.P. Cation exchange capacity and exchange coefficients. In Methods of Soil Analysis. Part 3. Chemical Methods; Sparks, D.L., Ed.; Soil Science Society of America: Madison, WI, USA, 1996; pp. 1201–1229. [Google Scholar]
  35. Schober, P.; Boer, C.; Schwarte, L.A. Correlation coefficients: Appropriate use and interpretation. Anesth. Analg. 2018, 126, 1763–1768. [Google Scholar] [CrossRef] [PubMed]
  36. Khan, A.; Khan, S.; Khan, M.A.; Qamar, Z.; Waqas, M. The uptake and bioaccumulation of heavy metals by food plants, their effects on plants nutrients, and associated health risk: A review. Environ. Sci. Pollut. Res. Int. 2015, 22, 13772–13799. [Google Scholar] [CrossRef] [PubMed]
  37. Antoniadis, V.; Levizou, E.; Shaheen, S.M.; Ok, Y.S.; Sebastian, A.; Baum, C.; Prasad, M.N.V.; Wenzel, W.W.; Rinklebe, J. Trace elements in the soil-plant interface: Phytoavailability, translocation, and phytoremediation—A review. Earth-Sci. Rev. 2017, 171, 621–645. [Google Scholar] [CrossRef]
  38. Ali, H.; Khan, E.; Ilahi, I. Environmental chemistry and ecotoxicology of hazardous heavy metals: Environmental persistence, toxicity, and bioaccumulation. J. Chem. 2019, 2019, 6730305. [Google Scholar] [CrossRef]
  39. Solymosi, K.; Bertrand, M. Soil metals, chloroplasts, and secure crop production: A review. Agron. Sustain. Dev. 2012, 32, 245–272. [Google Scholar] [CrossRef]
  40. Shaheen, S.M.; Tsadilas, C.D.; Rinklebe, J. A review of the distribution coefficients of trace elements in soils: Influence of sorption system, element characteristics, and soil colloidal properties. Adv. Colloid Interface Sci. 2013, 201–202, 43–56. [Google Scholar] [CrossRef] [PubMed]
  41. Kim, R.Y.; Yoon, J.K.; Kim, T.S.; Yang, J.E.; Owens, G.; Kim, K.R. Bioavailability of heavy metals in soils: Definitions and practical implementation-a critical review. Environ. Geochem. Health 2015, 37, 1041–1061. [Google Scholar] [CrossRef] [PubMed]
  42. Xiong, Y.L. The aqueous geochemistry of thallium: Speciation and solubility of thallium in low temperature systems. Environ. Chem. 2009, 6, 441–451. [Google Scholar] [CrossRef]
  43. Wick, S.; Baeyens, B.; Marques Fernandes, M.; Voegelin, A. Thallium adsorption onto illite. Environ. Sci. Technol. 2018, 52, 571–580. [Google Scholar] [CrossRef]
  44. Huang, X.; Li, N.; Wu, Q.; Long, J.; Luo, D.; Zhang, P.; Yao, Y.; Huang, X.; Li, D.; Lu, Y.; et al. Risk assessment and vertical distribution of thallium in paddy soils and uptake in rice plants irrigated with acid mine drainage. Environ. Sci. Pollut. Res. Int 2016, 23, 24912–24921. [Google Scholar] [CrossRef] [PubMed]
  45. York, L.M.; Carminati, A.; Mooney, S.J.; Ritz, K.; Bennett, M.J. The holistic rhizosphere: Integrating zones, processes, and semantics in the soil influenced by roots. J. Exp. Bot. 2016, 67, 3629–3643. [Google Scholar] [CrossRef]
  46. Jungk, A.; Claassen, N. Ion Diffusion in the Soil–Root System. Adv. Agron. 1997, 61, 53–110. [Google Scholar]
  47. Shannon, R.D. Revised effective ionic radii and systematic studies of interatomic distances in halides and chalcogenides. Acta Cryst. A 1976, 32, 751–767. [Google Scholar] [CrossRef]
  48. Nolan, A.; Schaumlöffel, D.; Lombi, E.; Ouerdane, L.; Łobiński, R.; McLaughlin, M. Determination of Tl (I) and Tl (III) by IC-ICP-MS and application to Tl speciation analysis in the Tl hyperaccumulator plant Iberis intermedia. J. Anal. Atom. Spectrom. 2004, 19, 757–761. [Google Scholar] [CrossRef]
  49. Renkema, H.; Koopmans, A.; Hale, B.; Berkelaar, E. Thallium and potassium uptake kinetics and competition differ between durum wheat and canola. Environ. Sci. Pollut. Res. 2015, 22, 2166–2174. [Google Scholar] [CrossRef] [PubMed]
  50. Kwan, K.; Smith, S. Some aspects of the kinetics of cadmium and thallium uptake by fronds of Lemna minor L. New Phytol. 1991, 117, 91–102. [Google Scholar] [CrossRef]
  51. Poscic, F.; Marchiol, L.; Schat, H. Hyperaccumulation of thallium is population-specific and uncorrelated with caesium accumulation in the thallium hyperaccumulator, Biscutella laevigata. Plant Soil 2013, 365, 81–91. [Google Scholar] [CrossRef]
  52. Soukup, D.A.; Buck, B.J.; Lynn, W.C. Preparing soils for mineralogical analyses. In Methods of Soil Analysis Part 5—Mineralogical Analysis; Ulery, A.L., Drees, L.R., Eds.; Soil Science Society of America: Madison, WI, USA, 2008; pp. 13–31. [Google Scholar]
  53. Harris, W.; White, G.N. X-ray diffraction techniques for soil mineral identification. In Methods of Soil Analysis Part 5—Mineralogical Methods; Ulery, A.L., Drees, L.R., Eds.; Soil Science Society of America: Madison, WI, USA, 2008; pp. 81–115. [Google Scholar]
  54. Johns, W.D.; Grim, R.E.; Bradley, W.F. Quantitative estimations of clay minerals by diffraction methods. J. Sediment. Petrol. 1954, 24, 242–251. [Google Scholar]
Figure 1. Root (a) and shoot (b) biomasses of rice seedlings grown in the tested soils spiked with 0 (control), 1, 5, 10, 20, and 50 mg kg−1 (ppm) Tl. Different letters for each soil indicate significant differences at p < 0.05.
Agronomy 14 00718 g001
Figure 2. Tl concentration in the roots (a) and shoots (b) of rice seedlings grown in the tested soils spiked with 0, 1, 5, 10, 20, and 50 mg kg−1 (ppm) Tl. Different letters for each soil indicate significant differences at p < 0.05.
Agronomy 14 00718 g002
Figure 3. Total Tl accumulation in rice seedlings (μg Tl plant−1) grown in the tested soils spiked with 0 (control), 1, 5, 10, 20, and 50 mg kg−1 Tl. Different letters for each soil indicate significant differences at p < 0.05.
Agronomy 14 00718 g003
Figure 4. Correlations between Tl concentrations in pore water and solid of the soils after the growth of rice seedlings.
Agronomy 14 00718 g004
Figure 5. Correlations of Tl accumulation in rice seedlings grown in different soils with (a) Tl concentration in pore water and (b) the molar ratio of Tl and K in pore water. The dashed lines represent the linear regression lines.
Agronomy 14 00718 g005
Table 1. The basic properties of the studied soils.
SoilpHSoil Texture 1OM 2
(g kg−1)
CEC 3
(cmolc kg−1)
Exchangeable Cations (mmol kg−1)Free Oxides
(g kg−1)
Amorphous Oxides
(g kg−1)
Tl
(mg kg−1)
CaexMgexKexNaexFedAldFeoAlo
Pc4.6SiCL13.57.64.20.82.90.31.223.020.931.220.57
Tn5.0SiL11.46.65.41.83.00.40.350.371.310.350.77
Pu5.7CL21.69.42.43.74.03.40.831.574.770.830.49
Hm6.1CL27.814.630.810.33.22.80.333.344.210.330.74
Ks6.9CL22.629.835.475.21.51.61.243.094.171.240.88
Lu7.0SiCL11.910.531.07.22.61.90.370.393.960.370.23
Fl8.0SiL9.85.536.72.60.90.70.510.561.630.510.70
1 CL: clay loam; SiCL: silty clay; SiL: silty loam; 2 OM: organic matter; 3 CEC: cation exchange capacity.
Table 2. The bioconcentration factors of Tl in rice seedlings grown in different soils.
Soil Tl Level
(mg kg−1)
Pc SoilTn SoilPu SoilHm SoilKs SoilLu SoilFl Soil
BCFR 1BCFS 2BCFRBCFSBCFRBCFSBCFRBCFSBCFRBCFSBCFRBCFSBCFRBCFS
123.53.812.22.27.91.921.31.725.613.321.76.722.414.7
59.67.212.46.65.65.612.91.922.79.617.06.515.79.3
1013.15.815.25.27.43.95.43.314.56.611.45.612.56.7
2012.14.214.04.69.13.83.62.68.23.18.43.57.54.4
5014.86.811.53.78.64.13.81.55.12.16.43.76.94.2
1 BCFR: Bioconcentration factor of roots = Tl concentration in roots/Tl concentration in soil; 2 BCFS: Bioconcentration factor of shoots = Tl concentration in shoots/Tl concentration in soil.
Table 3. Pearson correlations of total Tl accumulation in rice seedlings with soil properties and intercorrelations among soil properties.
Soil
Properties
Correlations of Tl Accumulation in Rice Seedlings with Soil
Properties
Intercorrelations among Soil Properties
Tl1Tl5Tl10Tl20Tl50pHOMCECFeoAloFedAldCaexMgexKexNaexKd
pH0.706 0.558 0.445 0.056 −0.192 1
OM−0.105 −0.279 −0.270 −0.553 −0.669 −0.079 1
CEC0.583 0.541 0.545 −0.308 −0.626 0.231 0.616 1
Feo0.022 −0.046 0.084 −0.124 −0.636 0.296 0.728 0.549 1
Alo0.410 0.437 0.340 0.335 0.323 −0.217 0.166 0.474 −0.032 1
Fed0.190 0.224 0.201 0.369 0.416 −0.380 0.175 0.327 −0.015 0.963 1
Ald0.110 −0.090 −0.098 −0.504 −0.217 −0.265 0.750 0.584 0.241 0.582 0.585 1
Caex0.731 0.526 0.502 −0.363 −0.415 0.8740.122 0.463 0.289 −0.199 −0.373 0.048 1
Mgex0.714 0.715 0.652 −0.157 −0.515 0.295 0.432 0.9670.402 0.535 0.348 0.458 0.467 1
Kex−0.900−0.815−0.610 −0.030 −0.062 −0.730 0.360 −0.265 0.286 −0.119 0.109 0.124 −0.735 −0.430 1
Naex−0.273 −0.376 −0.282 −0.116 −0.500 0.135 0.744 0.264 0.924−0.136 −0.051 0.229 0.067 0.088 0.512 1
Kd0.8070.764 0.684 −0.178 −0.423 0.364 0.370 0.9380.306 0.560 0.362 0.489 0.553 0.982−0.553 −0.011 1
Pearson correlation coefficient: |r| ≥ 0.7 strong correlation; 0.7 > |r| ≥ 0.5 moderate correlation; 0.5 > |r| ≥ 0.3 weak correlation; |r| < 0.3 no correlation. Boldface: statistical significance (p < 0.01; n = 7).
Disclaimer/Publisher’s Note: The statements, opinions and data contained in all publications are solely those of the individual author(s) and contributor(s) and not of MDPI and/or the editor(s). MDPI and/or the editor(s) disclaim responsibility for any injury to people or property resulting from any ideas, methods, instructions or products referred to in the content.

