Article

Impact of Duckweed (Lemna minor L.) Growing in Paddy Fields on Rice Yield and Its Underlying Causes

1
Jiangsu Key Laboratory of Crop Genetics and Physiology/Jiangsu Key Laboratory of Crop Cultivation and Physiology/Jiangsu Co-Innovation Center for Modern Production Technology of Grain Crops, Agricultural College of Yangzhou University, Yangzhou 225009, China
2
College of Environmental Science and Engineering, Yangzhou University, Yangzhou 225009, China
3
Institute of Maize and Featured Upland Crops, Zhejiang Academy of Agricultural Sciences, Dongyang 322100, China
*
Authors to whom correspondence should be addressed.
Agronomy 2024, 14(4), 726; https://doi.org/10.3390/agronomy14040726
Submission received: 23 February 2024 / Revised: 25 March 2024 / Accepted: 26 March 2024 / Published: 1 April 2024

Abstract

:
Duckweed growing in paddy fields (DGP) has substantially increased because of the effects of climate warming and/or eutrophication in irrigated water. Previous studies have primarily focused on investigating the effects of DGP as a nonchemical agent for enhancing rice productivity on nitrogen utilization in rice paddy fields. However, how DGP impacts rice yield remains poorly understood. Therefore, a field experiment with three representative rice cultivars was conducted to determine the effects of DGP on rice yield, considering ecological factors, photosynthetic capacity, spectral changes, and plant growth. The results showed that DGP significantly reduced the pH value by 0.6 and the daily water temperature by 0.6 °C, accelerated rice heading by 1.6 days and increased the soil and plant analyzer development (SPAD) and photosynthetic rate of leaves by 10.8% and 14.4% on average, respectively. DGP also markedly enhanced the values of various vegetation indices such as RARSc, MTCI, GCI, NDVI705, CI, CIrededge, mND705, SR705, and GM, and the first derivative curve of the rice canopy reflectance spectrum exhibited a ‘red shift’ phenomenon upon DGP treatment. Changes in the aforementioned factors may lead to average increases of 4.7% in plant height, 15.0% in dry matter weight, 10.6% in panicles m−2, 2.3% in 1000-grain weight, and ultimately a 10.2% increase in grain yield. The correlation observed suggested that the DGP-induced enhancement in grain yield can be achieved by reducing the pH and temperature of the paddy water, thus enhancing the SPAD value and photosynthesis of leaves and stimulating rice plant growth. These results could offer valuable theoretical support for the future sustainable development of agriculture and the environment through the biological synergy between rice and duckweed.

Graphical Abstract

1. Introduction

Duckweed (Lemna minor L.), has a simple structure, rapid reproductive rate, abundant nutrients, and diminutive size and is considered the world’s smallest higher plant. It typically inhabits the surfaces or slightly submerged areas of tranquil water bodies [1,2,3]. A marked increase in the prevalence of duckweed in paddy fields has been observed and correlated with heightened levels of fertilization, an increase in atmospheric CO2 concentrations, and elevated temperatures [4,5]. Notably, the increase in temperature is a central element of global climate change [6,7,8], which is a critical catalyst for the emergence of extreme weather phenomena and plays an important role in the proliferation of widespread floating plants [5]. Such developments exert a considerable influence on agricultural productivity, particularly in food crop cultivation [9,10]. Duckweed growing in paddy fields (DGP) can significantly reduce the water temperature and pH value [11,12]. The amplitude of the temperature decrease upon DGP is similar to that of the projected temperature increase in the middle and late centuries. In addition, duckweed grows rapidly, has a strong nitrogen fixation capacity [13,14,15,16], and produces an annual biomass of up to 8–13 × 103 kg ha−1 [17]. Its capacity for carbon and nitrogen fixation is in line with that of rice during the season. The presence of DGP demonstrates the adaptation of the paddy ecosystems to climate and environmental changes [5].
Currently, research into duckweed has largely focused on wastewater purification and energy utilization. Duckweed may alleviate environmental pollution, global climate change, and food shortages and may benefit sustainable agricultural development [3,11,18]. Agricultural research accounts for only 5.0% of the total [5], and most studies have focused on the interception of mineral elements, such as nitrogen and phosphorus, in water bodies and weed suppression by DGP. Research into the direct effect of DGP on rice growth based on agronomy or agriculture remains limited.
The application of industrially produced nitrogen fertilizers frequently used by conventional farming has played an important role in feeding the world’s population [19]; however, approximately 75% of nitrogen is lost to water and air, posing a considerable risk to the environment by contributing to freshwater ecotoxicity and eutrophication [20,21]. Improving nitrogen use efficiency (NUE) or organic cultivation in crop production is a key action [20]. In contrast to weeds, which compete for resources with rice and reduce rice grain yield, limited research has confirmed that DGP can improve NUE by 17.2–78.0% through efficiently recovering nitrogen from paddy water and thus increase grain yield [5], exhibiting a mutually beneficial symbiotic relationship with rice [3,4,22]. In other words, DGP is a nonchemical strategy for enhancing rice yield [16,23]. The main benefits of DGP are primarily centered around two aspects [12,24]: DGP significantly reduces the density of weeds in paddy fields (60.3–90.4%), thus greatly alleviating resource competition with rice [5]; DGP inhibits NH3 volatilization, thereby increasing NUE [4]. Moreover, DGP serves as a natural green organic fertilizer in paddies [16] and is more effective in diminishing the negative environmental effects of farming than a conventional system [20]. Similar effects have been observed after the use of other floating plants, such as Azolla imbricata [25,26].
As a fast-growing plant in paddy fields, duckweed has a far-reaching impact on rice field ecosystems apart from its physical coverage and fertilizer effects. DGP not only reduces the water temperature (from 0.86 °C to 2.76 °C), pH (0.32–0.39), and CH4 emissions (40%) and stimulates the oxidation of CH4 [11,12] but also influences rice growth by affecting dissolved oxygen levels (8.9%) and the release of allelopathic substances in paddies. DGP exhibits high bioremediation potential for mineral elements and thus has a distinct ‘permeable membrane effect’ in paddy fields [5]. How does DGP affect rice growth and yield formation? In our preliminary experiment conducted in concrete tanks filled with lotus-pond bottom soil, duckweed showed no significant impact on the grain yield of rice [27]. The result differed from most field experiment results [5]. The current understanding of the factors contributing to DGP’s impact on rice production remains limited. Therefore, we hypothesized that DGP would alter the ecological factors of paddy fields, such as water temperature and pH, thereby affecting rice leaf photosynthesis and canopy spectral structure, ultimately influencing rice growth and yield. To verify this hypothesis, we conducted a field experiment in Zhejiang and Jiangsu Provinces in China, using three representative local rice cultivars. Then, we systematically identified the reasons behind the impact of DGP on rice growth and yield on the basis the ecological factors, photosynthetic capacity and spectral changes, etc. These findings may provide a practical basis for green rice production and theoretical support for the sustainable agricultural and environmental development in the future climate based on rice-duckweed bio-cooperation.

2. Materials and Methods
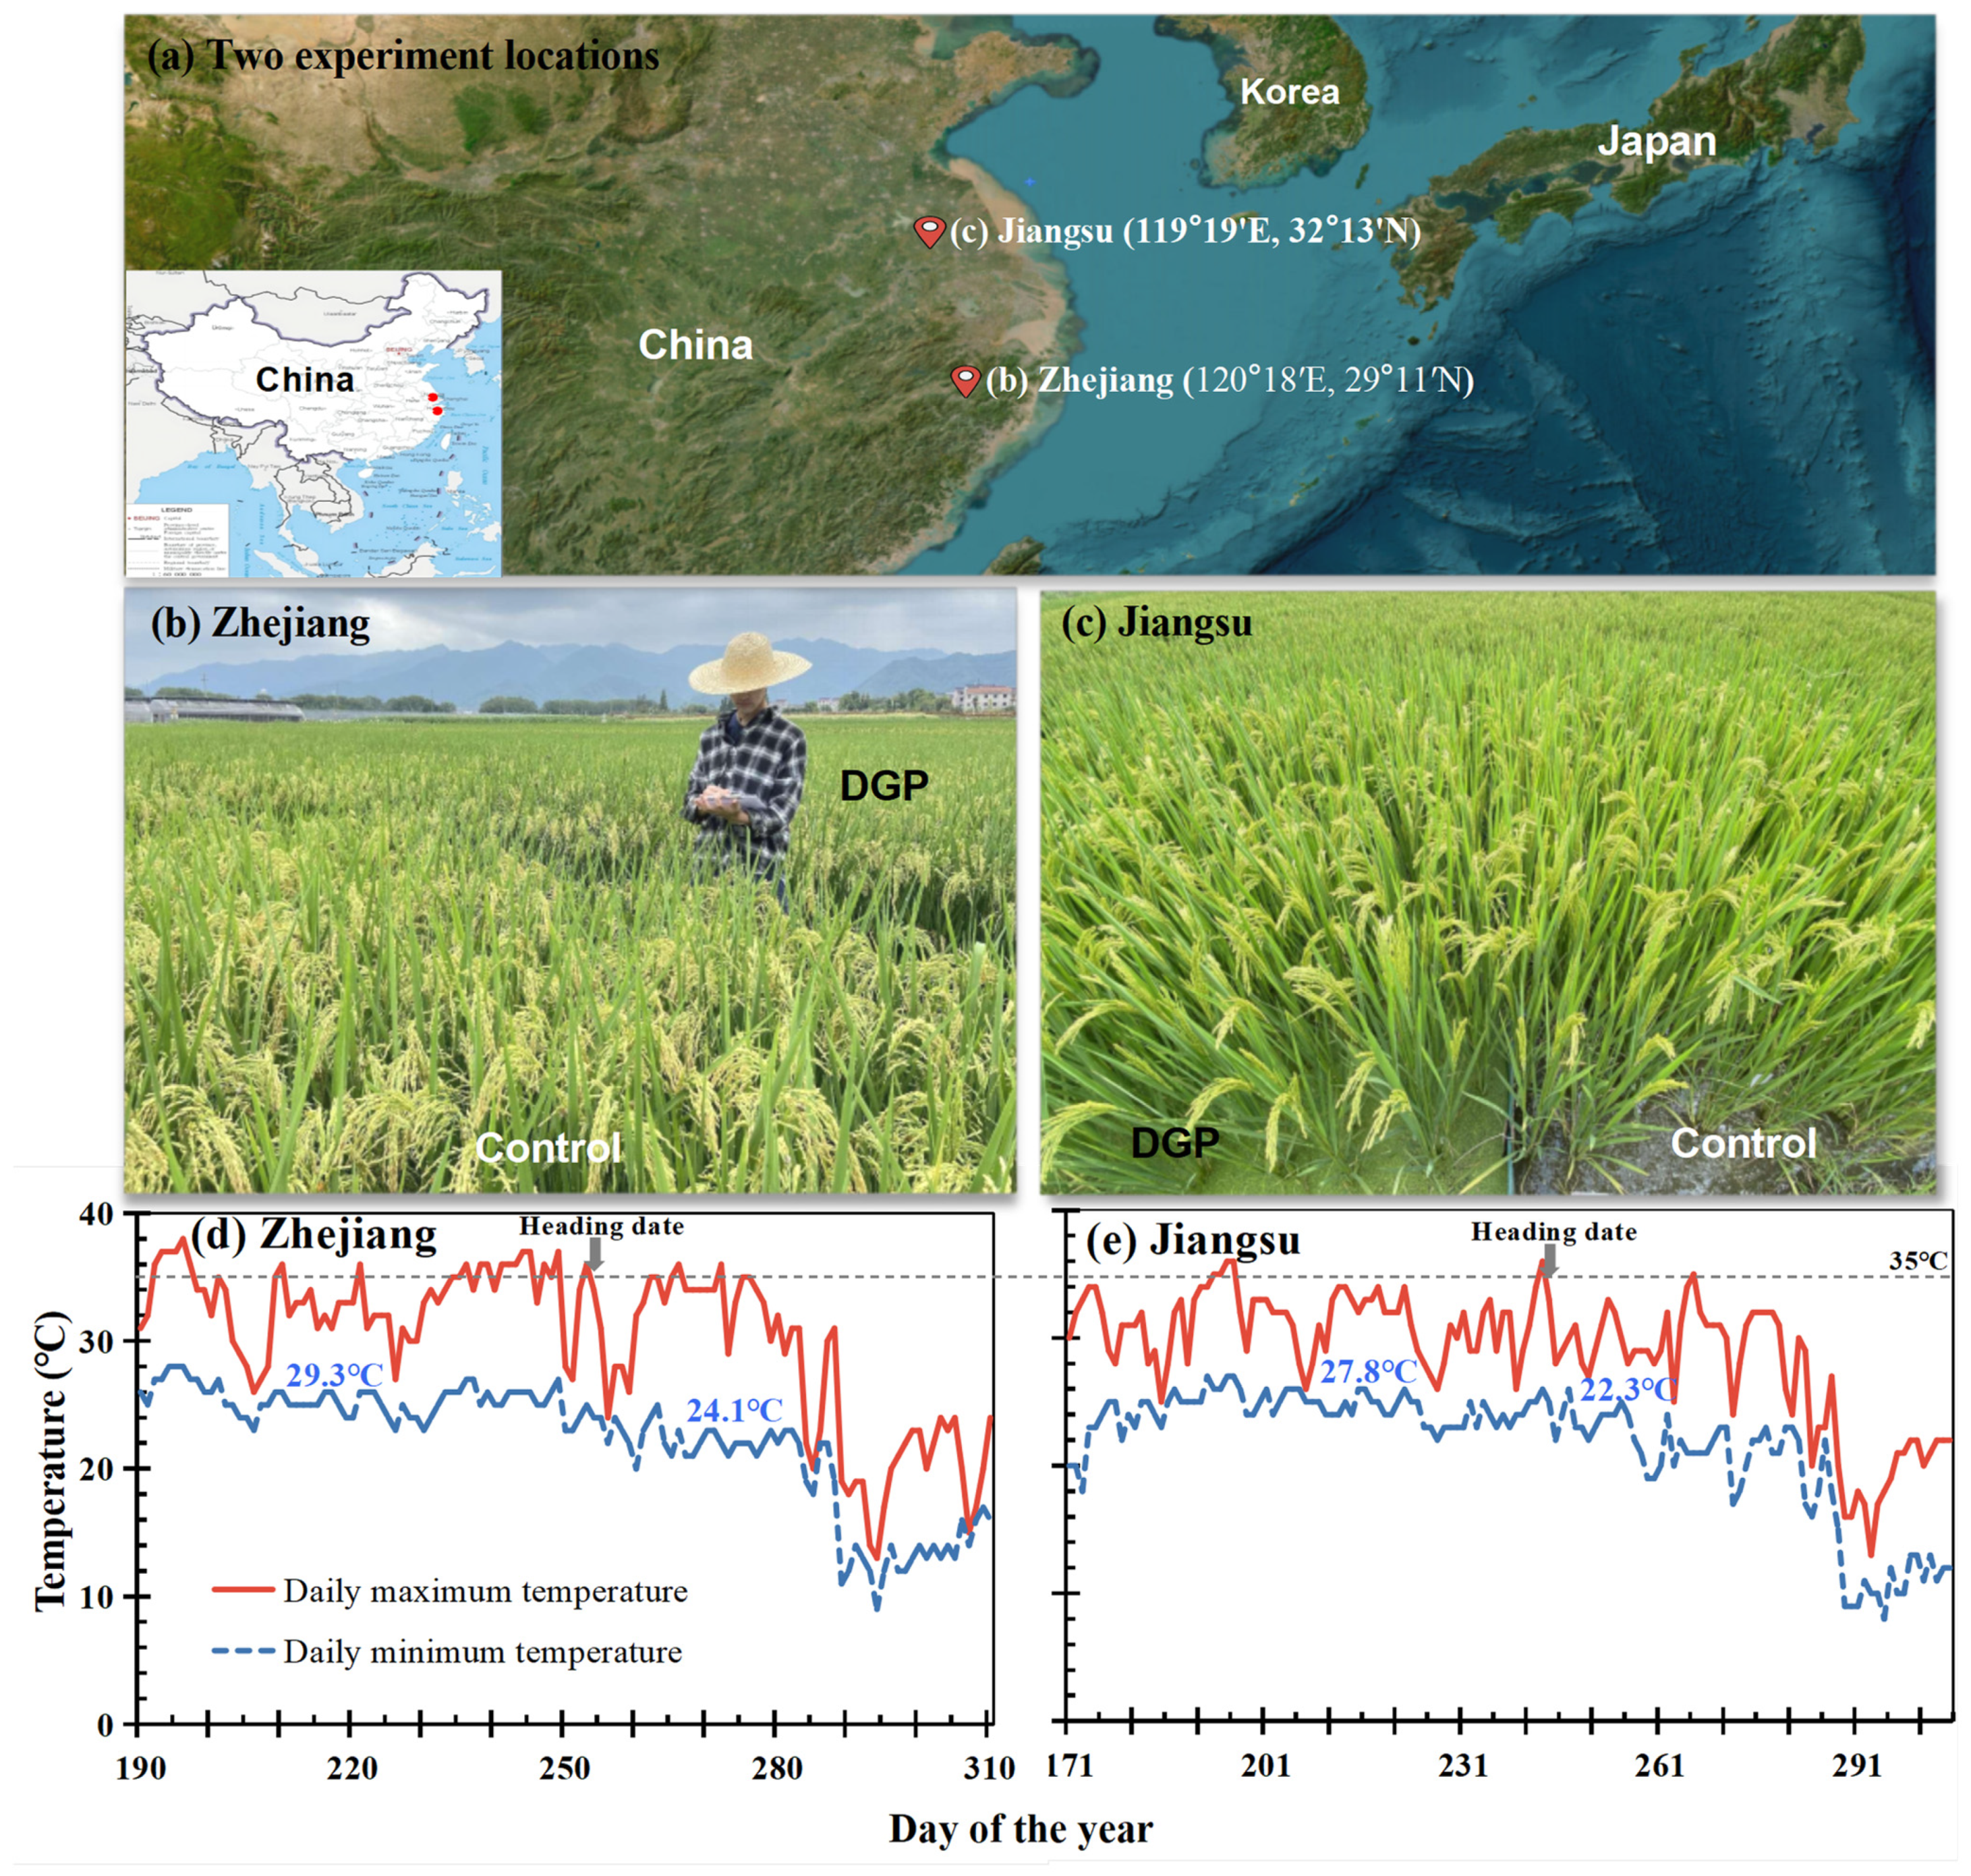
2.1. Study Site

The experiment was performed simultaneously in Zhejiang and Jiangsu Provinces (Figure 1a). The first experimental plot was on the farm of the Institute of Maize and Featured Upland Crops, which is located in Dongyang (120°18′ E, 29°11′ N; Figure 1b), Jinhua city, Zhejiang Province, China. It is composed of red soil with good irrigation and drainage facilities. The soil contained 19.9 g kg−1 organic matter, 1.21 g kg−1 total N, 83.9 mg kg−1 soil-available N, 7.0 mg kg−1 soil-available P, and 64.6 mg kg−1 soil-available K in the upper 20 cm. The pH value of the soil was 6.4.
The second experimental plot was in Shiye town (119°19′ E, 32°13′ N; Figure 1c), Zhenjiang city, Jiangsu Province, China. The soil used was an oily soil (percogenic paddy soil) with good irrigation and drainage facilities. The soil contained 29.2 g kg−1 organic matter, 1.43 g kg−1 total N, 111.0 mg kg−1 soil-available N, 13.8 mg kg−1 soil-available P, and 108.9 mg kg−1 soil-available K in the upper 20 cm. The pH value of the soil was 8.1. Figure 1d,e show the temperature changes during the rice growing period in Zhejiang and Jiangsu Provinces, respectively. The average temperatures prior to and following rice heading throughout the entire growth period were 29.3 °C and 24.1 °C in the Zhejiang plot compared to 27.8 °C and 22.3 °C in the Jiangsu plot, respectively.

2.2. Experimental Setup and Rice Cultivation

Rice seeds of JFY2, a popular hybrid cultivar in Zhejiang Province, were sowed in a nursing paddy on 20 June 2021. After 26 days (16 July), uniform rice plants were selected and manually transplanted into each plot. To investigate the universality of the DGP effect on rice and elucidate the disparities between japonica and hybrid cultivars, rice seeds of NJ5055 (japonica cultivar) and YY1540 (hybrid cultivar), two popular rice cultivars in Jiangsu Province, were simultaneously sowed in a nursing paddy on 20 May 2021. After 33 days (23 June), uniform rice plants were selected and manually transplanted into each plot. The areas of the plots in Zhejiang and Jiangsu Provinces were 2 m × 2 m and 4 m × 5 m, respectively. Two seedlings were sowed per hill for NJ5055, and one seedling was sowed per hill for YY1540 and JFY2.
The same field management practices were adopted for both experimental plots. In brief, the hills were 14 cm × 30 cm long, equivalent to 23.8 hills m−2. A compound chemical fertilizer (N:P2O5:K2O = 15:15:15) of 90 g m−2 at equal rates of 13.5 g P2O5 or K2O m−2 was applied as the basal dressing 1 day before transplantation. Nitrogen in the form of urea (N = 46%) at a rate of 19.5 g N m−2 was supplied as a jointing fertilizer 36 days after transplantation. Duckweed plants were cleaned with purified water (90 g m−2) and introduced into the treatment plots 1 day after rice transplantation. Throughout the growth period, duckweed was inspected, and infected duckweed was removed with a mesh screen every 3–7 days, so as to ensure that duckweed was prevented from growing in the control plots, and grew naturally in the treatment plots. In each control plot, a buffer zone with a radius of 0.9 m was established in the opposite direction of the water inlet and connected by the buried connector with filter screen. The connectors linked the buffer zone in the adjacent DGP plot, ensuring that both had the same water level. Pesticides and fungicides were applied when required throughout the experiment or according to the high-yield field management method.

2.3. Parameter Measurements

2.3.1. Temperature and pH

Irrigation was carried out for at least 48 h before temperature was measured. At 12:00 at noon, the water temperature 3 cm below the surface was measured with a thermometer as the daytime temperature; at 5:00 in the morning, the temperature at the same location was measured as the night temperature. On the day of temperature measurement, 50 mL of water was randomly collected from each community, immediately shaded, and returned to the laboratory. The pH of the water was determined using a pH meter (STARTER2100/3C PRO-B, OHAUS Company, Parsippany, NJ, USA). The canopy temperature of the paddy fields and the leaf temperature of the rice plants were obtained using a portable photosynthesis measurement system (LI-6400XT, Li-COR Company, Lincoln, NE, USA).

2.3.2. Leaf Area Indices of Duckweed Plants

The leaf area index (LAI) of DGP was measured using the gravimetric method: 65 duckweed plants (224 leaves) were randomly selected from paddy fields. After washing with pure water, the total area of all the leaves was quickly scanned using a leaf area analyzer (LI 300C, Li-COR Company, Lincoln, NE, USA). The average leaf area of a single duckweed plant was calculated to be 0.9586 cm2 (S1). After scanning, the samples were placed in a drying oven at 105 °C for 0.5 h and then dried to a constant weight at 75 °C. The total weight of all the duckweed plants was accurately measured, and the average dry weight of the individual duckweed plant was calculated to be 1.875 mg (M1). All floating duckweed plants within a random 660 cm2 region (22 cm × 30 cm, S2) were acquired from each experimental plot during different sampling periods. Dry matter weight (M) was determined using the method described above. The LAI of the DGP in each plot was calculated as LAI = M/(M1/1000) × S1/S2.

2.3.3. Photosynthesis Indices

Photosynthesis data were obtained between 10:00 and 14:00 on sunny days in the natural environment during the prefilling, mid-filling, and maturity stages. Plants under the same growth conditions were selected at the heading stage of rice, and a portable photosynthesis measurement system (LI-6400XT, Li-COR Company, Lincoln, NE, USA) was used to measure the net photosynthetic rate (Pn), stomatal conductance (Gs), intercellular CO2 concentration (Ci), transpiration rate (Tr), canopy air temperature (Tair), and leaf temperature (Tleaf). Leaf water use efficiency (WUE = Pn/Tr), percentage stomatal limitation (Ls, =1 − Ci/Ca; Ca, the ambient CO2 concentration), and apparent mesophyll conductance (AMC, =Pn/Ci) were calculated. Matching LED red and blue light sources were used to fill the light, and the CO2 concentration was controlled by a CO2 cylinder equipped with the instrument during the measurements. A 3 cm2 specific area in the central region of the representative sword leaf was carefully selected for the precise measurement of photosynthesis indices. The light intensity was precisely adjusted to 1200 μmol m−2s−1, and the CO2 concentration at ambient levels (400 μmol mol−1) was maintained. The mean soil and plant analyzer development (SPAD) values at the upper, middle, and lower points on each representative leaf were measured using a SPAD-502 (Konica Minolta Company, Tokyo, Japan).

2.3.4. ASD Canopy Spectrum

Spectral data of the rice canopy were collected using a spectroradiometer (ASD FieldSpec 4, Analytical Spectral Devices, Longmont, CO, USA) from 10:00 to 14:00 under clear and windless weather conditions at the prefilling, mid-filling, and maturity stages, respectively. The band range was 350–2500 nm, of which the 350–1350 nm spectral resolution was 3 nm, the 1001–2500 nm range was 8 nm, and the spectral data acquisition interval was 1 nm. The instrument was preheated for at least 30 min before the measurement. During the measurement, the sensor probe was vertically directed approximately 30 cm from the canopy; the tester faced sunlight and was more than 1.6 m away from the sensor probe horizontally. Five representative areas in each plot were measured, with six measurements taken at each time. The average value was then used as the spectral reflectance profile for the plot, with whiteboard calibration performed prior to each measurement. To avoid interference from light intensity, the same batch of samples was collected in as little time as possible.
To study the effect of DGP on the spectral characteristics of the rice canopy, the parameters with significant responses are presented from all the vegetation indices or spectral characteristic parameters in the following references (Table 1).

2.3.5. Accumulation of Dry Matter and Theoretical Yields

The heading date was recorded at the heading stage (approximately 50% of the plants were headed). At the maturity stage, the number of panicles and plant height were determined in a 1 m2 area which was randomly selected from each plot. The theoretical yield and its components were obtained from five representative plants per plot.

2.4. Statistical Analysis

A two-factor randomized block design was employed in Jiangsu Province, and a completely random design was employed in Zhejiang Province in this experiment. Each treatment was replicated three times. The ASD ViewSpec Pro (Analytical Spectral Devices, Inc., Longmont, CO, USA) was used to read and preprocess the reflection spectra data of the ASDs, and the means of all the spectral curves in the same plot were calculated. The reflection spectra were collected at 350–1350 nm to avoid water interference. Origin 2021pro (OriginLab Company, Northampton, MA, USA) was used to create the correlation analysis figure of the effects of DGP on the spectral characteristics of rice canopy, and the first derivative curve was calculated for the spectral reflectance after smoothing with the Savitzky–Golay method at a window count of 8. Figures in Section 3.4 and Section 3.5 and tables were created using Excel 2021 (Microsoft, Redmond, WA, USA), and data analysis was performed using SPSS 26 (IBM, Armonk, NY, USA) to determine the main effects of DGP. ** p ≤ 0.01, * p ≤ 0.05, + p ≤ 0.1, and not statistically significant (ns) p > 0.1 indicate statistically significant effects. Pearson’s correlations were calculated to determine the relationships between the different parameters.

3. Results

3.1. Ecological Factors of the Paddy Fields

DGP reduced the average day temperature of water in the paddy fields during the entire growth period by 0.6 °C, with average decreases occurring at the jointing, mid-filling, and maturity stages of 0.4 °C, 0.9 °C, and 0.3 °C, respectively (Table 2). However, DGP had little effect on the night temperature, with an average increase of only 0.2 °C. In contrast, DGP had a substantial influence on the ΔT (temperature difference between day and night), resulting in an average decrease of 0.8 °C, and the average decreases in the three growth periods were 0.9 °C, 1.0 °C, and 0.3 °C, respectively. However, DGP had little effect on the canopy air and leaf temperature of rice plants at these three stages, with an average increase of only 0.1 °C, but the root/canopy temperature difference increased by 0.7 °C. DGP significantly reduced the pH of paddy water by 0.6 on average, and the response in the early stage (0.8) was twice that in the late stage (0.4). Similarly, the leaf area indices (LAIs) of duckweed under DGP conditions during the tillering and grain filling stages were similar, both ca. 2.5, with that in japonica rice paddy being slightly greater in LAI than hybrid rice. The ANOVA results revealed significant differences among the cultivars, but the interaction effects between the DGP and cultivars were mostly nonsignificant.

3.2. Photosynthesis Traits and SPAD Values

DGP resulted in a significant increase in the Pn, AMC, and SPAD values of the rice leaves throughout the growth stage, with average increases of 14.4%, 13.6%, and 10.8%, respectively (Table 3). Notably, the most pronounced effects were observed during the prefilling stage. DGP led to significant increases in the Gs and Tr of NJ5055 and YY1540 during the prefilling and mid-filling stages, with average increases of 31.2% and 21.5%, respectively, across the two cultivars and growth periods. DGP simultaneously led to significant increases in WUE and Ls of 28.0% and 27.6%, respectively. Significant interactions between DGP and cultivars on the photosynthesis traits were only detected at the prefilling stage.

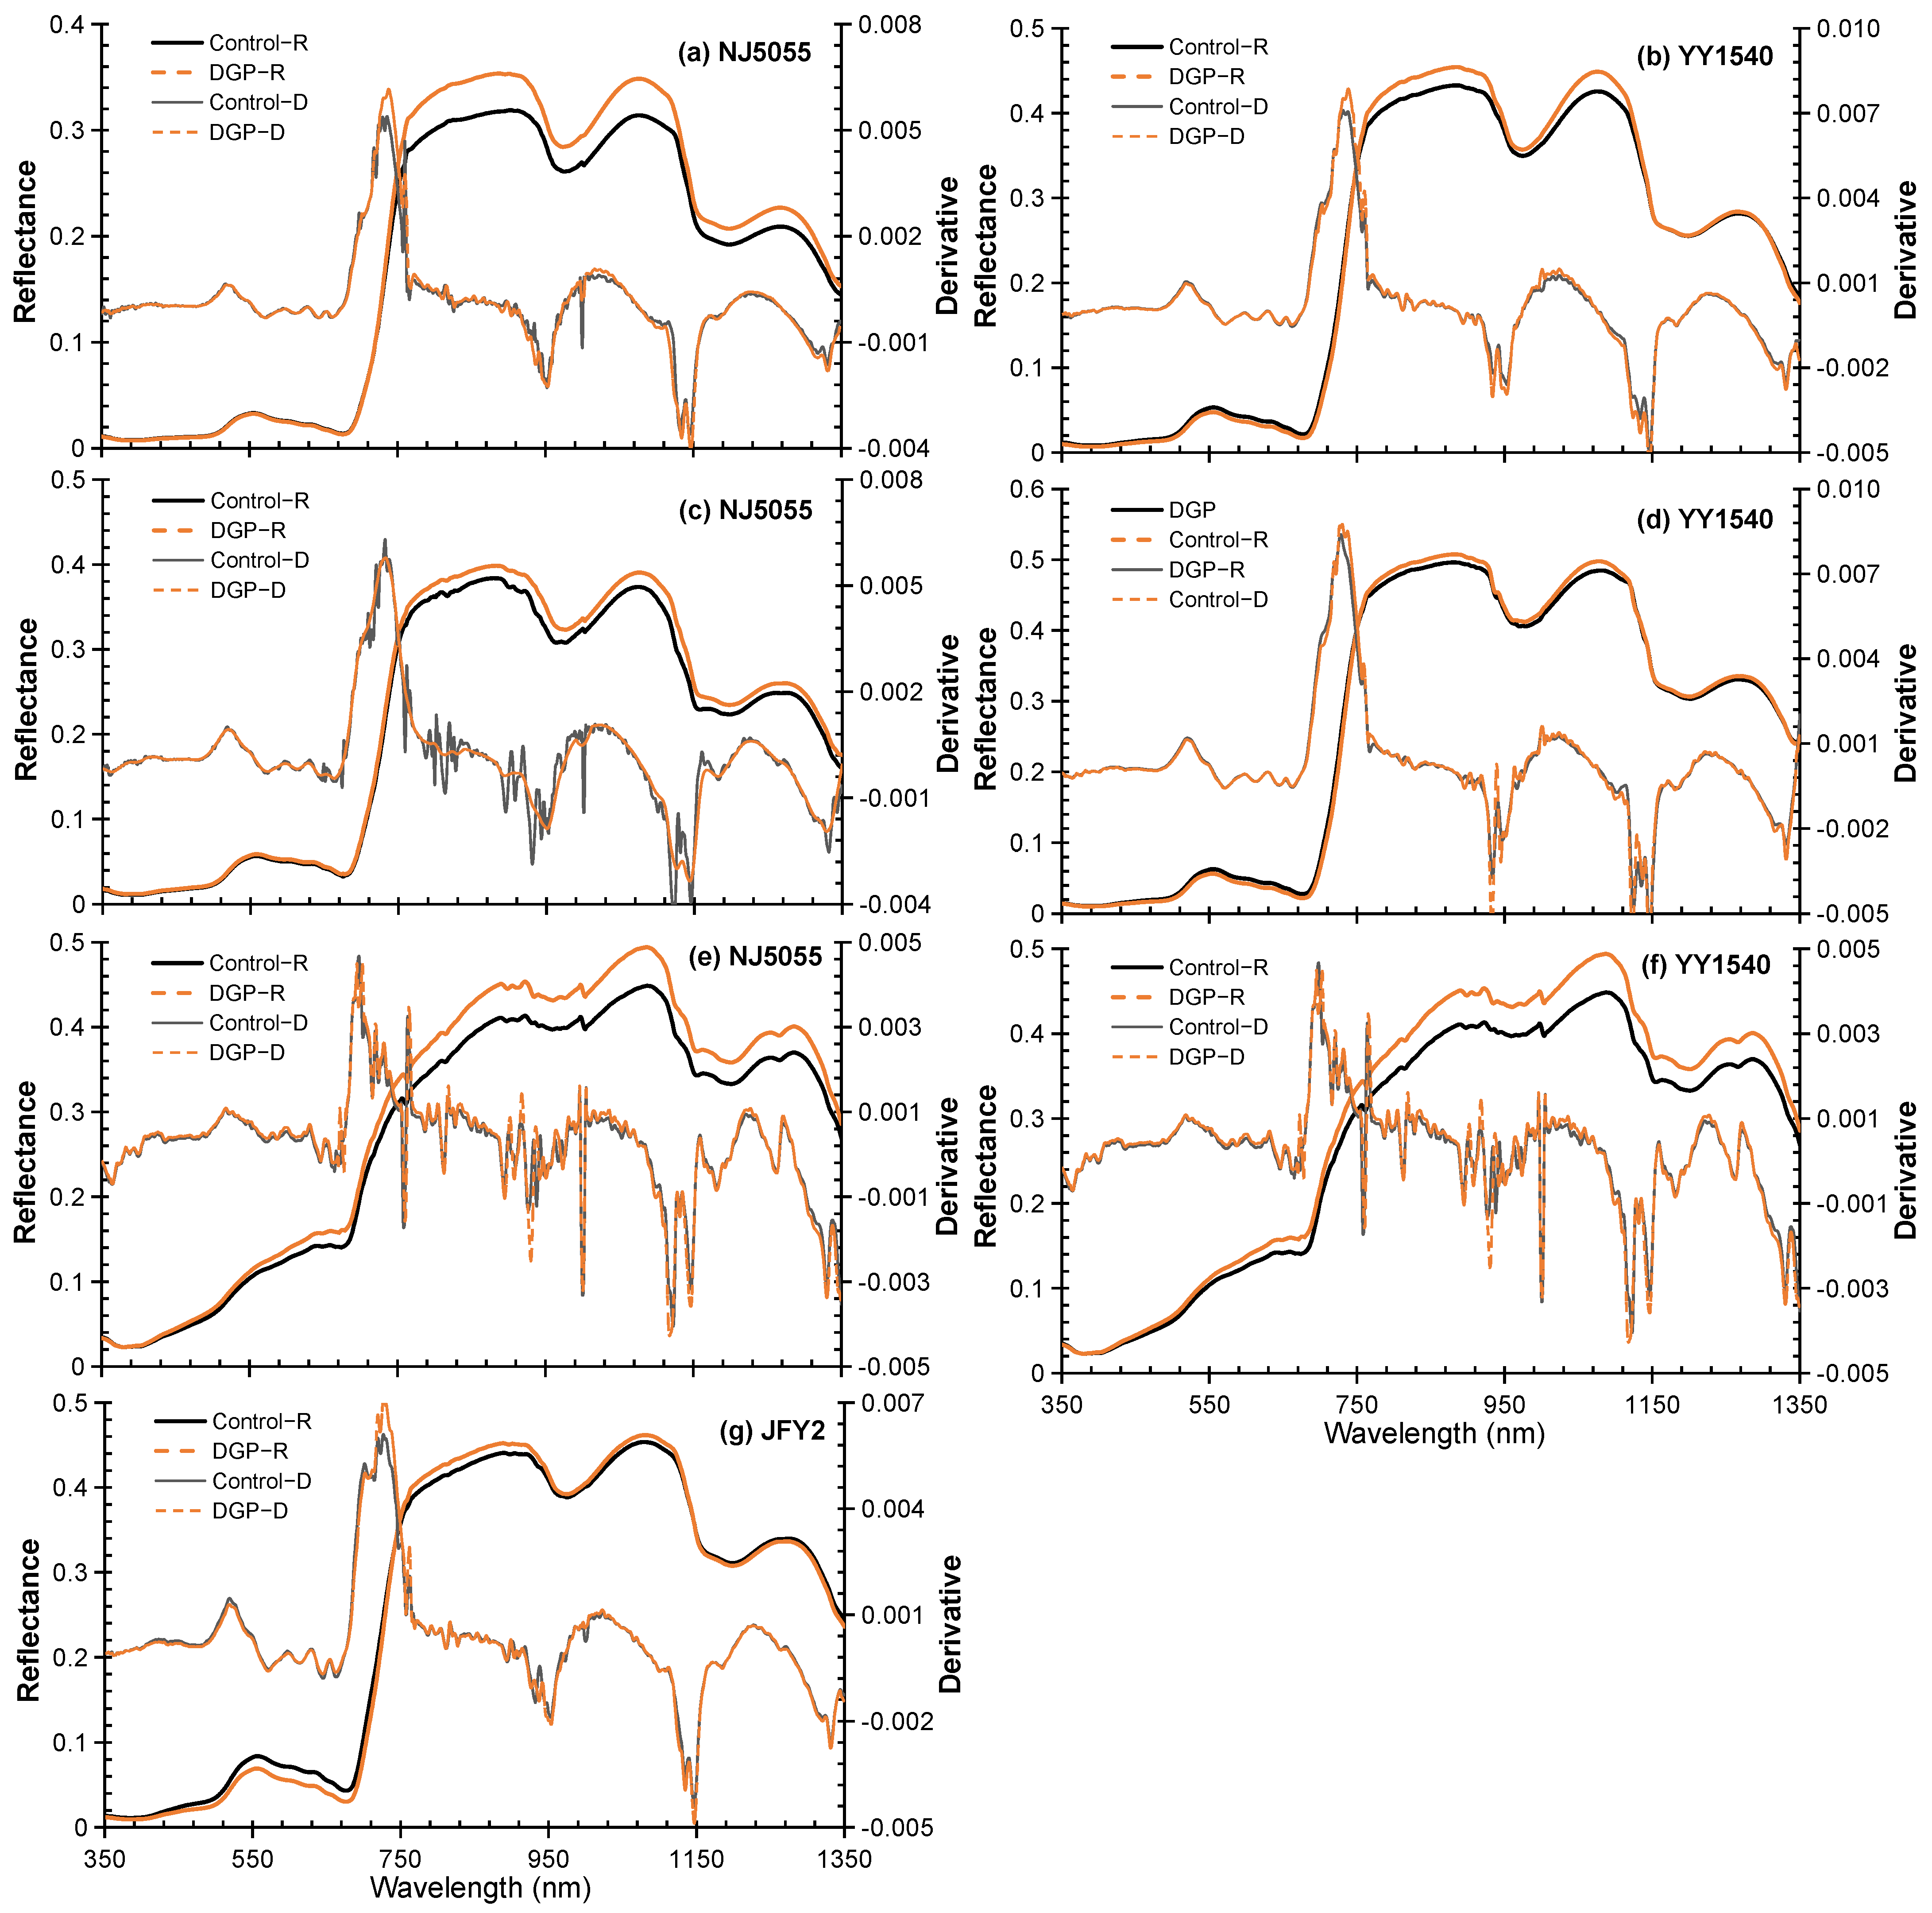
3.3. Spectral Characteristics of the Rice Canopy

The canopy reflectance spectra of the different rice cultivars exhibited similar characteristics (Figure 2): there were obvious ‘green peaks’ and ‘red valleys’ near 550 nm and 680 nm in the visible light band (350–680 nm) at the prefilling and mid-filling stages, respectively, of rice, while the ‘green peaks’ disappeared at maturity. In the range of 680–780 nm, the spectral reflectance increased sharply, and the maximum increase was attributed to the ‘red edge’, i.e., the peak value of its first derivative curve. In the infrared wavelength range of 780–1350 nm, the absorption peaks in the spectral reflectances were observed near 900, 1100, and 1280 nm, respectively. The influence of DGP on the spectral characteristics of the rice canopy was relatively small during the mid-filling stage but relatively large during the prefilling and maturity stages and was mainly concentrated in the infrared range from 760 to 1160 nm. At the prefilling and mid-filling stages, the absorption of the canopy spectra in the DGP treatments in the visible spectrum (350–680 nm) was significantly greater in the hybrid rice cultivars (YY1540 and JFY 2) than that in the control. However, for the japonica rice cultivar (NJ5055), the spectral curves of both the reflectance and derivative in the controls and treatments almost overlapped. At the maturity stage, both japonica and hybrid rice plants exhibited a consistent pattern of weaker spectral absorption in the DGP treatment than in the control. In the 780–1350 nm range, the spectral reflectance of the rice canopy under different cultivars and growth stages was greater in the DGP treatments than that in the controls. The first derivative curves of different growth stages showed that the peak near 700 nm moved to the right, revealing an obvious ‘red shift’ phenomenon. With the growth process, the intensity of the ‘red shift’ and red edge gradually weakened, indicating that DGP exerted a great influence on the canopy spectrum of rice during the filling stage, especially for the hybrid cultivars.
To further verify the effects of DGP on the spectral characteristics of the rice canopy, the results were calculated after extracting the characteristic values of spectral reflectance (Table 4): averaging across the entire grain filling stages and cultivars, DGP significantly increased the vegetation indices RARSc, MTCI, GCI, NDVI705, CI, CIrededge, mND705, SR705, and GM in the rice canopy by 15.7%, 15.1%, 14.4%, 7.5%, 20.4%, 10.1%, 8.3%, 13.8%, and 18.2%, respectively. NDVI705 and mND705 exhibited increasing trends during the filling process, whereas the other indicators exhibited decreasing trends. Owing to the variable canopy structures of the different rice cultivars, there were significant differences among the cultivars at the different growth stages. With the filling process, the significant indices of the DGP × cultivar interaction gradually increased.

3.4. Grain Yield and Structural Components

DGP significantly increased dry matter weight, plant height (Figure 3), and grain yield (Table 5) by 15.0%, 4.7%, and 10.2%, respectively. The effect on the yield of japonica rice NJ5055 was greater (12.3%) than that on the yield of the two other hybrid rice cultivars (9.1% on average). No significant effect on the harvest indices was detected for either japonica or hybrid cultivars. Under DGP treatments, the heading date of the three cultivars occurred 1.6 days earlier on average, with a much greater effect observed for japonica rice (2.4 days) than for the hybrids (1.2 days on average). The increase in grain yield was mainly due to the increase in panicle m−2 (10.6%), followed by the increase in 1000-grain weight (2.3%). However, DGP had little effect on the number of spikelets per panicle or the seed-setting rate. No significant interaction effects were detected for these indices, except for the seed setting rate.

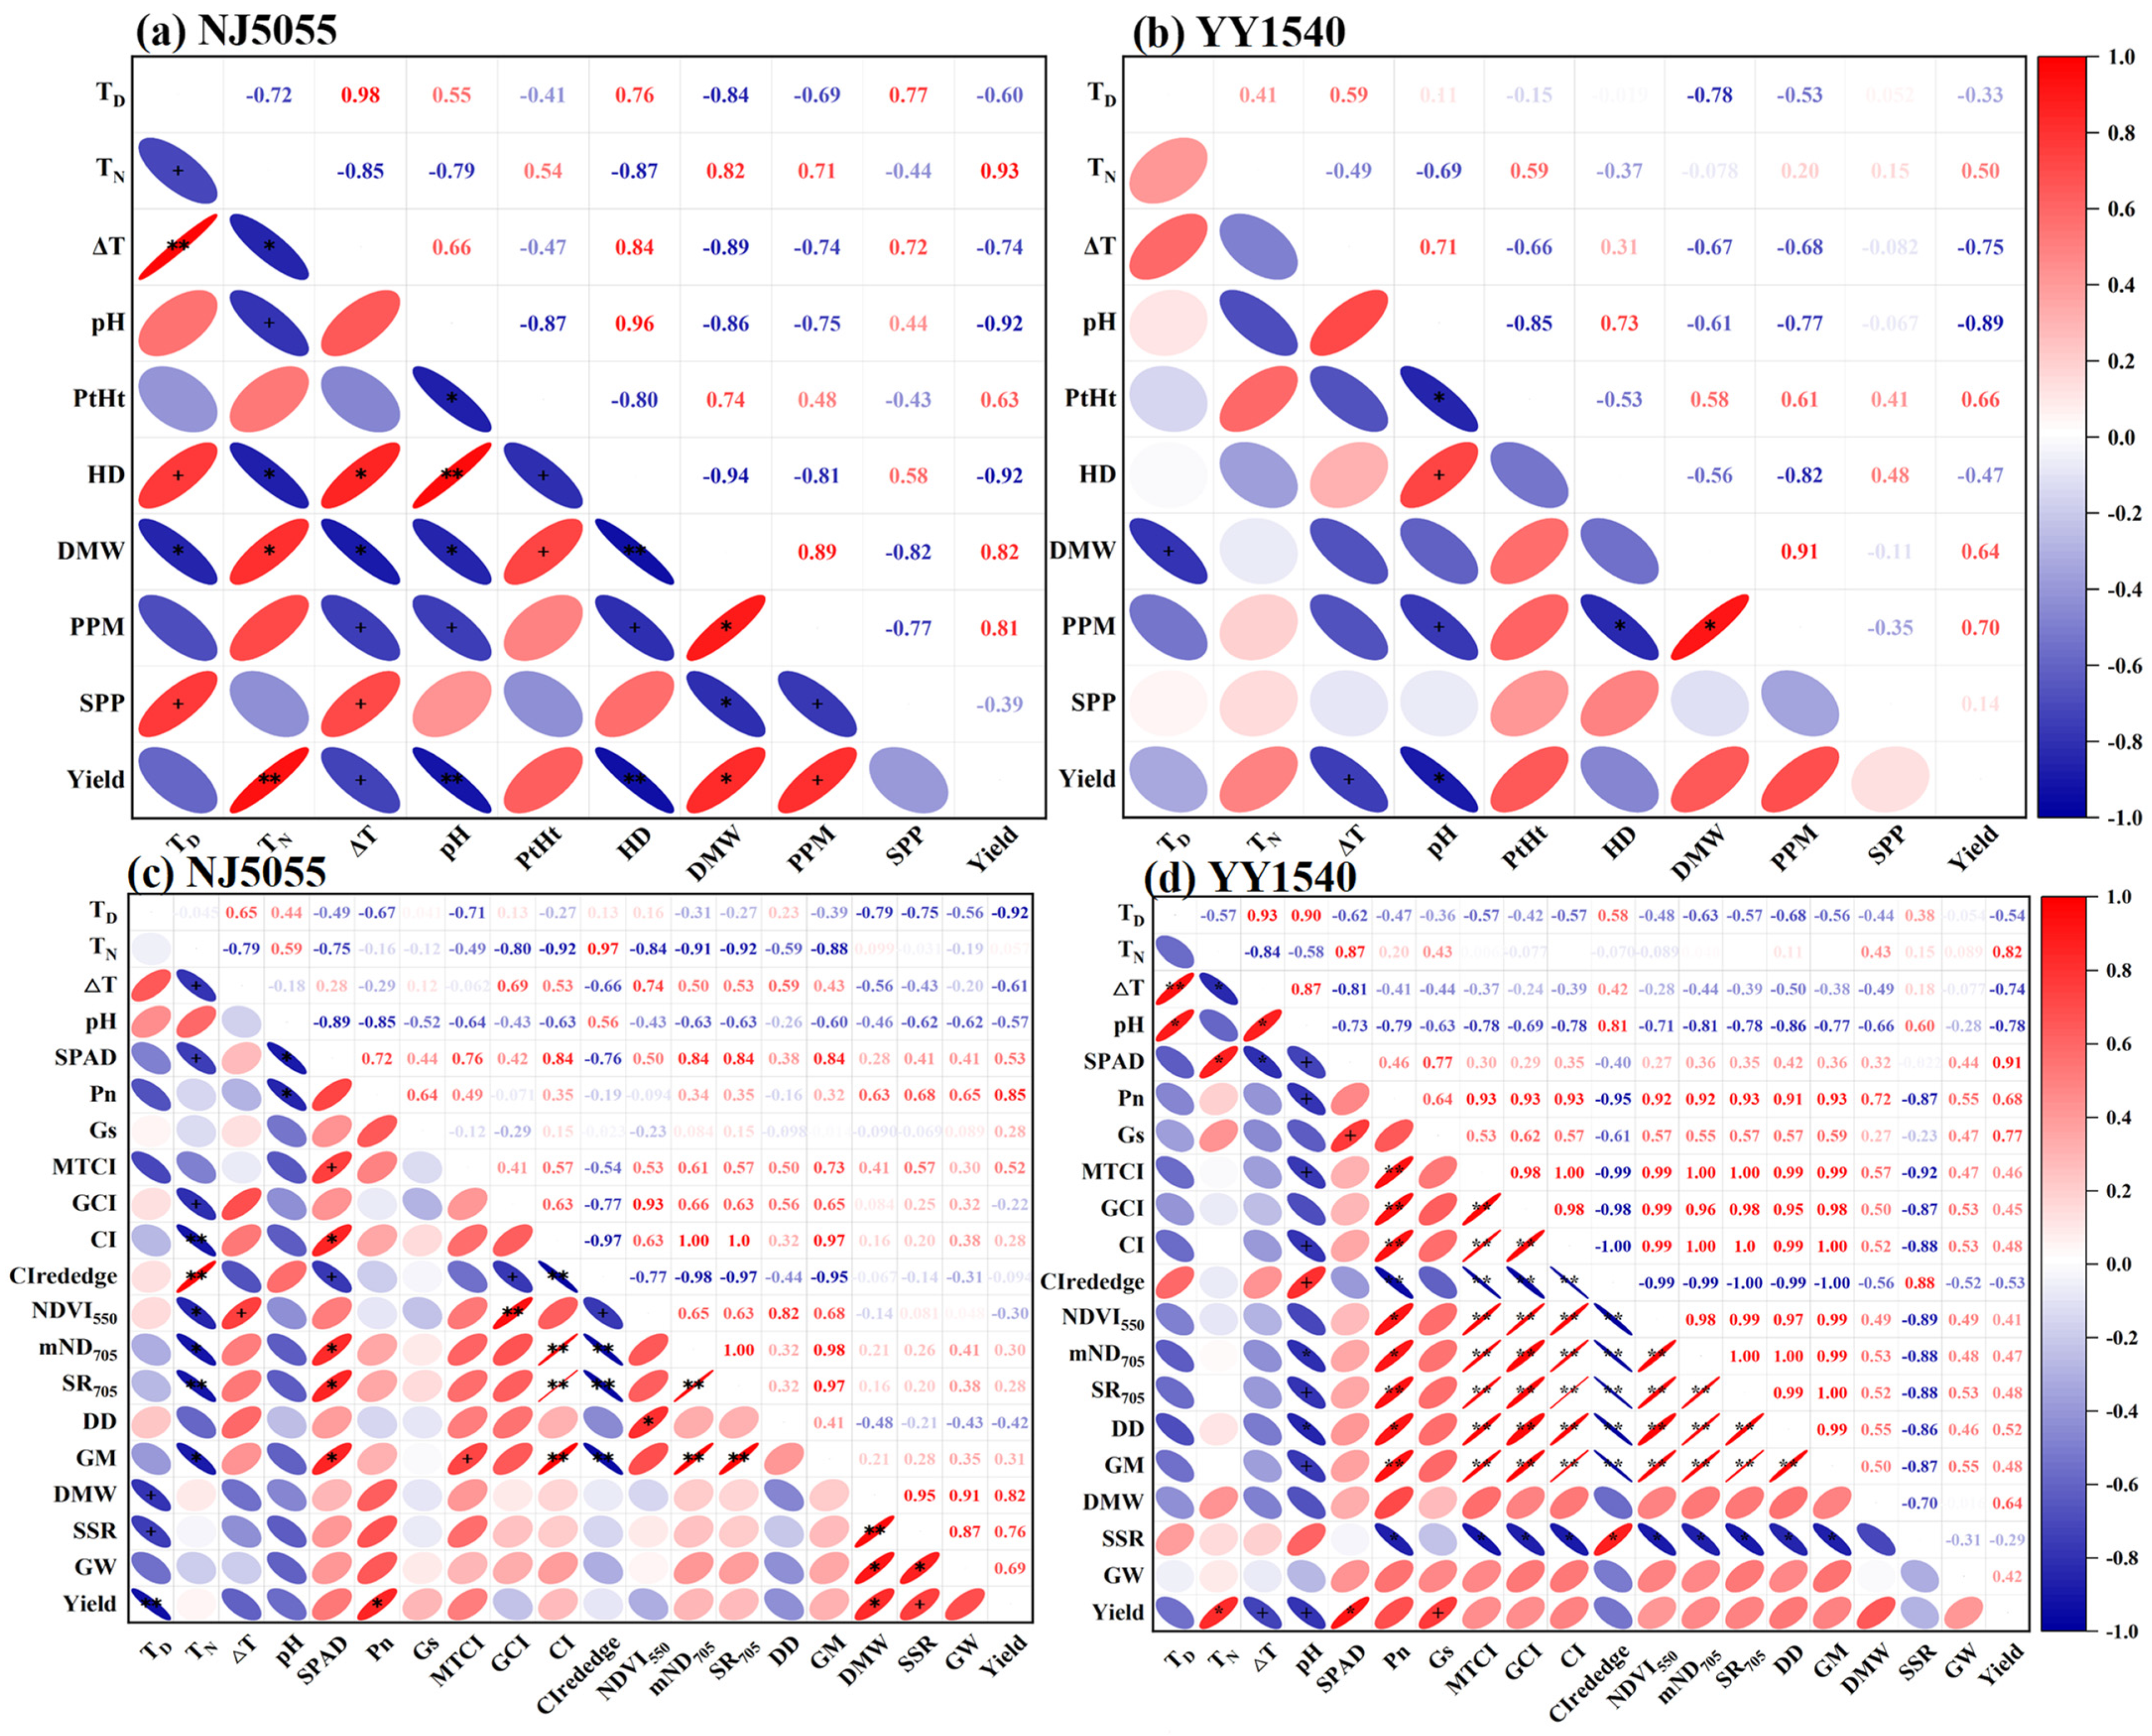
3.5. Correlation Analysis Results for Each Index under DGP Conditions

At the tillering stage, a significant negative correlation was observed between grain yield and ΔT or pH of the paddy field water in both NJ5055 and YY1540 (Figure 4a,b). The pH value also exhibited a significant negative correlation with panicles m−2 (Figure 4a,b). At the grain mid-filling stage, the pH value displayed significant negative correlations with SPAD as well as Pn (Figure 4c,d) for both NJ5055 (p ≤ 0.1) and YY1540 (p ≤ 0.05), respectively. The vegetation indices, except for CIrededge, were negatively correlated with pH but positively correlated with SPAD values. The grain yields demonstrated a negative correlation with TD (day temperature) and pH while exhibiting a positive correlation with SPAD and Pn during the mid-filling stage.

4. Discussion

4.1. DGP-Induced Changes in Environmental Factors Are Important Causes of Increases in Rice Production

The application of DGP leads to a significant increase in rice yield (by 9.0–34.6%) [5]. In the present study, a 10.2% increase was observed, but japonica rice (NJ5055) exhibited a greater response (12.3%) than did the other two hybrid rice cultivars (YY1540 and JFY2, 9.1%). This difference may be related to variations in population structure between the two types of rice: japonica cultivar, with lower tillering capacity, allocated more paddy light, temperature, water, and nutrient resources at the early growth stage of rice toward the growth and reproduction of duckweed. Conversely, rice plants derived more benefits from the decomposition of duckweed at later stages. This finding was supported by the larger decreases in water temperature and pH and higher LAI of DGP in the plots of japonica rice compared with hybrid rice (Table 2).
Previous studies have widely acknowledged that the enhanced grain yield observed in plots covered with duckweed can be attributed to a reduction in NH3 volatilization losses [4,16]. This reduction primarily stems from the formation of a physical barrier in duckweed [34], which effectively impedes the rapid increase in water temperature. This phenomenon facilitates the dissolution of atmospheric CO2 into water, consequently leading to a further decrease in paddy pH [4]. It has been reported that decreases in pH and temperature play significant roles in aqueous nitrogen loss from duckweed bodies [16]. Nitrogen application in paddy fields promotes the growth and reproduction of duckweed [4]. However, nitrogen does not accumulate in duckweed plants for a long time owing to its structural characteristics. Approximately 15–20 days after fertilization, the plant starts to slowly release the absorbed nitrogen back to the paddy, meeting the later stage demand for nitrogen until it is completely decomposed [4,16,22]. DGP had a significant effect on ‘nitrogen reservoir’ rice plants, promoting nitrogen (before heading) migration to a later stage (after heading) in the paddy, i.e., ‘the front nitrogen migrating to the later stage’. This result is similar to the effect of slow/controlled-release fertilizer on rice growth: the grain number per panicle (33.7%) and panicle weight (28.2%) of rice increased significantly due to DGP, resulting in a final yield increase of 28.0% [24], which aligns with the results derived from previous control/slow-release fertilizer experiments [35]. The results of the present study also confirmed this point: DGP significantly accelerated the heading date (1.6 days) and enhanced the SPAD value of leaves during the grain-filling stage (10.8%), indicating a slight decrease in plant nitrogen concentration before heading and a significant increase in leaf nitrogen content [36], thus substantially augmenting grain yield.
Interestingly, this study revealed that the increase in rice yield resulting from DGP was primarily due to the increase in the number of panicles m−2 (10.6%); this finding is hardly consistent with the mechanism of yield gains induced by increased NUE. The possible explanations for this phenomenon were as follows: (1) The water nitrogen concentration in the paddy during the early stage was saturated for rice tillering. The nitrogen assimilated by DGP primarily originated from the nitrogen that would lost in the paddy fields [4,5]. The increase in panicles m−2 may be ascribed to other critical factors. (2) The response of plants to water pH may be an important factor: a pH value over a range of 5–7 significantly reduces rice yield [37] because of the strong effects of pH on organic matter mineralization, microbial activity, nutrient availability, and enzyme activities [38,39]. This study revealed that the presence of DGP significantly reduced the pH of paddy water, especially at the early stage (from 8.13 to 7.26; Table 2), which might promote the growth of rice roots [37] and thus lead to increases the number of tillers, productive tiller ratio, and plant growth. The significant negative correlation between pH and panicles m−2 (Figure 4a,b) and the more obvious 4.7% increase in plant height in the DGP treatment plots, which is considered a sign of health of the rice roots, could prove this point. Additionally, this close relationship between rice yield and pH value was also observed by Zhou [39]. However, there have also been reports indicating a substantial decline in rice production due to DGP, especially in high-latitude rice-growing areas, primarily attributed to the temperature reduction in paddy water caused by DGP during the early stage, which could hamper tillering [5]. Therefore, we speculated that the response of rice tillering to DGP-caused pH change was the direct cause of the alternation in rice grain yield, but this needs to be confirmed by detecting the maximum tiller number and productive tiller rate in further research.
In addition, DGP not only reduces the water temperature and pH and improves the NUE but also changes the colony structure [40], allelochemical content of the paddy fields [14,22], and survival status of the microorganisms [13]. Light transmittance (98%) and dissolved oxygen content (8.9%) are also significantly decreased by DGP [12]. What is the combined effect of these factors on plant growth, including chlorophyll content, photosynthetic activity, spectral characteristics, and dry matter accumulation in rice? To date, no relevant literature has been released.

4.2. DGP Enhanced the Photosynthetic Capacities of Leaves at the Filling Stage, Laying the Foundation for Increased Rice Yield

Under the conditions of this experiment, the increase in the panicles m−2 upon DGP treatment meant that the sink increased, while the harvest index did not change significantly (Figure 2b); that is, the dry matter accumulation showed a similar increase (15.0%, Figure 2a), presumably indicating that DGP also enhanced the ability of leaves to synthesize photosynthetic assimilates. Chlorophylls and carotenoids play crucial roles as photoprotective pigments that absorb light energy and convert it into chemical energy for storage [41]. Nitrogen, as one of the most important nutrients for crop growth, can change the structure of leaves and the distribution ratio of biochemical substances and can strongly affect the efficiency of photosynthesis. The SPAD value is usually used as an important index for characterizing leaf nitrogen and chlorophyll [36] and often serves as an indicator of the photosynthetic capacity of leaves, with higher values implying greater photosynthetic potential [35]. Because of the effect of the ‘nitrogen reservoir’, DGP significantly increased the SPAD value of rice during the filling stage in this study, resulting in a greener leaf color (Figure 1b), and the average Pn of leaves at the grain-filling stage also increased by 14.4% due to DGP. Even at the mature stage, duckweed significantly enhanced the SPAD value and Pn of leaves by 12.8% and 16.2%, respectively, thereby effectively delaying plant senescence and establishing a foundation for augmenting rice grain yield. In the present study, we also found that DGP increased the AMC and Gs values of leaves and reduced the Ls (Table 3), indicating that DGP increased stomatal and apparent mesophyll conductance and reduced stomatal limitation. These results suggest that the increase in the photosynthetic rate due to DGP during the grain filling stage provided equal or greater assimilates for more panicles caused by DGP. The slight increase in the 1000-grain weight (2.3%) further supported this point. And, we also observed significant positive correlations between grain yield and Pn and SPAD values in this study (Figure 4c,d).
Given that the critical period for NH3 volatilization is the first week after fertilizer application, the gain effect of ‘the front nitrogen migrating to the later stage’ with DGP was mostly observed ca. 30–40 days after fertilization application [4,22]. However, most fertilizers applied in this study were concentrated in the early stage, which was far from the nitrogen gain period. In addition to the nitrogen gain, other possible explanations for the effect of DGP on increasing rice yield were found. For example, high temperatures can inhibit RuBisCO enzyme activity, thereby reducing the net photosynthetic rate [42]. In the present study, the average decrease in daily water temperature might be the reason for the increase in Pn. In addition, although the DGP had little effect on the air temperature of the rice canopy or leaf, it increased the difference in temperature between the roots and canopy by 0.7 °C and between day and night by 0.8 °C (Table 2). Increasing the water depth to 15 cm decreased the bottom temperature of the rice plants, increased root/canopy temperature difference, and effectively increased the SPAD and Gs values of rice leaves, thereby enhancing the photosynthetic rate of rice leaves and greatly alleviating the harm caused by elevated temperatures [43]. Additionally, the pH value displayed significant negative correlations with SPAD and Pn (Figure 4c,d) for both NJ5055 (p ≤ 0.1) and YY1540 (p ≤ 0.05) at the grain mid-filling stage, despite the small DGP-caused decrease in pH. Therefore, it is speculated that the increase in the root/canopy temperature difference and decrease in pH after DGP application may be another important reason for the increase in photosynthesis in rice leaves.

4.3. DGP Might Optimize the Canopy Spectral Architectures of Rice

Visible light (400–760 nm) can be absorbed and utilized by plants [43]. The reflection spectra of cytochromes, including chlorophyll, lutein, and carotenoids, show distinct characteristics in this band [41]. Therefore, the abundance and deficiency of canopy pigments, especially chlorophyll, can be predicted nondestructively according to spectral changes. Near-infrared light (780–2526 nm), rather than being directly utilized by green plants, can be used to detect changes in cell structure [44], and vegetation indices from the visible and near-infrared bands are highly affected by differences in leaf structure and canopy architecture [45]. In this study, the spectral curves of the light reflected by DGP in the grain-filling stage were significantly lower than those of the control, indicating that the rice canopy had more chloroplast cells. The first derivative curve of the canopy reflectance spectrum showed an obvious phenomenon of ‘red shift’, which is similar to that of increased nitrogen fertilizer application [46] but contrary to that of high ozone concentrations on the destruction of leaves and chloroplast cells [44], indicating that DGP increased the chlorophyll content or the number of chloroplast cells in the rice canopy, corresponding well with the increase in SPAD values observed in this study.
Canopy layer structure and functions play a crucial role in constraining group productivity [47]. In the near-infrared band, the reflectance spectrum of the crop leaves was dominated by the multilayer structure of leaf cells. The influence of multiple reflections among multilayer cells on the spectrum was much greater than that of pigments, resulting in a sharp increase in the reflectance spectrum of the crop canopy in the near-infrared band between 780 and 1000 nm and causing the ‘red edge’ phenomenon [44]. In the present study, the spectral reflectance curve of DGP in this band was significantly greater than that of the control, indicating that the multilayer structure of mesophyll cells (the size of mesophyll cells and the number of overlapping layers) increased upon DGP treatments. The canopy spectral characteristics of the DGP in this study were similar to those of the nitrogen fertilizer increments. These findings suggested that the ‘nitrogen reservoir’ effect of DGP not only reflected the abundance and deficiency of chlorophyll but also affected the structure of mesophyll cells [46]. To further determine the relationship between the rice canopy spectral changes and DGP, we screened the vegetation indices that exhibited significant responses and found that DGP significantly increased the RARSc, MTCI, GCI, NDVI705, CI, CIrededge, mND705, SR705, and GM, indicating that the vegetation canopy was significantly optimized. For example, an increase in RARSc indicated that duckweed was associated with increased carotenoid formation; CI and CIrededge had a greater relationship with plant LAI [45]; and NDVI705 and mND705, which were associated with the red-edge variant, centered at 705 nm during filling [28]. This increase may be related to the change in canopy mesophyll cell structure due to DGP treatment in this study. In addition, compared with the temperature of paddy water, the pH value showed a closer relationship with these vegetation indices (Figure 4c,d), indicating that pH plays a more essential role in the optimization of rice canopy structure than temperature.

5. Conclusions

An experiment of duckweed growing in paddy fields (DGP) conducted with three representative cultivars signified that DGP significantly increased the grain yield, which accounted for the DGP-caused increase in the growth of rice plants, particularly in terms of the plant height, panicles m−2, and dry matter weight. DGP resulted in a reduction in both the pH and temperature of paddy water while simultaneously increasing the SPAD value and photosynthetic rate of leaves. In addition, it optimized the canopy structure and advanced the heading stage of the rice plants, ultimately promoting their growth. These findings provide a practical foundation for the implementation of environmentally sustainable rice production. However, comprehensive understanding of the impact patterns of DGP on rice growth and grain quality in a broad spatiotemporal context is lacking. Therefore, future research spanning several years should be conducted to explore the mechanisms through which DGP influences rice.

Author Contributions

Conceptualization, L.J.; methodology, L.J.; writing—Original draft preparation, L.J.; software, X.W., Y.Z., Y.S. and Y.C.; formal analysis, X.W., Y.Z. and F.L.; investigation, X.W., Y.Z., Y.S. and Y.C.; data curation, X.W., Y.Z., F.L., Y.S. and Y.C.; writing—original draft preparation, L.J.; writing—review and editing, F.Z., G.D., L.Y. and Y.W.; visualization, X.W., Y.Z., Y.S. and Y.C.; supervision, L.Y. and Y.W.; project administration, L.J.; funding acquisition, L.J., F.Z. and G.D. All authors have read and agreed to the published version of the manuscript.

Funding

This research was funded by [the National Natural Science Foundation of China] grant number [32172102], the Zhejiang Provincial Key Research and Development Plan of China (2020C02001), the Long-Term Positioning Monitoring Site of Soil Fertility in Zhejiang Province (330783-J02), and the project funded by the Priority Academic Program Development of Jiangsu Higher Education Institutions. And The APC was funded by [the National Natural Science Foundation of China] grant number [32172102].

Data Availability Statement

The original data contributions presented in the study are included in the article. Further inquiries can be directed to the Corresponding Authors.

Conflicts of Interest

The authors have no competing financial interests to declare.

References

  1. An, D.; Zhou, Y.; Li, C.S.; Xiao, Q.; Wang, T.; Zhang, Y.T.; Wu, Y.R.; Li, Y.B.; Chao, D.Y.; Messing, J.; et al. Plant evolution and environmental adaptation unveiled by long-read whole-genome sequencing of spirodela. Proc. Natl. Acad. Sci. USA 2019, 116, 18893–18899. [Google Scholar] [CrossRef]
  2. Zaffer, B.; Sheikh, I.U.; Banday, T.M.; Adil, S. Effect of inclusion of different levels of duckweed (lemna minor) on the performance of broiler chicken. Indian J. Anim. Res. 2020, 55, 1200–1205. [Google Scholar] [CrossRef]
  3. Ziegler, P.; Appenroth, K.J.; Sree, K.S. Survival strategies of duckweeds, the world’s smallest angiosperms. Plants 2023, 12, 2215. [Google Scholar] [CrossRef] [PubMed]
  4. Li, H.; Li, X.Q.; Lian, Y.F.; Xu, L.; Chen, Y. Reduction of ammonia volatilization from urea by a floating duckweed in flooded rice fields. Soil Biol. Biochem. 2009, 73, 1890–1895. [Google Scholar] [CrossRef]
  5. Jing, L.Q.; Li, F.; Zhao, Y.H.; Wang, X.K.; Zhao, F.C.; Lai, S.K.; Sun, X.L.; Wang, Y.X.; Yang, L.X. Research progress on the carbon and nitrogen sink of duckweed growing in paddy and its effects on rice yield. Sci. Agric. Sin. 2023, 56, 4717–4728. [Google Scholar]
  6. Jing, L.Q.; Chen, C.; Lu, Q.; Wang, Y.X.; Zhu, J.G.; Lai, S.K.; Wang, Y.L.; Yang, L.X. How do elevated atmosphere CO2 and temperature alter the physiochemical properties of starch granules and rice taste? Sci. Total Environ. 2021, 766, 142592. [Google Scholar] [CrossRef]
  7. Jing, L.Q.; Chen, C.; Hu, S.W.; Dong, S.P.; Pan, Y.; Wang, Y.X.; Lai, S.K.; Wang, Y.L.; Yang, L.X. Effects of elevated atmosphere CO2 and temperature on the morphology, structure and thermal properties of starch granules and their relationship with cooked rice taste. Food Hydrocoll. 2021, 112, 106360. [Google Scholar] [CrossRef]
  8. IEA. Global Energy Review: CO2 Emissions in 2021. 2022. Available online: www.iea.org/reports/global-energy-review-co2-emissions-in-2021-2 (accessed on 22 February 2024).
  9. National Climate Center. China Climate Bulletin 2022. 2023. Available online: http://www.ncc-cma.net/channel/news/newsid/100060 (accessed on 6 February 2023).
  10. Radha, B.; Sunitha, N.C.; Sah, R.P.; TP, M.A.; Krishna, G.K.; Umesh, D.K.; Thomas, S.; Anilkumar, C.; Upadhyay, S.; Kumar, A.; et al. Physiological and molecular implications of multiple abiotic stresses on yield and quality of rice. Front. Plant Sci. 2023, 13, 996514. [Google Scholar] [CrossRef]
  11. Kollah, B.; Patra, A.K.; Mohanty, S.R. Aquatic Microphylla Azolla: A perspective paradigm for sustainable agriculture, environment and global climate change. Environ. Sci. Pollut. Res. 2016, 23, 4358–4369. [Google Scholar] [CrossRef] [PubMed]
  12. Wang, F.; Wang, S.; Xu, S.H.; Shen, J.Y.; Cao, L.K.; Sha, Z.M.; Chu, Q.N. A non-chemical weed control strategy, introducing duckweed into the paddy field. Pest Manag. Sci. 2022, 78, 3654–3663. [Google Scholar] [CrossRef]
  13. Liu, L.Y.; Zheng, X.Q.; Peng, C.F.; Li, J.; Xu, Y. Driving forces and future trends on total nitrogen loss of planting in China. Environ. Pollut. 2021, 267, 115660.1–115660.6. [Google Scholar]
  14. Lu, Y.F.; Kronzucker, H.J.; Shi, W.M. Stigmasterol root exudation arising from Pseudomonas inoculation of the duckweed rhizosphere enhances nitrogen removal from polluted waters. Environ. Pollut. 2021, 287, 117587. [Google Scholar] [CrossRef] [PubMed]
  15. Zhou, Y.Z.; Kishchenko, O.; Stepanenko, A.; Chen, G.; Wang, W.; Zhou, J.; Pan, C.; Borisjuk, N. The dynamics of NO3− and NH4+ uptake in duckweed are oordinated with the expression of major nitrogen assimilation genes. Plants 2022, 11, 11. [Google Scholar] [CrossRef] [PubMed]
  16. Wang, Y.; Chen, X.D.; Guo, B.; Liu, C.; Liu, J.L.; Qiu, G.Y.; Fu, Q.L.; Li, H. Alleviation of aqueous nitrogen loss from paddy fields by growth and decomposition of duckweed (Lemna minor L.) after fertilization. Chemosphere 2023, 311, 137073. [Google Scholar] [CrossRef] [PubMed]
  17. Cheng, J.; Landesman, L.; Bergmann, B.A.; Classen, J.J.; Howard, J.W.; Yamamoto, Y.T. Nutrient removal from swine lagoon liquid by Lemna minor 8627. Trans. ASAE 2002, 45, 1003–1010. [Google Scholar] [CrossRef]
  18. Pagliuso, D.; Grandis, A.; Fortirer, J.S.; Camargo, P.; Floh, E.I.S.; Buckeridge, M.S. Duckweeds as Promising Food Feedstocks Globally. Agronomy 2022, 12, 796. [Google Scholar] [CrossRef]
  19. Elrys, A.S.; Wang, J.; Meng, L.; Zhu, Q.L.; El-Sawy, M.M.; Chen, Z.X.; Tu, X.S.; El-Saadony, M.T.; Zhang, Y.H.; Zhang, J.B.; et al. Integrative knowledge-based nitrogen management practices can provide positive effects on ecosystem nitrogen retention. Nat. Food 2024, 4, 1075–1089. [Google Scholar] [CrossRef] [PubMed]
  20. Amirahmadi, E.; Moudrý, J.; Konvalina, P.; Hörtenhuber, S.J.; Ghorbani, M.; Neugschwandtner, R.W.; Jiang, Z.; Krexner, T.; Kopecký, M. Environmental life cycle assessment in organic and conventional rice farming systems: Using a cradle to farm gate approach. Sustainability 2022, 14, 15870. [Google Scholar] [CrossRef]
  21. Sutton, M.A.; Bleeker, A.; Howard, C.M.; Erisman, J.W.; Abrol, Y.P.; Brkunda, M.; Datta, A.; Davidson, E.; Vries, W.D.; Oenema, O.; et al. Our Nutrient World: The Challenge to Produce More Food and Energy with Less Pollution; Center for Ecology and Hydrology: Edinburgh, UK, 2013; p. 249094. [Google Scholar]
  22. Chen, X.D.; Guo, B.; Liu, J.L.; Wang, H.Y.; Li, N.Y.; Ma, J.; Fu, Q.L.; Li, H. Effects of duckweed on changes of nitrogen content in rice floodwater with variable nitrogen fertilizer application. J. Nucl. Agric. Sci. 2021, 35, 2674–2679. [Google Scholar]
  23. Sun, H.J.; Dan, A.; Feng, Y.F.; Vithanage, M.; Mandal, S.; Shaheen, S.M.; Rinklebe, J.; Shi, W.M.; Wang, H.L. Floating duckweed mitigated ammonia volatilization and increased grain yield and nitrogen use efficiency of rice in biochar amended paddy soils. Chemosphere 2019, 237, 124532. [Google Scholar] [CrossRef] [PubMed]
  24. Wang, F.; Lai, Y.C.; Tang, Z.X.; Zheng, M.M.; Shi, J.; Gu, M.Y.; Shen, J.Y.; Cao, L.K.; Sha, Z.M. Effects of duckweed mulching on composition and diversity of weed communities in paddy fields. China J. Eco-Agri. 2021, 29, 672–682. [Google Scholar]
  25. Yao, Y.L.; Zhang, M.; Tian, Y.H.; Zhao, M.; Zeng, K.; Zhang, B.W.; Zhao, M.; Yin, B. Azolla biofertilizer for improving low nitrogen use efficiency in an intensive rice cropping system. Field Crops Res. 2018, 216, 158–164. [Google Scholar] [CrossRef]
  26. Yao, Y.L.; Zhang, M.; Tian, Y.H.; Zhao, M.; Zhang, B.W.; Zeng, K.; Zhao, M.; Yin, B. Urea deep placement in combination with Azolla for reducing nitrogen loss and improving fertilizer nitrogen recovery in rice field. Field Crops Res. 2018, 218, 141–149. [Google Scholar] [CrossRef]
  27. Luo, J.S.; Hu, S.W.; Li, T.; He, F.H.; Tian, C.; Han, Y.; Mao, Y.L.; Jing, L.Q.; Yang, L.X.; Wang, Y.X. A preliminary study of the impacts of duckweed coverage during rice growth on grain yield and quality. Plants 2024, 13, 57. [Google Scholar] [CrossRef] [PubMed]
  28. Chappelle, E.W.; Kim, M.S.; McMurtrey, J.E. Ratio analysis of reflectance spectra (RARS): Analgorithm for the remote estimation of the concentrations of chlorophyll A, chlorophyll B, and carotenoids in soybean leaves. Remote Sens. Environ. 1992, 39, 239–247. [Google Scholar] [CrossRef]
  29. Dash, J.; Curran, P.J. The MERIS terrestrial chlorophyll index. Int. J. Remote Sens. 2004, 25, 5403–5413. [Google Scholar] [CrossRef]
  30. Gitelson, A.; Arkebauer, T.; Solovchenko, A.; Nguy-Robertson, A.; Inoue, Y. An insight into spectral composition of light available for photosynthesis via remotely assessed absorption coefcient at leaf and canopy levels. Photosynth. Res. 2022, 151, 47–60. [Google Scholar] [CrossRef] [PubMed]
  31. Gitelson, A.; Merzlyak, M.N. Quantitative estimation of chlorophyll-a using reflectance spectra: Experiments with autumn chestnut and maple leaves. J. Photochem. Photobiol. B Biol. 1994, 22, 247–252. [Google Scholar] [CrossRef]
  32. Yang, X.L.; Zhu, L.J.; Feng, Z.Z. Hyperspectral characteristics and chlorophyll content estimation of winter wheat under ozone stress. Acta Ecol. Sin. 2023, 43, 3213–3223. [Google Scholar]
  33. Sims, D.A.; Gamon, J.A. Relationships between leaf pigment content and spectral reflectance across a wide range of species, leaf structures and developmental stages. Remote Sens. Environ. 2002, 81, 337–354. [Google Scholar] [CrossRef]
  34. Yao, Y.L.; Zhang, M.; Tian, Y.H.; Zhao, M.; Zhang, B.W.; Zhao, M.; Zeng, K.; Yin, B. Duckweed (Spirodela polyrhiza) as green manure for increasing yield and reducing nitrogen loss in rice production. Field Crops Res. 2017, 214, 273–282. [Google Scholar] [CrossRef]
  35. Cai, W.W.; Ai, T.C.; Li, R.; Jin, Z.Y.; Xu, J.G.; Cao, K.K. Effect of controlled release fertilizer and urea additive on photosynthetic characteristics and yield of double cropping rice. Soil Fert. Sci. Chin. 2018, 3, 54–60. [Google Scholar]
  36. Xiong, D.; Flexas, J. Leaf economics spectrum in rice: Leaf anatomical, biochemical, and physiological trait trade-offs. J. Exp. Bot. 2018, 69, 5599–5609. [Google Scholar] [CrossRef]
  37. Wang, L.H.; Sun, F.; Chen, C.M.; Wang, Y.Y.; Liu, Y.S.; Zhou, Q. Combined effects of aluminum and cadmium in acidified soil on root growth in rice Seedlings. J. Agro-Environ. Sci. 2013, 32, 2511–2512. [Google Scholar]
  38. Ning, Q.; Chen, L.; Jia, Z.; Zhang, C.; Ma, D.; Li, F.; Zhang, J.; Li, D.; Han, X.; Cai, Z.; et al. Multiple long-term observations reveal a strategy for soil pH-dependent fertilization and fungal communities in support of agricultural production. Agric. Ecosyst. Environ. 2020, 293, 106837. [Google Scholar] [CrossRef]
  39. Zhou, J.J.; Tang, S.; Pan, W.K.; Xu, M.; Liu, X.; Ni, L.; Mao, X.L.; Sun, T.; Fu, H.R.; Han, K.F.; et al. Long-term application of controlled-release fertilizer enhances rice production and soil quality under non-flooded plastic film mulching cultivation conditions. Agric. Ecosyst. Environ. 2023, 358, 108720. [Google Scholar] [CrossRef]
  40. Huang, W.J.; Gilbert, S.; Poulev, A.; Acosta, K.; Lebeis, S.; Long, C.L.; Lam, E. Host-specific and tissue-dependent orchestration of microbiome community structure in traditional rice paddy ecosystems. Plant Soil 2020, 452, 379–395. [Google Scholar] [CrossRef]
  41. Cui, T.; Zhou, X.F.; Huang, Y.F.; Guo, Y.T.; Lin, Y.R.; Song, L.Y.; Zhang, J.C. Retrieval of winter wheat canopy carotenoid content with ground-and airborne-based hyperspectral data. Phyton.-Int. J. Exp. Bot. 2023, 92, 2633–2648. [Google Scholar] [CrossRef]
  42. Cheng, W.G.; Sakai, H.; Yagi, K.; Hasegawa, T. Combined effects of elevated [CO2] and high night temperature on carbon assimilation, nitrogen absorption, and the allocations of C and N by rice (Oryza sativa L.). Agric. For. Meteorol. 2010, 150, 1174–1181. [Google Scholar] [CrossRef]
  43. Zhen, B.; Guo, R.Q.; Zhou, X.G.; Li, H.Z.; Niu, Q.L.; Qiu, H.S.; Tian, G.L.; Li, S.J. The effects of thermal and waterlogging stresses at booting stage on photosynthesis and yield of rice. J. Irrig. Drain 2021, 40, 45–51. [Google Scholar]
  44. Gates, D.M. Heat transfer in plants. Sci. Am. 1965, 213, 76–84. [Google Scholar] [CrossRef] [PubMed]
  45. Madonsela, S.; Cho, M.A.; Naidoo, L.; Main, R.; Majozi, N.P. Exploring the utility of Sentinel-2 for estimating maize chlorophyll content and leaf area index across different growth stages. J. Spat. Sci. 2023, 68, 339–351. [Google Scholar] [CrossRef]
  46. Liu, T.J.; Pan, X.Z.; Tang, J.J.; Zhu, B.; Hu, W.J.; Zhang, X.D.; Jiang, S.L.; Chen, M.Q. An analysis on hyper-spectral characteristics of rice under different nitrogen levels. Acta Agric. Univ. Jiangxiensis 2014, 36, 699–704. [Google Scholar]
  47. Cheng, Y.X.; Xiao, F.; Huang, D.Y.; Yang, Y.; Cheng, W.D.; Jin, S.C.; Li, G.H.; Ding, Y.F.; Paul, M.J.; Liu, Z.H. High canopy photosynthesis before anthesis explains the outstanding yield performance of rice cultivars with ideal plant architecture. Field Crop Res. 2024, 306, 109223. [Google Scholar] [CrossRef]
Figure 1. Experimental locations ((a), marked with red dots) and plots of Zhejiang (b) and Jiangsu Provinces (c). (d,e) show the temperature changes during the rice growing period in the plots in Zhejiang and Jiangsu Provinces, respectively. The average temperatures before and after rice heading throughout the entire growth period were 29.3 °C and 24.1 °C (in blue) in the Zhejiang plot, respectively, compared to 27.8 °C and 22.3 °C (in blue) in the Jiangsu plot, respectively. Zhejiang, Zhejiang Province; Jiangsu, Jiangsu Province; DGP, duckweed growing in paddy fields.
Agronomy 14 00726 g001
Figure 2. Effects of duckweed growing in paddy fields (DGP) on the spectral characteristics of rice canopy. Control-R, reflection spectra data in control; DGP-R, reflection spectra data in duckweed growing in paddy fields; Control-D, derivative spectra data in control; DGP-D, derivative spectra data in duckweed growing in paddy fields. The spectral characteristics of NJ5055 and YY1540 at the prefilling stage were represented by (a) and (b), respectively; the spectral characteristics of NJ5055, YY1540, and JFY2 at the mid-filling stage were represented by (c), (d), and (g), respectively; the spectral characteristics of NJ5055 and YY1540 at the maturity stage were represented by (e) and (f), respectively.
Agronomy 14 00726 g002
Figure 3. Effects of duckweed growing in paddy fields (DGP) on the plant growths of rice. (a), Dry matter weight/hill (g); (b), Harvest index; (c), Plant height (cm); (d), Heading days (day); Zhejiang, Zhejiang Province; Jiangsu, Jiangsu Province; ** p ≤ 0.01, * p ≤ 0.05, + p ≤ 0.1, ns, not statistically significant, p > 0.1 determined by t-test.
Agronomy 14 00726 g003
Figure 4. Pearson’s correlations among various parameters during rice tillering stage (a,b) and mid-filling (c,d) stage related to rice and field under duckweed growing in paddy conditions. The correlation coefficients of NJ5055 and YY1540 during the tillering stage are denoted as (a,b), respectively, while during the mid-filling stage, they are denoted as (c,d). ** p ≤ 0.01; * p ≤ 0.05; + p ≤ 0.1; n = 6. TD, day temperature; TN, night temperature; ΔT, temperature difference between day and night; PtHt, plant height; HD, heading date; DMW, dry matter weight; PPM, panicles m−2; SPP, spikelets per panicle; SSR, seed-setting rate; GW, 1000-grain weight; Pn, net photosynthetic rate; Gs, stomatal conductance; RARSc, ratio analysis of reflectance spectra for carotenoids; MTCI, MERIS terrestrial chlorophyll index; GCI, green chlorophyll index; CI, chlorophyll index; CIrededge, red-edge chlorophyll index; mND705, modified normalized difference; SR705, simple ratio; GM, relative dark green index.
Agronomy 14 00726 g004
Table 1. Vegetation index of reflectance spectra.
Vegetation IndexName or MeaningCalculation FormulaConference
RARScRatio analysis of reflectance spectra for carotenoidsR760/R500[28]
MTCIMERIS terrestrial chlorophyll index(R750 − R710)/(R710 − R680)[29]
GCIGreen chlorophyll indexR920/R500 − 1[30]
NDVI705Normalized difference vegetation index(R750 − R705)/(R750 + R705)[31]
CIChlorophyll index(R750/R705) − 1[32]
CIrededgeRed-edge chlorophyll index(R700 − R800)/(R690 + R720) − 1[32]
mND705Modified normalized difference(R750 − R705)/(R750 + R705 − 2 × R445)[33]
SR705Simple ratioR750/R705[33]
GMRelative dark green indexR750/R700[32]
Table 2. Effects of duckweed growing in paddy fields (DGP) on pH, temperatures of the water and rice canopy, and LAI of duckweed.
Growth StageLocationCultivar (CV)TreatmentTDTNΔT TairTleafpHLAI
JointingJiangsuNJ5055Control33.2 ± 0.325.9 ± 0.17.4 ± 0.433.2 ± 0.332.8 ± 0.38.13 ± 0.040
DGP32.7 ± 0.3 ns26.2 ± 0.1 ns6.5 ± 0.3 ns33.3 ± 0.4 ns32.8 ± 0.4 ns7.26 ± 0.04 **2.7 ± 0.4
YY1540Control34.1 ± 0.525.5 ± 0.48.6 ± 0.531.6 ± 0.031.7 ± 0.08.13 ± 0.040
DGP33.8 ± 0.3 ns26.1 ± 0.3 ns7.7 ± 0.2 ns31.7 ± 0.1 ns31.7 ± 0.0 ns7.49 ± 0.07 **2.3 ± 0.3
ANOVA (p_Value)
DGP0.4320.1330.0740.9770.977<0.001
CV0.0680.4030.0210.0030.0030.085
DGP × CV0.7700.6090.9680.8390.8390.072
Mid-FillingZhejiangJFY2Control33.1 ± 0.422.0 ± 0.411.1 ± 0.236.6 ± 0.235.6 ± 0.4
DGP32.2 ± 0.2 ns22.2 ± 0.3 ns10.0 ± 0.4 ns36.4 ± 0.2 ns35.7 ± 0.6 ns
JiangsuNJ5055Control29.1 ± 0.223.3 ± 0.55.8 ± 0.535.7 ± 0.035.5 ± 0.27.49 ± 0.090
DGP28.1 ± 0.2 *22.9 ± 0.5 ns5.1 ± 0.7 ns36.2 ± 0.0 ns35.9 ± 0.2 ns7.19 ± 0.07 +2.7 ± 0.4
YY1540Control29.7 ± 0.223.2 ± 0.26.5 ± 0.232.7 ± 0.532.6 ± 0.07.54 ± 0.050
DGP28.8 ± 0.3 +23.6 ± 0.3 ns5.2 ± 0.5 +32.6 ± 0.6 ns32.4 ± 0.0 +7.14 ± 0.04 **2.4 ± 0.2
ANOVA (p_Value)
DGP0.0030.9280.0610.1740.4020.002
CV0.0200.4300.473<0.001<0.0010.980
DGP × CV0.6370.3030.5170.1300.0920.512
MaturityJiangsuNJ5055Control20.7 ± 0.113.2 ± 0.67.5 ± 0.626.6 ± 0.726.2 ± 0.7
DGP20.7 ± 0.1 ns13.2 ± 0.6 ns7.5 ± 0.6 ns26.7 ± 0.7 ns26.4 ± 0.9 ns
YY1540Control20.5 ± 0.413.1 ± 0.17.4 ± 0.326.4 ± 0.026.3 ± 0.0
DGP20.0 ± 0.3 ns13.3 ± 0.4 ns6.7 ± 0.7 ns26.7 ± 0.0 **26.7 ± 0.0 **
ANOVA (p_Value)
DGP0.1330.8840.2300.6380.506
CV0.0230.9610.1060.8030.620
DGP × CV0.1800.7350.1900.7650.833
Jiangsu, Shiye Town, Zhenjiang city, Jiangsu Province; Zhejiang, Dongyang city, Jinhua city, Zhejiang Province; TN, night temperature; TD, day temperature; ΔT, temperature difference between day and night; Tair, rice canopy air temperature; LAI, leaf area index; mean values ± standard errors (n = 3) followed by **, *, +, and ns indicated the significance levels at p ≤ 0.01, p ≤ 0.05, p ≤ 0.1, and p > 0.1 determined by t-test, respectively. The values of ANOVA results in bold show significant treatment effects at p ≤ 0.1.
Table 3. Effects of duckweed growing in paddy fields (DGP) on the photosynthetic traits and SPAD value of rice leaf.
Growth StageLocationCultivar (CV)TreatmentPnGsCiTrWUELsAMCSPAD
PrefillingJiangsuNJ5055Control22.5 ± 1.50.44 ± 0.03281.0 ± 6.37.0 ± 0.43.2 ± 0.10.26 ± 0.020.08 ± 0.0150.5 ± 0.5
DGP25.9 ± 0.5 ns0.48 ± 0.03 ns275.6 ± 7.2 ns7.6 ± 0.3 ns3.4 ± 0.2 ns0.27 ± 0.02 ns0.09 ± 0.00 ns54.7 ± 0.6 **
YY1540Control24.3 ± 0.70.37 ± 0.00257.0 ± 4.24.8 ± 0.05.1 ± 0.20.32 ± 0.010.09 ± 0.0046.6 ± 0.2
DGP25.6 ± 0.4 ns0.56 ± 0.00 **290.7 ± 0.8 **6.7 ± 0.0 **3.8 ± 0.1 **0.23 ± 0.00 **0.09 ± 0.00 ns53.0 ± 1.5 *
ANOVA (p_Value)
DGP0.0120.0030.0280.0010.0040.0320.3550.001
CV0.2860.9050.400<0.001<0.0010.5070.2740.018
DGP × CV0.1690.0250.0070.0170.0010.0090.0260.264
Mid-FillingZhejiangJFY2Control20.6 ± 1.10.90 ± 0.05317.2 ± 4.019.9 ± 0.81.03 ± 0.020.16 ± 0.010.06 ± 0.0033.9 ± 2.4
DGP23.0 ± 0.7 ns0.79 ± 0.21 ns296.7 ± 25.8 ns17.5 ± 2.8 ns1.41 ± 0.29 ns0.21 ± 0.06 ns0.08 ± 0.01 ns40.0 ± 1.2 +
JiangsuNJ5055Control20.5 ± 1.20.24 ± 0.02221.9 ± 1.45.5 ± 0.23.7 ± 0.10.41 ± 0.010.09 ± 0.0135.9 ± 1.0
DGP23.9 ± 0.7 +0.30 ± 0.04 ns229.7 ± 24.1 ns6.7 ± 0.5 ns3.6 ± 0.4 ns0.40 ± 0.06 ns0.11 ± 0.01 ns38.7 ± 0.8 +
YY1540Control21.5 ± 0.50.41 ± 0.02275.7 ± 3.36.3 ± 0.23.4 ± 0.10.27 ± 0.010.08 ± 0.0035.3 ± 0.4
DGP25.9 ± 1.1 *0.56 ± 0.07 ns283.7 ± 12.2 ns7.7 ± 0.7 ns3.4 ± 0.3 ns0.25 ± 0.03 ns0.09 ± 0.01 +36.7 ± 0.5 +
ANOVA (p_Value)
DGP0.0100.0390.5750.0160.8140.6220.1490.003
CV0.1870.0020.0070.0540.3060.0030.1360.031
DGP × CV0.6370.3040.9940.8230.8290.9220.9630.159
MaturityJiangsuNJ5055Control10.1 ± 1.10.33 ± 0.02316.0 ± 2.17.7 ± 0.41.3 ± 0.10.17 ± 0.010.03 ± 0.0021.6 ± 1.0
DGP11.4 ± 1.9 ns0.27 ± 0.01 +296.3 ± 8.0 +6.7 ± 0.2 +1.7 ± 0.2 ns0.22 ± 0.02 +0.04 ± 0.01 ns25.2 ± 1.6 ns
YY1540Control10.9 ± 1.00.47 ± 0.01336.4 ± 6.38.1 ± 0.11.3 ± 0.10.13 ± 0.010.03 ± 0.0017.1 ± 0.6
DGP13.0 ± 0.5 ns0.43 ± 0.01 *316.0 ± 0.6 *7.6 ± 0.1 *1.7 ± 0.0 *0.17 ± 0.00 **0.04 ± 0.00 *18.7 ± 0.4 +
ANOVA (p_Value)
DGP0.2370.0090.0050.0230.0410.0120.1350.052
CV0.405<0.0010.0050.0510.8270.0090.8070.002
DGP × CV0.7860.5180.9490.3150.9330.5590.8560.383
Jiangsu, Shiye Town, Zhenjiang city, Jiangsu Province; Zhejiang, Dongyang city, Jinhua city, Zhejiang Province; Pn, net photosynthetic rate; Gs, stomatal conductance; Ci, intercellular CO2 concentration; Tr, transpiration rate; WUE, water use efficiency; Ls, stomatal limitation value; AMC, apparent mesophyll conductance. Mean values ± standard errors (n = 3) followed by **, *, +, and ns indicated the significance levels at p ≤ 0.01, p ≤ 0.05, p ≤ 0.1, and p > 0.1 determined by t-test, respectively. The values of ANOVA results in bold show significant treatment effects at p ≤ 0.1.
Table 4. Effects of duckweed growing in paddy fields (DGP) on the vegetation indices of rice canopy.
Growth StageLocationCultivar (CV) TreatmentRARScMTCIGCINDVI705CICIrededgemND705SR705GM
PrefillingJiangsuNJ5055Control21.5 ± 1.33.5 ± 0.18.8 ± 0.50.6 ± 0.03.7 ± 0.2−3.2 ± 0.10.7 ± 0.04.7 ± 0.26.0 ± 0.4
DGP24.7 ± 1.6 ns3.9 ± 0.2ns10.0 ± 0.7 ns0.7 ± 0.0 ns4.2 ± 0.3 ns−3.5 ± 0.1 ns0.7 ± 0.0 ns5.2 ± 0.3 ns7.1 ± 0.6 ns
YY1540Control19.3 ± 0.93.0 ± 0.17.1 ± 0.20.6 ± 0.03.2 ± 0.1−2.9 ± 0.00.7 ± 0.04.2 ± 0.15.4 ± 0.2
DGP23.1 ± 0.7 *3.5 ± 0.1 **8.5 ± 0.2 **0.7 ± 0.0 *3.8 ± 0.1 *−3.3 ± 0.1 **0.7 ± 0.0 *4.8 ± 0.1 *6.6 ± 0.3 *
ANOVA (p_Value)
DGP0.0210.0090.0190.0200.0210.0040.0190.0210.019
CV0.1450.0110.0080.0440.0410.0570.0130.0410.152
DGP × CV0.8130.9060.8840.6100.8130.6060.5640.8130.922
Mid-FillingZhejiangJFY2Control10.7 ± 0.31.8 ± 0.14.3 ± 0.30.5 ± 0.01.7 ± 0.1−2.1 ± 0.10.5 ± 0.02.7 ± 0.13.4 ± 0.1
DGP14.3 ± 0.3 *2.3 ± 0.1 *5.6 ± 0.2 +0.5 ± 0.0 *2.4 ± 0.1 *−2.4 ± 0.0 *0.6 ± 0.0 *3.4 ± 0.1 *4.3 ± 0.1 *
JiangsuNJ5055Control14.2 ± 1.12.5 ± 0.15.7 ± 0.30.5 ± 0.02.2 ± 0.1−2.4 ± 0.10.6 ± 0.03.2 ± 0.13.9 ± 0.2
DGP14.3 ± 0.8 **2.7 ± 0.0 *5.8 ± 0.5 *0.5 ± 0.0 **2.5 ± 0.2 **−2.5 ± 0.1 *0.6 ± 0.0 **3.5 ± 0.2 **4.3 ± 0.2 **
YY1540Control17.5 ± 0.62.8 ± 0.16.6 ± 0.20.6 ± 0.02.9 ± 0.1−2.7 ± 0.10.6 ± 0.03.9 ± 0.15.2 ± 0.2
DGP21.2 ± 1.1 ns3.4 ± 0.2 +7.9 ± 0.5 ns0.6 ± 0.0 ns3.7 ± 0.2 ns−3.1 ± 0.1 ns0.7 ± 0.0 ns4.7 ± 0.2 ns6.3 ± 0.3 ns
ANOVA (p_Value)
DGP0.0520.0070.0730.1730.0190.0160.0240.0190.012
CV0.0010.0020.0040.0030.0010.0010.0020.001<0.001
DGP × CV0.0620.0810.1290.1590.2020.0850.5160.2020.138
MaturityJiangsuNJ5055Control5.0 ± 0.00.8 ± 0.03.0 ± 0.00.2 ± 0.00.4 ± 0.0−1.4 ± 0.00.2 ± 0.01.4 ± 0.01.5 ± 0.0
DGP5.1 ± 0.0 *0.9 ± 0.0 ns3.1 ± 0.1 ns0.2 ± 0.0 ns0.4 ± 0.0 ns−1.4 ± 0.0 ns0.2 ± 0.0 ns1.4 ± 0.0 ns1.6 ± 0.0 ns
YY1540Control8.0 ± 0.20.6 ± 0.03.8 ± 0.10.2 ± 0.00.5 ± 0.0−1.4 ± 0.00.2 ± 0.01.5 ± 0.01.7 ± 0.0
DGP8.5 ± 1.0 ns0.7 ± 0.0 *4.1 ± 0.4 ns0.2 ± 0.0 **0.6 ± 0.0 **−1.5 ± 0.0 *0.3 ± 0.0 **1.6 ± 0.0 **1.9 ± 0.0 **
ANOVA (p_Value)
DGP0.5330.0220.3880.0190.0010.0170.0010.0010.004
CV0.0010.0010.0040.001<0.0010.0010.001<0.001<0.001
DGP × CV0.6890.2540.7330.0150.0200.0810.0230.0200.055
Jiangsu, Shiye Town, Zhenjiang city, Jiangsu Province; Zhejiang, Dongyang city, Jinhua city, Zhejiang Province; RARSc, ratio analysis of reflectance spectra for carotenoids; MTCI, MERIS terrestrial chlorophyll index; GCI, green chlorophyll index; NDVI705, normalized difference vegetation index; CI, chlorophyll index; CIrededge, red-edge chlorophyll index; mND705, modified normalized difference; SR705, simple ratio; GM, relative dark green index. Mean values ± standard errors (n = 3) followed by **, *, +, and ns indicated the significance levels at p ≤ 0.01, p ≤ 0.05, p ≤ 0.1, and p > 0.1 determined by t-test, respectively. The values of ANOVA results in bold show significant treatment effects at p ≤ 0.1.
Table 5. Effects of duckweed growing in paddy fields (DGP) on the rice grain yield and its components.
LocationCultivar (CV)TreatmentPanicles
m−2
Spikelets per PanicleSeed Setting
Rate (%)
1000-Grain
Weight (g)
Yield (m−2)
ZhejiangJFY2Control187.9 ± 11.2276.1 ± 16.180.6 ± 2.723.6 ± 0.1981.1 ± 37.5
DGP202.9 ± 17.2 ns287.5 ± 10.4 ns75.9 ± 3.3 ns24.2 ± 0.4 ns1062.3 ± 42.8 ns
JiangsuNJ5055Control304.0 ± 12.9131.4 ± 6.090.4 ± 0.625.3 ± 0.8909.8 ± 17.3
DGP337.1 ± 6.6 +123.8 ± 7.3 ns93.8 ± 1.0 *26.2 ± 0.6 ns1021.8 ± 13.3 **
YY1540Control186.0 ± 10.6283.9 ± 8.489.1 ± 1.221.4 ± 0.41000.6 ± 23.2
DGP209.9 ± 3.6 +287.7 ± 8.6 ns84.8 ± 2.2 ns21.5 ± 0.6 ns1099.7 ± 19.3 *
ANOVA (p_Value)
DGP0.0080.7600.7800.4580.002
CV<0.001<0.0010.0120.0010.005
DGP × CV0.5550.3650.0370.6180.757
Jiangsu, Shiye Town, Zhenjiang city, Jiangsu Province; Zhejiang, Dongyang city, Jinhua city, Zhejiang Province; mean values ± standard errors (n = 3) followed by **, *, +, and ns indicated the significance levels at p ≤ 0.01, p ≤ 0.05, p ≤ 0.1, and p > 0.1 determined by t-test, respectively. The values of ANOVA results in bold show significant treatment effects at p ≤ 0.1.
Disclaimer/Publisher’s Note: The statements, opinions and data contained in all publications are solely those of the individual author(s) and contributor(s) and not of MDPI and/or the editor(s). MDPI and/or the editor(s) disclaim responsibility for any injury to people or property resulting from any ideas, methods, instructions or products referred to in the content.

