Article

The ptxD Gene Confers Rapeseed the Ability to Utilize Phosphite and a Competitive Advantage against Weeds

College of Agronomy, Hunan Agricultural University, Changsha 410128, China
*
Author to whom correspondence should be addressed.
Agronomy 2024, 14(4), 727; https://doi.org/10.3390/agronomy14040727
Submission received: 4 March 2024 / Revised: 22 March 2024 / Accepted: 27 March 2024 / Published: 1 April 2024

Abstract

:
Weed infestation has seriously affected the yield and quality of rapeseed, which is a globally significant oil crop. While the application of chemical herbicides in agriculture has greatly boosted agricultural efficiency and crop yield, it has also unfortunately led to escalating environmental pollution and the emergence of herbicide-resistant weeds. The ptxD gene, originating from bacteria, encodes the phosphite dehydrogenase enzyme that is responsible for converting phosphite (Phi) into orthophosphate (Pi). Phi remains unusable by plants and most microorganisms, but upon its conversion into Pi, it becomes a viable nutrient source for plants. This unique function of the ptxD gene offers promising avenues for the development of innovative weed control technologies. We tested the Phi tolerance of weeds and ptxD-expressing rapeseed (Brassica napus) through greenhouse experiments in rapeseed fields. The results revealed that a Phi concentration of 200 mg·kg of soil−1 inhibited the growth of all weeds in the rapeseed fields, while the ptxD-expressing rapeseed exhibited robust tolerance to this concentration of Phi. In field experiments, the application of 60 g·m−2 of Phi allowed the ptxD-expressing rapeseed to grow normally, while the weeds grew slowly due to phosphorus deficiency, resulting in the rapeseed having a strong competitive advantage over the weeds. The leaves of the transgenic rapeseed plants covered gaps in the field as they grew, further inhibiting weed growth and completely eliminating their harm due to shading effects. The combination of ptxD-expressing rapeseed and the application of phosphite offers a sustainable alternative to herbicides for weed management in rapeseed fields.

1. Introduction

Phosphorus (P) is essential for plant growth and fecundity; plants import phosphate (Pi) from soil for P. Phosphite (Phi) is an analog of phosphate in soil [1]; plants can also actively import Phi from soil but are unable to use it as a P source for normal growth. If too much Phi accumulates in a plant, it will cause toxicity to plant cells and hinder plant growth [2].
Common concentrations for total P in soils are between 200 and 800 mg·kg−1; phosphorus usually combines with Fe and Al to form insoluble phosphates, resulting in phosphorus deficiency in many soils on Earth [3]. The supply of phosphorus fertilizer falls short of the demand for crop production [4,5]. Additionally, it is expected that the world’s easily exploitable and low-cost reserves of phosphate resources will be depleted by around 2050 [6]. Weeds are a major constraint to crop production; they can compete with crops for most abiotic resources, such as light, water, and nutrients, leading to reduced crop yield and quality [7,8,9].
Chemical herbicides are widely used to control weeds; they can promote crop production, but they also cause environmental pollution [10,11]. The long-term use of herbicides can also cause herbicide-resistant weeds to evolve; herbicide resistance has already been confirmed in 254 weed species globally [12,13], and its widespread occurrence poses a severe threat to crop production [14].
The ptxD gene from Pseudomonas stutzeri encodes phosphite oxidoreductase (PTXD). This enzyme catalyzes the oxidation of Phi to Pi [15]. Transgenic plants harboring the ptxD gene can use Phi as a sole P source and act as a non-herbicidal mechanism of weed control. In fields, selective fertilization with Phi allows for the unlimited growth of transgenic plants, while weed growth is limited by the lack of available Pi. To avoid using chemical herbicides, the ptxD/Phi system has been utilized in many plants in recent years, such as Arabidopsis, cotton, soybean, rice, and rapeseed, due to its significant weed control abilities [16,17,18,19,20].
In this study, we found that ptxD-expressing rapeseed (B. napus) plants grew well when Phi was used as an exclusive P source. Furthermore, we demonstrated the efficacy of Phi in suppressing aggressive weeds such as crickweed (Malachium aquaticum L.), shortawn foxtail (Alopecurus aequalis Sobol.), sorrel (Rumex acetosa L.), and other naturally occurring weeds in rapeseed fields in Changsha, Hunan Province. Additionally, our field studies unambiguously revealed that ptxD-expressing rapeseed plants can effectively outcompete naturally occurring weeds in rapeseed fields when provided with Phi. ptxD-expressing rapeseed’s competitive advantage over weeds underscores the immense potential of using the ptxD/Phi system in weed control, highlighting its significance in sustainable agriculture practices.

2. Materials and Methods

2.1. Plant Materials

The PTXD sequence (GenBank Accession WP_003118429.1) is derived from P. stutzeri wm88. To enhance the expression levels of PTXD proteins in rapeseed, the codon usage of the ptxD gene was optimized without changing the amino acid sequence. Subsequently, the optimized ptxD gene was chemically synthesized and cloned into pCAMBIA1303 to form pCAMBIA1303 + ptxD (containing the hyg gene as a plant selection marker). pCAMBIA1303 + ptxD was transformed into the B. napus cultivar Xiangyou 18 through an Agrobacterium-mediated transformation, and 15 transgenic lines were obtained; among these, the L1-2 line contained a single copy of the ptxD gene within its genome, as verified by Southern blotting [20]. The L1-2 line was used to evaluate the ptxD/Phi system in the context of selective fertilization and weed suppression.
Three types of weeds, namely M. aquaticum, A. aequalis, and R. acetosa, along with lawns containing a diverse array of naturally occurring weeds were employed for the experiments. These weed seedlings and lawns were harvested from rapeseed fields in Changsha, Hunan Province, removed, and subsequently transplanted into plastic pots.

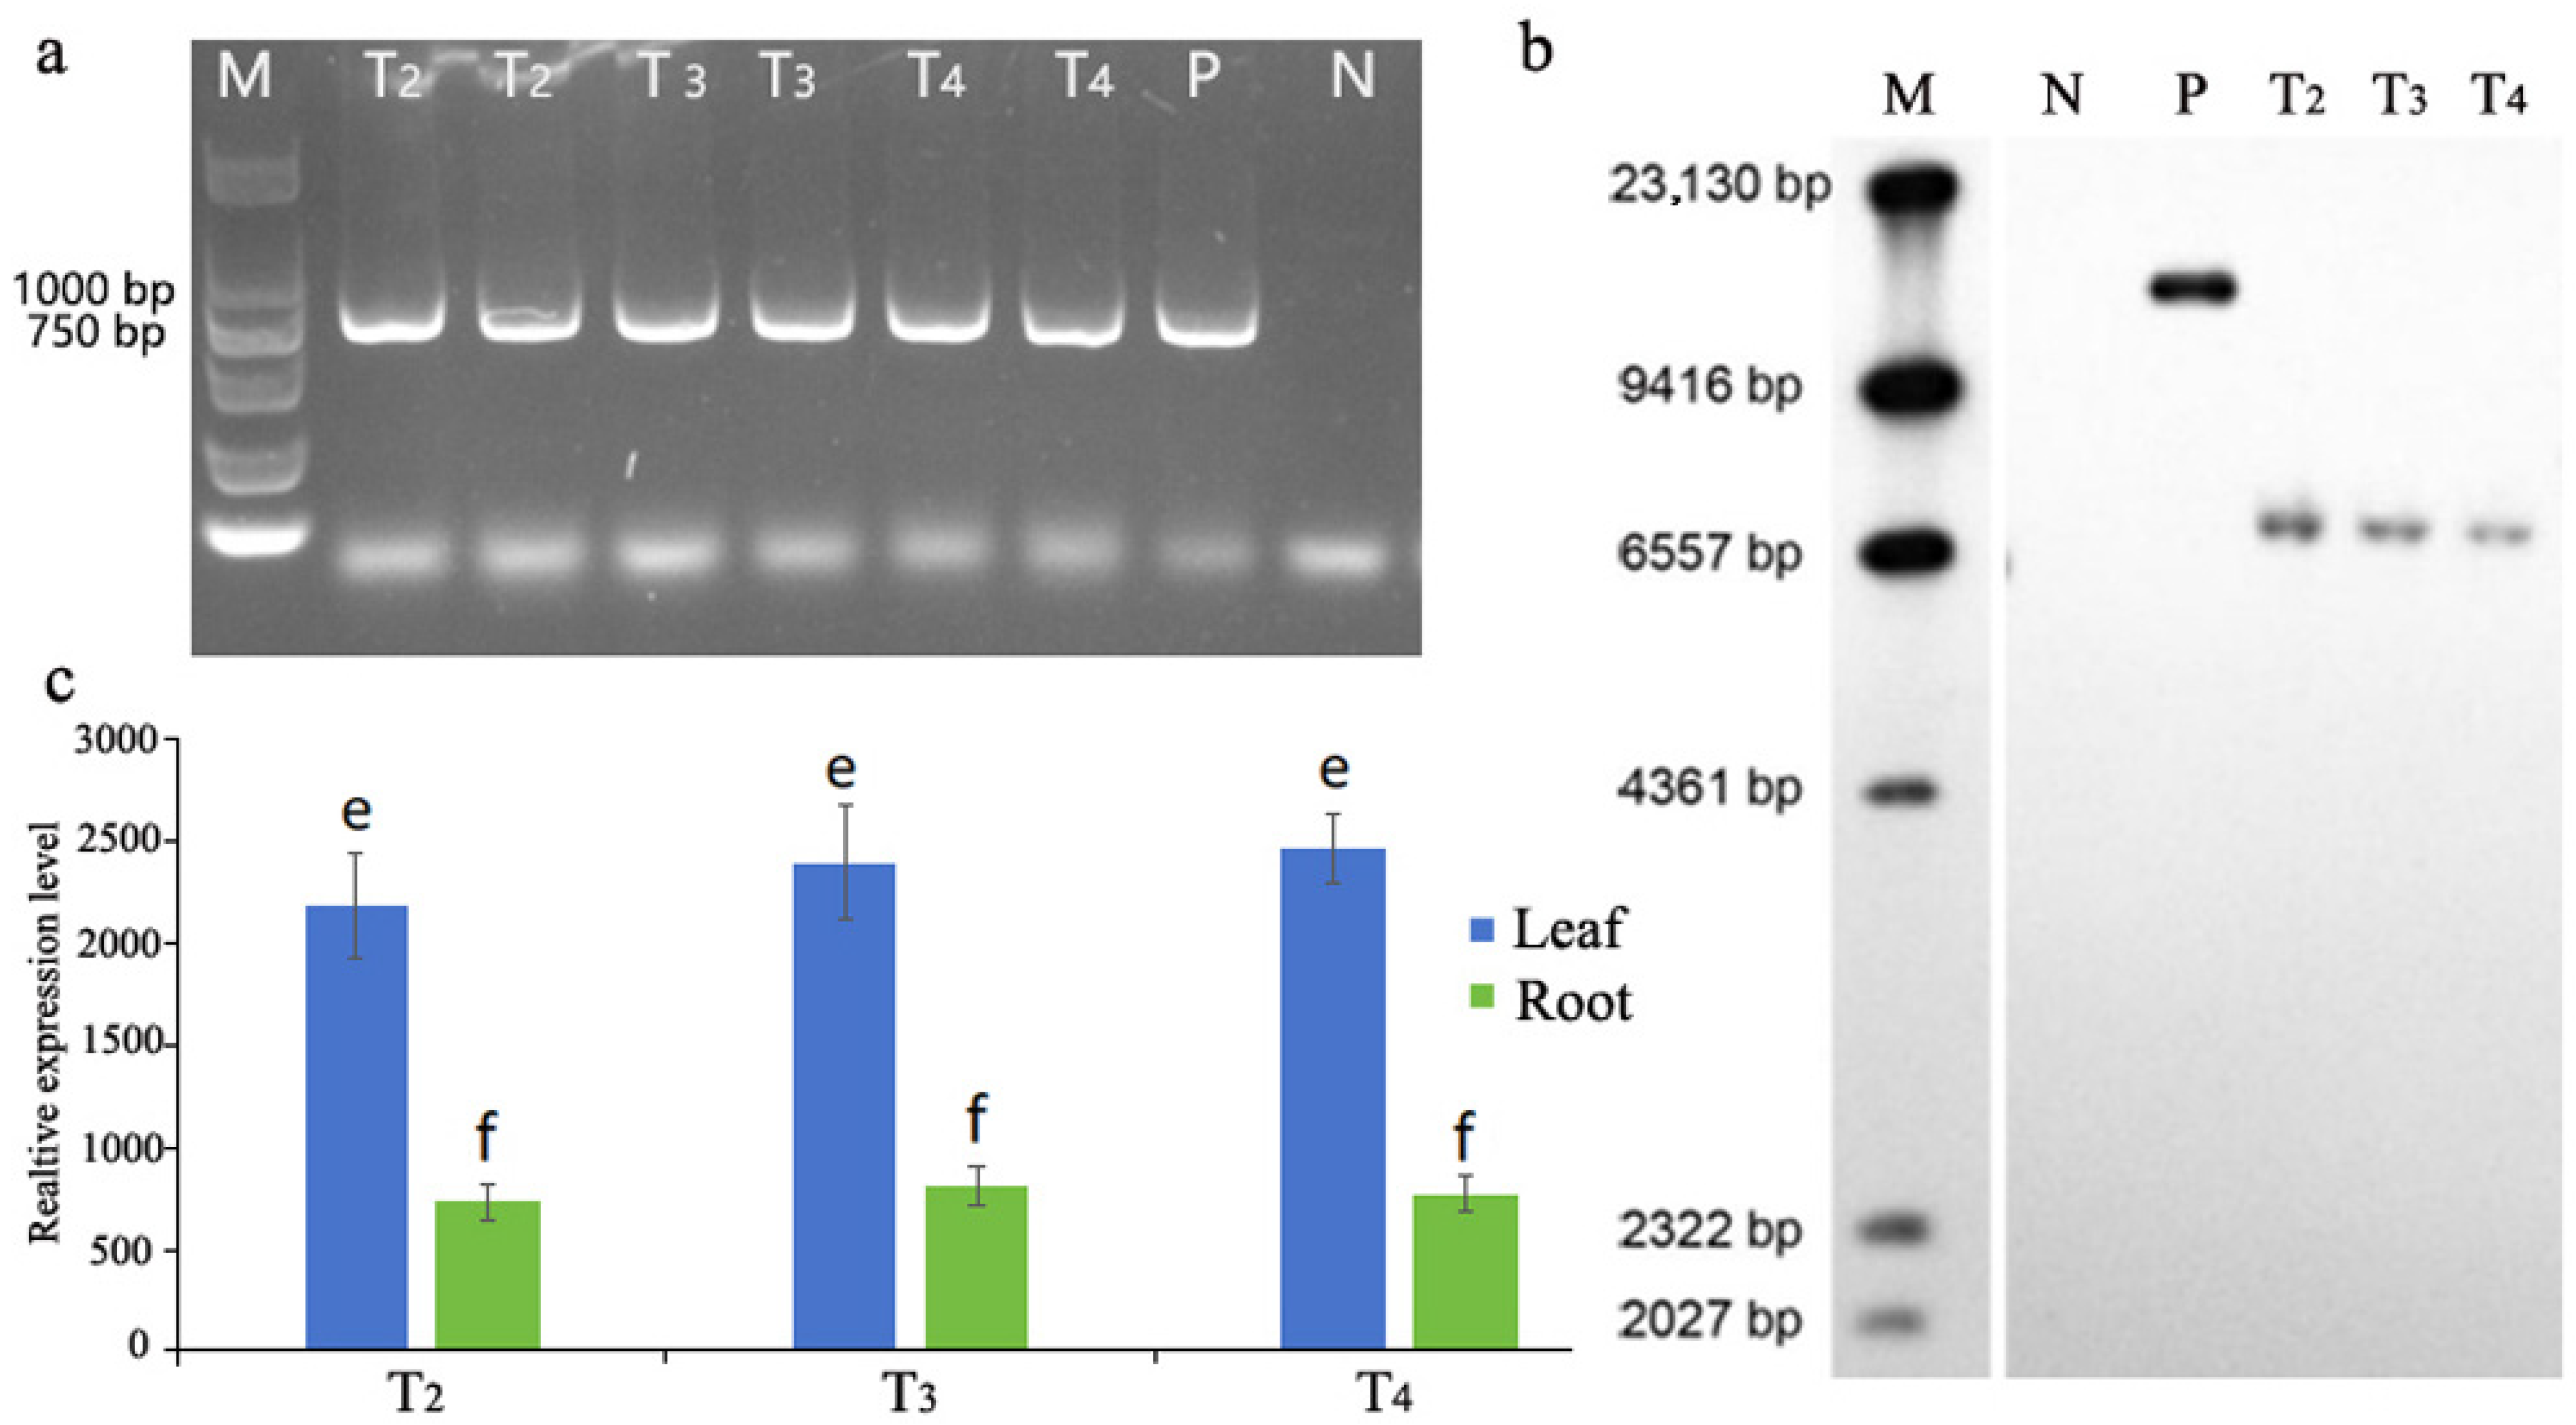
2.2. Genomic DNA Extraction, PCR, and Southern Blotting

The genomic DNA was isolated from the L1-2 line using a Plant Isolate DNA Extraction Kit, following the manufacturer’s instructions. The following primer pairs were used for the PCR analysis: ptxdF (5′-AGATAGAGTGGACGCAGATT-3′) and ptxdR (5′-GTTAGCTGCGTTGATAG GTC-3′). The expected length of the PCR product was 817 bp. The products were subsequently submitted to Tsingke Biotech (Beijing, China) for sequencing. For a Southern blot analysis, 12 mg of genomic DNA was digested with KpnI and separated on 1% agarose gel in TBE buffer. Digested genomic DNA from wild-type (WT, B. napus cultivar Xiangyou 18) plants spiked with restriction-digested pCAMBIA1303 + ptxD plasmid served as the positive control. Xiangyou 18 plants’ genomic DNA, digested with the same enzyme, was used as the negative control. The DNA fragments in the agarose gels were transferred to a nylon membrane in 10× SSC buffer using capillary action [21]. The probes were prepared using the ptxdF and ptxdR primer pairs through a PCR, and the amplicon digoxigenin-dUTP was prepared using a DIG High Prime DNA Labeling and Detection Starter Kit II (Roche, Mannheim, Germany). Hybridization, post-hybridization, membrane washing, and signal detection were performed according to the instructions provided in the kit.

2.3. Quantitative Real-Time RT-PCR

The total RNA was extracted from the young leaves of the T4 generation of the L1-2 line and the WT using a Spectrum™ Plant Total RNA Kit. The isolated RNA was subjected to DNase treatment using an RNase-free DNase Kit. The cDNA was synthesized from these RNA samples using 1 μg of total RNA and a Taqman® Reverse Transcription Kit, following the manufacturer’s recommendations.
A qRT-PCR analysis was performed to determine the level of ptxD transcripts in the leaves of the T4 plants of the L1-2 line. The leaf RNA obtained from the WT plant was used as a control. The B. napus β-actin gene (GenBank Accession AF024716) worked as a reference gene for normalization. The samples were run on a 96-well plate using Power SYBR® Green PCR Master Mix on a CFX96 Touch™ Real-Time PCR Detection System, following the manufacturer’s instructions. The primer pairs used to amplify the ptxD gene were ptxD-1F (5′-GCCAGATAGAGTGGACGCAGAT-3′) and ptxD-1R (5′-CGCAACCAACAACCCTA AGC-3′), and the primer pairs used to amplify β-actin were BnaActin-F (5′-CGT GCCGATCTACGAAGGTTATG-3′) and BnaActin-R (5′-CTCTTAGCCGTCTCCAGCT CTTG-3′). The qRT-PCR results were analyzed using Bio-Rad CFX Manager™ 3.0 software and reported as relative ptxD expression values (mean values ± SDs, n = 3).

2.4. Assessment of ptxD-Expressing Rapeseed Plants’ Ability to Utilize Phi as a Source of P Using Sand Culture Experiments

Sand culture experiments were conducted using the T4 offspring of the L1-2 line and the WT to examine the ptxD transformants’ ability to utilize Phi as a source of P. Fourteen-day-old seedlings of T4 and the WT were transplanted into a mixture of washed sand and vermiculite (1:1) in plastic pots. The plants were fertilized daily with a modified Knop solution, 200 mg·L−1 of K2HPO3 or 200 mg·L−1 of K2HPO4 (Table S1). These treatments were conducted in a greenhouse at 25 °C on a 12:12 h light/dark cycle with a photon density of approximately 200 μM m−2·s−1 and 60–70% humidity. The plant height was recorded after thirty days of transplantation. The plants were dried in an oven at 70 °C for ten days, and the dry weights were recorded.

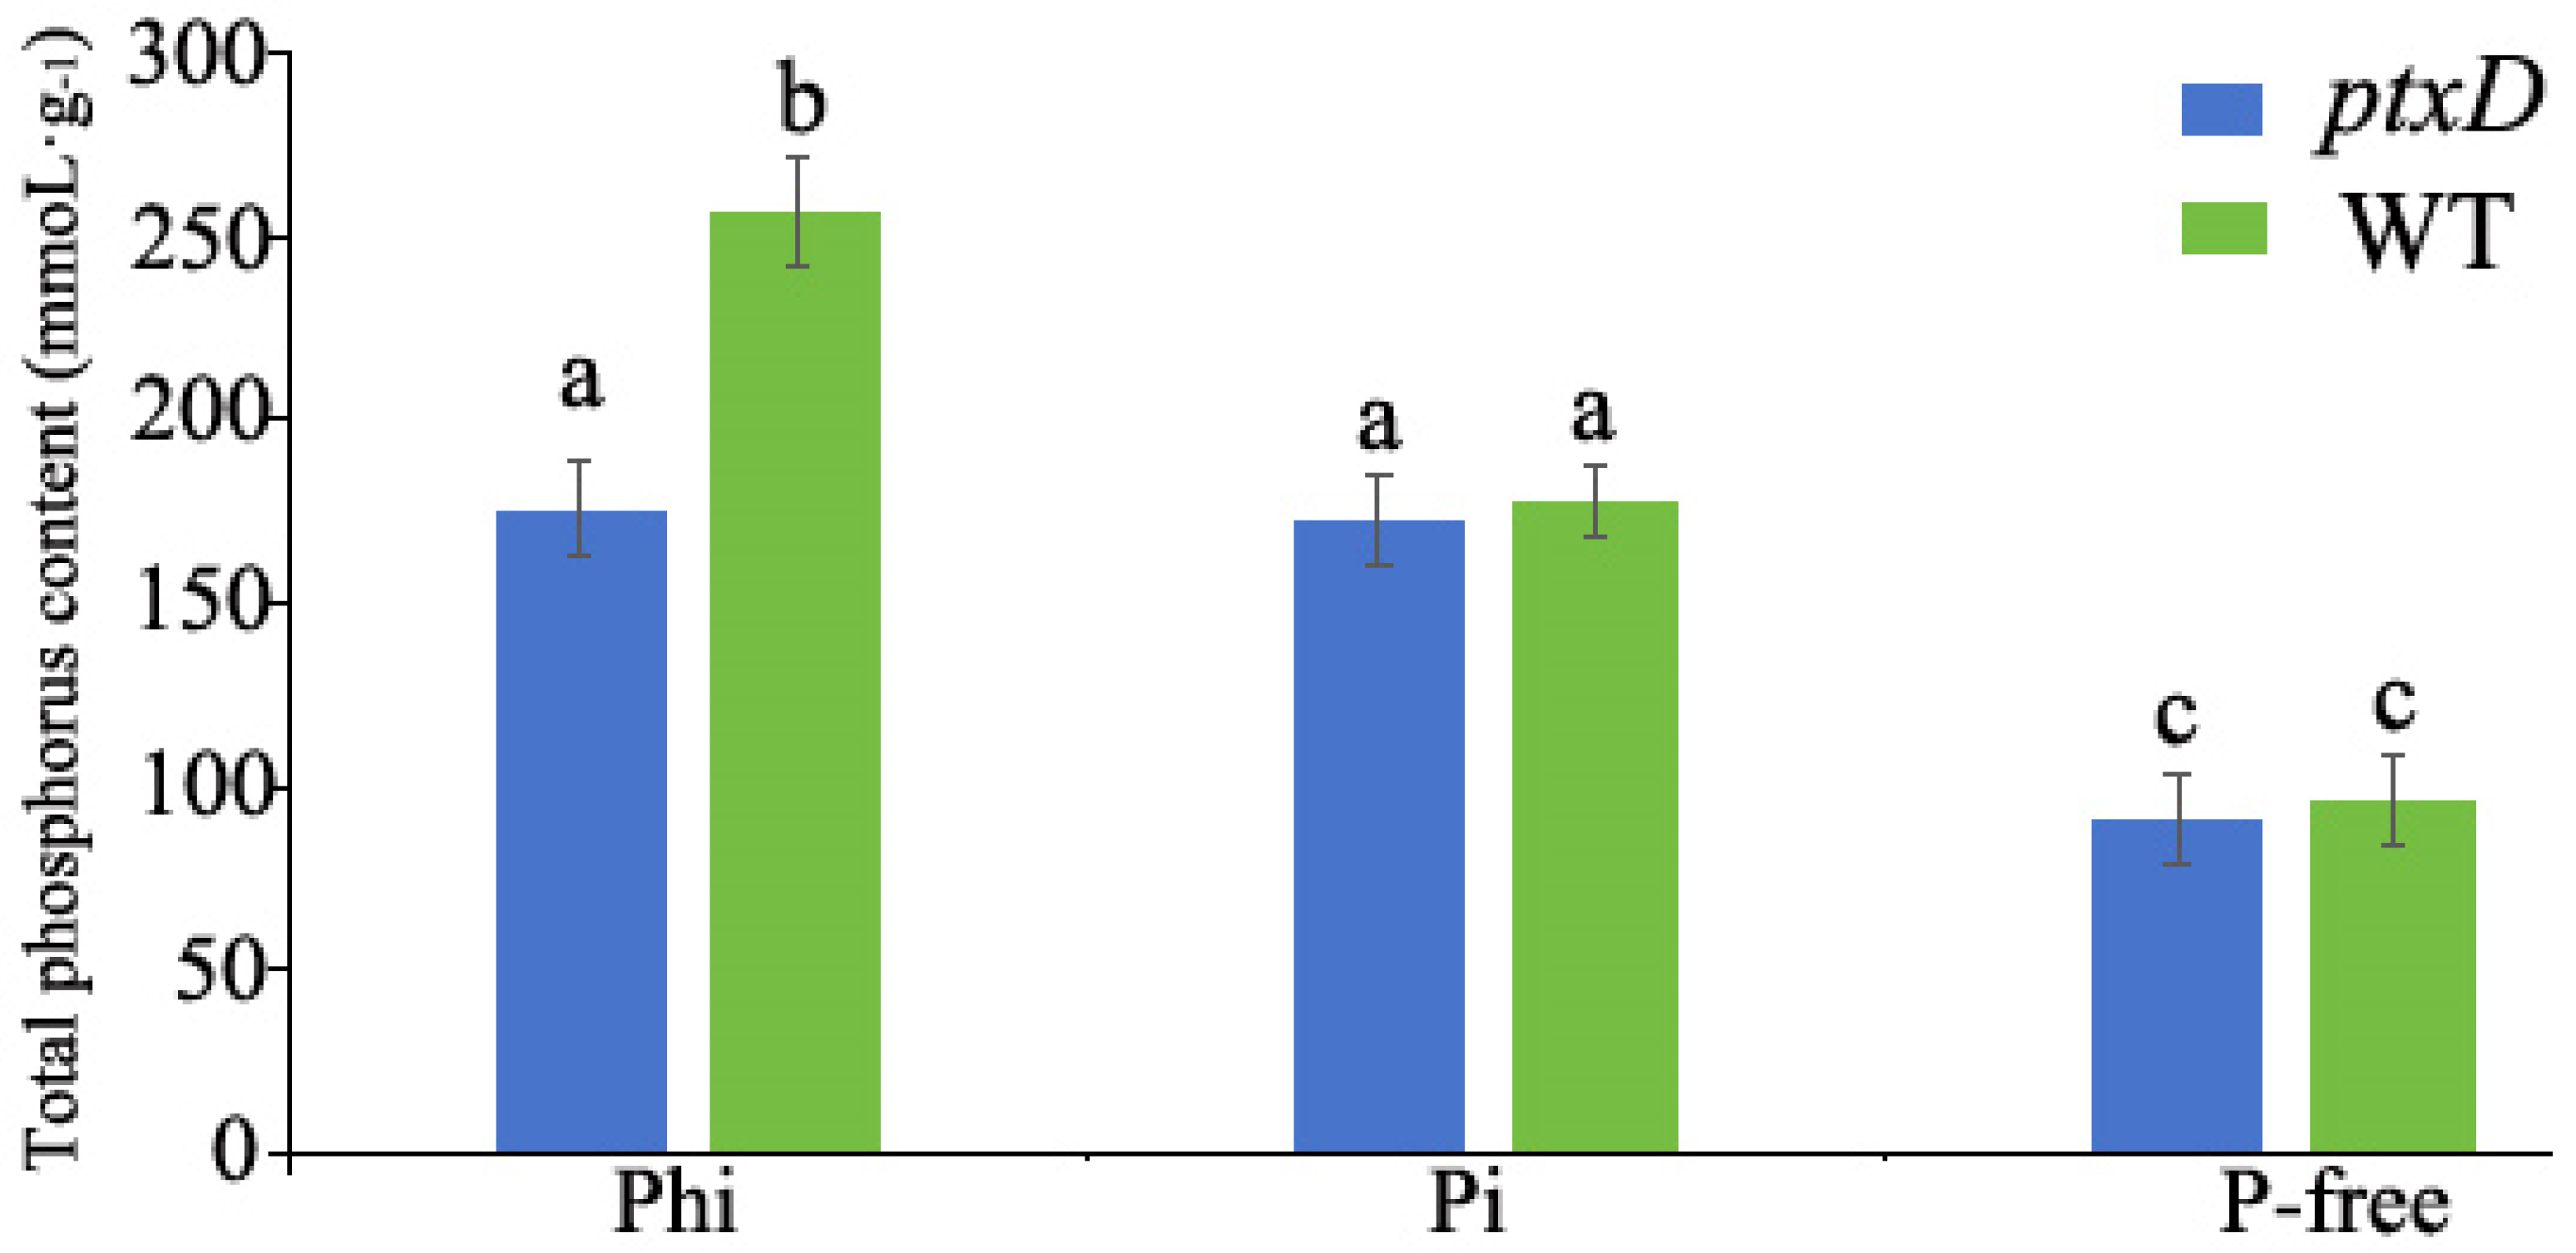
2.5. Determination of Total Phosphorus Content

The total phosphorus content in the rapeseed plants was analyzed using the molybdenum blue method [22] with a Plant Total Phosphorus Content Detection Kit, following the kit’s instructions. This method is commonly used to determine the inorganic phosphorus content. For plants that digest 5 mol·L−1 of sulfuric acid, the total phosphorus is converted into inorganic phosphorus. Molybdenum blue and phosphate ions form a substance with a characteristic absorption peak at 660 nm. The inorganic phosphorus content and the total phosphorus content in the plants can be subsequently determined by measuring the light absorption at 660 nm.

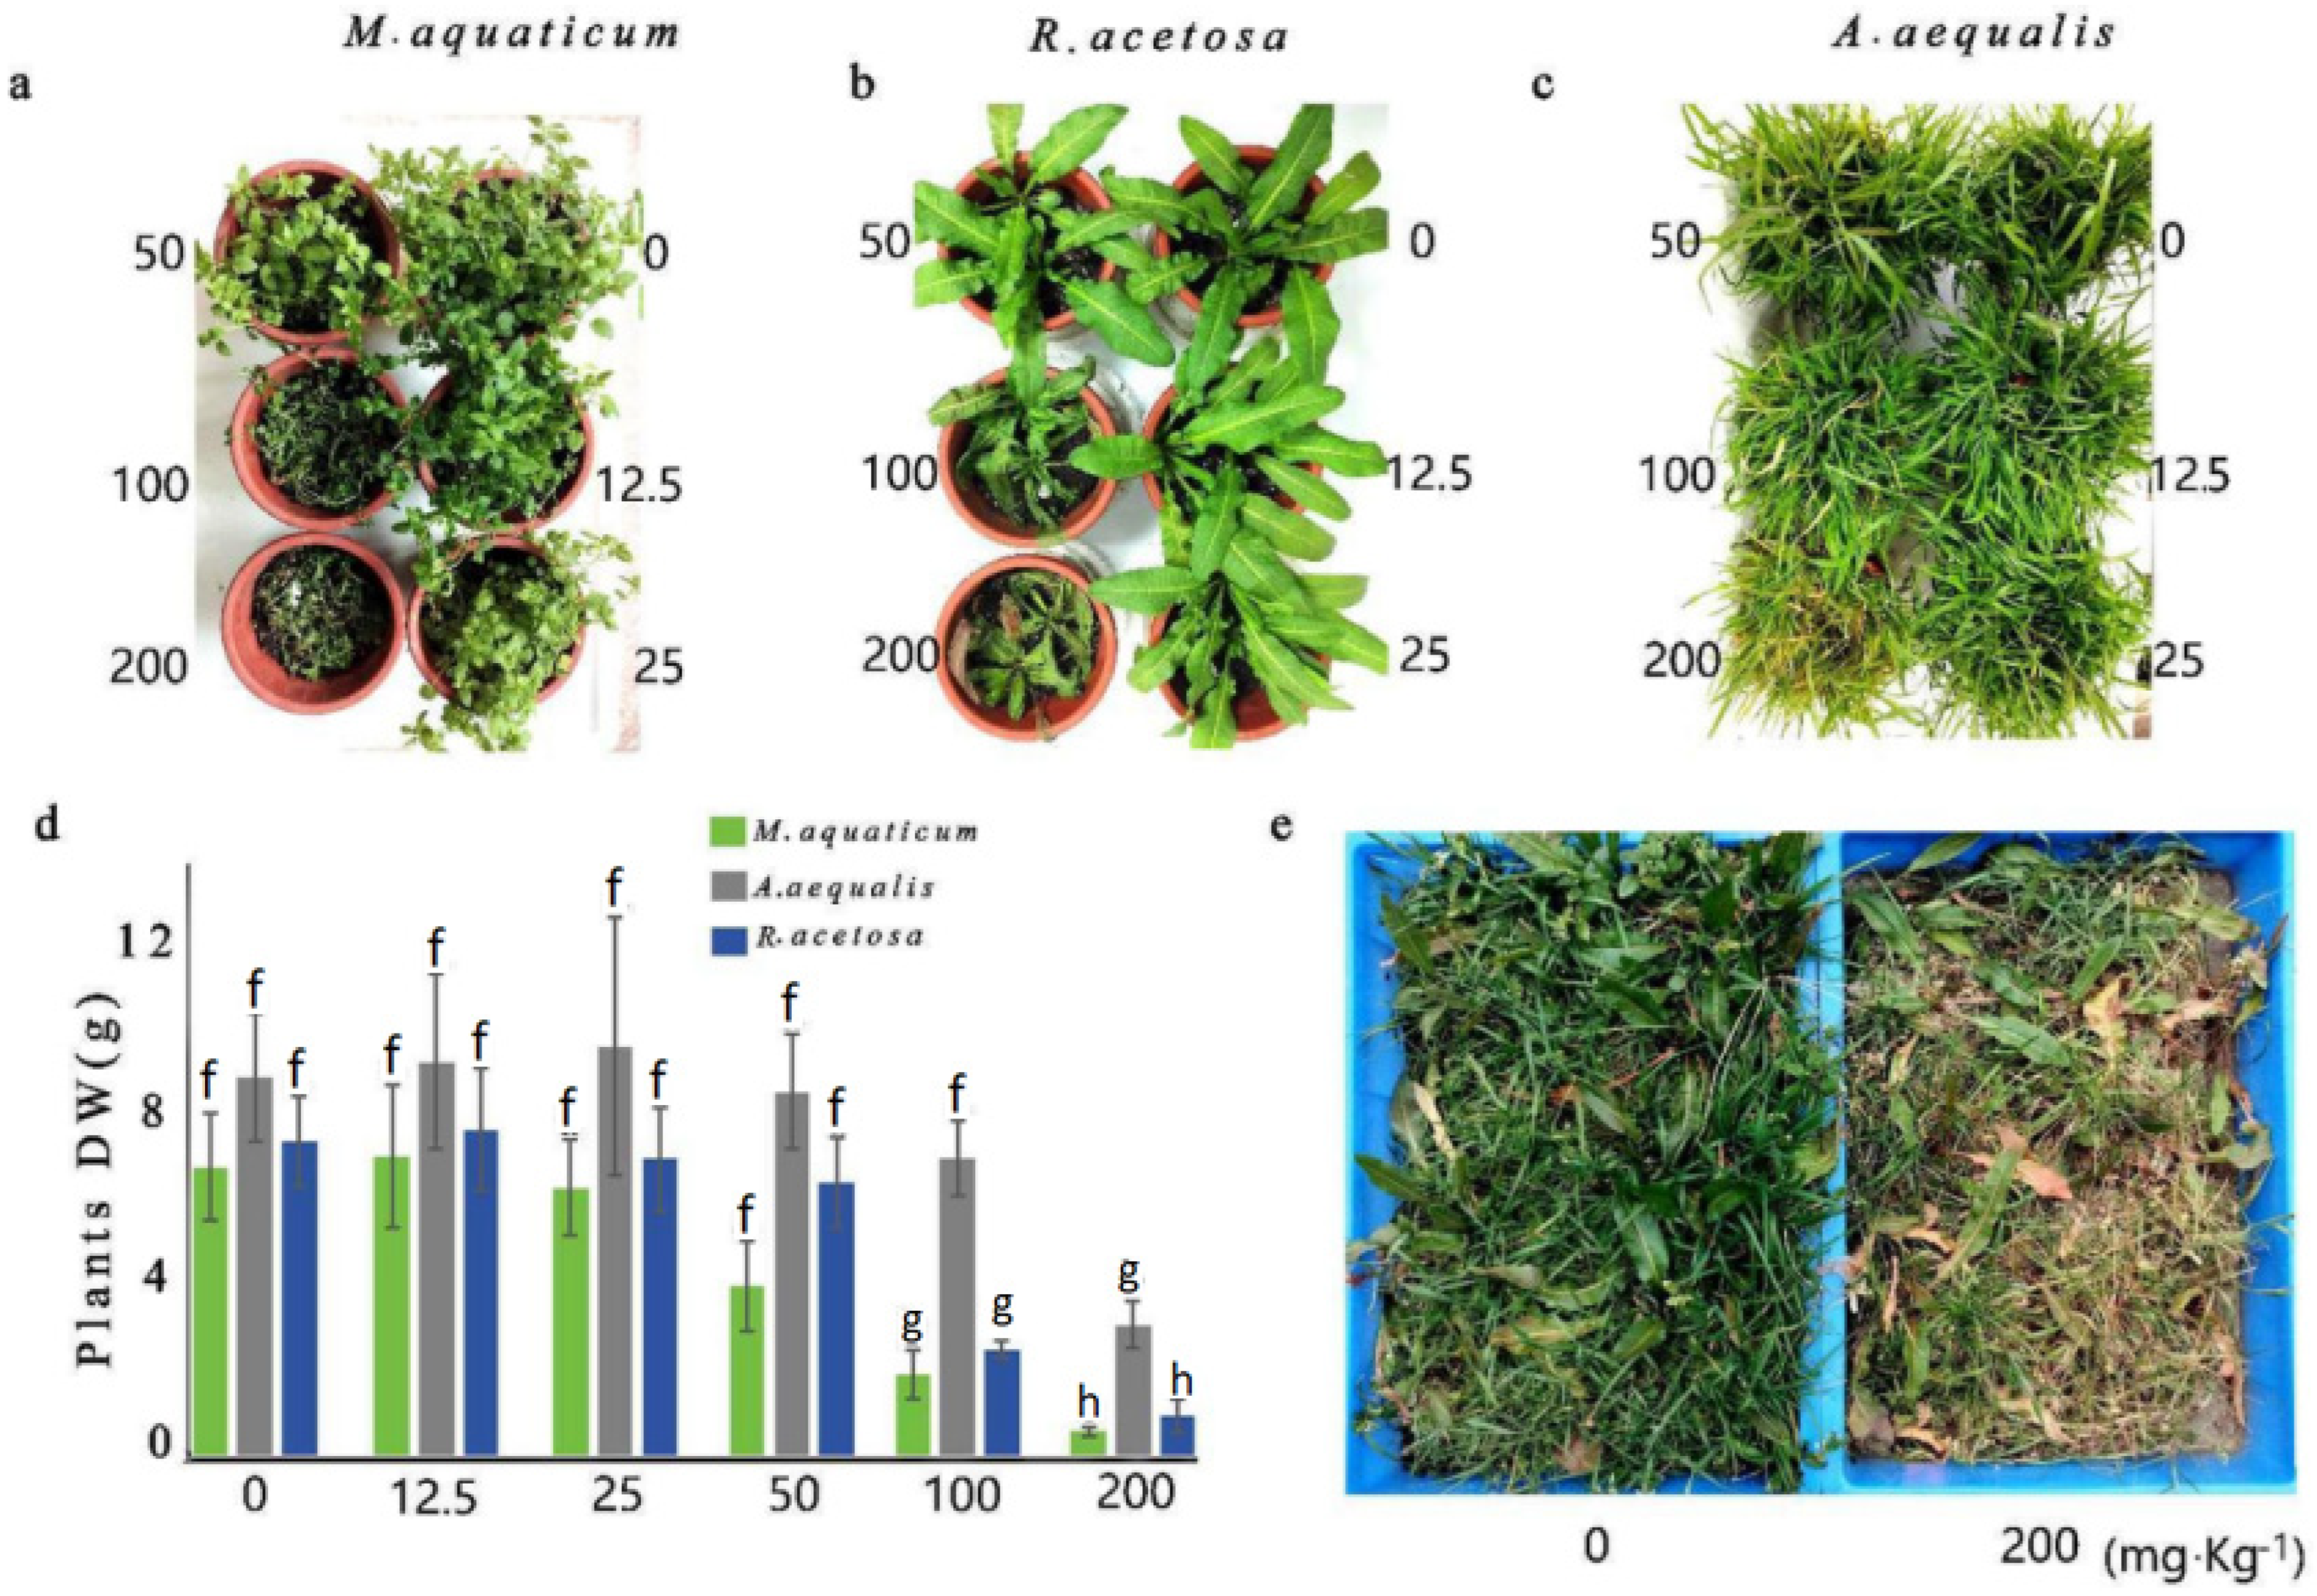
2.6. Evaluation of Weed Control Efficacy of Phi Using Pot Experiments

We conducted a pot experiment with three prevalent weeds, namely M. aquaticum, A. aequalis, and R. acetosa, to evaluate the viability of Phi as a phosphorus source for weed management. Collectively, these weeds constitute approximately 80% of the weed population in our experimental fields. These weed seedlings were transplanted into plastic pots containing 1.5–1.7 kg of soil sourced from experimental fields in Changsha, Hunan Province. This soil had an available phosphorus content of 7.85 mg·kg of soil−1, an available potassium content of 48.39 mg·kg of soil−1, and an alkaline hydrolyzable nitrogen content of 39.63 mg·kg of soil−1, as determined using methods outlined by Sui et al. [23].
After transplantation, the weeds were watered with a Knop solution devoid of P (Table S1). After ten days, we adjusted the Phi concentration in each pot based on the soil weight, aiming for rates of 0, 12.5, 25, 50, 100, and 200 mg·kg of soil−1. Additionally, we transplanted a 40 × 60 cm section of topsoil and its naturally occurring weed population from the rapeseed field into plastic pots with the same dimensions. These pots were also watered with the phosphorus-free Knop solution. We added the Phi solution to these pots after ten days, achieving a final concentration of 200 mg·kg of soil−1 based on the soil weight. All experiments were performed in a greenhouse and replicated three times; the growth conditions were consistent with those described in Section 2.4. The pots were regularly checked, and a small amount of distilled water was added when the soil moisture dropped below 30%. The growth of weeds was investigated four weeks after transplantation. After the investigation, the weeds were pulled out, the soil was washed from their roots, and they were placed in an oven to dry to a constant weight at 70 °C. The dry weight of the weeds in each pot was then measured.

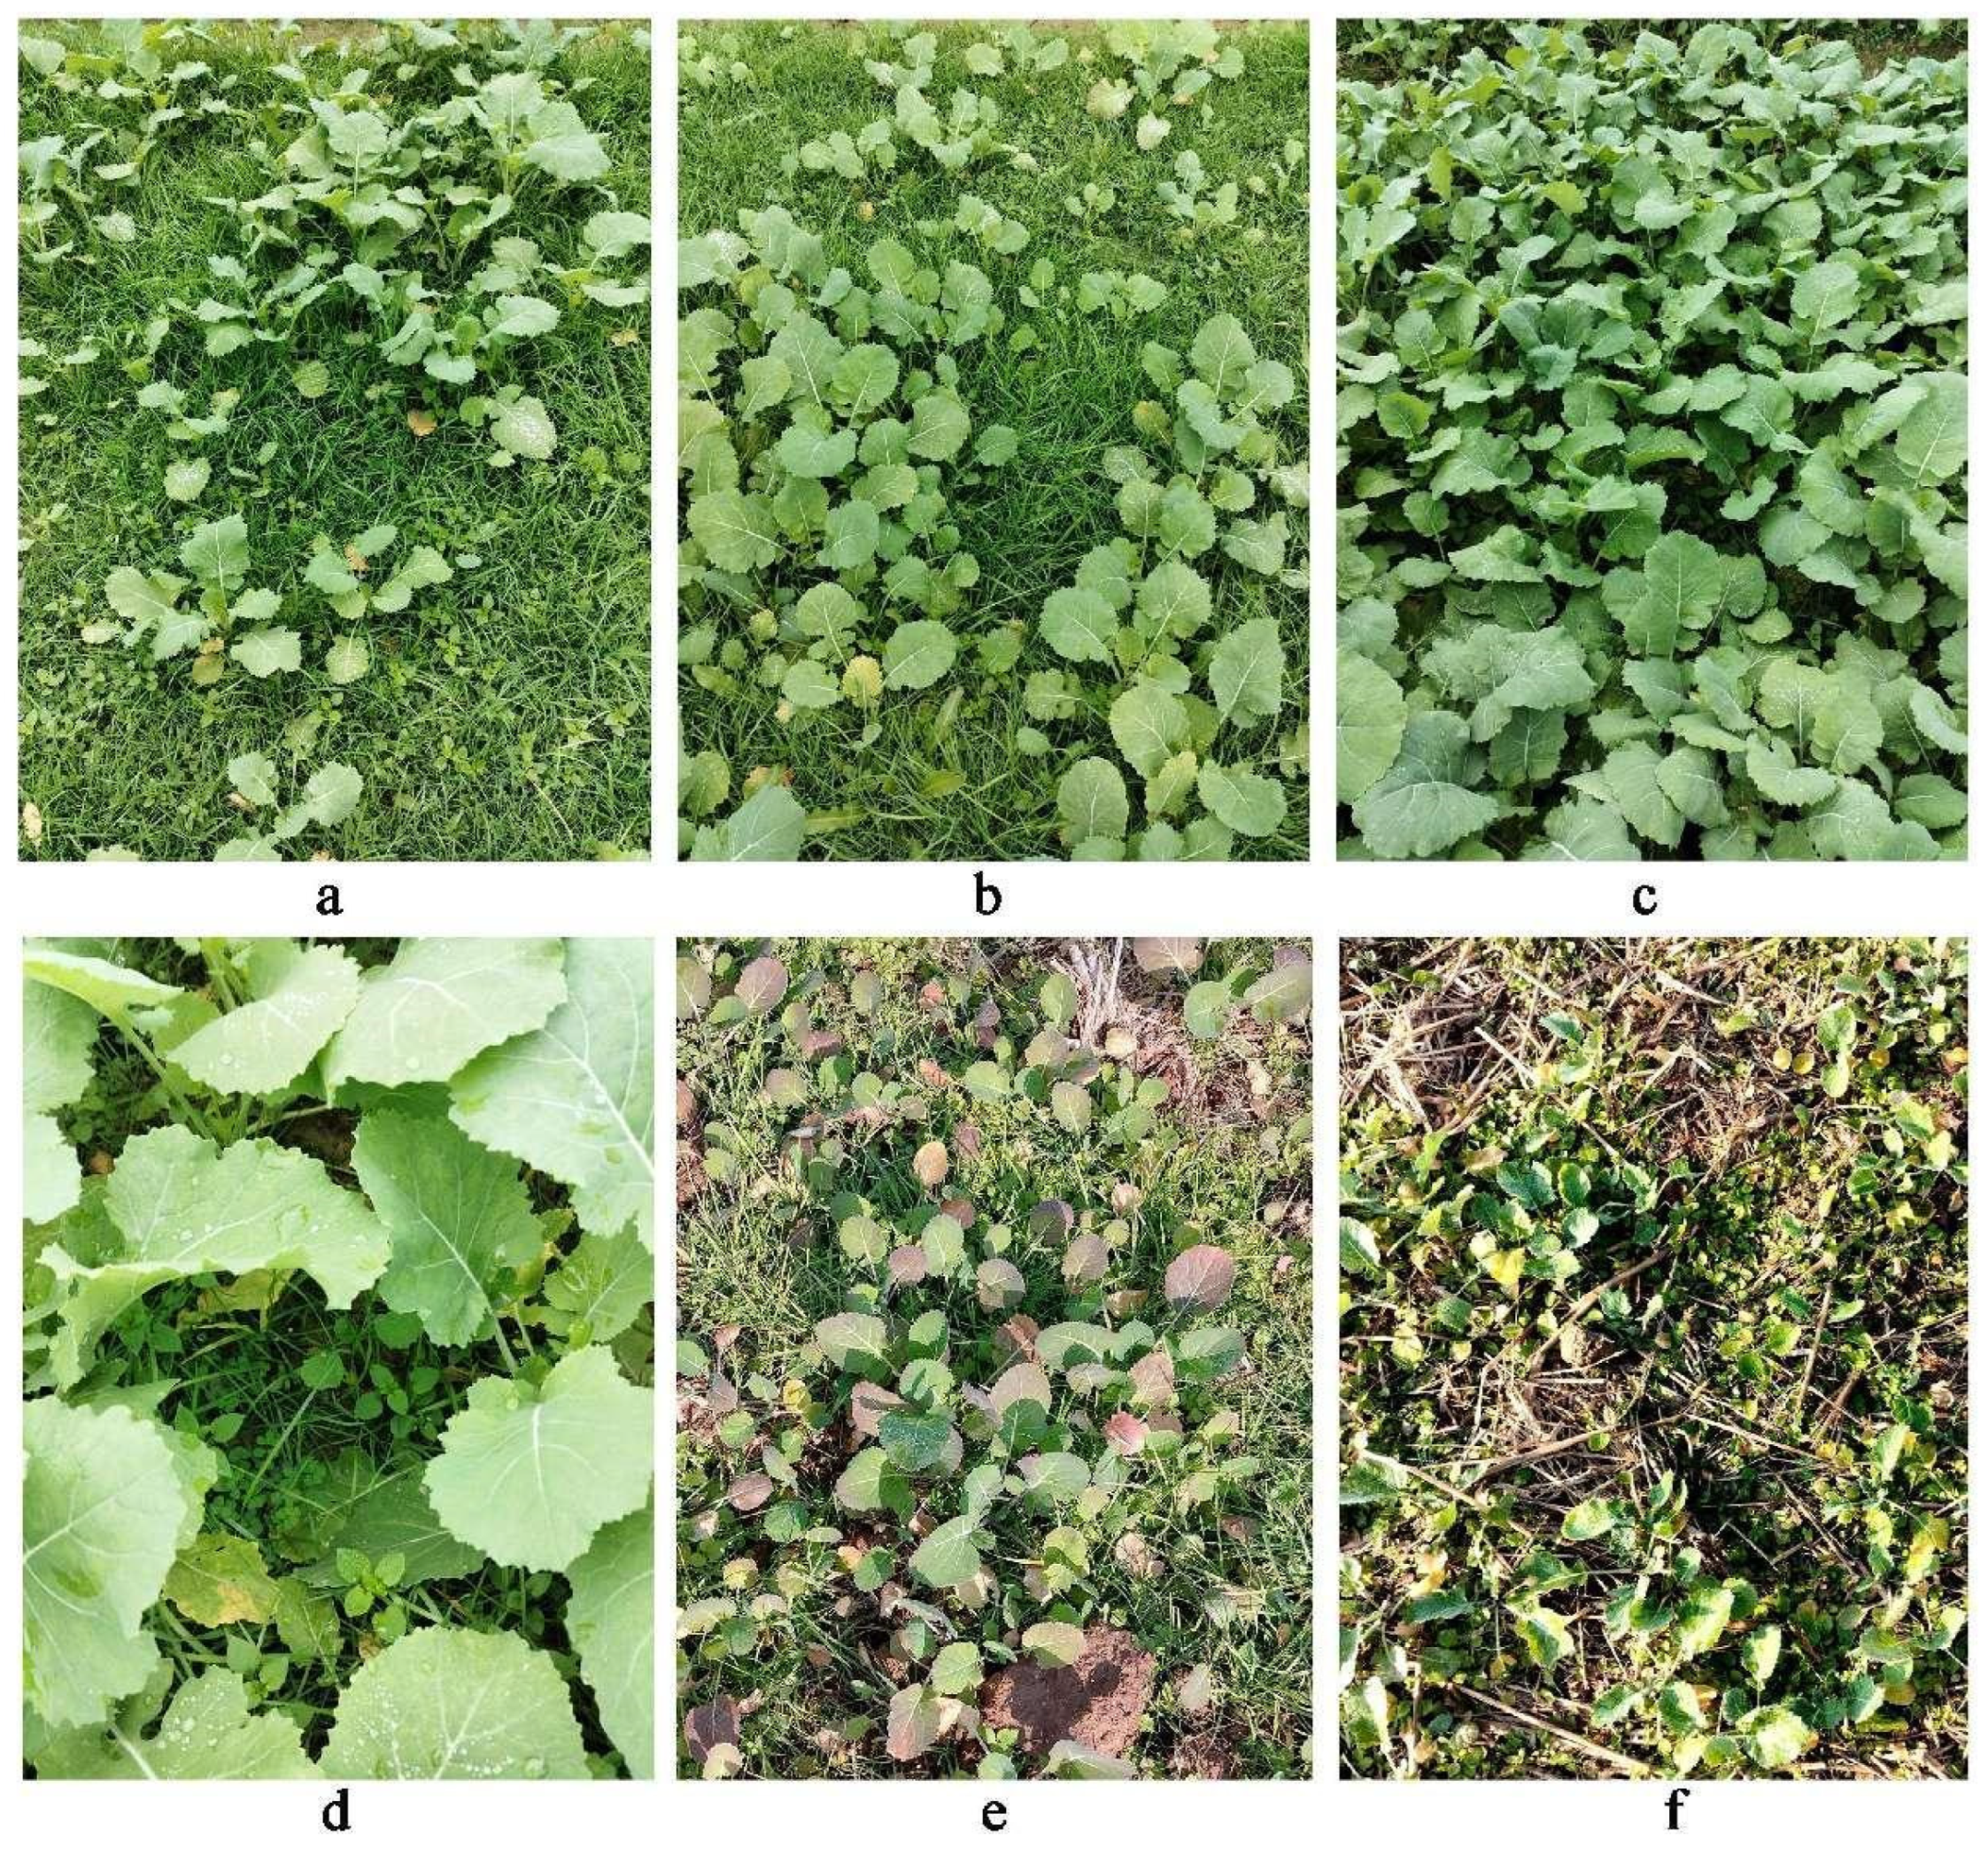
2.7. Competition Experiments with Field Weeds

Competition experiments were conducted to assess the impact of a fertilizer regimen that replaces Pi with Phi on the growth performance of ptxD-expressing rapeseed in a rice–rapeseed rotation system field. These experiments were carried out in Changsha, Hunan Province, China, where the soil had an available phosphorus content of 7.85 mg·kg of soil−1, an available potassium content of 48.39 mg·kg of soil−1, and alkaline hydrolyzable nitrogen levels of 39.63 mg·kg of soil−1 (Table S2). The soil’s phosphorus, potassium, and nitrogen levels were determined according to the methods outlined by Sui et al. [23]. Each experimental plot was two meters in length and one meter in width. The soil was treated with a single application of basal fertilizer containing 50 g·m−2 of nitrogen (urea, 46% of N), 25 g·m−2 of K2O (potassium chloride, 55% of K2O), 15 g·m−2 of P2O5 (superphosphate, 17% of P2O5), or 60 g·m−2 of Phi prior to seed planting. The rapeseed was seeded on 20 October 2023, with a seeding rate of 100 seeds per square meter. No weed control measures were implemented in any of the plots, and all other management practices followed local farming standards.
An investigation was conducted to assess the growth of the rapeseed plants six weeks after planting. This involved counting the number of rapeseed plants per square meter in each plot and determining the number of green leaves per plant. Furthermore, the roots of the rapeseed plants were carefully excavated from the soil and thoroughly washed to eliminate residual dirt, and the lengths of their above-ground portions were measured. The plants were then oven-dried at 70 °C until a constant weight was achieved. Finally, their respective dry weights were accurately determined.

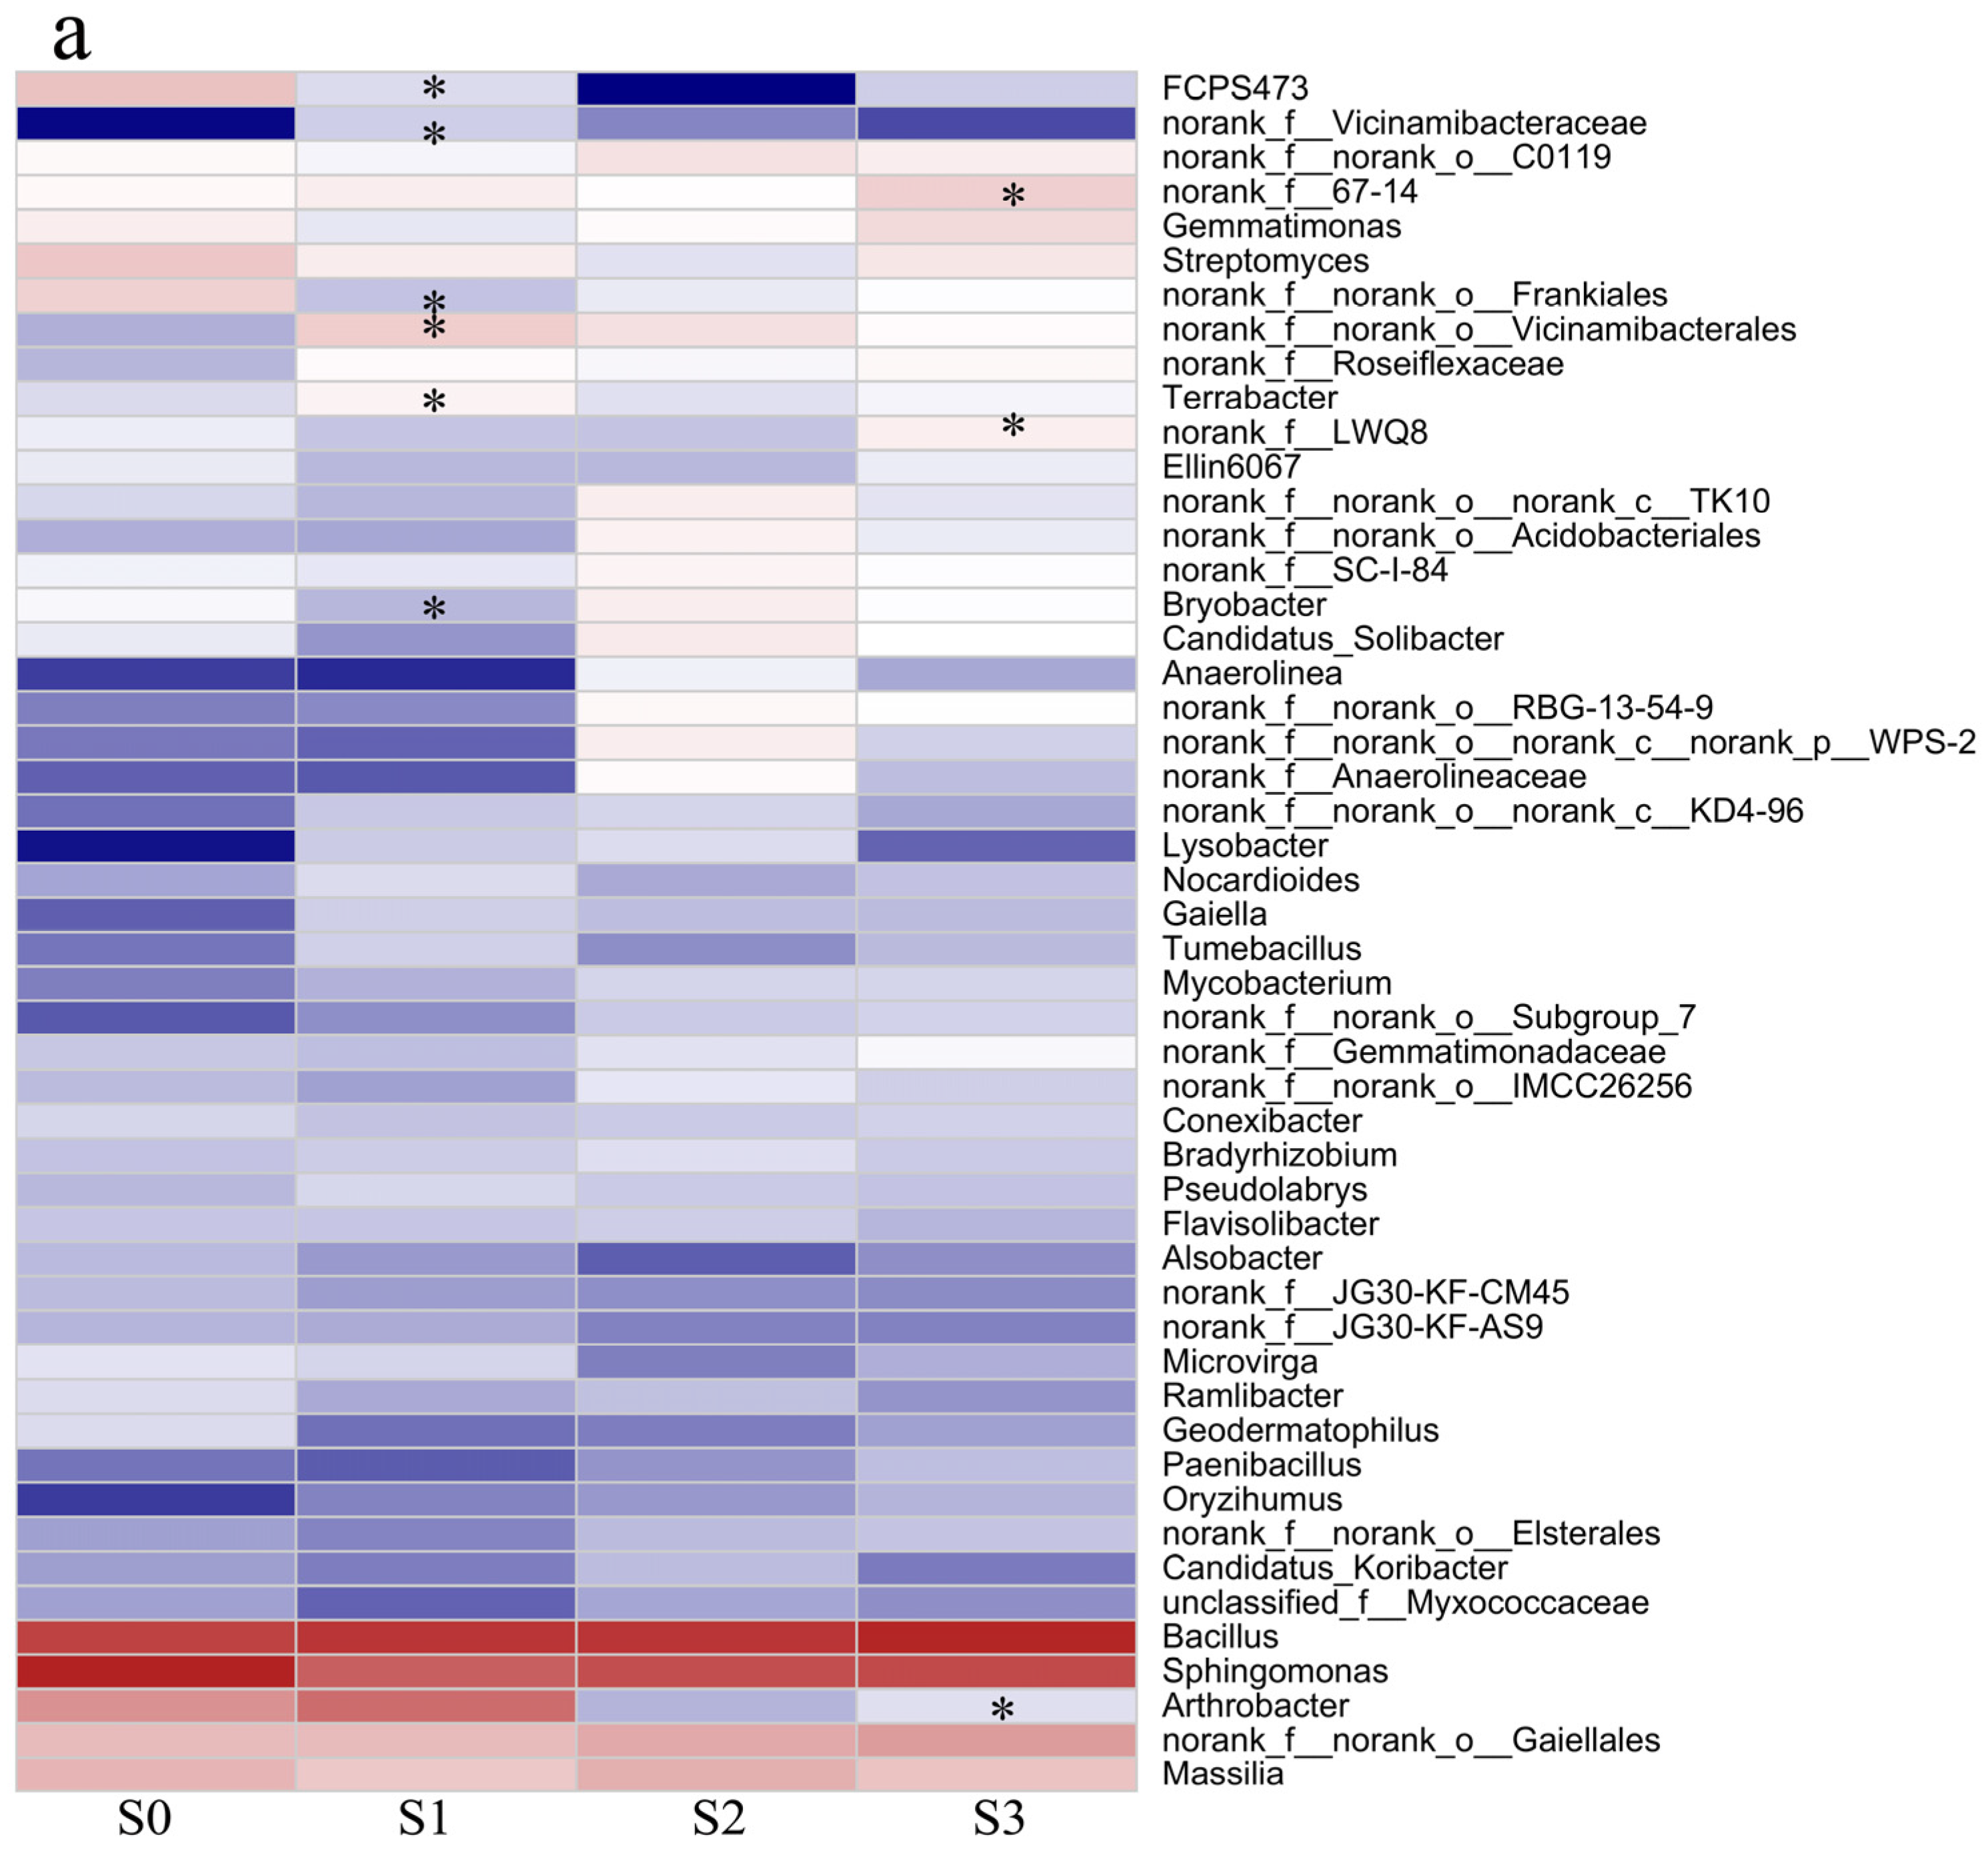
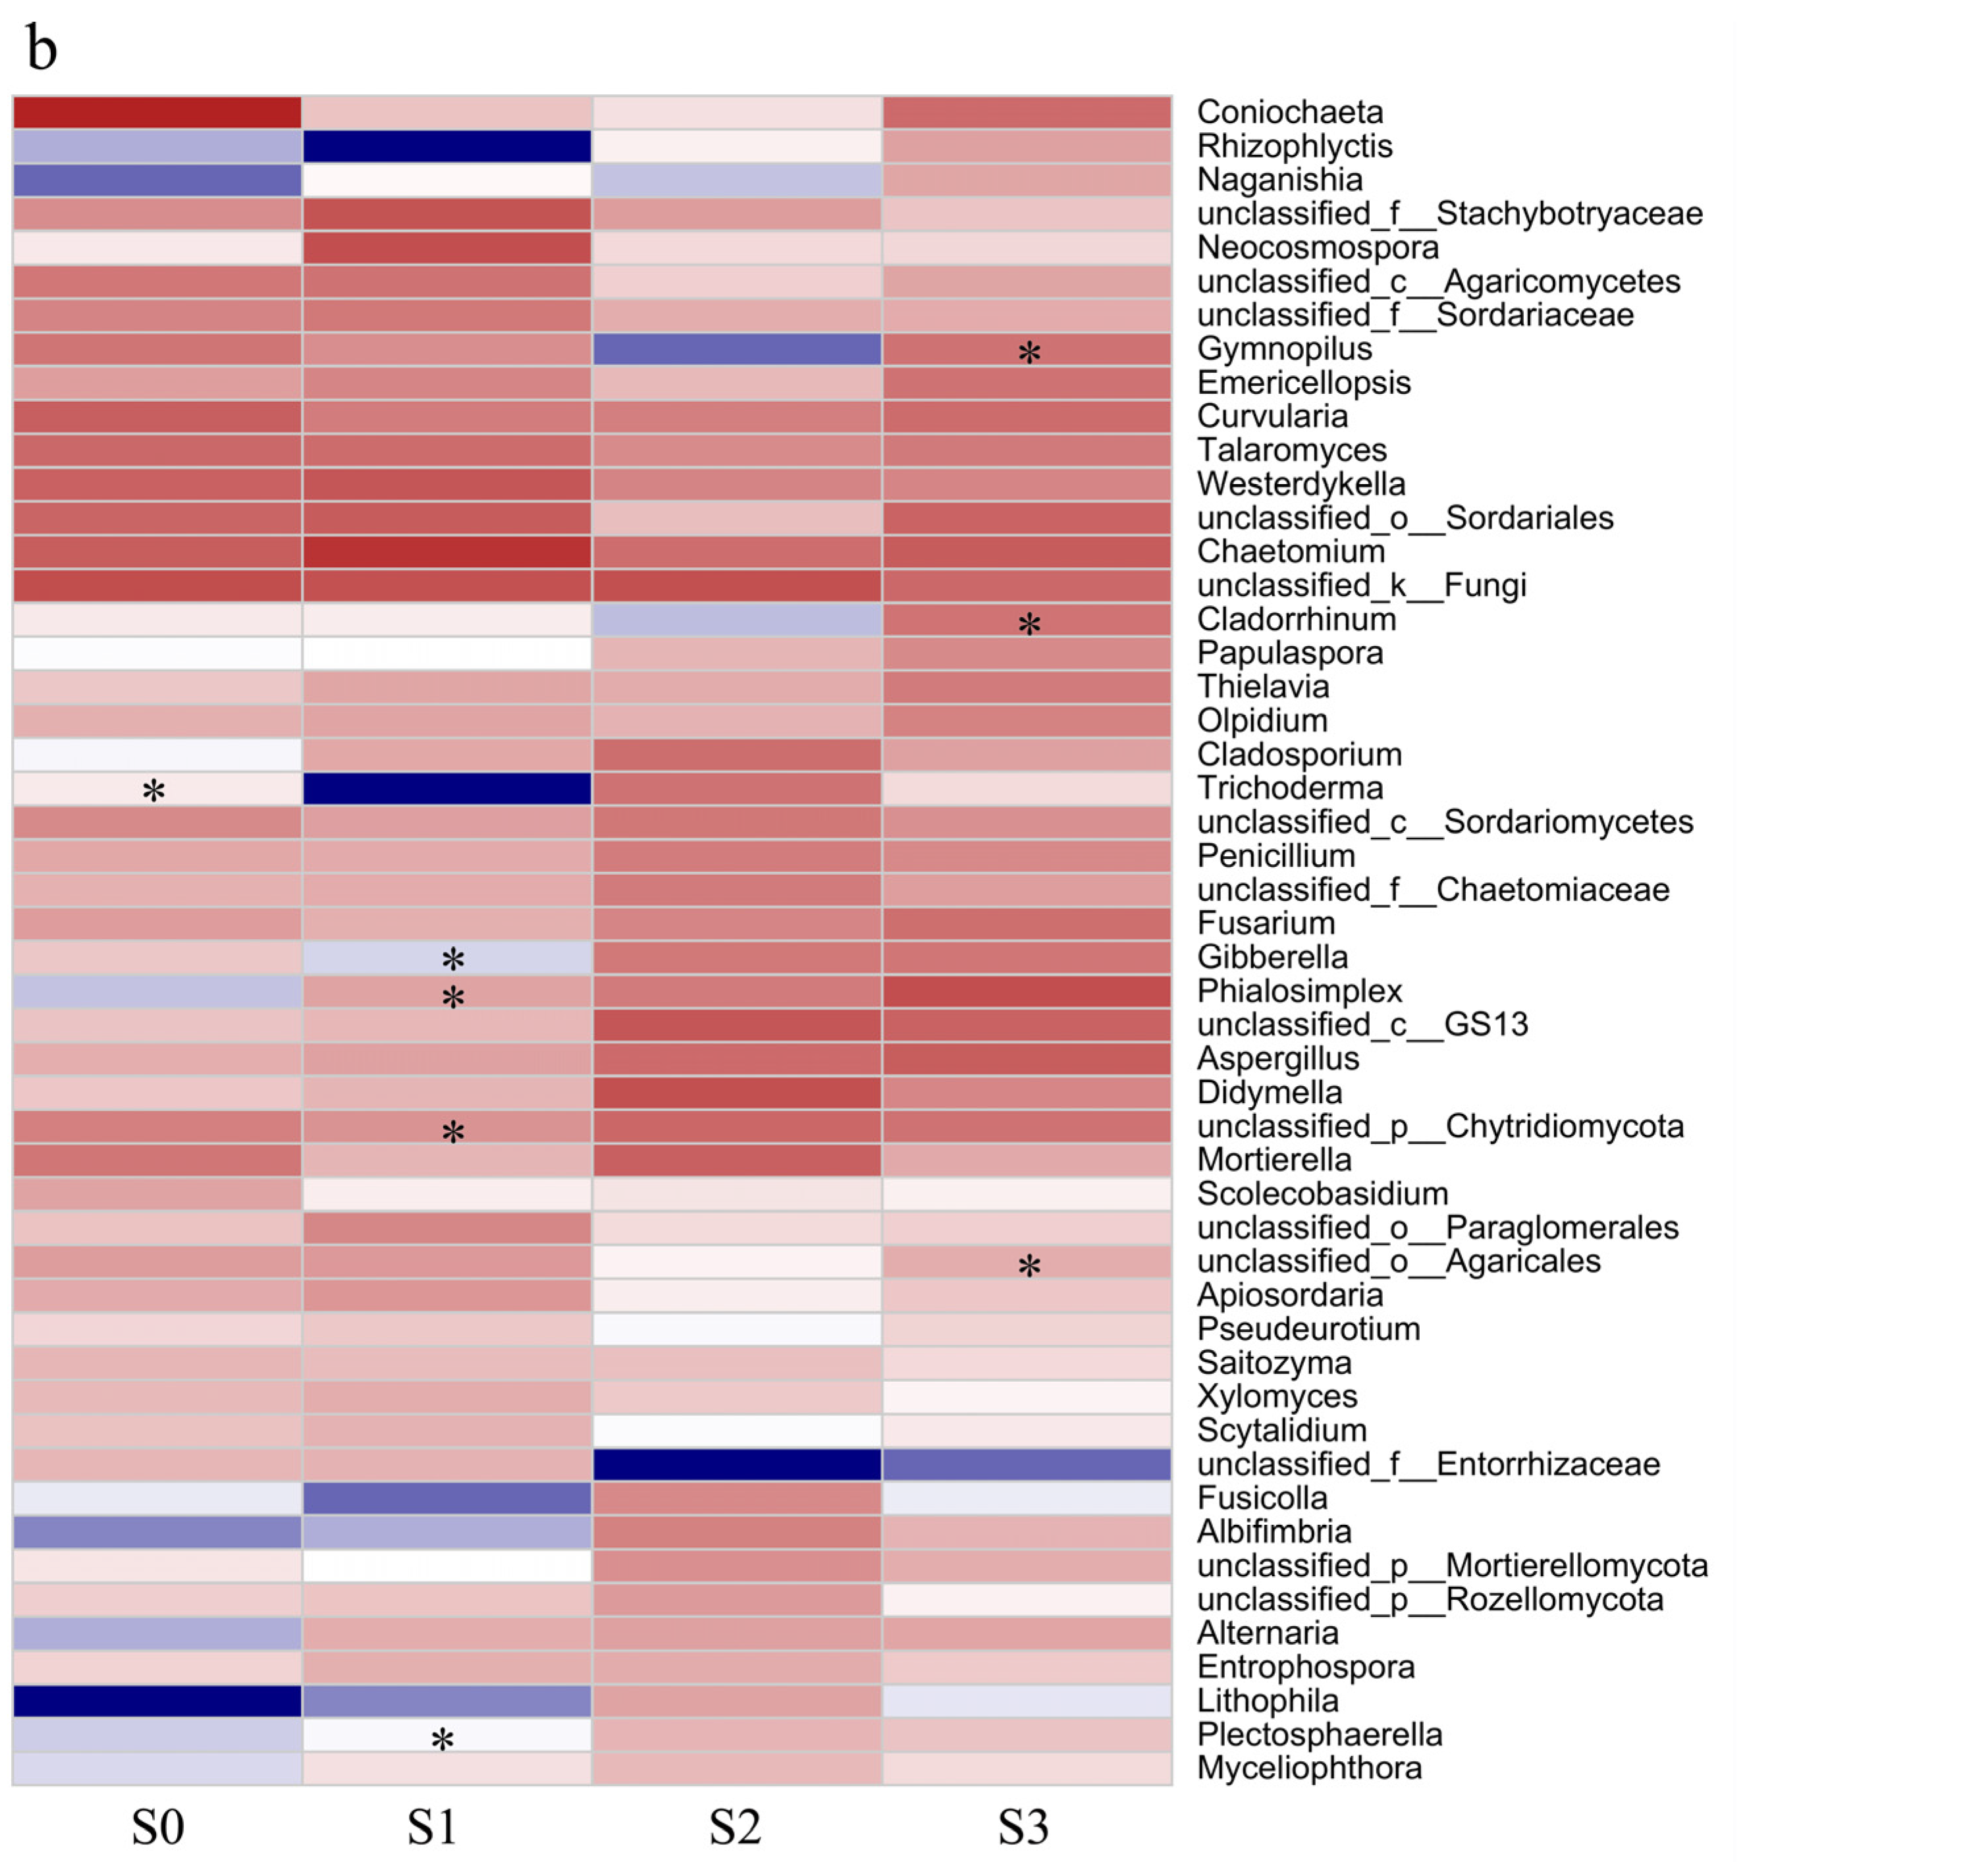
2.8. Effects of Phosphite on Soil Microorganisms

Since Phi is not a commonly used fertilizer in agricultural fields, its potential detrimental effects on farmland soil remain uncertain, especially when applied in large quantities. We conducted a soil microbial metagenomic sequencing study in fields treated with Phi to gain insights into its effects. We selected plots from weed competition experiments that received either 0 g·m−2 or 60 g·m−2 of Phi. Soil samples were collected from five centimeters below the surface using the five-point sampling method, with 10 g of soil taken from each point and mixed to create a composite sample for each plot. Sampling was carried out seven days and sixty days after Phi was applied. The samples were then sent to MajorBio (Shanghai, China) for metagenomic sequencing.

3. Results

3.1. The Stable Inheritance of the ptxD Gene in Transgenic Offsprings

The PCR experiments yielded consistent amplification sizes for the ptxD gene across the T2, T3, and T4 generations of the L1-2 transgenic line (Figure 1a). The sequencing analysis confirmed that the ptxD gene was the amplified product, indicating its successful integration into the genomes of these generations. The quantitative real-time PCR results did not demonstrate significant differences in the expression levels of the ptxD gene in the roots and leaves among the T2, T3, and T4 generations of the L1-2 transgenic line (Figure 1b). Additionally, the Southern blot analysis revealed consistent banding patterns for the ptxD gene in the genomes of the T2, T3, and T4 generations of the L1-2 transgenic line (Figure 1c), suggesting that the ptxD gene’s integration site remains stable across generations. Collectively, these findings provide evidence for the ptxD gene’s stable inheritance in the L1-2 transgenic line.

3.2. ptxD-Expressing Rapeseed Can Utilize Phi as an Exclusive Source of Phosphorus

We performed sand culture experiments on the T4 of the L1-2 line and WT plants to examine the capacity of ptxD-expressing rapeseed plants to utilize Phi as the sole source of P. Both the WT and the ptxD-expressing plants grew equally well when the plants were fertilized with Pi (Figure 2a). However, when Phi was the sole source of P in the Knop solution, the ptxD-expressing plants had similar growth to that observed with Pi, while the WT plants were short and yellowish (Figure 2b). There was an approximately seven-fold reduction in the total biomass of the WT plants (Table S3).

3.3. Phi Accumulates in Non-Transgenic WT Rapeseed Plants

The ptxD-expressing L1-2 plants and non-transgenic WT plants were cultured in Knop solution with Pi, Knop solution with Phi, and Knop solution without P and subsequently crushed, and 0.1 g of each sample was used to detect the total phosphorus content. The results indicate that there was no significant difference in the total phosphorus content between the transgenic plants and WT plants in the Knop solution with Pi and the Knop solution without P. Conversely, the WT plants exhibited a notably elevated total phosphorus content compared to that of the transgenic plants in the Knop solution with Phi (Figure 3 and Table S4). Because the structure of Phi is similar to that of Pi, it can easily enter plant cells through phosphorus ion channels [2]. Since there was no Pi in the solution, the WT plants absorbed a large amount of Phi, which they cannot use; thus, the WT plants always had phosphorus deficiency and continued to absorb Phi, leading to a higher total phosphorus content in these plants. Therefore, the accumulation of non-metabolizable Phi in plant tissues may cause deleterious effects [24]. Transgenic plants with the ptxD gene can convert Phi into Pi to enable the growth and development of plants. Therefore, the total phosphorus content in the transgenic plants with the ptxD gene was much lower than that in the WT plants.

3.4. Phi Effectively Suppresses Weeds in Rapeseed Fields

We conducted pot culture experiments to assess the inhibitory impact of Phi by transplanting three weeds that are commonly found in rapeseed fields, namely M. aquaticum, A. aequalis, and R. acetosa. We investigated the growth of the weeds four weeks after transplantation. M. aquaticum was very sensitive to Phi; its growth was inhibited when the concentration of Phi in the soil was 25 mg·kg−1, which manifested as slow growth, yellow leaves, and wilting. When the concentration of Phi reached 100 mg·kg of soil−1, M. aquaticum basically stopped growing and began to die. When the concentration reached 200 mg·kg of soil−1, M. aquaticum quickly began to wilt and almost died after four weeks (Figure 4a). The tolerance of R. acetosa to Phi was stronger than that of M. aquaticum; its growth was not significantly affected when the concentration of Phi in the soil was less than 50 mg·kg of soil−1. When the concentration reached 100 mg·kg of soil−1, R. acetosa grew slowly and began to wilt. When the concentration reached 200 mg·kg of soil−1, R. acetosa stopped growing, the leaves began to wilt, and most of them died after four weeks (Figure 4b). A. aequalis had the highest tolerance to Phi; it only showed slow growth and wilting leaf edges when the concentration was 200 mg·kg of soil−1 (Figure 4c). Figure 4d and Table S5 show the dry weights of three weeds under various Phi concentrations. It can be seen that the Phi concentration of 100 mg·kg of soil−1 significantly reduced the dry weights of M. aquaticum and R. acetosa, while A. aequalis was more tolerant to Phi, and its dry weight was only significantly reduced under the concentration of 200 mg·kg of soil−1.
Lawns containing a diverse array of naturally occurring weeds were also transplanted into 40 × 60 cm pots; the weed population in the pots without Phi exhibited dark green leaves and robust growth after four weeks (Figure 4e left). In contrast, the weed population treated with a Phi concentration of 200 mg·kg of soil−1 displayed yellowing leaves and a significant reduction in growth (Figure 4e right). These findings unequivocally highlight Phi’s potent inhibitory impact on weeds in rapeseed fields.

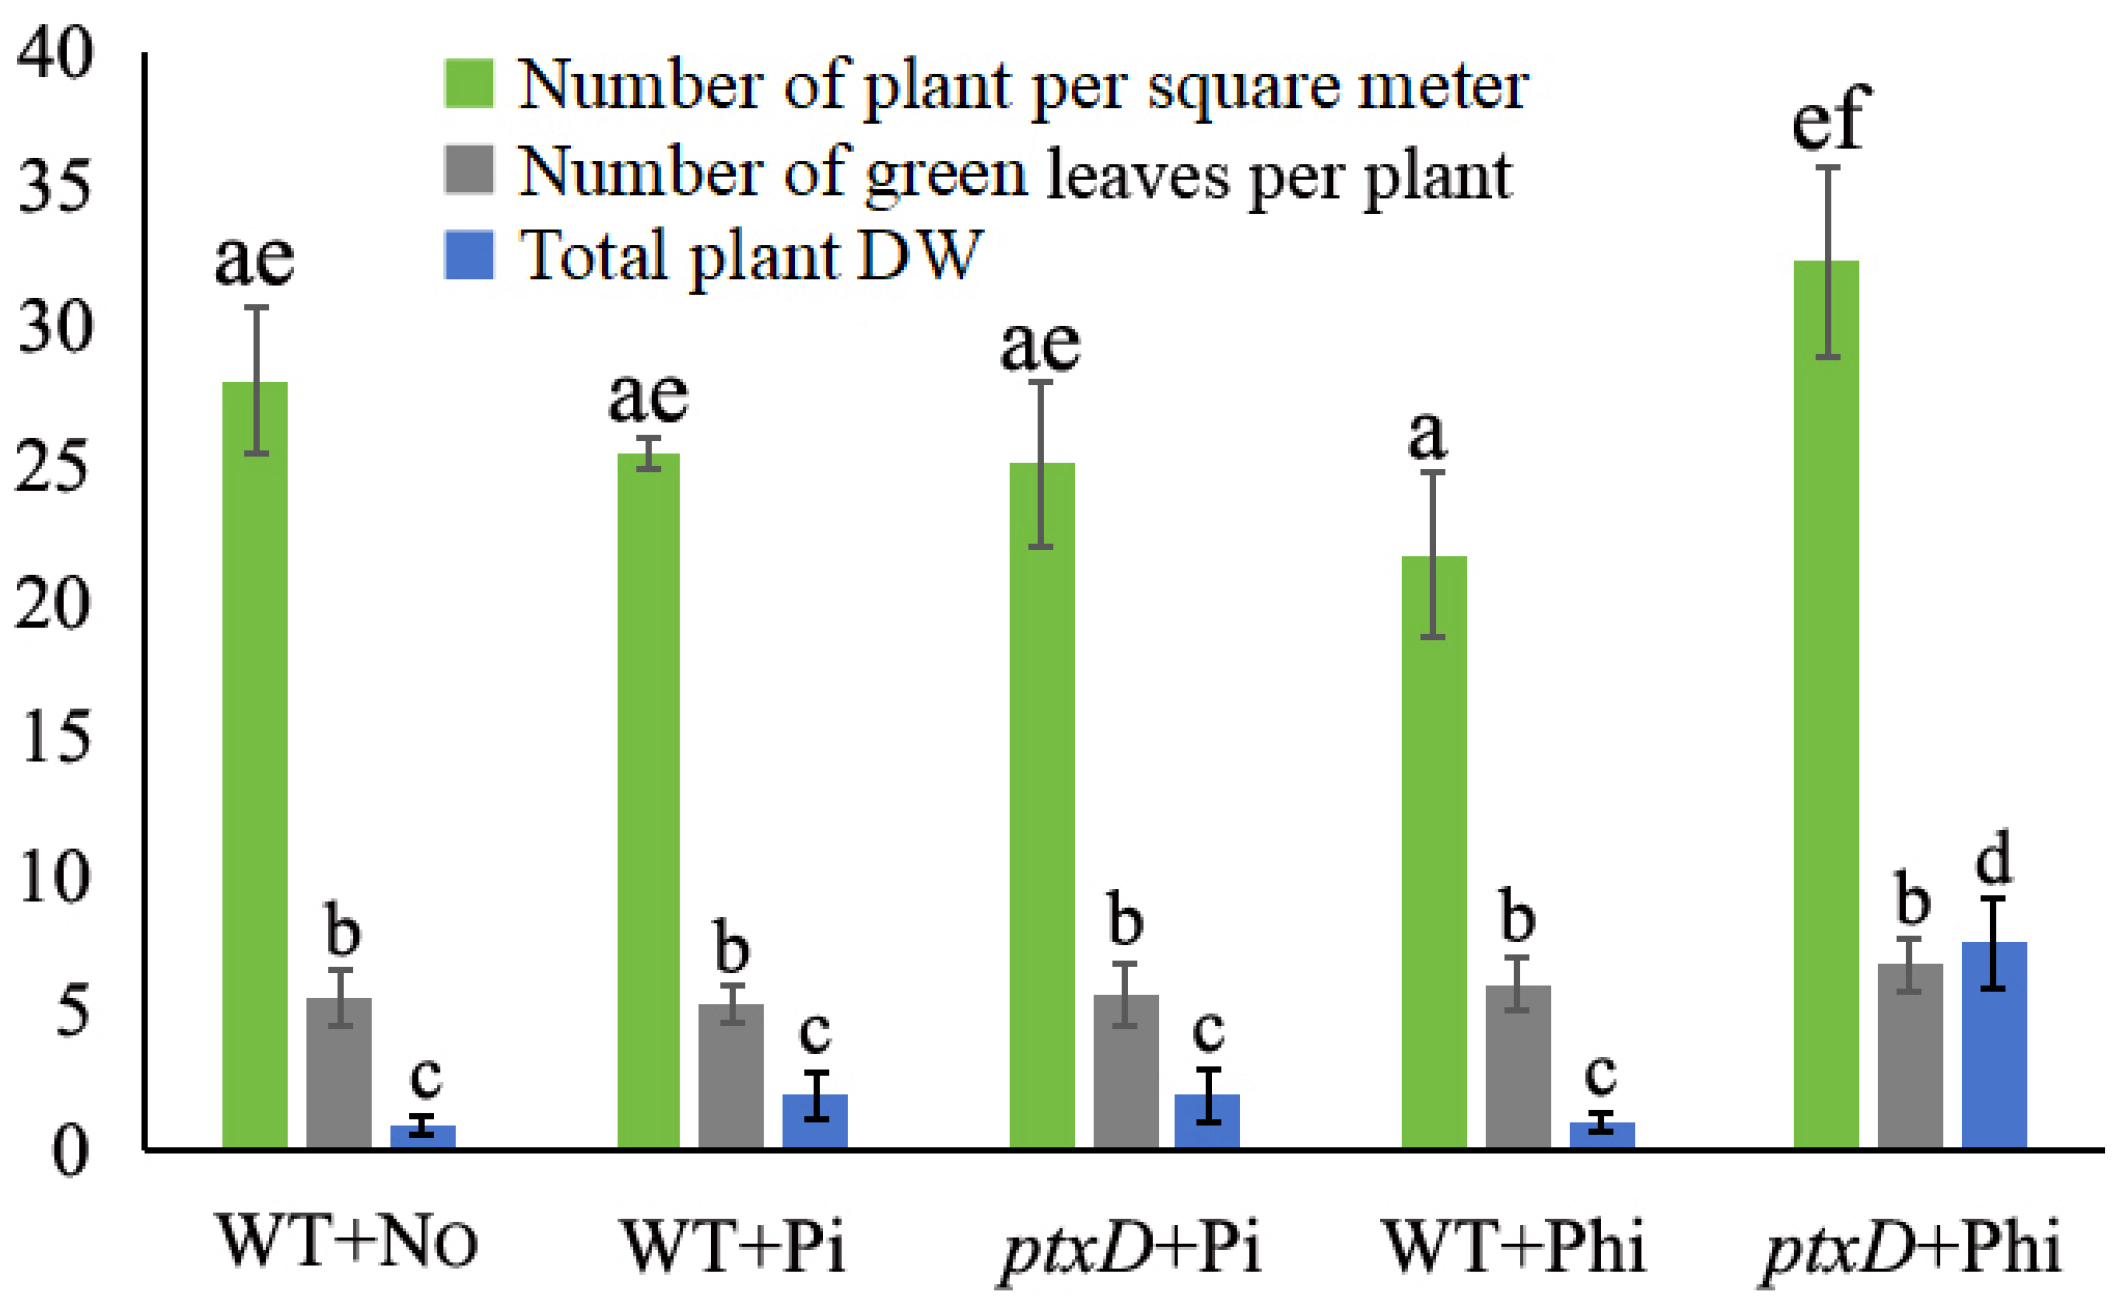
3.5. ptxD/Phi Is Highly Effective in Suppressing Weeds in Rapeseed Fields

The plots treated with 15 g·m−2 of P2O5 exhibited weed infestation in the competition experiment, with 25.3 WT rapeseed plants per square meter. These plants averaged 5.3 green leaves per plant and had an average dry weight of 1.94 g per plant (Figure 5a). There were 25.0 transgenic rapeseed plants per square meter under the same fertilization regime, averaging 5.6 green leaves per plant and an average dry weight of 1.97 g per plant (Figure 5b). There were no significant differences between the transgenic and WT plants in terms of plant density, the number of green leaves per plant, and dry weight per plant under this fertilization treatment (Figure 6).
In the treatment with 60 g·m−2 of Phi, there were 32.3 transgenic plants per square meter, averaging 6.7 green leaves per plant and an average dry weight of 7.53 g per plant (Figure 5c). The transgenic plants grew luxuriantly, with their leaves covering the weeds and creating a strong shading effect that inhibited weed growth (Figure 5d). In contrast, there were 21.7 WT plants per square meter, averaging 6.0 green leaves per plant and an average dry weight of 0.96 g per plant (Figure 5e). Not only were the WT plants shorter and had red leaf edges in these plots, but the weeds also grew slowly and had yellower leaves than normal. There were significant differences between the transgenic and WT plants in terms of plant density, the number of green leaves per plant, and dry weight per plant under this fertilization regime (Figure 6 and Tables S6–S8).
In the plots without any phosphorus fertilizer, there were 28.0 WT plants per square meter, averaging 5.5 green leaves per plant and an average dry weight of 0.84 g per plant. Both the rapeseed and weeds exhibited poor growth due to the lack of phosphorus (Figure 5f).

3.6. The Application of Phi Does Not Have a Significant Impact on the Soil’s Microbial Environment

We collected soil samples from plots without Phi and plots with a Phi concentration of 60 g·m−2 for high-throughput metagenomic sequencing to investigate the impact of Phi on the soil’s microbial environment. The samples were taken from these plots seven days after the Phi application and labeled S0 and S1, respectively. More samples were taken from the same plots sixty days later and labeled S2 and S3. The results of the microbial Alpha diversity analysis did not show significant differences in the soil’s bacterial diversity indices, such as ACE, Chao, Sobs, Shannon, and Simpson, among the phi treatments (p > 0.05). However, there were significant differences in the soil’s Chao and Shannon fungal diversity indices seven days after the Phi application (S1) (p < 0.05), but these differences were not significant sixty days later (Table 1).
There was no statistically significant difference in bacterial and fungal phyla classification levels between the Phi-treated and untreated samples (p > 0.05) (Figure 7a,b). At the genus classification level, a small proportion of bacteria and fungi exhibited significant differences. Seven days after the Phi application (S1), the following six bacterial genera differed significantly from those of the non-Phi treatment (S0) (p < 0.05): FCPS473, norank_f_Vicinamibacteraceae, norank_f_norank_o_Frankiales, norank_f_norank_o_Vicinamibacterales, Terrabacter, and Bryobacter. Sixty days after the Phi application (S3), the following four bacterial genera differed significantly from those of the S2 treatment without Phi (p < 0.05) (Figure 8a): FCPS473, norank_f_67-14, norank_f_LWQ8, and Arthrobacter.
At the fungal genus classification level, the following five genera showed significant differences in the S1 treatment compared to the S0 treatment: Trichoderma, Gibberella, Phialosimplex, unclassified_p_Chytridiomycota, and Plectosphaerella. In contrast, only three fungal genera differed significantly in the S3 treatment compared to the S2 treatment (p < 0.05) (Figure 8b): Gymnopilus, Cladorrhimum, and unclassified_o_Agaricales.

4. Discussion

The dominant weeds in the rapeseed fields of Hunan Province are M. aquaticum, Veronica persica, Calium aparine, A. aequalis, Hemisteptia lyrata, Eleusine indica, Rorippa islandica, and R. acetosa [25]. However, M. aquaticum, A. aequalis, and R. acetosa stood out as the most dominant in our experimental field, comprising approximately 80% of the weed population. Favorable fertilizer, water, and climatic conditions in Hunan Province from early October to early December typically facilitate the proliferation of weeds, causing them to reach a winter germination peak. This peak marks the primary and dominant occurrence of weeds in rapeseed fields, accounting for about 80% of the weed population during the rapeseed’s entire growth cycle and posing a significant threat to the crop [26]. This period also notably coincides with the planting of rapeseed in the Yangtze River Basin, which is the primary rapeseed production area in China. The harm inflicted by weeds on rapeseed is primarily concentrated during the germination stage as weeds germinate rapidly and grow vigorously in the early stages, quickly gaining a competitive advantage over rapeseed seedlings. Failure to control these weeds during this critical period can result in significant damage to rapeseed production [27].
The commercial cultivation of herbicide-resistant rapeseed is not currently permitted in China [28]. The most effective method for weed control in rapeseed fields involves applying herbicides after sowing and before the emergence of seedlings. This method is highly effective, but it raises concerns about environmental pollution [10,11] and the development of weed resistance to herbicides [12,13]. Additionally, herbicides become ineffective if there is continuous rainfall after sowing. However, the emergence of the ptxD/Phi system has provided a new, efficient, and environmentally friendly approach to weed control in agriculture. New crop germplasms with a competitive advantage over weeds have been created in cotton, rice, and rapeseed using this system [17,18,20]. Our pot experiments have also demonstrated the effectiveness of the ptxD/Phi system in controlling weeds in rapeseed fields. The application of Phi at a concentration of 200 mg·kg−1 can effectively inhibit the growth of all weeds in rapeseed fields (Figure 4e) while ptxD-expressing rapeseed plants can grow normally.
P has a relatively weak migration ability in soil, and after fertilization, phosphorus mainly concentrates in the 0–20 cm soil layer [29]. We measured the soil density of the experimental fields to be 1.5 g·cm−3 (moisture content of 61.7%). Applying 60 g·m−2 of Phi to a 20 cm soil layer in the field can achieve a concentration of 200 mg·kg of soil−1. The field experiments showed that the ptxD-expressing rapeseed grew well and the weeds in the field were effectively controlled when 60 g·m−2 of Phi was applied (Figure 5c). Although the weeds still grew in the rapeseed field, they were stunted by the rapeseed’s strong shading effect, which prevented them from having adverse effects on the growth of the rapeseed (Figure 5d). The field trial results further confirmed the effectiveness of the ptxD/Phi system in controlling weeds in rapeseed fields.
Phi is not a commonly used phosphorus fertilizer, and there are concerns about whether its extensive application may lead to significant changes in soil microbial communities. Soil metagenomic sequencing showed that there were significant differences in 12.00% of bacterial species and 8.93% of fungal species at the genus level just seven days after Phi application compared to untreated soil. However, only 8.00% of bacteria and 5.36% of fungi showed significant differences after 60 days (Figure 8). Therefore, we believe that the application of 60 g·m−2 of Phi has a limited impact on soil microorganisms, but more field research is needed to support this conclusion.
In our pot experiments, the weeds were transplanted from the experimental fields to pots, and when treated with Phi, they were approximately 2–3 weeks old. The tolerance of weeds at this growth stage to Phi is certainly stronger than that of newly germinated weeds. However, in the field experiments, the weed seeds were exposed to Phi treatment from germination, so the concentration of Phi used in the fields can be lower than that in the pot experiments. In subsequent field experiments, we need to reduce the concentration of Phi, for example, by using a Phi concentration of 35 g·m−2, which contains a pure phosphorus content comparable to that of traditional phosphorus fertilizer application in Hunan Province (67.5 kg·ha−1 of pure phosphorus). We will then reassess whether this concentration of Phi can effectively control weeds in rapeseed fields. Additionally, more research is needed on the impact of applying unconventional phosphorus fertilizers such as Phi on rice growth.
In conclusion, the results of this study clearly demonstrate that the ptxD/Phi system can effectively suppress weeds in rapeseed fields, which can help address many agricultural production and environmental issues. This technology has great application prospects in agriculture.

Supplementary Materials

The following supporting information can be downloaded at https://www.mdpi.com/article/10.3390/agronomy14040727/s1, Table S1: Composition of Knop solution; Table S2: N, P, and K contents of soil; Table S3: Dry height of plant in sand culture experiments; Table S4: Total phosphorus content in plants; Table S5: Dry weight of weed in pot culture experiments; Table S6: Number of plants in different Phi applications; Table S7: Number of green leaves per plant in different Phi applications; Table S8: Dry height of plants in fields with different Phi applications.

Author Contributions

All authors contributed to the article conception and design. G.X. and Z.Z. conceived and designed the experiments; D.X. and W.L. performed the material collection, investigation, and experiments; T.X. analyzed the data and wrote the manuscript; J.Z. contributed to the review and editing; D.X. performed the review, supervision, editing, conceptualization, investigation, and project management and was responsible for financial support. All authors have read and agreed to the published version of the manuscript.

Funding

This work was supported by the National Key Research and Development Program of China (2022YFD2300103 and 2023YFD1201400), a Science and Technology Project of Hunan Province (2021NK1004), and a Scientific Research Project of Hunan Provincial Department of Education (22A0167).

Data Availability Statement

All datasets supporting the conclusions of this article are included within the article. If not included in the manuscript, they are available from the corresponding author upon reasonable request.

Acknowledgments

We want to thank all the teachers and students who helped us during the trial and significantly contributed.

Conflicts of Interest

The authors declare no conflicts of interest.

References

  1. Varadarajan, D.K.; Karthikeyan, A.S.; Matilda, P.D.; Raghothama, K.G. Phosphite, an Analog of Phosphate, Suppresses the Coordinated Expression of Genes under Phosphate Starvation. Plant Physiol. 2002, 129, 1232–1240. [Google Scholar] [CrossRef] [PubMed]
  2. López-Arredondo, D.L.; Herrera-Estrella, L. Engineering phosphorus metabolism in plants to produce a dual fertilization and weed control system. Nat. Biotechnol. 2012, 30, 889–893. [Google Scholar] [CrossRef] [PubMed]
  3. White, P.J.; Hammond, J.P. The Ecophysiology of Plant-Phosphorus Interactions; Springer: Dordrecht, The Netherlands, 2008; pp. 13–19. [Google Scholar]
  4. Nguyen, T.D.; Cavagnaro, T.R.; Watts-Williams, S.J. The effects of soil phosphorus and zinc availability on plant responses to mycorrhizal fungi: A physiological and molecular assessment. Sci. Rep. 2019, 9, 14880. [Google Scholar] [CrossRef] [PubMed]
  5. Lizcano-Toledo, R.; Reyes-Martín, M.P.; Celi, L.; Fernández-Ondoño, E. Phosphorus dynamics in the soil–plant–environment relationship in cropping systems: A review. Appl. Sci. 2021, 11, 11133. [Google Scholar] [CrossRef]
  6. Vance, C.P.; Uhde-Stone, C.; Allan, D.L. Phosphorus acquisition and use: Critical adaptations by plants for securing a nonrenewable resource. New Phytol. 2003, 157, 423–447. [Google Scholar] [CrossRef] [PubMed]
  7. Adeux, G.; Vieren, E.; Carlesi, S.; Bàrberi, P.; Munier-Jolain, N.; Cordeau, S. Mitigating crop yield losses through weed diversity. Nat. Sustain. 2019, 2, 1018–1026. [Google Scholar] [CrossRef]
  8. Wang, L.; Liu, Q.; Dong, X.; Liu, Y.; Lu, J. Herbicide and nitrogen rate effects on weed suppression, N uptake, use efficiency and yield in winter oilseed rape (Brassica napus L.). Glob. Ecol. Conserv. 2019, 17, e00529. [Google Scholar] [CrossRef]
  9. Perthame, L.; Colbach, N.; Brunel-Muguet, S.; Busset, H.; Lilley, J.M.; Matejicek, A.; Moreau, D. Quantifying the nitrogen demand of individual plants in heterogeneous canopies: A case study with crop and weed species. Eur. J. Agron. 2020, 119, 126102. [Google Scholar] [CrossRef]
  10. Gianessi, L.P. The increasing importance of herbicides in worldwide crop production. Pest Manag. Sci. 2013, 69, 1099–1105. [Google Scholar] [CrossRef] [PubMed]
  11. Parra-Arroyo, L.; González-González, R.B.; Castillo-Zacarías, C.; Martínez, E.M.M.; Sosa-Hernández, J.E.; Bilal, M.; Parra-Saldívar, R. Highly hazardous pesticides and related pollutants: Toxicological, regulatory, and analytical aspects. Sci. Total Environ. 2022, 807, 151879. [Google Scholar] [CrossRef] [PubMed]
  12. Dillon, A.; Varanasi, V.K.; Danilova, T.V.; Koo, D.-H.; Nakka, S.; Peterson, D.E.; Tranel, P.J.; Friebe, B.; Gill, B.S.; Jugulam, M. Physical mapping of amplified copies of the 5-enolpyruvylshikimate-3-phosphate synthase gene in glyphosate-resistant Amaranthus tuberculatus. Plant Physiol. 2017, 173, 1226–1234. [Google Scholar] [CrossRef]
  13. Ofosu, R.; Agyemang, E.D.; Márton, A.; Pásztor, G.; Taller, J.; Kazinczi, G. Herbicide resistance: Managing weeds in a changing world. Agronomy 2023, 13, 1595. [Google Scholar] [CrossRef]
  14. Price, A.J.; Balkcom, K.; Culpepper, S.; Kelton, J.; Nichols, R.; Schomberg, H. Glyphosate-resistant Palmer amaranth: A threat to conservation tillage. J. Soil Water Conserv. 2011, 66, 265–275. [Google Scholar] [CrossRef]
  15. Costas, A.M.G.; White, A.K.; Metcalf, W.W. Purification and Characterization of a Novel Phosphorus-oxidizing Enzyme from Pseudomonas stutzeri WM88*210. J. Biol. Chem. 2001, 276, 17429–17436. [Google Scholar] [CrossRef]
  16. López-Arredondo, D.L.; Herrera-Estrella, L. A novel dominant selectable system for the selection of transgenic plants under in vitro and greenhouse conditions based on phosphite metabolism. Plant Biotechnol. J. 2013, 11, 516–525. [Google Scholar] [CrossRef]
  17. Manna, M.; Achary, V.M.M.; Islam, T.; Agrawal, P.K.; Reddy, M.K. The development of a phosphite-mediated fertilization and weed control system for rice. Sci. Rep. 2016, 6, 24941. [Google Scholar] [CrossRef] [PubMed]
  18. Pandeya, D.; López-Arredondo, D.L.; Janga, M.R.; Campbell, L.M.; Estrella-Hernández, P.; Bagavathiannan, M.V.; Herrera-Estrella, L.; Rathore, K.S. Selective fertilization with phosphite allows unhindered growth of cotton plants expressing the ptxD gene while suppressing weeds. Proc. Natl. Acad. Sci. USA 2018, 115, E6946–E6955. [Google Scholar] [CrossRef] [PubMed]
  19. Changko, S.; Rajakumar, P.D.; Young, R.E.; Purton, S. The phosphite oxidoreductase gene, ptxD as a bio-contained chloroplast marker and crop-protection tool for algal biotechnology using Chlamydomonas. Appl. Microbiol. Biotechnol. 2020, 104, 675–686. [Google Scholar] [CrossRef]
  20. Xiong, T. Studies on Transformation of Phosphite Dehydrogenase Gene ptxD in Brassica napus. Master’s Thesis, Hunan Agricultural University, Changsha, China, 2020. [Google Scholar]
  21. Parkhi, V.; Kumar, V.; Campbell, L.M.; Bell, A.A.; Shah, J.; Rathore, K.S. Resistance against various fungal pathogens and reniform nematode in transgenic cotton plants expressing Arabidopsis NPR1. Transgenic Res. 2010, 19, 959–975. [Google Scholar] [CrossRef] [PubMed]
  22. Holman, W.I.M. A new technique for the determination of phosphorus by the molybdenum blue method. Biochem. J. 1943, 37, 256–259. [Google Scholar] [CrossRef] [PubMed]
  23. Sui, N.; Zhou, Z.; Yu, C.; Liu, R.; Yang, C.; Zhang, F.; Song, G.; Meng, Y. Yield and potassium use efficiency of cotton with wheat straw incorporation and potassium fertilization on soils with various conditions in the wheat-cotton rotation system. Field Crops Res. 2015, 172, 132–144. [Google Scholar] [CrossRef]
  24. Loera-Quezada, M.M.; Leyva-González, M.A.; López-Arredondo, D.; Herrera-Estrella, L. Phosphite cannot be used as a phosphorus source but is non-toxic for microalgae. Plant Sci. 2014, 231, 124–130. [Google Scholar] [CrossRef] [PubMed]
  25. Wang, G.H.; Guan, C.Y.; Chen, S.Y. Research on the occurrence patterns and control of main weeds in no till live broadcast rapeseed fields. Hunan Agric. Sci. 2011, Z1, 37–38. [Google Scholar]
  26. Lu, J.X.; Chen, S.Y.; Guan, C.Y.; Liu, Z.S.; Xiao, G. Occurrence regularity of weeds and Its control techniques in winter rape fields of the middle and lower reaches of the Yangtze river. Crop Res. 2012, 26, 639–642. [Google Scholar]
  27. Chu, Q.Y.; Yu, L.S.; Xiao, M.K.; Wang, Q.; Zhu, Z.S. Occurrence pattern of weeds in rapeseed fields and chemical control techniques. J. Anhui Agric. Sci. 2006, 34, 4066–4067. [Google Scholar]
  28. Hu, M.; Pu, H.; Kong, L.; Gao, J.; Long, W.; Chen, S.; Zhang, J.; Qi, C. Molecular characterization and detection of a spontaneous mutation conferring imidazolinone resistance in rapeseed and its application in hybrid rapeseed production. Mol. Breed. 2015, 35, 46. [Google Scholar] [CrossRef]
  29. Lu, A.X.; Zhao, Y.L.; Wang, J.H. Distribution characteristics of nitrogen and phosphorus in agricultural soil profiles under different landuse. Ecol. Sin. 2007, 27, 3920–3929. [Google Scholar]
Figure 1. Analysis of genetic stability of ptxD-expressing rapeseed. (a) PCR results of ptxD gene in T2, T3, and T4 of L1-2 line. (b) Expression of ptxD gene in leaves and roots of T2, T3, and T4 of transgenic rapeseed L1-2 line. Data are shown as mean values ± SDs (n = 3); lowercase letters indicate values that are significantly different at p ≤ 0.05. (c) Southern blot analysis for T2, T3, and T4 transgenic rapeseed of L1-2 lines. P lane: Linearized binary vector (pCAMBIA1303 + ptxD, 13 kb in size) mixed with genomic DNA extracted from Xiangyou 18. N lane: Genomic DNA from Xiangyou 18. Membrane was hybridized with digoxigenin-labeled ptxD gene.
Agronomy 14 00727 g001
Figure 2. Sand culture study to assess effect of Pi or Phi fertilizer regimen on growth of rapeseed plants. (a) ptxD-expressing plants (left) and WT plants (right) with 200 mg·kg−1 of Pi. (b) ptxD-expressing plants (back) and WT plants (front) with 200 mg·kg−1 of Phi.
Agronomy 14 00727 g002
Figure 3. Total phosphorus content in plants. Phi: plants grown in Knop solution with Phi; Pi: plants grown in Knop solution with Pi; P-free: plants grown in Knop solution without P. Data are shown as mean values ± SDs (n = 3); lowercase letters indicate values that are significantly different at p ≤ 0.05.
Agronomy 14 00727 g003
Figure 4. The inhibitory effect of Phi on weeds in rapeseed fields. (ac) The inhibitory effects of different concentrations of Phi on M. aquaticum, A. aequalis, and R. acetosa weeds. (d) The dry weights (DWs) of weeds treated with different concentrations of Phi. The data are shown as mean values ± SDs (n = 3); the lowercase letters indicate values that are significantly different at p ≤ 0.05. (e) The inhibitory effects of Phi on weed populations in a rapeseed field. The untreated control (left); the weeds treated with a Phi concentration of 200 mg·kg of soil−1 (right).
Agronomy 14 00727 g004
Figure 5. Competitive experiments between ptxD-expressing rapeseed and weeds in field. (a) WT in field with 15 g·m−2 of P2O5. (b) Transgenic plants in field with 15 g·m−2 of P2O5. (c) Transgenic plants in field with 60 g·m−2 of Phi. (d) Transgenic plants and weeds in field with 60 g·m−2 of Phi. Because of shading effects, ptxD-expressing rapeseed plants effectively hindered weed growth in field. (e) WT in field with 60 g·m−2 of Phi. (f) WT in field without any phosphorus fertilizer.
Agronomy 14 00727 g005
Figure 6. The field survey data for the competition experiment. WT+No: WT plants that grew in the field without any phosphorus fertilizer. WT+Pi: WT plants that grew in the field with 15 g·m−2 of P2O5. ptxD+Pi: ptxD-expressing plants that grew in the field with 60 g·m−2 of Phi. WT+Phi: WT plants that grew in the field with 60 g·m−2 of Phi. ptxD+Pi: ptxD-expressing plants that grew in the field with 15 g·m−2 of P2O5. The number of plants per square meter is shown as the mean value ± SD (n = 3). The number of green leaves per plant and the total plant DW are shown as mean values ± SDs (n = 20). The lowercase letters indicate values that are significantly different at p ≤ 0.05.
Agronomy 14 00727 g006
Figure 7. Phyla-level species composition and relative abundance. (a) Bacteria; (b) fungi. S0: No Phi application; samples taken after seven days. S1: Application of 60 g·m−2 of Phi; samples taken after seven days. S2: No Phi application; samples taken after sixty days. S3: Application of 60 g·m−2 of Phi; samples taken after sixty days.
Agronomy 14 00727 g007
Figure 8. Community heatmap of soil microorganisms at genus level. (a) Bacteria; (b) fungi. S0: No Phi application; samples taken after seven days. S1: Application of 60 g·m−2 of Phi; samples taken after seven days. S2: No Phi application; samples taken after sixty days. S3: Application of 60 g·m−2 of Phi; samples taken after sixty days. Asterisks indicate values that are significantly different at p < 0.05.
Agronomy 14 00727 g008aAgronomy 14 00727 g008b
Table 1. The alpha diversity indicators of the soil’s microbial community.
GroupACEChaoSobsShannonCoverageSimpson
S0-G3027.623 ± 158.455 a2898.133 ± 130.398 a2537.333 ± 172.468 a6.002 ± 0.270 a0.980 ± 0.002 a0.0193 ± 0.006 a
S1-G2804.977 ± 83.162 a2701.364 ± 112.107 a2452.667 ± 27.501 a5.775 ± 0.115 a0.980 ± 0.001 a0.0190 ± 0.002 a
S2-G2899.503 ± 195.424 a2694.368 ± 166.002 a2375.000 ± 158.300 a5.820 ± 0.221 a0.981 ± 0.002 a0.0195 ± 0.004 a
S3-G2795.756 ± 90.496 a2799.957 ± 81.468 a2540.667 ± 117.194 a5.953 ± 0.175 a0.981 ± 0.001 a0.0197 ± 0.008 a
S0-F495.032 ± 130.266 a516.870 ± 136.257 a588.333 ± 122.083 a4.152 ± 0.258 a0.997 ± 0.001 a0.017 ± 0.009 a
S1-F448.733 ± 14.431 a353.795 ± 9.783 b517.667 ± 10.066 a3.487 ± 0.123 b0.998 ± 0.000 a0.014 ± 0.008 a
S2-F491.875 ± 51.733 a494.438 ± 49.539 a551.333 ± 57.813 a3.994 ± 0.074 a0.998 ± 0.001 a0.017 ± 0.008 a
S3-F435.564 ± 82.577 a443.067 ± 77.106 a506.333 ± 79.475 a3.891 ± 0.071 a0.998 ± 0.000 a0.018 ± 0.005 a
G represents bacterial samples, and F represents fungal samples. The lowercase letters indicate values that are significantly different at p ≤ 0.05.
Disclaimer/Publisher’s Note: The statements, opinions and data contained in all publications are solely those of the individual author(s) and contributor(s) and not of MDPI and/or the editor(s). MDPI and/or the editor(s) disclaim responsibility for any injury to people or property resulting from any ideas, methods, instructions or products referred to in the content.

