Abstract
It is desirable to recycle sewage sludge as fertilizer for agricultural fields. The application of sludge to agricultural soils is a measure that replaces chemical fertilizers and plays an important role in improving soil’s physicochemical and biological properties. However, there are concerns that the pollutants in sewage sludge will cause negative impacts on soil health. To closely monitor the soil–sludge interactions, a field study was conducted over a 20-year period in the North China Plain. In this study, the long-term effects of sewage sludge on the soil properties and soil microbial diversity were investigated. We examined the effects of various fertilization methods (control, chemical fertilizer, uncomposted sludge fertilizer, composted sludge fertilizer) on wheat production and several soil health indicators, such as the soil’s enzymatic activities, microbial biomass, microbial diversity, and crop yield. This long-term experiment supports that the composted sludge fertilizer increased crop production by 124.2% compared to the control treatment. The soil’s biological quality (e.g., the concentration of soil microbial biomass carbon) was also improved under the composted sludge fertilizer treatment. The concentrations of soil microbial biomass carbon under the uncomposted sludge fertilizer and composted sludge fertilizer treatments were 560.07 mg/kg and 551.07 mg/kg, respectively. The effect of the composted sludge fertilizer was greater than that of the uncomposted sludge fertilizer. The content of heavy metals did not exceed the national standard. The highest soil health index was 0.79 with the composted sludge fertilizer. Therefore, these results suggest that the application of composted sludge fertilizer has the potential to enhance long-term soil health and promote sustainable agricultural practices.
1. Introduction
Sustainable management of sewage sludge is a challenge to the world. With a high content of organic material and essential nutrients, sewage sludge has been viewed as a cost-effective option for improving soil quality [1,2]. Its high concentration of organic matter and nutrients makes it logical to utilize sewage sludge as a fertilizer [3]. Due to concerns about heavy metal contamination in soils, the use of sewage sludge as an amendment has been greatly restricted. However, by following national standards for agricultural use and controlling the total amount of heavy metals in sewage sludge, the accumulation of heavy metals can be avoided. Therefore, a long-term study was conducted in the North China Plain to observe the effects of sewage sludge’s application on the soil’s microbial community composition and soil health, under the condition that the total amount of heavy metals in the sewage sludge complies with the agricultural standards.
There has been a significant rise in worldwide attention towards soil health over the last ten years, leading to various efforts from government, non-government, and private sector organizations to create protocols for monitoring and evaluating its condition [4]. The majority of soil health studies focus on measuring changes in various soil health indicators in order to determine the effectiveness of a particular management practice. Chang et al. [5] evaluated the soil health in experiments in northeast Mississippi. Lu et al. [6] assessed the effect of various cropland soil and irrigation types on the soil health in a loess plateau. Si et al. [7] examined the variations in soil health resulting from 23 years of inorganic chemical fertilization compared to organic pig manure fertilization. However, there are few studies on the effects of sludge composting on soil health. Therefore, this study investigated and analyzed the soil health under long-term sewage sludge fertilization.
Identifying or selecting soil health indicators that are responsive to agronomic changes is crucial for quickly assessing the status of soil health [8]. Many indicators of soil health measure the response variables of nutrient cycling, particularly carbon and nitrogen dynamics, and are interconnected. For instance, the documented relationship among soil pH, nutrient cycling, conductivity, and infiltration highlights their interdependency. Moreover, properties of soil microbiology like microbial biomass and enzyme activities are reliable indicators of soil health and can forecast soil health trends in the short and long term [9]. Nonetheless, microbial indicators have received less attention and are seldom utilized in various fertilization investigations due to the high costs associated with assessing the biological characteristics of significant sample sizes [10]. Thus, our research delved into how the introduction of sewage sludge impacts the soil’s bacterial diversity in the North China Plain through the utilization of a 16S rRNA amplicon sequencing technique.
The use of the minimum and total data set (MDS and TDS) methods is prevalent in soil health assessment [6]. Principal component analysis (PCA) is an effective technique for reducing the dimensionality of the evaluation data set. Some studies have utilized this method to determine the weight of the soil indicators [11]. However, in some cases, the PCA method may only select a few soil indicators, leaving out other important soil indicators that are closely linked to the soil’s physicochemical and biological properties. This omission of key soil physical and biochemical characteristics could potentially reduce the sensitivity of the soil health index (SHI), leading to inaccurate results [7]. Therefore, a data set containing physical, chemical, and biological characteristics is established to reveal the influence of sewage sludge fertilization on soil health.
In this study, soil samples were collected in northeast China that had been subjected to 20-year fertilization regimes with composted sludge fertilizer (WD), uncomposted sludge fertilizer (WS), and chemical fertilizer (CF). The aim of this study was to assess the effect of different long-term fertilization schemes on the soil’s microbial properties and soil health. This study is based on the effects of long-term input of sewage sludge into the soil in the North China Plain on soil health and the soil’s bacterial diversity. To test these hypotheses, compost was produced through the application of sludge fertilizer and then compared to the treatment of uncomposted sludge fertilizer. Four various fertilizer treatments were utilized to assess the soil microbial biomass carbon, nitrogen, and phosphorus, the soil’s enzyme activities, the heavy metals in soil, the bacteria community structure, and their abundance in soil. Moreover, a soil health index was calculated to determine an efficient fertilization management strategy.
2. Materials and Methods
2.1. Site Descriptions and Experimental Design
The field experiment took place at Quzhou Experimental Station (36°52′ N, 115°01′ E altitude: 39 m), China Agricultural University, located in Handan City, Hebei Province, within the North China Plain. The average annual precipitation and temperature were 604 mm and 13.1 °C, respectively. The soil type was classified as moist soil according to Soil Taxonomy. The percentages of clay and silt in this soil are 18.3% and 73.2%, respectively. The study replicated the common practice of cultivating winter wheat followed by summer maize, a prevalent method in the North China Plain. Crop residue was uniformly crushed and incorporated into the soil to a depth of 20 cm using rotary tillage. The long-term fertilization experiment included 12 plots with four fertilization treatments, each with three replicates arranged in a randomized complete block design. The fertilization treatments include a control (CK) with no amendments added, a chemical fertilizer (CF) treatment, an uncomposted sludge fertilizer treatment (WS), and a composted sludge fertilizer treatment (WD). The chemical fertilizer was a mixture of 600 kg hm−2y−1 carbamide, 1125 kg hm−2y−1 calcium superphosphate, and 1125 kg hm−2y−1 ammonium bicarbonate. The uncomposted sludge fertilizer was 15,000 kg hm−2y−1. The composted sewage sludge fertilizer was 7500 kg hm−2y−1. The fertilizers were evenly spread across the soil surface manually and promptly mixed into the plowed soil (depth of 0–20 cm) through tillage.
2.2. Chemical Composition of the Sewage Sludge Compost
The basic physical and chemical properties of the sewage sludge compost are shown in Table 1. During the composting process, the compost was regularly turned over and ventilated. The composting time was 49 days.

Table 1.
The physical and chemical properties of sewage sludge compost.
2.3. Soil Sample Collection and Analysis of the Chemical Properties and Microbial Biomass
The soil samples were collected prior to fertilization in order to reduce the potential impact of recent fertilizer additions on the chemical and biological properties of the soil. Each plot had at least three cores (0–20 cm depth) combined into a single soil sample. These samples were divided into three segments for further analysis. The first part was sieved to 0.25 mm, the second part was sieved to 2 mm and stored at 4 °C, and the third part was sieved to 2 mm and stored at −80 °C. Assessment of the soil organic carbon (SOC) in the air-dried samples was conducted using the sulfuric acid–potassium dichromate oxidation method. The soil total nitrogen (TN) was measured using the Kjeldahl method, and the soil total phosphorus (TP) was measured using the HClO4-H2SO4 method [12]. The soil pH was determined in a 1:2.5 (soil:water) mixture by employing the potentiometric method. The chloroform fumigation–extraction method was used to determine the microbial biomass carbon and biomass nitrogen contents.
The soil microbial biomass carbon (SMBC), soil microbial biomass nitrogen (SMBN), and soil microbial biomass phosphorus (SMBP) were determined using the chloroform fumigation–incubation method and using a multi C/N 3100 (Analytik, Jena, Germany).
The soil dehydrogenase (DEH) activity was measured using the 2,3,5-triphenyltetrazole (TTC) reduction method. A total of 5 g of the soil sample was mixed with 15 mL of 2,3,5-TTC 0.5% (w/v) and 5 mL of Tris buffer (pH 7.6) and incubated in the dark at 37 °C for 24 h. The de-hydrogenase enzyme changes TTC to form 2, 3, 5-tribenzoylformamide (TPF). The TPF produced was then isolated using 100 mL of methanol, followed by filtration, and the absorbance was determined at 485 nm using a spectrophotometer.
The urease activity (URE) was determined as follows: a total of 5 g of medium was incubated with 10 mL of citrate–phosphate buffer (pH 6.7) and 5 mL of a 10% urea solution for 3 h at 38 °C. The activity of released NH4+ was then measured at 578 nm.
The alkaline phosphatase (ALP) activity was assessed by mixing 5 mL of 0.075 mM disodium phenyl phosphate with 5 g of the soil sample, along with 10 mL of borate buffer (pH 9.6), and incubating it at 37 °C for 3 h. The release of phenol was quantified by adding 5 g of phenyl phosphate and measuring the absorbance at 578 nm. The ALP activity was then calculated as the quantity of phenol released per gram of soil per hour.
The invertase activity (SAC) was determined using the following method. The soils were weighed at 1 g, followed by the addition of 5 mL of pH 5.5 phosphate buffers and 15 mL 8% sucrose. Incubation at 37 °C for a duration of 24 h ensued. The glucose released was quantitatively measured using a 508 nm spectrophotometer.
2.4. The Soil Bacterial Community Structure and Diversity Analysis
The 16S rRNA method was used to analyze the structure and diversity of the bacterial communities in the different soil samples fertilized for a long time. Soil DNA was isolated using the PowerSoil DNA Isolation Kit (MOBIO Laboratories Inc., Carlsbad, CA, USA) following the provided guidelines. The bacterial universal primers (16SrRNA gene V3–V4 region) GC-clip-338F and 806R were used to amplify the 16SrRNA gene via PCR using the extracted DNA as the template. Both the forward and reverse primers were tagged with adapter, insert, and linker sequences. Each sample was reverse-primed with a 12-mer barcode to combine multiple samples into a single MiSeq run. The PCR parameters consisted of an initial denaturation step at 94 °C for 5 min, followed by 30 cycles of denaturation at 94 °C for 30 s, annealing at 50 °C for 30 s, extension at 72 °C for 30 s, and a final extension step at 72 °C for 10 min. Quantitative DNA ligation was employed to purify and pool the PCR products at equimolar ratios to generate DNA libraries for subsequent adapter sequencing.
2.5. Real-Time Quantitative PCR (RT-qPCR) Analyses
The copy number of the bacterial 16S rRNA gene was quantified using the ABI 7500 Real-Time PCR detection system (Thermo Fisher Scientific, Waltham, MA, USA). The reaction mix (20 μL) was composed of Fast Fire qPCR Premix (SYBR Green) from Takara, China; 10 μM of each primer; ROX reference dye; and 1 mL of 1/10 diluted DNA. The bacterial detection utilized primers 338F and 806R, with the heating program consisting of 95 °C for 30 s, 95 °C for 5 s, 60 °C for 40 s, and 72 °C for 15 s for 40 cycles. The standards used to measure the 16S rRNA quantity were produced from clones with the appropriate insert. Plasmid DNA was prepared using a Miniprep kit from QIAGEN, Germantown, MD, USA. The standard curve had an R2 value exceeding 0.99. A total of four RT-qPCR reactions were carried out, with DNA extraction conducted on each soil sample.
2.6. Bioinformatic Analysis
Sequence analysis was performed using QIIME (version 1.9.1) software. In summary, the sequence reads related to the samples were isolated from the data obtained using the Illumina MiSeq instrument. Primes were eliminated, and the sequences were shortened to filter out poor-quality ones. The divergence in operational taxonomic unit (OTU) clusters was 0.03, and characteristic sequences for each feature were compiled by referring to files from the Ribosome Database Project, resulting in a bootstrap value of 80%. The calculation included diffusion curves and various diversity indices, like microbial community diversity, phylogenetic diversity (PD Faith), and coverage.
2.7. Soil Health Index
The soil health index, established on the conceptual framework, was calculated by combining the scores for each specific soil function and assigning the appropriate weights [10]. Initially, the essential soil parameters were identified to create a minimal data set (MDS). Utilizing principal component analysis (PCA), a PCA model was generated from all the soil parameters. Following this, the soil parameters in diverse units were transformed into dimensionless ratings through the use of standard rating functions.
The soil health index (SHI) was calculated according to the following equation:
where S is the value of the subscripted variable and W is the weighting factor of the PCA or as defined in the conceptual framework.
2.8. Statistical Analysis
The analysis of variance method was used to analyze the concentration differences in SMBC, SMBN, SMBP, URE, ALP, DEH, and SAC in the soil samples, and the SPSS method (SPSS, Chicago, IL, USA) and Tukey’s method were used as the processing comparison methods.
Principal component analysis was conducted on all the soil parameters included in the conceptual framework to determine the most sensitive variables. Data reduction and PCA extraction were carried out using SPSS 10.0. The analysis aimed to identify the key factors that captured the greatest variability in the data set.
3. Results
3.1. Soil Health Indicators
3.1.1. Soil Nutrient Indicators
Compared to the CF treatment, long-term sludge fertilization increased the content of SOC, TN, and TP but decreased the content of TK, AP, and AK (Table 2). The composted sludge fertilizer had a stronger improvement than the uncomposted sludge fertilizer in terms of the TN, TP, AK, and AP content, while the SOC and TK content improved more under the uncomposted sludge fertilizer (Table 2). Long-term fertilization decreased the content of TK and AK. The C/N ratio could represent the decomposition rate of organic matter. A higher value represented a higher proportion of organic components in the litter, ultimately resulting in slower decomposition. In this study, the lowest C/N ratio of all the fertilizer treatments was 16.65 under the WD treatment. It was indicated that the composted sludge fertilizer could accelerate the decomposition of organic matter.
Table 2.
Soil nutrient content under long-term fertilization treatments.
3.1.2. Soil Enzymatic Activities and Microbial Biomass
Variations in the soil’s enzymatic activities, including ALP, SAC, DEH, and URE, are presented in Table 3. It was observed that the soil’s enzyme activities under the remaining three treatments were higher than those of the control treatment. Most of the soil’s enzyme activities were increased by the long-term fertilization. Compared with the CF treatment, the ALP and SAC activities were slightly higher and the DEH and URE activities were slightly lower under the WD treatment. Compared with the CF treatment, the soil’s enzymatic activities under the WS treatment were decreased, except for the SAC activities.
Table 3.
Soil enzymatic activities and microbial biomass under different fertilization conditions.
Compared to the CK treatment, the concentrations of SMBC, SMBN, and SMBP were increased under the other three treatments. The concentrations of SMBC and SMBP were highest under the WD treatment, with the values 551.07 and 75.98 mg/kg, respectively. The highest concentration of SMBN was under the WS treatment. Compared with the WS treatment, in terms of the soil’s enzymatic activities, the concentrations of SMBN and SMBP were higher under the WD treatment.
3.2. The Soil’s Microbial Community Composition
3.2.1. Copy Number of the Bacterial 16S rRNA Gene
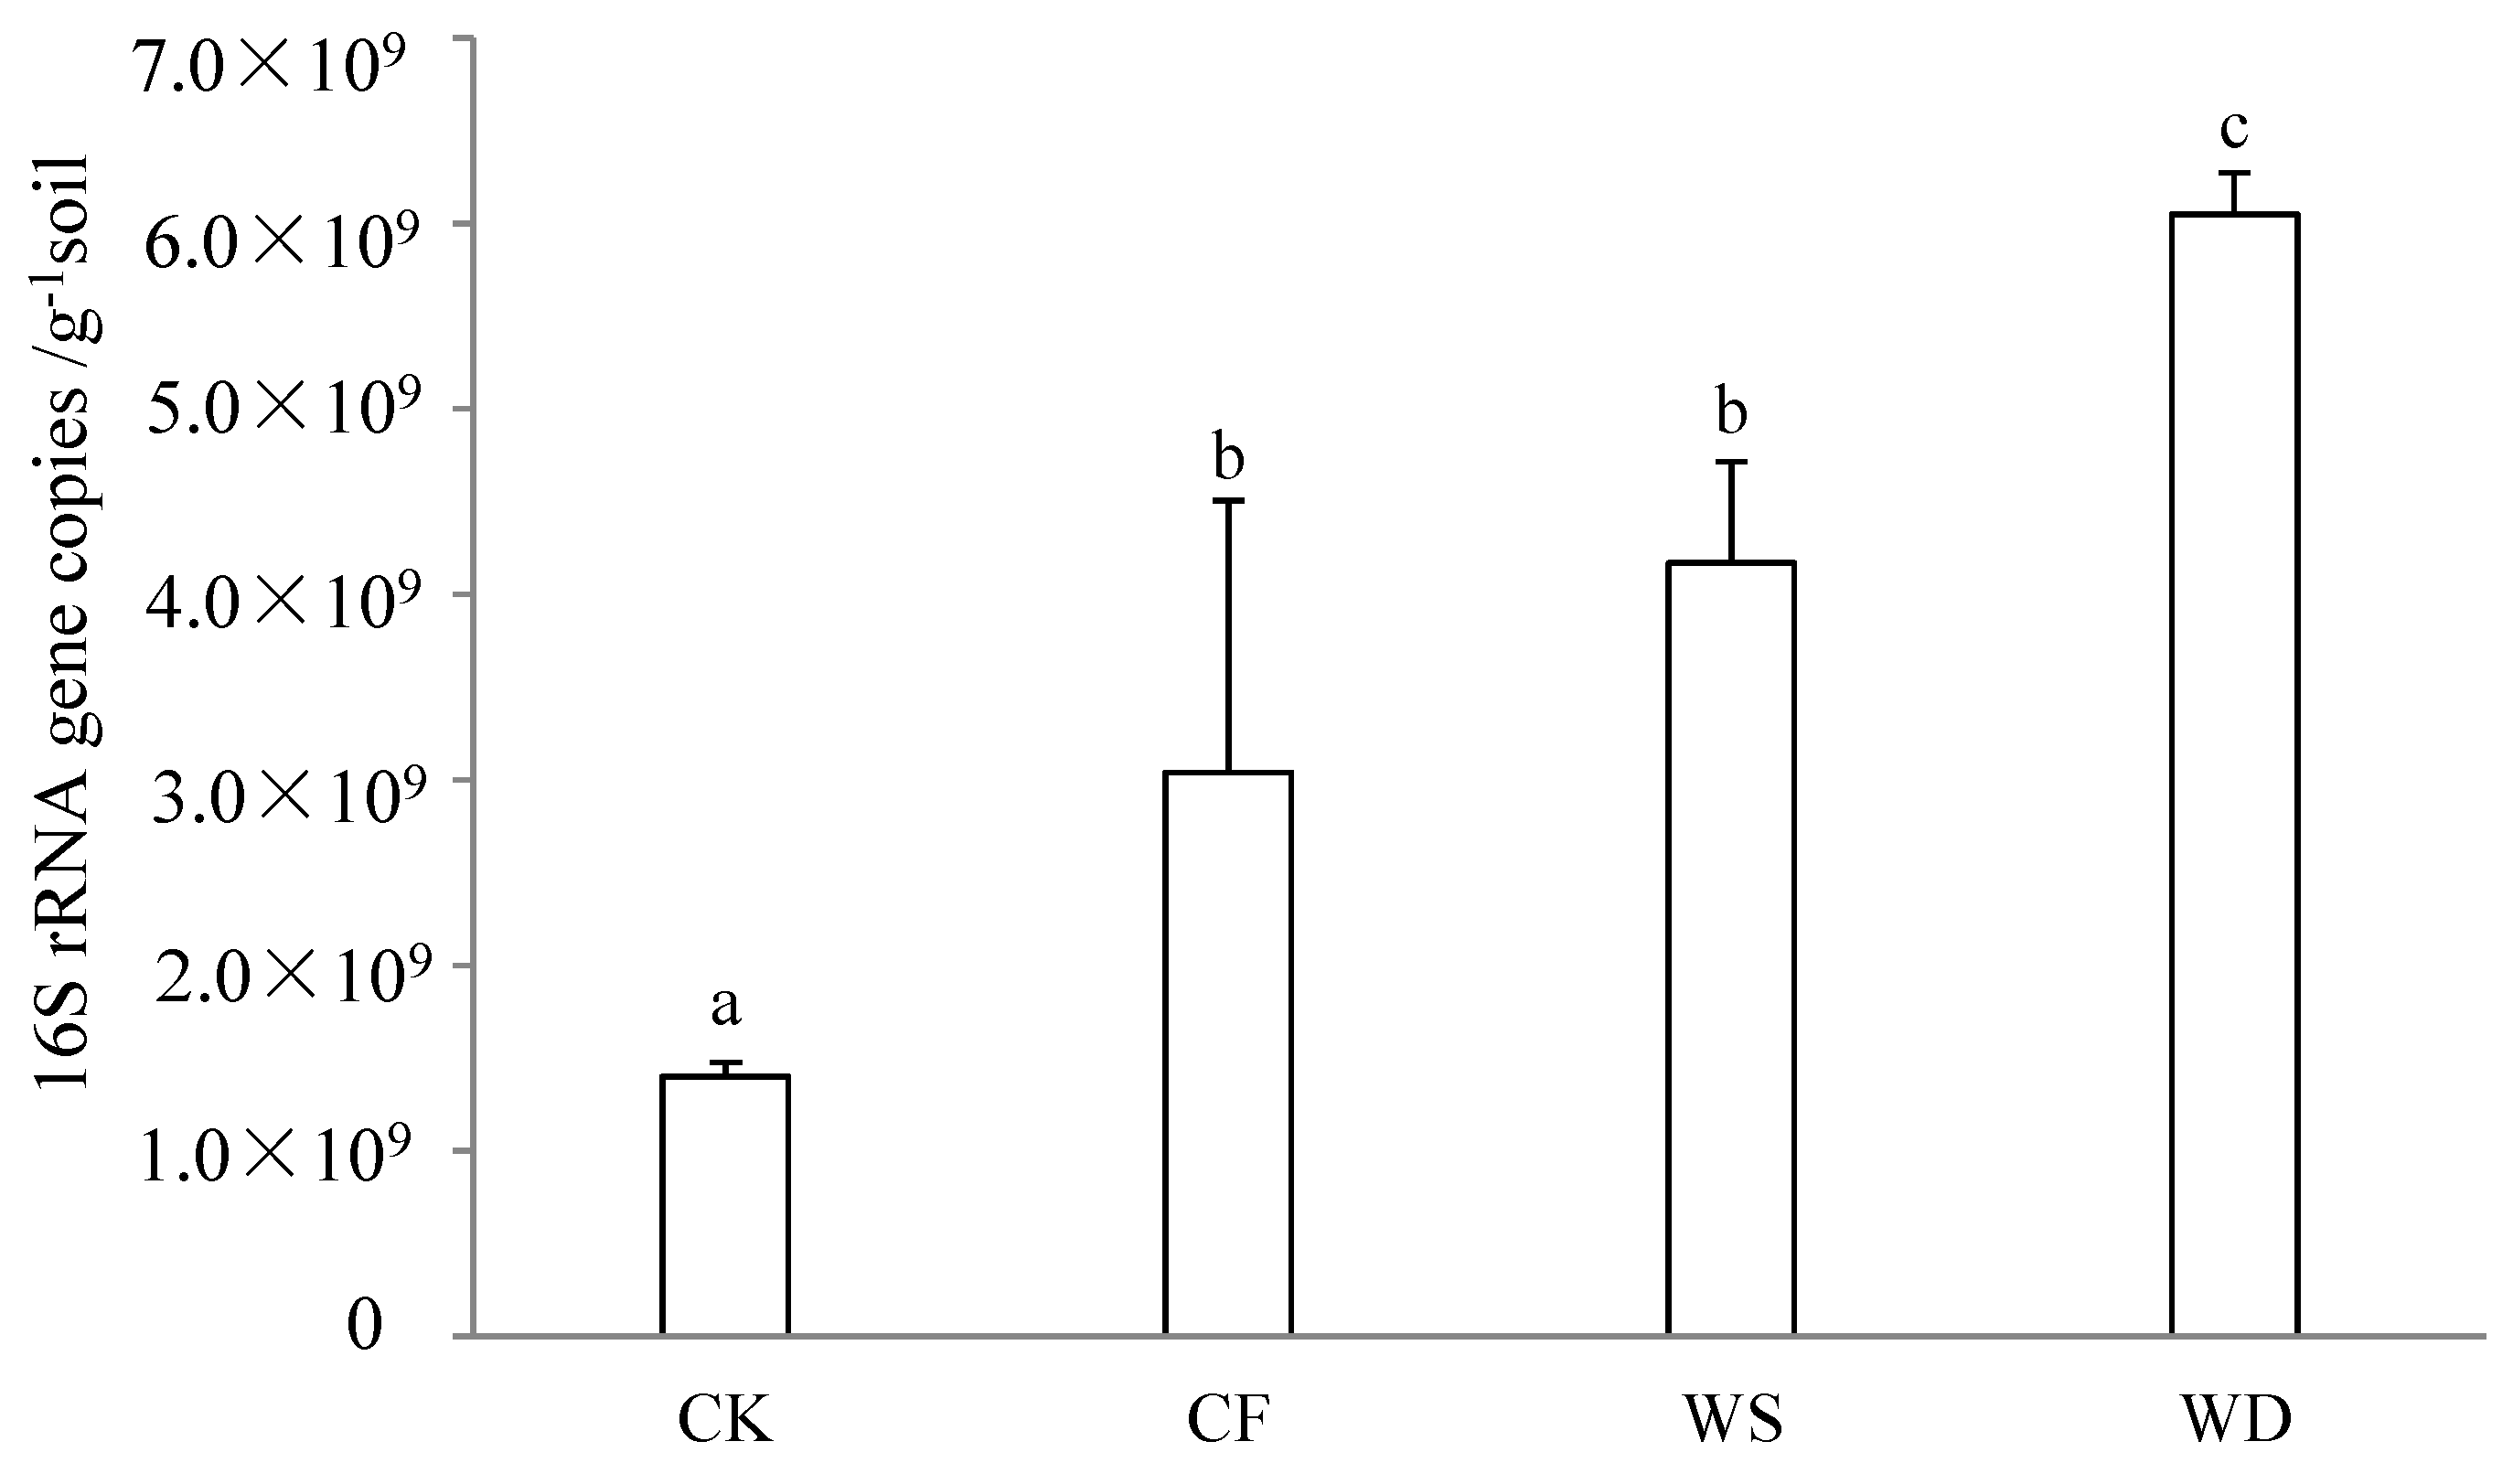
The qPCR method was utilized for quantitative analysis of the 16S rRNA genes in the soil bacteria, revealing the impact of 20 years of fertilization on the size of the soil’s bacterial communities (Figure 1). The influences on the gene copy numbers per gram of soil were found to be significant. The bacterial 16S rRNA gene numbers in 1 g of soil varied from 1.40 × 10⁹ to 6.05 × 10⁹. Following 20 years of long-term fertilization, the gene copy numbers under the CF, WS, and WD treatments increased by 117.1%, 197.9%, and 332.1%, respectively, when compared to the CK treatment. The lowest gene copy number was observed under the CK treatment, while the highest was seen under the WD treatment. The gene copy numbers under the sludge fertilizer treatment were higher than that under the chemical fertilizer treatment. All the fertilization treatments caused a significant increase compared to the CK treatment (p < 0.05).
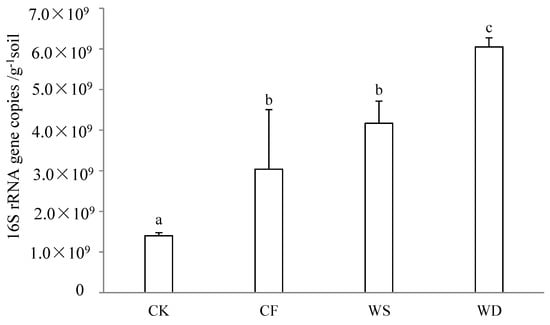
Figure 1.
The number of bacteria under different treatments was expressed as the 16S rDNA copy number and detected using quantitative PCR. The control treatment was recorded as CK, the chemical fertilizer was recorded as CF, the composted sludge fertilizer was recorded as WD, and the uncomposted sludge fertilizer was recorded as WS. Same letters in columns indicate no significant differences (p < 0.05, Tukey’s test).
3.2.2. Bacterial Community Composition
The distribution of various phyla in the 12 samples is illustrated in Figure 2. There was a significant difference in the soil’s bacterial abundance at the phylum level among different fertilization treatments. The phyla Actinobacteria, Acidobacteria, Bacteroidetes, Chloroflexi, Planctomycetes, and Proteobacteria occupied 83.8–87.0% of the bacterial sequences obtained from the fertilized soils, which were followed by Gemmatimonadetes (1.9–3.9%), Verrucomicrobia (2.0–3.4%), Nitrospirae (0.7–1.5%), and Firmicutes (0.9–1.0%). Proteobacteria dominated the bacterial sequences in all the soil samples, with the proportions ranging from 31.2% to 52.3%.
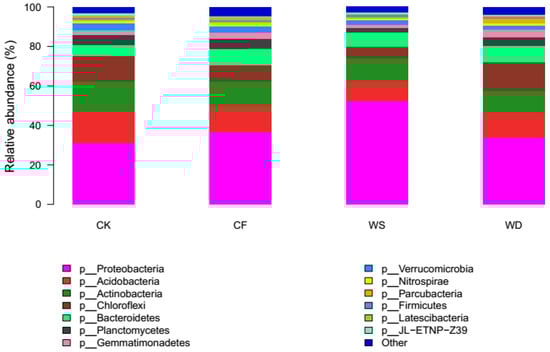
Figure 2.
Relative average abundances of the abundant phyla across soils from different fertilizer regimes (values represent % of total redundant sequences).
The relative abundance of several phyla showed significant changes under various fertilization treatments compared to the control treatment (p < 0.05). The relative abundance of the phyla Proteobacteria and Bacteroidetes increased under all the fertilization treatments, while the phyla Actinobacteria, Acidobacteria, and Verrucomicrobia decreased. Compared to the CK treatment, the relative abundance of Proteobacteria and Bacteroidetes increased under both the WS and WD treatments, whereas the relative abundance of Chloroflexi and Gemmatimonadees increased only under the WD treatment. The relative abundance of Actinobacteria, Acidobacteria, Planctomycetes, and Verrucomicrobia decreased under both the WS and WD treatments, while the relative abundance of Chloroflexi and Gemmatimonadetes decreased only under the WS treatment.
3.2.3. A Venn Diagram of the Long-Term Fertilizer Application
To compare the bacterial community composition of each sample under different treatments, a Venn diagram was created (Figure 3). In the wheat season, there were 24, 11, 11, and 27 unique OTUs for CK, CF, WS, and WD, respectively (Figure 3). Furthermore, a total of 1207 OTUs represented 72.3% of all the observed OTUs across the treatments.
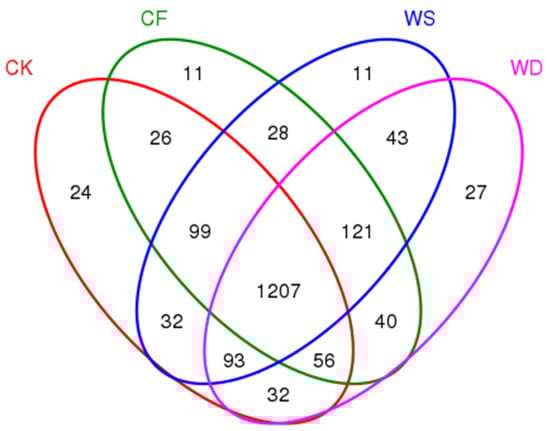
Figure 3.
A Venn diagram showing the number of shared and unique OTUs between different fertilization treatments. The fertilization treatments were CK, CF, WS, and WD.
3.3. Grain Quality and Wheat Yield
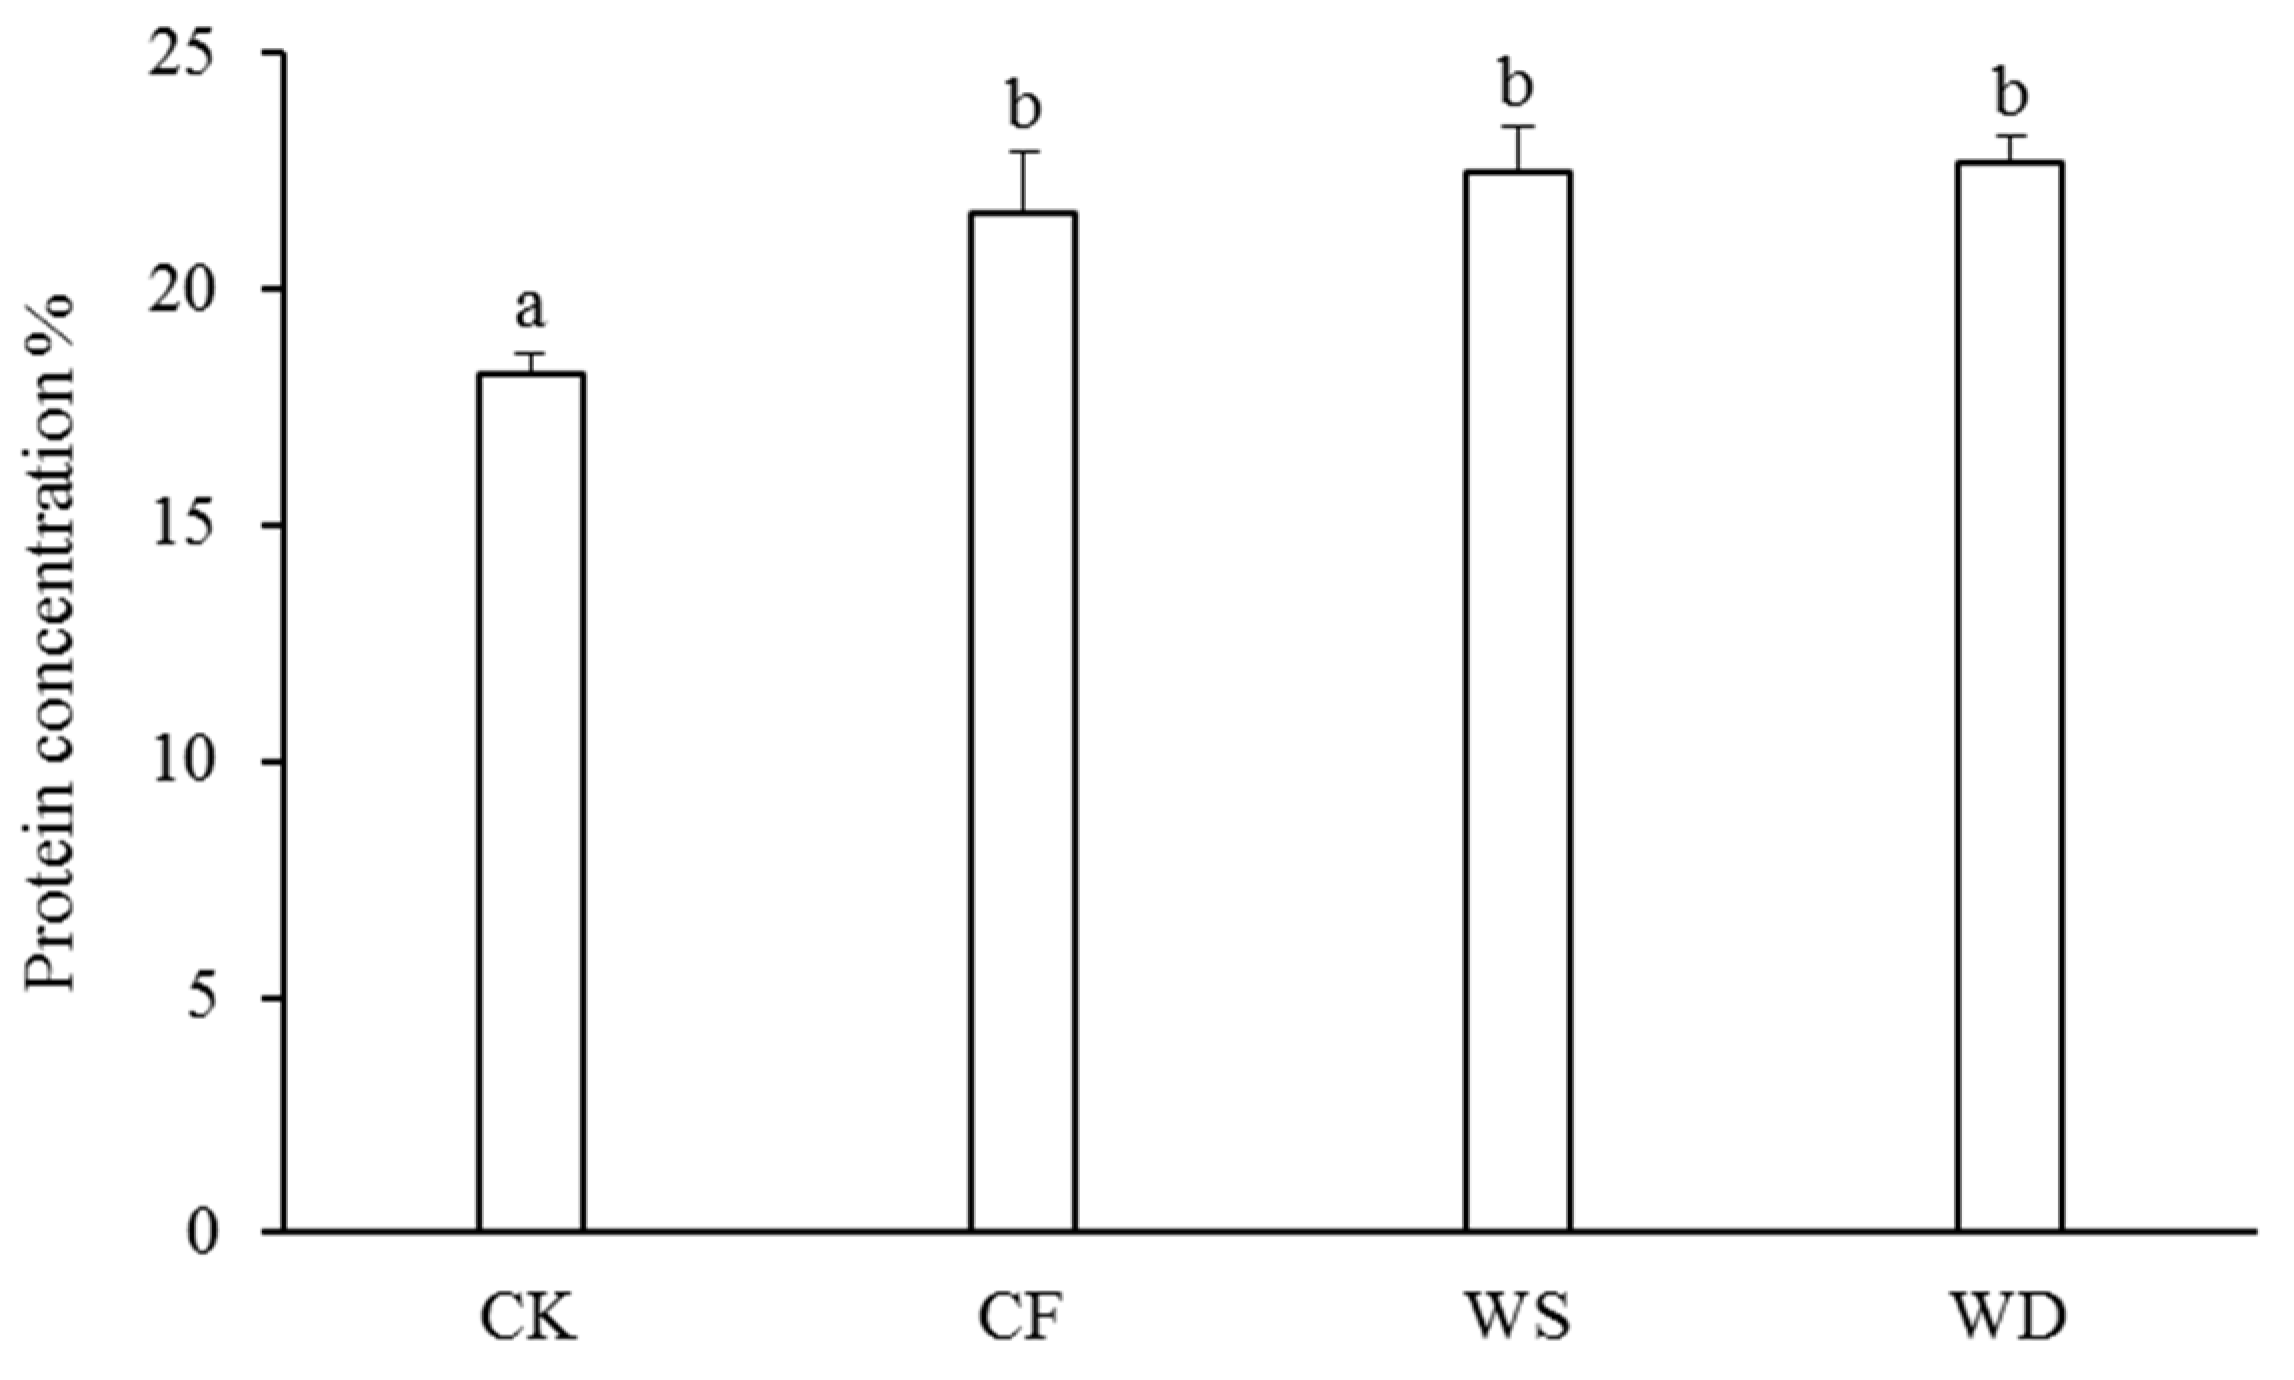
The concentrations of protein in the wheat grains were measured to assess the grain quality (Figure 4). The sludge fertilizer significantly increased the concentration of protein compared with the CK treatment. Specifically, the protein concentration under the WS treatment was 3.8% higher than that under the CF treatment and 4.9% higher than that under the CF treatment. However, there was no significant increase in the protein concentration with the application of the sludge fertilizer.
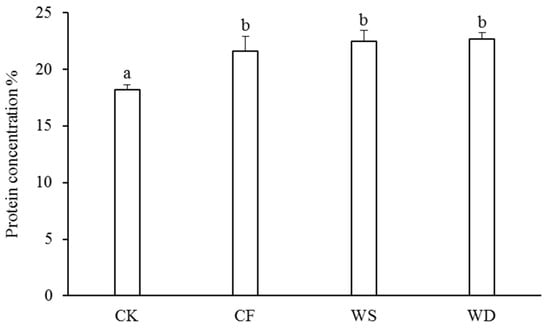
Figure 4.
The protein concentration under different fertilization treatments. The control treatment was recorded as CK, the chemical fertilizer was recorded as CF, the composted sludge fertilizer was recorded as WD, and the uncomposted sludge fertilizer was recorded as WS. According to Tukey’s test, different letters in the same column indicate significant differences among treatments (p < 0.05).
In our study, compared to the CK treatment, the use of the sludge fertilizer resulted in a significant improvement in the crop yield (Table 4). Specifically, the WS treatment increased the crop yield by 118.2%, while the WD treatment increased the crop yield by 124.2%. In comparison to the CF treatment, both the WS treatment and WD treatment showed a substantial increase in the crop yield. The WD treatment had the highest fertilizer yield contribution rate at 55.4%, leading to the highest crop yield overall.
Table 4.
Contribution rates of different fertilization treatments to wheat yield and fertilizer yield.
3.4. The Soil Health Index (SHI) of Different Fertilizer Treatments
The heavy metal concentrations in the soil under different treatments are displayed in Table 5. In comparison to the CK treatment, the concentrations of Cu, Cd, Pb, and Zn in the CF treatment were 0.19 mg/kg, 20.83 mg/kg, 34.72 mg/kg, and 72.14 mg/kg, respectively. None of these concentrations exceeded the national standard. The heavy metal concentration under both the WS and WD treatments remained within the limits set by the national standard. The concentrations of Cu, Cd, Pb, and Zn were observed to be higher under the WS and WD treatments when compared to the CK and CF treatments. The concentrations of Cd, Pb, and Zn were higher under the WS treatment than under the WD treatment. This could be due to the direct application of WS without composting, a practice that is known to increase the heavy metal content in soil.
Table 5.
Soil heavy metal concentrations under different sludge compost treatments.
The SHI values under different fertilization regimes are shown in Table 3. The calculation process for the SHI is detailed in the Supplementary Materials (Tables S1–S4). The highest SHI was 0.79 under the WD treatment, and the lowest SHI was 0.06 under the CK treatment. The SHI value was 0.71 under the WS treatment. The SHI value of the CF treatment was lower than that of the WD and WS treatments. Continuous application of sludge fertilizer can increase the SHI value. The SHI value was higher under the WD treatment than that under the WS treatment. Therefore, compost sludge fertilizer can enhance the soil health condition.
4. Discussion
4.1. Changes in the Soil Properties Due to Sludge Fertilization
Some authors have observed that sludge’s addition impacted positively on soil fertility. The use of sludge fertilizer has been shown to enhance nutrient levels [12]. For instance, the levels of SOC, TN, and TP were found to be greater under the sludge fertilizer treatment when compared to both the CK and CF fertilizer treatments. These findings are in line with earlier research [12]. The major reason was that the use of the sludge fertilizer led to a rapid improvement in the physicochemical properties of the soil. This was achieved by increasing the soil’s organic matter and bulk density, which, in turn, created favorable conditions for crop root growth [12]. Organic materials are introduced into the soil, and as carbonaceous compounds degrade, the resulting residues form clay–humic complexes that enrich the soil with organic matter [13]. The slight differences observed in the soil chemical parameters may be attributed to both the direct residual effect of sewage sludge on the soil characteristics and the nutrient cycling resulting from plants’ uptake of nutrients, followed by release after biomass decomposition [14]. Moreover, the microbial biomass was controlled by the long-term input of organic materials into soil, indicating that the microbial biomass was significantly higher in the soil with a high organic matter concentration [15]. In this study, the WS and WD treatments were most effective in increasing the concentration of SMBC and SMBP.
Soil enzymatic activity is commonly used as an indicator of soil quality and is linked to the transformation of the nutrients in the soil [16]. This study examined the enzymes (invertase, urease, alkaline phosphatase, and catalase) that play a role in transforming soil carbon, nitrogen, and phosphorus. The highest activity of DEH was observed under the WD treatment compared to the other treatments, aligning with previous research findings [17]. This may be due to the high concentration of organic matter.
Urease releases N-NH4+ through urea hydrolysis and is essential in the chain hydrolysis of amino compounds [18]. Prior studies have suggested that prolonged use of mineral fertilizers, liquid fertilizers, or a combination of both can result in elevated levels of urease activity [19]. In this study, the activity of URE was found to be highest under the CF treatment compared to the other treatments. However, there was no significant effect on its concentration under different treatments.
Phosphatases play a meaningful role in phosphorus cycling because they provide P for plant uptake by releasing PO4−3 from immobile organic phosphorus. The greater activity of alkaline phosphatase in the soil could be attributed to enhanced microbial activity due to fertilizer input over the years [20]. In this study, the CF treatment had the highest mean values of urease activity, followed by the WS treatment and WD treatment, with the CK treatment having the least amount of activity. It was considered that the long-term application of sludge fertilizer has a significant impact on the soil enzyme activity [21].
In soil carbon transformation, invertase plays a significant role and is associated with soil microbial biomass [18]. In this study, long-term fertilization led to an increase in invertase activity, which was consistent with previous reports [22,23]. The results suggest that higher microbial activity and substrate concentrations in the soil may contribute to the enhancement of invertase activity [24].
The application of sludge fertilizer has been found to increase the soil organic carbon concentration, which, in turn, stimulates the synthesis of enzymes and microbial activity. Furthermore, it has been observed that the enzymes become highly immobilized in the soil after 20 years of sludge fertilization.
4.2. Effect of Sludge Biofertilizer on Bacterial Community Composition
Soil microorganisms in agroecosystems are directly affected by the availability of soil nutrients [25,26]. Bacterial communities have been primarily influenced by various sludge fertilization practices, which has resulted in changes to the soil’s nutrient levels. The gradual release of nutrients and dissolved carbon through manure decomposition can provide long-term sustenance for soil microorganisms [27]. According to reports, fertilization has had the most significant impact on the composition of the soil microbial community, particularly in terms of changes in soil carbon, soil nitrogen, and pH [28,29]. This study aimed to evaluate the impact of continuous sludge fertilization for 20 years on the composition of the soil microbial community in comparison to chemical fertilizer or non-fertilizer soil. Long-term sludge fertilization provided a unique opportunity to assess the effects of this type of fertilizer on the soil microbial community.
The examination with pyrosequencing indicated that Actinobacteria, Acidobacteria, Bacteroidetes, Chloroflexi, Planctomycetes, and Proteobacteria were the primary phyla present in all the soil specimens investigated in this research. This outcome was consistent with various earlier investigations, highlighting the prevalence of Proteobacteria, Chloroflexi, and Acidobacteria as the prevailing bacterial groups in the soil, as determined using 16S rRNA gene clones or pyrosequencing technologies [4].
Due to their capacity to decompose crucial elements within plant remains, such as cellulose and lignin, Acidobacteria have been recognized for their significant contribution to the carbon cycle [30]. This research revealed a decline in Acidobacteria levels following fertilization, aligning with earlier findings. The study illustrated that the prevalence of Acidobacteria was notably reduced in the treatments with high concentrations of fertilizer compared to those without any fertilization [31].
The study indicated that the relative abundance of Proteobacteria, a type of nitrogen-cycling phyla, increased after fertilization, while that of Planctomycetes decreased, consistent with the decline in some subpopulations of Planctomycetes after fertilization [32]. The WS treatment showed a higher dominance of Proteobacteria compared to the WD treatment, possibly due to the WS fertilizer having more effective microorganisms that facilitated the abundance of Proteobacteria.
The Firmicutes group of microorganisms was once considered a major copiotrophic microbial group, with several genera playing significant roles in the manure degradation process [33]. Previous research has indicated that Firmicutes are more abundant in agricultural systems utilizing manure [27,34]. However, this study observed a decreased relative abundance of Firmicutes after sludge fertilization, which was consistent with several previous studies [35]. Surprisingly, the relative abundance of Firmicutes under the WD treatments was lower than that under other fertilizer treatments.
Bacteroidetes play a crucial role in nutrient turnover within the soil, with their presence being positively associated with soil total phosphorus and soluble phosphorus [36]. This study revealed that the relative abundance of Bacteroidetes increased under both the water-stressed (WS) and well-watered (WD) treatments. The proliferation of Bacteroidetes in different fertilization treatments could be attributed to the increased concentrations of some soil nutrients after fertilization [32]. In summary, both composted and non-composted sludge fertilizers can increase soil bacterial diversity.
4.3. Relationship of Sludge Fertilization with Soil Health
The application of the sludge fertilizer had the greatest impact on the soil health. The soil health index varied significantly with different fertilizer applications (Table 6). In this study, the soil health index was found to be highest under the WD treatment due to the elevated levels of SOC and TN. The varying fertilization methods had an impact on key chemical soil health indicators like SOC and TN [37]. Although the SOC level under the WS treatment was higher compared to that under the WD treatment, the soil health index under the WS treatment was low. The sludge in the WS treatment was not composted, which resulted in the presence of harmful substances that negatively impacted soil health.
Table 6.
Comprehensive evaluation index of soil health under different fertilization treatments.
More importantly, sewage sludge fertilization also affects soil biological health indicators, such as soil microbial biomass and soil community composition. Sludge fertilization demonstrated a greater impact on increasing the microbial OTU numbers compared to the other fertilizer applications (Figure 1). This phenomenon may have been caused by the increased abundance of easily decomposable organic matter resulting from the use of sludge as a fertilizer [38]. The trend in the soil health index was consistent with the number of bacterial 16S rRNA genes. Despite similarities in the bacterial community composition across all the fertilizer treatments, the relative abundance of phyla varied. Specifically, the relative abundances of Chloroflexi and Gemmatimonadetes were higher under the WD treatment compared to the other treatments (Figure 2). This suggests that the relative abundances of Chloroflexi and Gemmatimonadetes could potentially serve as indicators of soil health.
5. Conclusions
This study demonstrated that long-term (20 years) sludge fertilization could enhance the soil health by increasing the soil’s enzymatic activities and preserving microbial biodiversity. The soil health index was determined using the minimum data set method. The findings indicated that the impact on the soil microbial biomass and enzymatic activities was slightly stronger using the composted sludge fertilizer treatment compared to the uncomposted sludge fertilizer treatment. Compared to the chemical fertilizer treatment, the concentrations of SMBC and SMBP were higher under the sludge fertilizer treatment. The differences in the soil microbial community between the sludge fertilizer and chemical fertilizer regimes were clearly distinguished. The gene copy numbers under the sludge fertilizer treatment were higher than those under the chemical fertilizer treatment. Long-term use of the chemical fertilizer decreased the biodiversity and abundance of bacteria. In comparison to the chemical fertilizer treatment, the crop yields significantly increased under both the composted sludge fertilizer (WD) and uncomposted sludge fertilizer (WS) treatments. Additionally, the soil health index was highest under the WD treatment compared to all the other treatments. These results provide important insights into the microbial community structure in this distinct ecosystem. In conclusion, our findings suggest that the addition of suitable composted sludge is helpful for the soil properties.
Supplementary Materials
The following supporting information can be downloaded at: https://www.mdpi.com/article/10.3390/agronomy14040756/s1. Table S1: The membership degree of the evaluation alternatives. Table S2: Load count of different soil indicators. Table S3: Different weights of evaluation indexes. Table S4: Soil health comprehensive evaluation index under different fertilizer treatments.
Author Contributions
Data curation, H.L.; resources, L.T.; validation, Y.L.; writing—original draft, L.L.; writing—review and editing, Y.L. All authors have read and agreed to the published version of the manuscript.
Funding
This research was funded by the Inner Mongolia Autonomous Region Research Project “Rejuvenating the Inner mongolia with Science and Technology” (grant number 2021EEDSCXSFQZD011) and the National Key Research and Development Program of China (grant number 2021YFD1500802).
Institutional Review Board Statement
Not applicable.
Informed Consent Statement
Not applicable.
Data Availability Statement
Data is contained within the article or supplementary material. The data presented in this study are available in supplementary material.
Conflicts of Interest
Author He Li was employed by the company Xinjiang Huiguang Optoelectronic Technology Limited Company. The remaining authors declare that the research was conducted in the absence of any commercial or financial relationships that could be construed as a potential conflict of interest.
References
- Bai, Y.; Gu, C.; Tao, T.; Wang, L.; Feng, K.; Shan, Y. Growth characteristics, nutrient uptake, and metal accumulation of ryegrass (Lolium perenne L.) in sludge-amended mudflats. Acta Agric. Scand. Sect. B Soil Plant Sci. 2013, 63, 352–359. [Google Scholar]
- Bai, Y.; Tao, T.; Gu, C.; Wang, L.; Feng, K.; Shan, Y. Mudflat soil amendment by sewage sludge: Soil physicochemical properties, perennial ryegrass growth, and metal uptake. Soil Sci. Plant Nutr. 2013, 59, 942–952. [Google Scholar] [CrossRef]
- Pereira, I.S.; Bamberg, A.L.; Oliveira de Sousa, R.; Monteiro, A.B.; Martinazzo, R.; Posser Silveira, C.A.; de Oliveira Silveira, A. Agricultural use and pH correction of anaerobic sewage sludge with acid pH. J. Environ. Manag. 2020, 275, 111203. [Google Scholar] [CrossRef] [PubMed]
- Kersey, J.; Myrold, D. Response of soil health indicators to organic matter removal and compaction manipulations at six LTSP sites in the Western US. For. Ecol. Manag. 2021, 490, 119104. [Google Scholar] [CrossRef]
- Chang, T.; Feng, G.; Paul, V.; Adeli, A.; Brooks, J.P.; Jenkins, J.N. Soil health assessment for different tillage and cropping systems to determine sustainable management practices in a humid region. Soil Tillage Res. 2023, 233, 105796. [Google Scholar] [CrossRef]
- Lu, H.; Chen, X.; Ma, K.; Zhou, S.; Yi, J.; Qi, Y.; Hao, J.; Chen, F.; Wen, X. Soil health assessment under different soil and irrigation types in the agro-pastoral ecotone of northern China. Catena 2024, 235, 107655. [Google Scholar] [CrossRef]
- Si, S.; Wu, Y.; Li, Y.; Yang, S.; Peng, X.; Luo, Y. Divergent soil health responses to long-term inorganic and organic fertilization management on subtropical upland red soil in China. Ecol. Indic. 2023, 154, 110486. [Google Scholar]
- Das, S.; Liptzin, D.; Maharjan, B. Long-term manure application improves soil health and stabilizes carbon in continuous maize production system. Geoderma 2023, 430, 116338. [Google Scholar] [CrossRef]
- Tarrasón, D.; Ojeda, G.; Ortiz, O.; Alcañiz, J. Effects of different types of sludge on soil microbial properties: A field experiment on degraded mediterranean soils. Pedosphere 2010, 20, 681–691. [Google Scholar] [CrossRef]
- Liu, Z.; Gu, H.; Liang, A.; Li, L.; Yao, Q.; Xu, Y.; Liu, J.; Jin, J.; Liu, X.; Wang, G. Conservation tillage regulates the assembly, network structure and ecological function of the soil bacterial community in black soils. Plant Soil 2022, 472, 207–223. [Google Scholar] [CrossRef]
- Purakayastha, T.; Pathak, H.; Kumari, S.; Biswas, S.; Chakrabarty, B.; Padaria, R.N.; Kamble, K.; Pandey, M.; Sasmal, S.; Singh, A. Soil health card development for efficient soil management in Haryana, India. Soil Tillage Res. 2019, 191, 294–305. [Google Scholar] [CrossRef]
- Bai, Y.; Zang, C.; Gu, M.; Gu, C.; Shao, H.; Guan, Y.; Wang, X.; Zhou, X.; Shan, Y.; Feng, K. Sewage sludge as an initial fertility driver for rapid improvement of mudflat salt-soils. Sci. Total. Environ. 2017, 578, 47–55. [Google Scholar] [CrossRef] [PubMed]
- Boudjabi, S.; Chenchouni, H. On the sustainability of land applications of sewage sludge: How to apply the sewage biosolid in order to improve soil fertility and increase crop yield? Chemosphere 2021, 282, 131122. [Google Scholar] [CrossRef] [PubMed]
- Nair, P.K.R.; Nair, V.D.; Mohan Kumar, B.; Showalter, J.M. Carbon sequestration in agroforestry systems. Adv. Agron. 2010, 108, 237–307. [Google Scholar] [CrossRef]
- Chen, D.; Yuan, L.; Liu, Y.; Ji, J.; Hou, H. Long-term application of manures plus chemical fertilizers sustained high rice yield and improved soil chemical and bacterial properties. Eur. J. Agron. 2017, 90, 34–42. [Google Scholar] [CrossRef]
- Zhao, J.; Ni, T.; Li, J.; Lu, Q.; Fang, Z.; Huang, Q.; Zhang, R.; Li, R.; Shen, B.; Shen, Q. Effects of organic–inorganic compound fertilizer with reduced chemical fertilizer application on crop yields, soil biological activity and bacterial community structure in a rice–wheat cropping system. Appl. Soil Ecol. 2016, 99, 1–12. [Google Scholar] [CrossRef]
- Islam, M.R.; Singh, C.P.; Kim, Y.; Kim, M.; Sa, T. Community level functional diversity and enzyme activities in paddy soils under different long-term fertilizer management practices. Biol. Fertil. Soils 2011, 47, 599–604. [Google Scholar] [CrossRef]
- Rehman, R.A.; Qayyum, M.F. Co-composts of sewage sludge, farm manure and rock phosphate can substitute phosphorus fertilizers in rice-wheat cropping system. J. Environ. Manag. 2020, 259, 109700. [Google Scholar] [CrossRef]
- Nayak, D.R.; Babu, Y.J.; Adhya, T. Long-term application of compost influences microbial biomass and enzyme activities in a tropical aeric endoaquept planted to rice under flooded condition. Soil Biol. Biochem. 2007, 39, 1897–1906. [Google Scholar] [CrossRef]
- Hamdi, H.; Hechmi, S.; Khelil, M.N.; Zoghlami, I.R.; Benzarti, S.; Mokni-Tlili, S.; Hassen, A.; Jedidi, N. Repetitive land application of urban sewage sludge: Effect of amendment rates and soil texture on fertility and degradation parameters. Catena 2019, 172, 11–20. [Google Scholar] [CrossRef]
- Dong, W.Y.; Zhang, X.Y.; Liu, X.Y.; Fu, X.L.; Chen, F.S.; Wang, H.M.; Sun, X.M.; Wen, X.F. Responses of soil microbial communities and enzyme activities to nitrogen and phosphorus additions in Chinese fir plantations of subtropical China. Biogeosciences 2015, 12, 5537–5546. [Google Scholar] [CrossRef]
- Mandal, A.; Patra, A.K.; Singh, D.; Swarup, A.; Masto, R.E. Effect of long-term application of manure and fertilizer on biological and biochemical activities in soil during crop development stages. Bioresour. Technol. 2007, 98, 3585–3592. [Google Scholar] [CrossRef] [PubMed]
- Liang, Q.; Chen, H.; Gong, Y.; Yang, H.; Fan, M.; Kuzyakov, Y. Effects of 15 years of manure and mineral fertilizers on enzyme activities in particle-size fractions in a North China Plain soil. Eur. J. Soil Biol. 2014, 60, 112–119. [Google Scholar] [CrossRef]
- Parthasarathi, K.; Ranganathan, L.S. Aging effect on enzyme activities in pressmud vermicasts of Lampito mauritii (Kinberg) and Eudrilus eugeniae (Kinberg). Biol. Fertil. Soils 2000, 30, 347–350. [Google Scholar] [CrossRef]
- Geisseler, D.; Scow, K.M. Long-term effects of mineral fertilizers on soil microorganisms—A review. Soil Biol. Biochem. 2014, 75, 54–63. [Google Scholar] [CrossRef]
- Leff, J.W.; Jones, S.E.; Prober, S.M.; Barberán, A.; Borer, E.T.; Firn, J.L.; Harpole, W.S.; Hobbie, S.E.; Hofmockel, K.S.; Knops, J.M.H.; et al. Consistent responses of soil microbial communities to elevated nutrient inputs in grasslands across the globe. Proc. Natl. Acad. Sci. USA 2015, 112, 10967–10972. [Google Scholar] [CrossRef] [PubMed]
- Bonanomi, G.; De Filippis, F.; Cesarano, G.; La Storia, A.; Ercolini, D.; Scala, F. Organic farming induces changes in soil microbiota that affect agro-ecosystem functions. Soil Biol. Biochem. 2016, 103, 327–336. [Google Scholar] [CrossRef]
- Li, F.; Chen, L.; Zhang, J.; Yin, J.; Huang, S. Bacterial community structure after long-term organic and inorganic fertilization reveals important associations between soil nutrients and specific taxa involved in nutrient transformations. Front. Microbiol. 2017, 8, 187. [Google Scholar] [CrossRef] [PubMed]
- Sun, R.; Zhang, X.-X.; Guo, X.; Wang, D.; Chu, H. Bacterial diversity in soils subjected to long-term chemical fertilization can be more stably maintained with the addition of livestock manure than wheat straw. Soil Biol. Biochem. 2015, 88, 9–18. [Google Scholar] [CrossRef]
- Huang, X.; Liu, L.; Wen, T.; Zhu, R.; Zhang, J.; Cai, Z. Illumina MiSeq investigations on the changes of microbial community in the Fusarium oxysporum f.sp. cubense infected soil during and after reductive soil disinfestation. Microbiol. Res. 2015, 181, 33–42. [Google Scholar] [CrossRef]
- Zhou, J.; Guan, D.; Zhou, B.; Zhao, B.; Ma, M.; Qin, J.; Jiang, X.; Chen, S.; Cao, F.; Shen, D.; et al. Influence of 34-years of fertilization on bacterial communities in an intensively cultivated black soil in northeast China. Soil Biol. Biochem. 2015, 90, 42–51. [Google Scholar] [CrossRef]
- Cai, F.; Pang, G.; Li, R.-X.; Li, R.; Gu, X.-L.; Shen, Q.-R.; Chen, W. Bioorganic fertilizer maintains a more stable soil microbiome than chemical fertilizer for monocropping. Biol. Fertil. Soils 2017, 53, 861–872. [Google Scholar] [CrossRef]
- Ryckeboer, J.R.; Mergaert, J.; Vaes, K.; Klammer, S.; Clercq, D.D.; Coosemans, J.; Insam, H.; Swings, J. A survey of bacteria and fungi occurring during composting and self-heating processes. Ann Microbiol. 2003, 53, 349–410. [Google Scholar] [CrossRef]
- Hartmann, M.; Frey, B.; Mayer, J.; Mäder, P.; Widmer, F. Distinct soil microbial diversity under long-term organic and conventional farming. ISME J. 2015, 9, 1177–1194. [Google Scholar] [CrossRef] [PubMed]
- Zhang, W.; Qiao, W.; Gao, D.; Dai, Y.; Deng, J.; Yang, G.; Han, X.; Ren, G. Relationship between soil nutrient properties and biological activities along a restoration chronosequence of Pinus tabulaeformis plantation forests in the Ziwuling Mountains, China. Catena 2018, 161, 85–95. [Google Scholar] [CrossRef]
- Tian, W.; Wang, L.; Li, Y.; Zhuang, K.; Li, G.; Zhang, J.; Xiao, X.; Xi, Y. Responses of microbial activity, abundance, and community in wheat soil after three years of heavy fertilization with manure-based compost and inorganic nitrogen. Agric. Ecosyst. Environ. 2015, 213, 219–227. [Google Scholar] [CrossRef]
- Jiang, Y.; Zhang, J.; Manuel, D.-B.; de Beeck, M.O.; Shahbaz, M.; Chen, Y.; Deng, X.; Xu, Z.; Li, J.; Liu, Z. Rotation cropping and organic fertilizer jointly promote soil health and crop production. J. Environ. Manag. 2022, 315, 115190. [Google Scholar] [CrossRef]
- Segura, C.; Horrocks, C.; Lopez-Aizpun, M.; Blackwell, M.S.; Darch, T.; Hood, J.; Le Cocq, K.; McAuliffe, G.A.; Lee, M.R.; Cardenas, L. Response of soil health indicators to dung, urine and mineral fertilizer application in temperate pastures. J. Environ. Manag. 2023, 330, 117096. [Google Scholar] [CrossRef]


Disclaimer/Publisher’s Note: The statements, opinions and data contained in all publications are solely those of the individual author(s) and contributor(s) and not of MDPI and/or the editor(s). MDPI and/or the editor(s) disclaim responsibility for any injury to people or property resulting from any ideas, methods, instructions or products referred to in the content. |
© 2024 by the authors. Licensee MDPI, Basel, Switzerland. This article is an open access article distributed under the terms and conditions of the Creative Commons Attribution (CC BY) license (https://creativecommons.org/licenses/by/4.0/).