Article

Drought Monitoring of Winter Wheat in Henan Province, China Based on Multi-Source Remote Sensing Data

1
College of Hydraulic Science and Engineering, Yangzhou University, Yangzhou 225009, China
2
Foundation of Anhui Province Key Laboratory of Physical Geographic Environment, Chuzhou 239099, China
*
Author to whom correspondence should be addressed.
Agronomy 2024, 14(4), 758; https://doi.org/10.3390/agronomy14040758
Submission received: 24 February 2024 / Revised: 28 March 2024 / Accepted: 1 April 2024 / Published: 6 April 2024
(This article belongs to the Special Issue Application of Remote Sensing and GIS Technology in Agriculture)

Abstract

:
Characterized by soil moisture content and plant growth, agricultural drought occurs when the soil moisture content is lower than the water requirement of plants. Microwave remote sensing observation has the advantages of all-weather application and sensitivity to soil moisture change. However, microwave remote sensing can only invert 0~5 cm of soil surface moisture, so it cannot effectively reflect the drought situation of farmland. Therefore, this study took Henan Province as the study area, used soil moisture active and passive (SMAP) satellite soil moisture data, employed NDVI, LST, and ET as the independent variables, and took the drought grade on the sample as the dependent variable. Using the 2017–2019 data as the training set and the 2020 data as the testing set, a random forest drought monitoring model with comprehensive influence of multiple factors was constructed based on the training set data. In the process of model training, the cross-validation method was employed to establish and verify the model. This involved allocating 80% of the sample data for model construction and reserving 20% for model verification. The results demonstrated an 85% accuracy on the training set and an 87% accuracy on the testing set. Additionally, two drought events occurring during the winter wheat growing period in Henan Province were monitored, and the validity of these droughts was confirmed using on-site soil moisture and the vegetation supply water index (VSWI). The findings indicated a high incidence of agricultural drought in the southwestern part of Henan Province, while the central and northern regions experienced a lower incidence during the jointing to heading and filling stages. Subsequently, leveraging the results from the random forest drought monitoring, this study conducted a time series analysis using the Mann–Kendall test and a spatial analysis employing Moran’s I index to examine the temporal and spatial distribution of agricultural drought in Henan Province. This analysis aimed to unveil trends in soil moisture changes affecting agricultural drought, as observed via the SMAP satellite (NASA). The results suggested a possible significant spatial auto-correlation in the occurrence of agricultural drought.

1. Introduction

As a disaster occurring with high frequency, drought poses a serious threat to agricultural production, food security, ecological environment, and economic and social development [1]. Drought can be divided into four main types: meteorological drought, hydrological drought, agricultural drought, and socioeconomic drought [2]. Among these, agricultural drought refers to the phenomenon of abnormal crop growth caused by an insufficient water supply for plant growth due to changes in the soil and atmosphere [3]. Since there has been no precipitation or abnormally low precipitation in the region for a long time, the soil is short of water or dried up, and agricultural drought will lead to crop damage and even a loss of production. On a global scale, agricultural drought occurs with high frequency, and it can have a long duration and wide impact area [4]. In China, the losses caused by agricultural drought disasters account for more than 50% of agricultural natural disaster losses, and there is a trend toward gradual aggravation in the past 20 years [5,6], significantly affecting the safe production of grain in China. Therefore, developing an effective method to monitor agricultural drought has been the focus of many disciplines.
The existing methods of agricultural drought monitoring are mainly divided into monitoring agricultural drought according to the vegetation index and monitoring agricultural drought according to soil moisture. There are many methods to monitor drought based on the vegetation index. For example, Zhu et al. [7] discussed the potential application of the soil wetness deficit index (SWDI) in the drought monitoring of Xiangjiang River basin. Wei et al. [8] analyzed and compared the vegetation condition index (VCI), temperature condition index (TCI), precipitation condition index (PCI), and synthesized drought index (SDI) and showed that VCI and TCI could better monitor long-term drought conditions. Zou et al. [9] analyzed and compared the VCI, TCI, and vegetation health index (VHI), and the results showed the superiority of TCI drought monitoring’s ability versus that of VCI and VHI on both seasonal and annual scales. Liu et al. [10] evaluated 12 widely used drought indices to monitor the effects of drought on crop growth in the Shiyang River Basin. In summary, the indicative agricultural drought model established according to the vegetation index assumes that the effects of drought on crops’ physiological structure can be captured by optical remote sensing signals. Agricultural drought is a phenomenon of abnormal crop growth caused by changes in soil and meteorological conditions and insufficient water supply for plant growth. However, diseases and pests, phenology, soil fertility, and other factors will also change the physiological structure of crops, and these changes can also cause abnormal changes in the remote sensing index. Consequently, the “foreign body co-spectrum” phenomenon appears in agricultural drought inversion using optical remote sensing data [11,12,13]. Thus, a drought index model based on vegetation remote sensing index factors shows difficulty in accurately identifying agricultural drought status.
Among the existing methods for monitoring agricultural drought based on soil moisture, the soil moisture data based on site observation have high accuracy, which can be used as the “true value” to verify and correct the accuracy of remote sensing soil moisture data and model simulated soil moisture data [14,15]. This can also be directly applied to agricultural drought monitoring in the field. The traditional method for observing soil moisture is the drying method. This artificial method is time-consuming and laborious, and it is difficult to observe soil moisture continuously and synchronously in time and space. With the reduction of the cost of soil moisture sensors and the development of information transmission technology, wireless soil moisture observation networks have developed rapidly in recent years, making it possible to observe the dynamic changes in soil moisture in real time from the field or watershed and providing real-time access to distributed soil moisture sensor data [16]. Among the methods for the automatic observation of soil moisture, the electromagnetic method is a commonly used method for observing soil moisture. It measures soil moisture content by using the difference in the soil dielectric coefficient with different water contents [17], including time domain reflectometry (TDR) and frequency domain reflectometry (FDR). Because of the high accuracy of soil moisture measurements, FDR is widely used in the construction of automatic soil moisture observation networks. However, regardless of their high precision and frequency, the observation stations are distributed discretely in space, so the continuous surface soil moisture information cannot be obtained. In addition, the cost of soil moisture observation stations is high, and these factors restrict the application and popularization of soil moisture observation at stations in agricultural drought monitoring.
Using satellite remote sensing soil moisture to monitor agricultural drought is a new method developed in recent years that is more efficient in obtaining regional soil moisture data. Satellite remote sensing observation of soil moisture has the advantages of continuous space, wide observation range, and low cost, and it has become the best current means through which to observe soil moisture. Based on these advantages, researchers have carried out a large number of studies on satellite remote sensing observation of soil moisture [18,19,20]. Relevant departments have also successively released a variety of soil moisture products based on microwave satellite remote sensing data inversion, such as ASCAT, AMSR2, ESA CCI SM, SMOS, soil moisture active and passive (SMAP), and SMAP/Sentinel-1, which can provide continuous surface soil moisture information in time and space [21,22,23,24,25]. Studies have shown that SMAP soil moisture products have relatively high accuracy among the abovementioned microwave satellite remote sensing soil moisture products [26,27,28,29,30]. However, the SMAP satellite can only obtain soil moisture at a depth of about 0–5 cm from the surface layer, while the soil moisture that best expresses agricultural drought is located at a soil depth of 20–30 cm, which also limits the application of SMAP soil moisture products in agricultural drought monitoring [31,32].
In general, compared with conventional vegetation index and soil moisture monitoring techniques for agricultural drought, microwave satellite remote sensing offers the advantage of all-weather observation without geographical constraints. Remote sensing data obtained through this method provide a more realistic depiction of dynamic surface changes, enabling timely monitoring of regional agricultural drought. Furthermore, advancements in modern satellite remote sensing technology have led to the availability of vast amounts of Earth observation data with multi-spatiotemporal and multi-spectral resolutions [33,34,35,36,37]. Leveraging microwave satellite remote sensing of soil moisture presents significant potential for monitoring agricultural drought. Several scholars have conducted assessments of soil moisture and ocean salinity (SMOS) (European Space Agency) and soil moisture active passive (SMAP) satellite (NASA) soil moisture (SM) products, focusing on product accuracy and drought monitoring across the North China Plain from 2015 to 2018. Their findings indicate that SMAP generally surpasses SMOS in terms of SM data validation and drought monitoring within the North China Plain region. This suggests promising potential for SMAP in enhancing drought monitoring capabilities. Furthermore, researchers have explored the application of microwave remote sensing for drought monitoring, particularly in Senegal. Utilizing various microwave satellite-based datasets, they have demonstrated the efficacy of microwave-based approaches in accurately detecting droughts. These studies underscore the complementary role of microwave-based drought indices alongside established methodologies, offering unique insights into drought monitoring.
These investigations highlight the significance of microwave satellite-derived soil moisture products in the context of drought monitoring and provide valuable references for their utilization in agricultural drought monitoring practices. However, there is relatively limited research specifically focused on drought monitoring using microwave satellite soil moisture products in the Henan region. This indicates a potential area for further research and underscores the importance of expanding the application of microwave satellite data for drought monitoring in diverse agricultural regions. As such, this paper adopted microwave satellite remote sensing soil moisture data and built an agricultural drought monitoring model based on satellite remote sensing soil moisture, integrated the influence of multiple factors on agricultural drought, realized the monitoring of agricultural drought in Henan Province based on multi-source remote sensing data, and further studied the temporal and spatial distribution of agricultural drought in Henan Province.

2. Study Area and Datasets
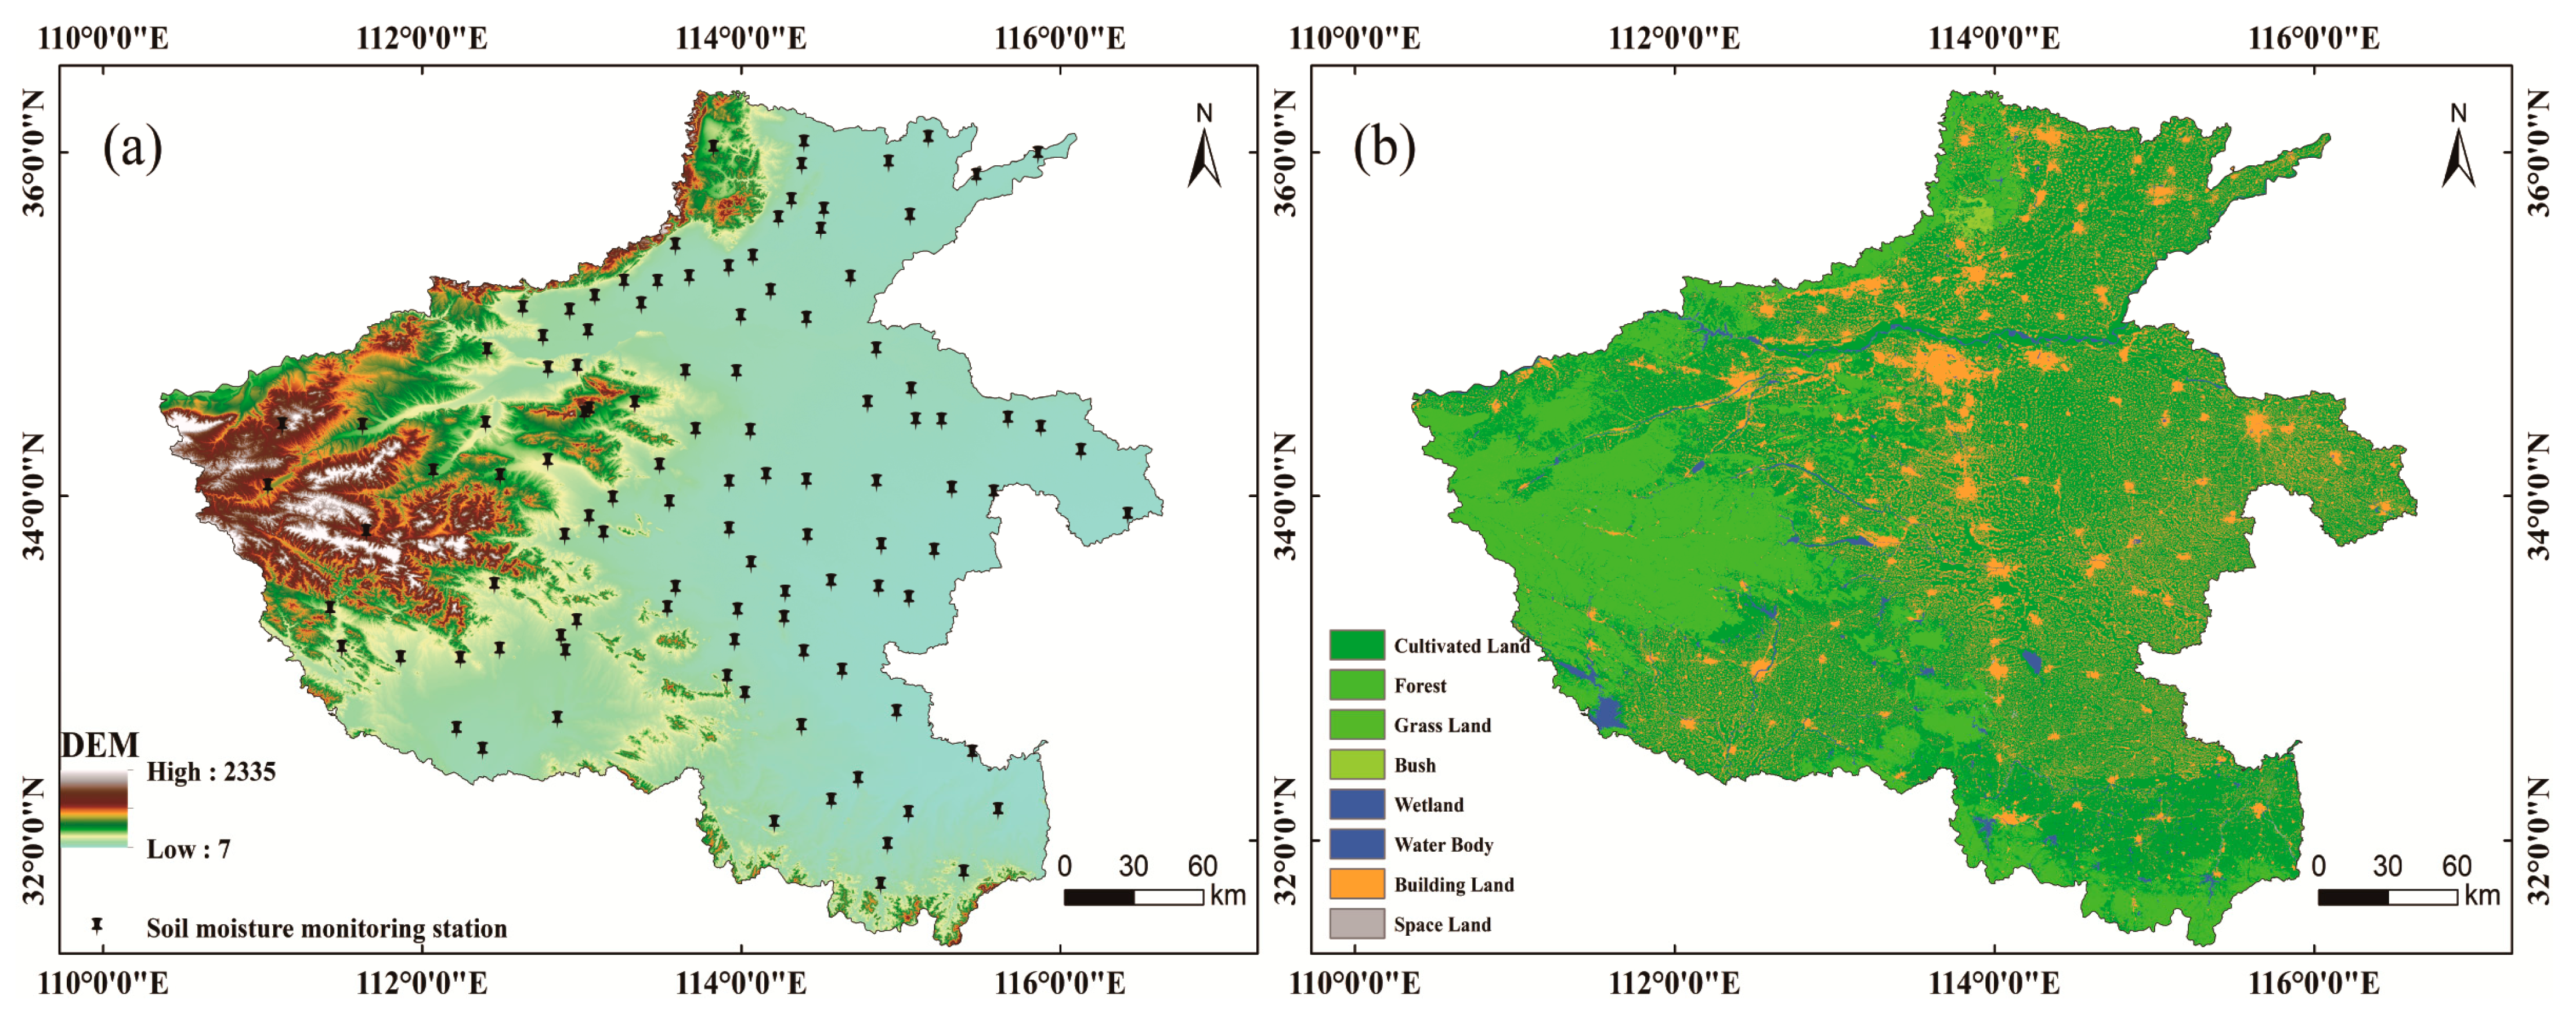
2.1. Study Area

Henan Province is located in the hinterland of the North China Plain, spanning across the Yellow River, Haihe River, Huaihe River, and Yangtze River. Most of the province is located south of the Yellow River. It covers an area of 167,000 square km2. The terrain of most of the study area is flat, with a small number of mountainous areas in the west (Figure 1a). The main type of agricultural land in Henan Province is predominantly cultivated, with winter wheat being the primary crop, interspersed with small patches of grassland and forest primarily located in the southern and western regions of the study area (as shown in Figure 1b). The study area experiences a temperate semi-moist monsoon climate, characterized by dry winters with minimal rainfall and hot, rainy summers. The average annual rainfall in the region ranges from 500 mm to 800 mm, with 60% to 80% occurring during the summer months. Throughout the winter wheat growing season, typically, 3 to 5 irrigation sessions are necessary to meet crop water requirements. In this paper, 55 automatic soil moisture monitoring stations in the study area were selected as research objects. The general picture of the study area is shown in Figure 1.

2.2. Datasets

2.2.1. SMAP L3 Passive Soil Moisture Product

NASA launched a SMAP satellite on 31 January 2015. It provided global data on soil moisture, vegetation cover, and soil temperature. The satellite, a polar sun-synchronous orbit satellite carrying an L-band radar (3 km) and an L-band radiometer (9 km and 36 km), began acquiring regular data on 31 March 2015. However, due to a hardware failure that could not be resolved, the radar was discontinued on 7 July 2015, after six weeks of operation [38]. Currently, SMAP uses only L-band (1.40 GHz) radiometer data to provide global soil moisture and freeze-thaw status data every two to three days. On ground that is not frozen or covered with water, SMAP measures the soil moisture 5 cm under the surface and uses this information to create a global soil moisture map. SMAP offers soil moisture data products with spatial grid resolutions of 3 km, 9 km, and 36 km, with approximate nominal spatial resolutions of 9 km, 33 km, and 40 km, respectively [30,39]. At present, a number of studies have confirmed the accuracy of SMAP volumetric water content estimation [40,41].
In this study, SMAP L3 passive soil moisture product data were used, with a spatial resolution of 9 km. The time resolution of the product was usually once a day, with global coverage capability. Some studies have demonstrated that the observation accuracy of the SMAP satellite at 6:00 a.m. is notably higher [42,43]. In our research, the decision to select a 9-km spatial resolution was grounded in several fundamental considerations. Soil moisture products derived from passive remote sensing of SMAP L3 typically offer various options for spatial resolution. However, for our study, we determined that a 9-km resolution best suited the geographic scope and target variables of our research. Moreover, this resolution is readily accessible on NASA’s data retrieval platform. The 9-km resolution strikes a balance between capturing adequate spatial detail and encompassing a diverse array of surface features. This enabled us to evaluate soil moisture without distortion while accommodating the complexities of surface conditions. Previous studies have also indicated that a 9-km spatial resolution generally provides sufficient information when studying surface parameters like soil moisture, and it can help mitigate noise impacts to a certain extent. Given these considerations, the selection of the 9-km spatial resolution in our study is deemed a rational decision, taking into account various factors such as research requirements, data availability, surface characteristics, and computational costs. Therefore, we utilized observation data from the SMAP satellite in the morning as the primary focus of our research. Interested parties can access the data through the following download address: https://search.earthdata.nasa.gov/search (accessed on 25 May 2023).

2.2.2. MODIS Data Products

The MODIS satellite was developed and designed by NASA and has the characteristics of multiple channels and high global coverage. The MODIS image data adopted in this paper include the normalized difference vegetation index (NDVI) product MOD13A1, evapotranspiration (ET) product MOD16A2, and land surface temperature (LST) product MOD11A1. The time-fixed number of years were 2017~2020, and the data source was as follows: https://earthengine.google.com/ (accessed on 10 June 2023). The order of magnitude units of NDVI, LST, and ET are shown in Table 1.
The extraction of NDVI, LST, ET, and other related data required the processing of multi-source remote sensing data into a unified spatial resolution and temporal resolution that was consistent with the resolution of the SMAP soil moisture data. Firstly, the remote sensing data were resampled in space to obtain the same spatial resolution remote sensing data. Then, all types of remote sensing data during the period without data were interpolated to obtain the same time-resolution data. However, for SMAP satellite soil moisture and LST, the missing values had to be filled because they are easily affected by atmosphere and clouds. For ET, due to the influence of ground cover rain and snow, it was necessary to remove some of the outliers 32,761~32,767.

2.2.3. Statistical Irrigation Data

The statistical data for agricultural water came from the water resources bulletin issued by the water conservancy department. Since 1997, China’s Ministry of Water Resources has annually released statistics based on the previous year’s water use amount for Henan Province, including domestic, industrial, and agricultural use. Since 1999, the Water Resources Department of Henan Province has also released the water use amount of each city and county based on statistical methods every year. Agricultural water in the water resources bulletin refers to agricultural forestry irrigation water and fishery aquaculture water, of which irrigation water accounts for the largest proportion, approximately 90%. For example, of the 12.28 billion m3 of agricultural water in Henan Province in 2017, 10.85 billion m3 was irrigation water. It should be noted that, with the diversification of irrigation methods, the term “irrigation water” mentioned in this study refers to the total volume of water used for all types of irrigation, including surface irrigation, drip irrigation, sprinkler irrigation, etc. When there were no statistical data on irrigation water in a region, this paper used the statistical agricultural water amount to replace the approximate water amount for irrigation in the region. Table 2 shows the statistical irrigation water amount of Henan Province from 2017 to 2020.

2.2.4. Winter Wheat Related Data

The sown area and yield of winter wheat, as reported by the statistical yearbook of Henan Province, are shown in Table 3. According to the analysis of the statistical yearbooks in 2017, 2018, 2019, and 2020, the sown area and yield of winter wheat have changed to different degrees over those four years. This paper mainly considers the impact of drought.

3. Methods

3.1. Sample Collection and Processing

The water amount in the 0–20 cm soil layer accounts for 40% to 70% of the total water amount of the entire soil layer, and it is also the main water amount soil layer. The water amount of each soil layer under different water conditions is shown in Table 4 [44]. The study of 20 cm soil moisture can directly reflect the amount of water absorbed by crops in the soil. The influence of soil moisture factors on agricultural drought refers to the drought classification standard of relative soil moisture, which is expressed as a percentage (%), and its classification is shown in Table 5.
Soil moisture content is one of the main factors affecting the water requirement of winter wheat. The crop water requirement increases with the increase in soil moisture content in a certain range and decreases with the increase of soil moisture content when the soil moisture content approaches the field water capacity for a long period of time. Therefore, soil moisture in 20 cm stations and crop water requirements at different phenological periods were selected as reference indexes to reflect the optimal agricultural drought conditions (Table 5 and Table 6).

3.2. Construction of Agricultural Drought Monitoring Model

The random forest classification algorithm offers several advantages, including its ability to discern interactions between different features, its reduced susceptibility to overfitting, relatively fast training speed, and straightforward implementation. Additionally, it can effectively handle imbalanced datasets by balancing errors. Even in scenarios where a majority of features are missing, it can still maintain accuracy. In this study, various metrics were computed for model evaluation, including accuracy, precision, f1-score, recall, macro average, and weighted average. Accuracy measures the ratio of correctly classified predictions to the total predictions. However, for imbalanced datasets, accuracy alone may be insufficient to assess the overall performance of the model. Therefore, this study also considered precision, recall, and f1-score. These metrics collectively form the confusion matrix in machine learning, with the relevant calculation equation s outlined below:
a c c u r a c y = T P + T N T P + F N + F P + T N
p r e c i s i o n = T P T P + F P
r e c a l l = T P T P + F N
f 1 s c o r e = 2 × r e c a l l × p r e c i s i o n r e c a l l + p r e c i s i o n
In Equation (4), TP (true positive) represents the number of instances where the model predicts class A and the actual class is also A. The abbreviation FP (false positive) denotes the instances where the model predicts class A, but the actual class is not A. The abbreviation FN (false negative) refers to the instances where the actual class is A, but the model predicts it as not A. The abbreviation TN (true negative) represents the instances where the actual class is not A, and the model correctly predicts it as not A.
The mechanism behind agricultural drought and its influence on agricultural systems are very complicated. It is difficult to accurately describe the state of agricultural drought and its influence by only considering soil moisture. Accordingly, this study built a random forest drought monitoring model with multiple factors. The main steps were as follows. (1) The location of soil moisture observation station in Henan Province was selected as the location of agricultural drought sampling in this study, and soil moisture data and other data at the location of sample points were collected. (2) The agricultural drought model and sample data were constructed by this study, and the agricultural drought grade on the sample was calculated. (3) SMAP satellite soil moisture, the NDVI, LST, ET data from sample points, and their unified spatial and temporal resolutions were extracted. (4) Using the random forest model, the quantitative relationship between the drought grade on the sample and the multi-source remote sensing data was mined, and the agricultural drought grade of the region was calculated accordingly. (5) The regional drought grade was used to show the spatial distribution of agricultural drought in Henan Province.
In the process of model training, the cross-validation method was adopted to establish and verify the model. Eighty percent of the sample data was selected for model construction, and 20% of the sample was used for model verification. The modeling and verification were repeated many times, and the optimal model was finally obtained. The evaluation indexes of the training set and testing set are shown in Table 7 and Table 8.
As shown in Table 7 and Table 8, there were 2201 training sets and 245 testing sets, respectively. The training set accuracy was 85%, and the testing set accuracy was 87%. The accuracy indicated that the classification accuracy of random forest was high and had a good advantage.

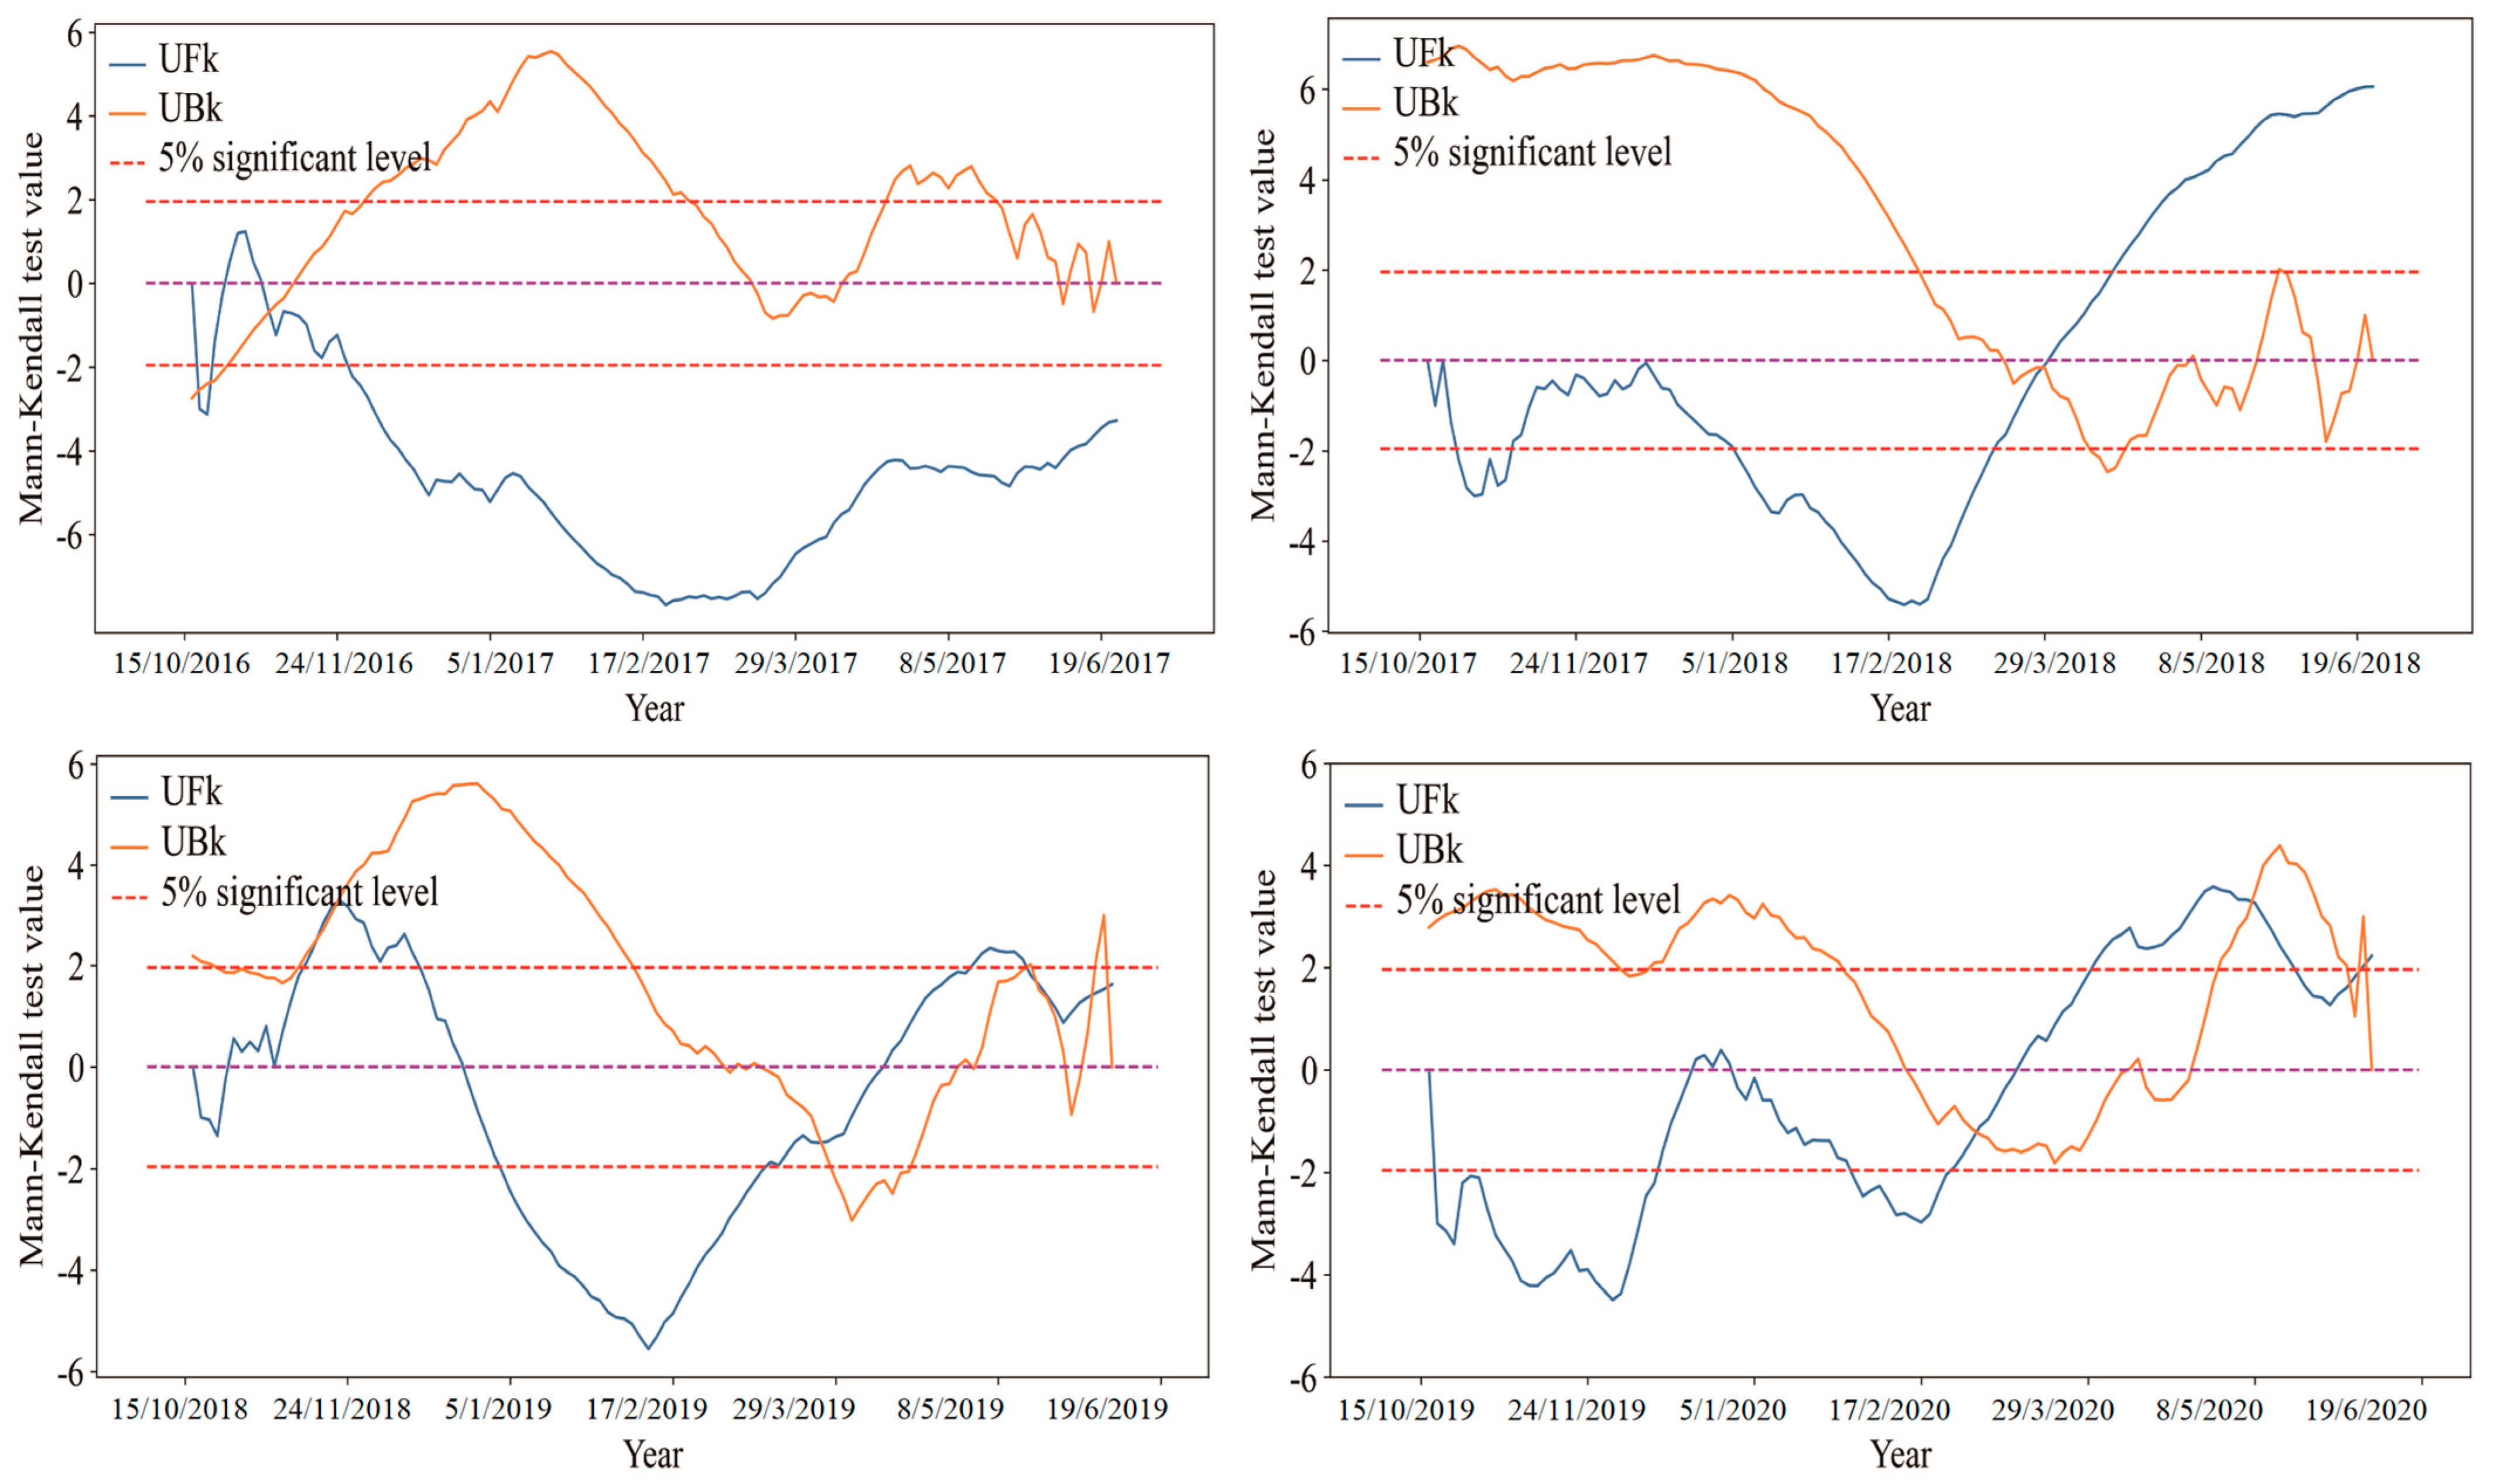
3.3. Timing Analysis Method

The Mann–Kendall test method is suitable for analyzing long-term trends and mutations in multi-source remote sensing data, and a few outliers have no influence on it. It can reveal the trend change and mutation of the entire time series. Therefore, this method has been widely used to study changing trends in agricultural drought. This method can be selected as an important reference method for the agricultural drought time series analysis.

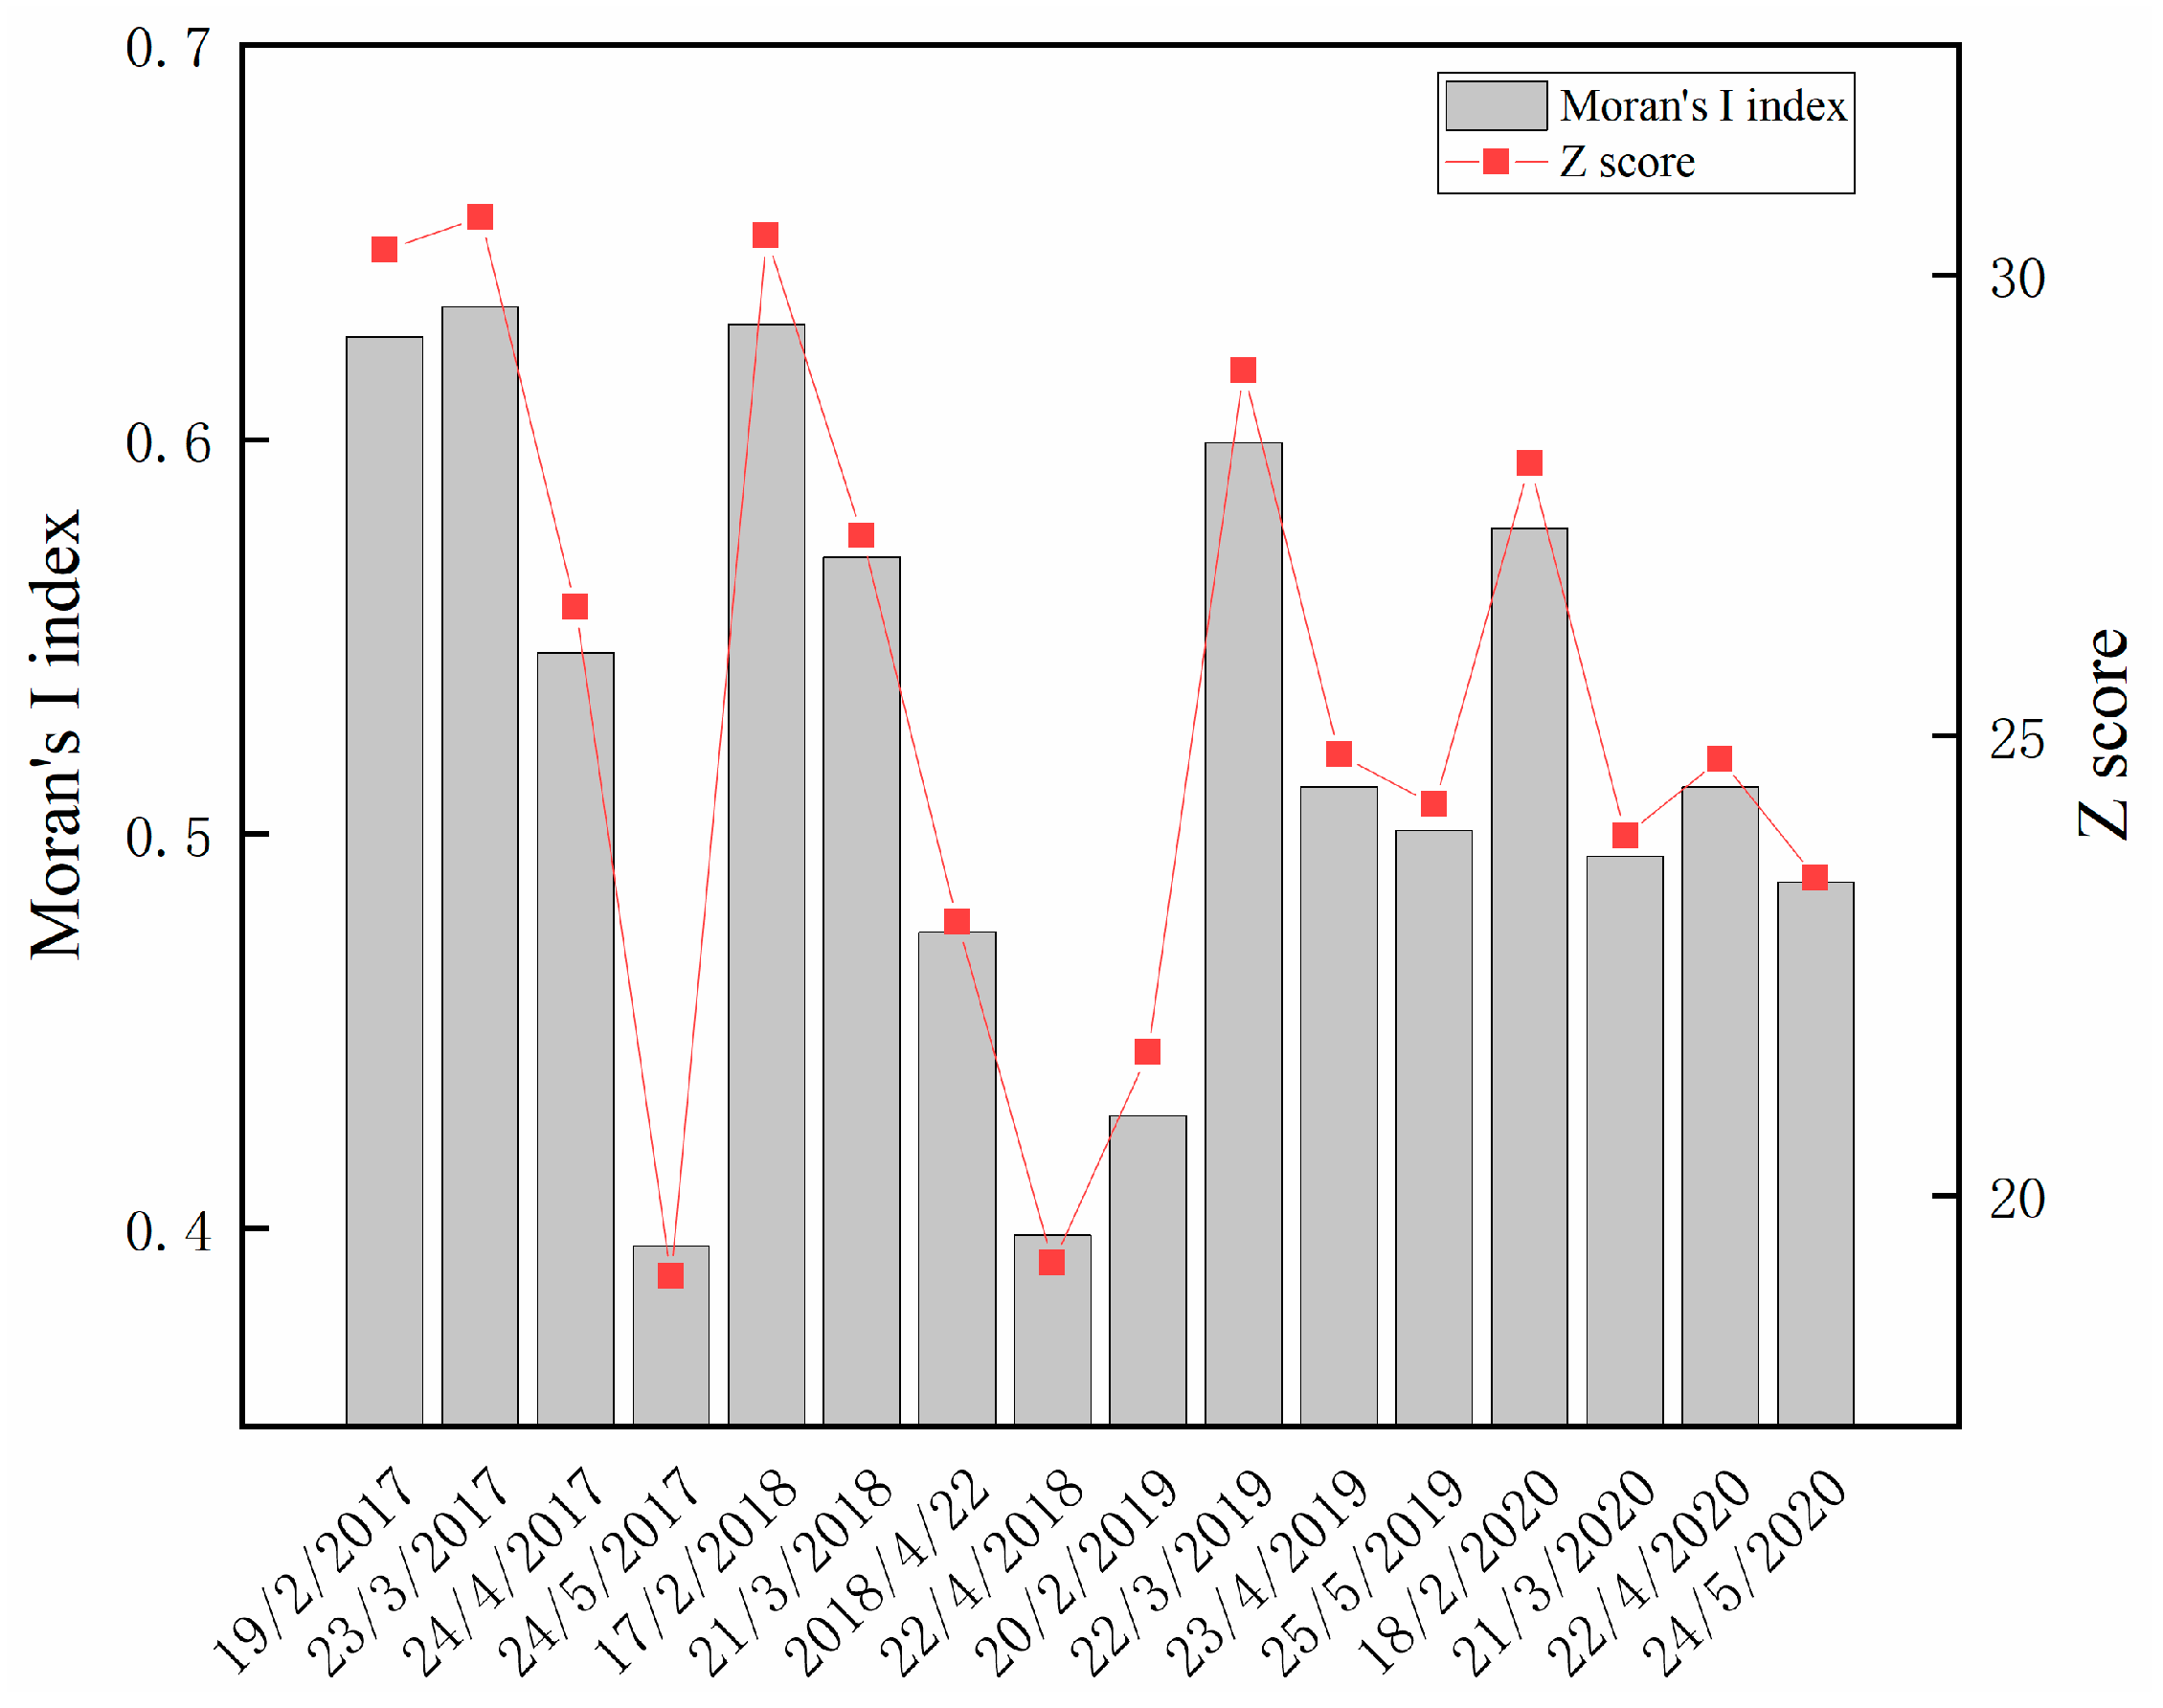
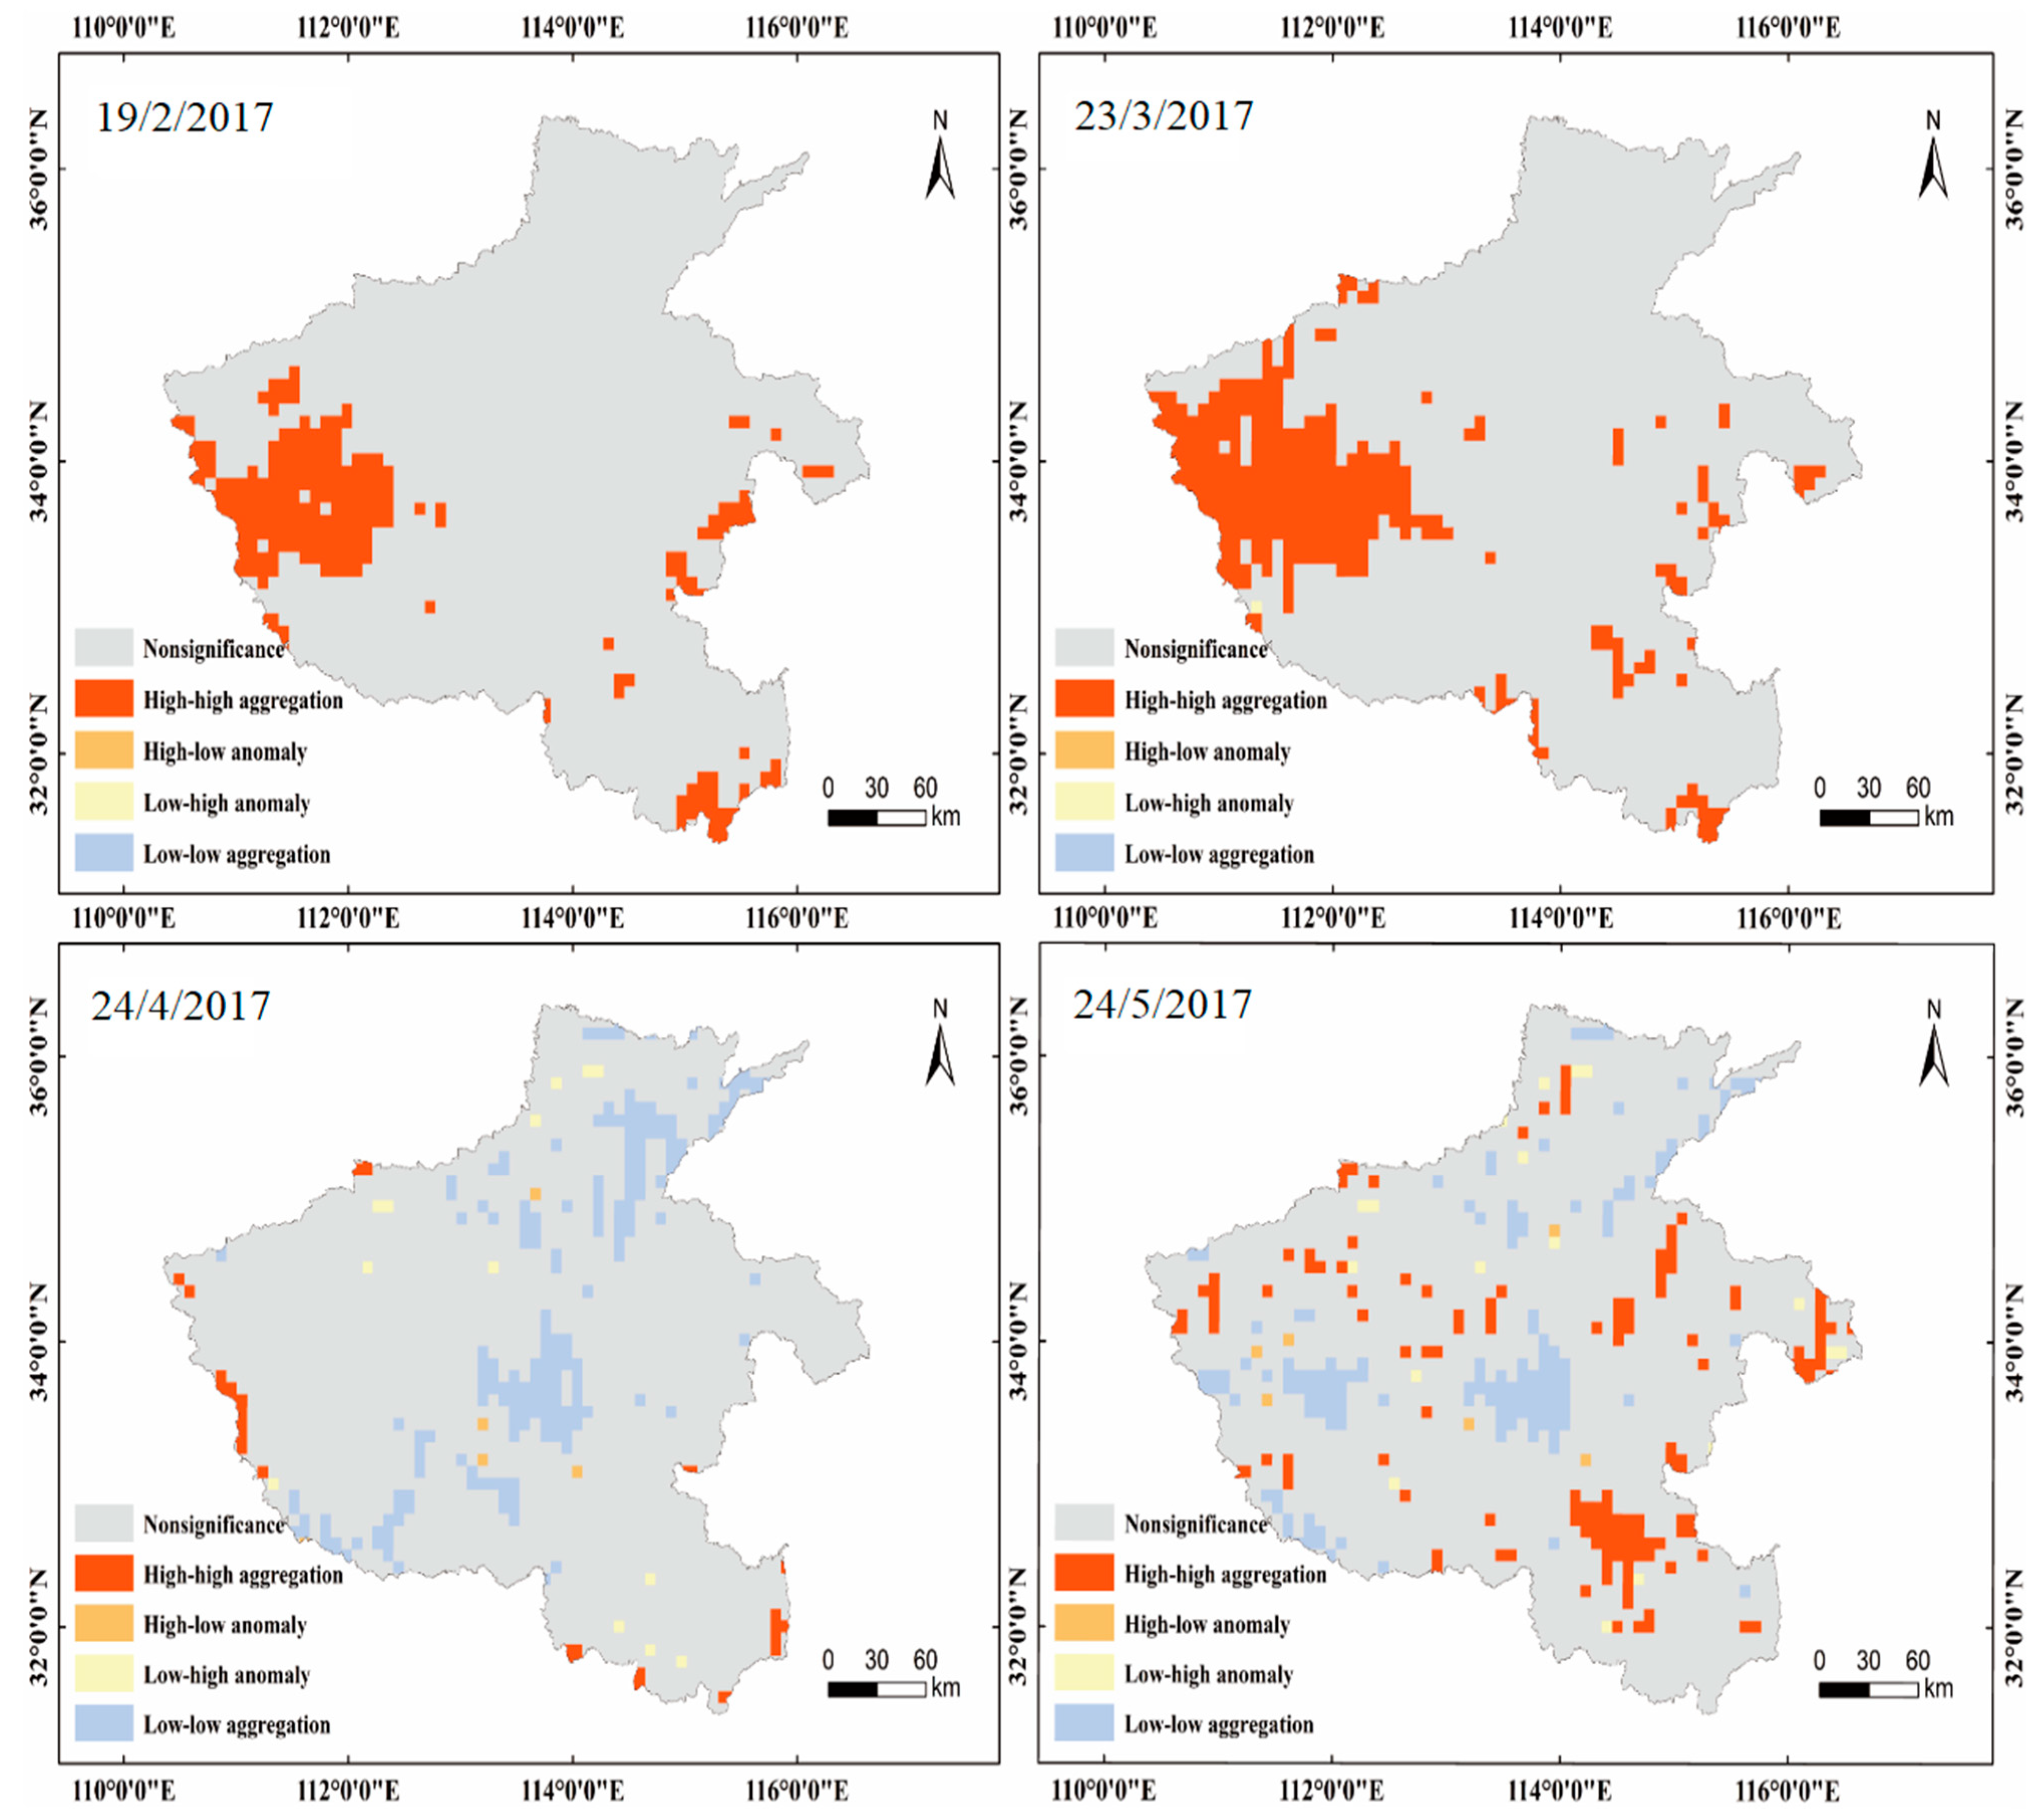
3.4. Spatial Analysis Method

Moran’s I index is a geostatistical method that is widely used to measure spatial correlation. It includes global Moran’s I (GMI) and local Moran’s I (LMI). GMI can analyze the potential spatial dependence of drought recovery time in different subregions and use a single value to reflect its spatial auto-correlation degree. The exponential distribution is shown in Table 9. The LMI index reveals the correlation between grid response units and adjacent units in drought recovery time, indicating the spatial aggregation or dispersion state. Therefore, with Henan Province as the study area, geostatistical analysis (GMI and LMI index) can be used to reveal the spatial auto-correlation of agricultural drought.

4. Results

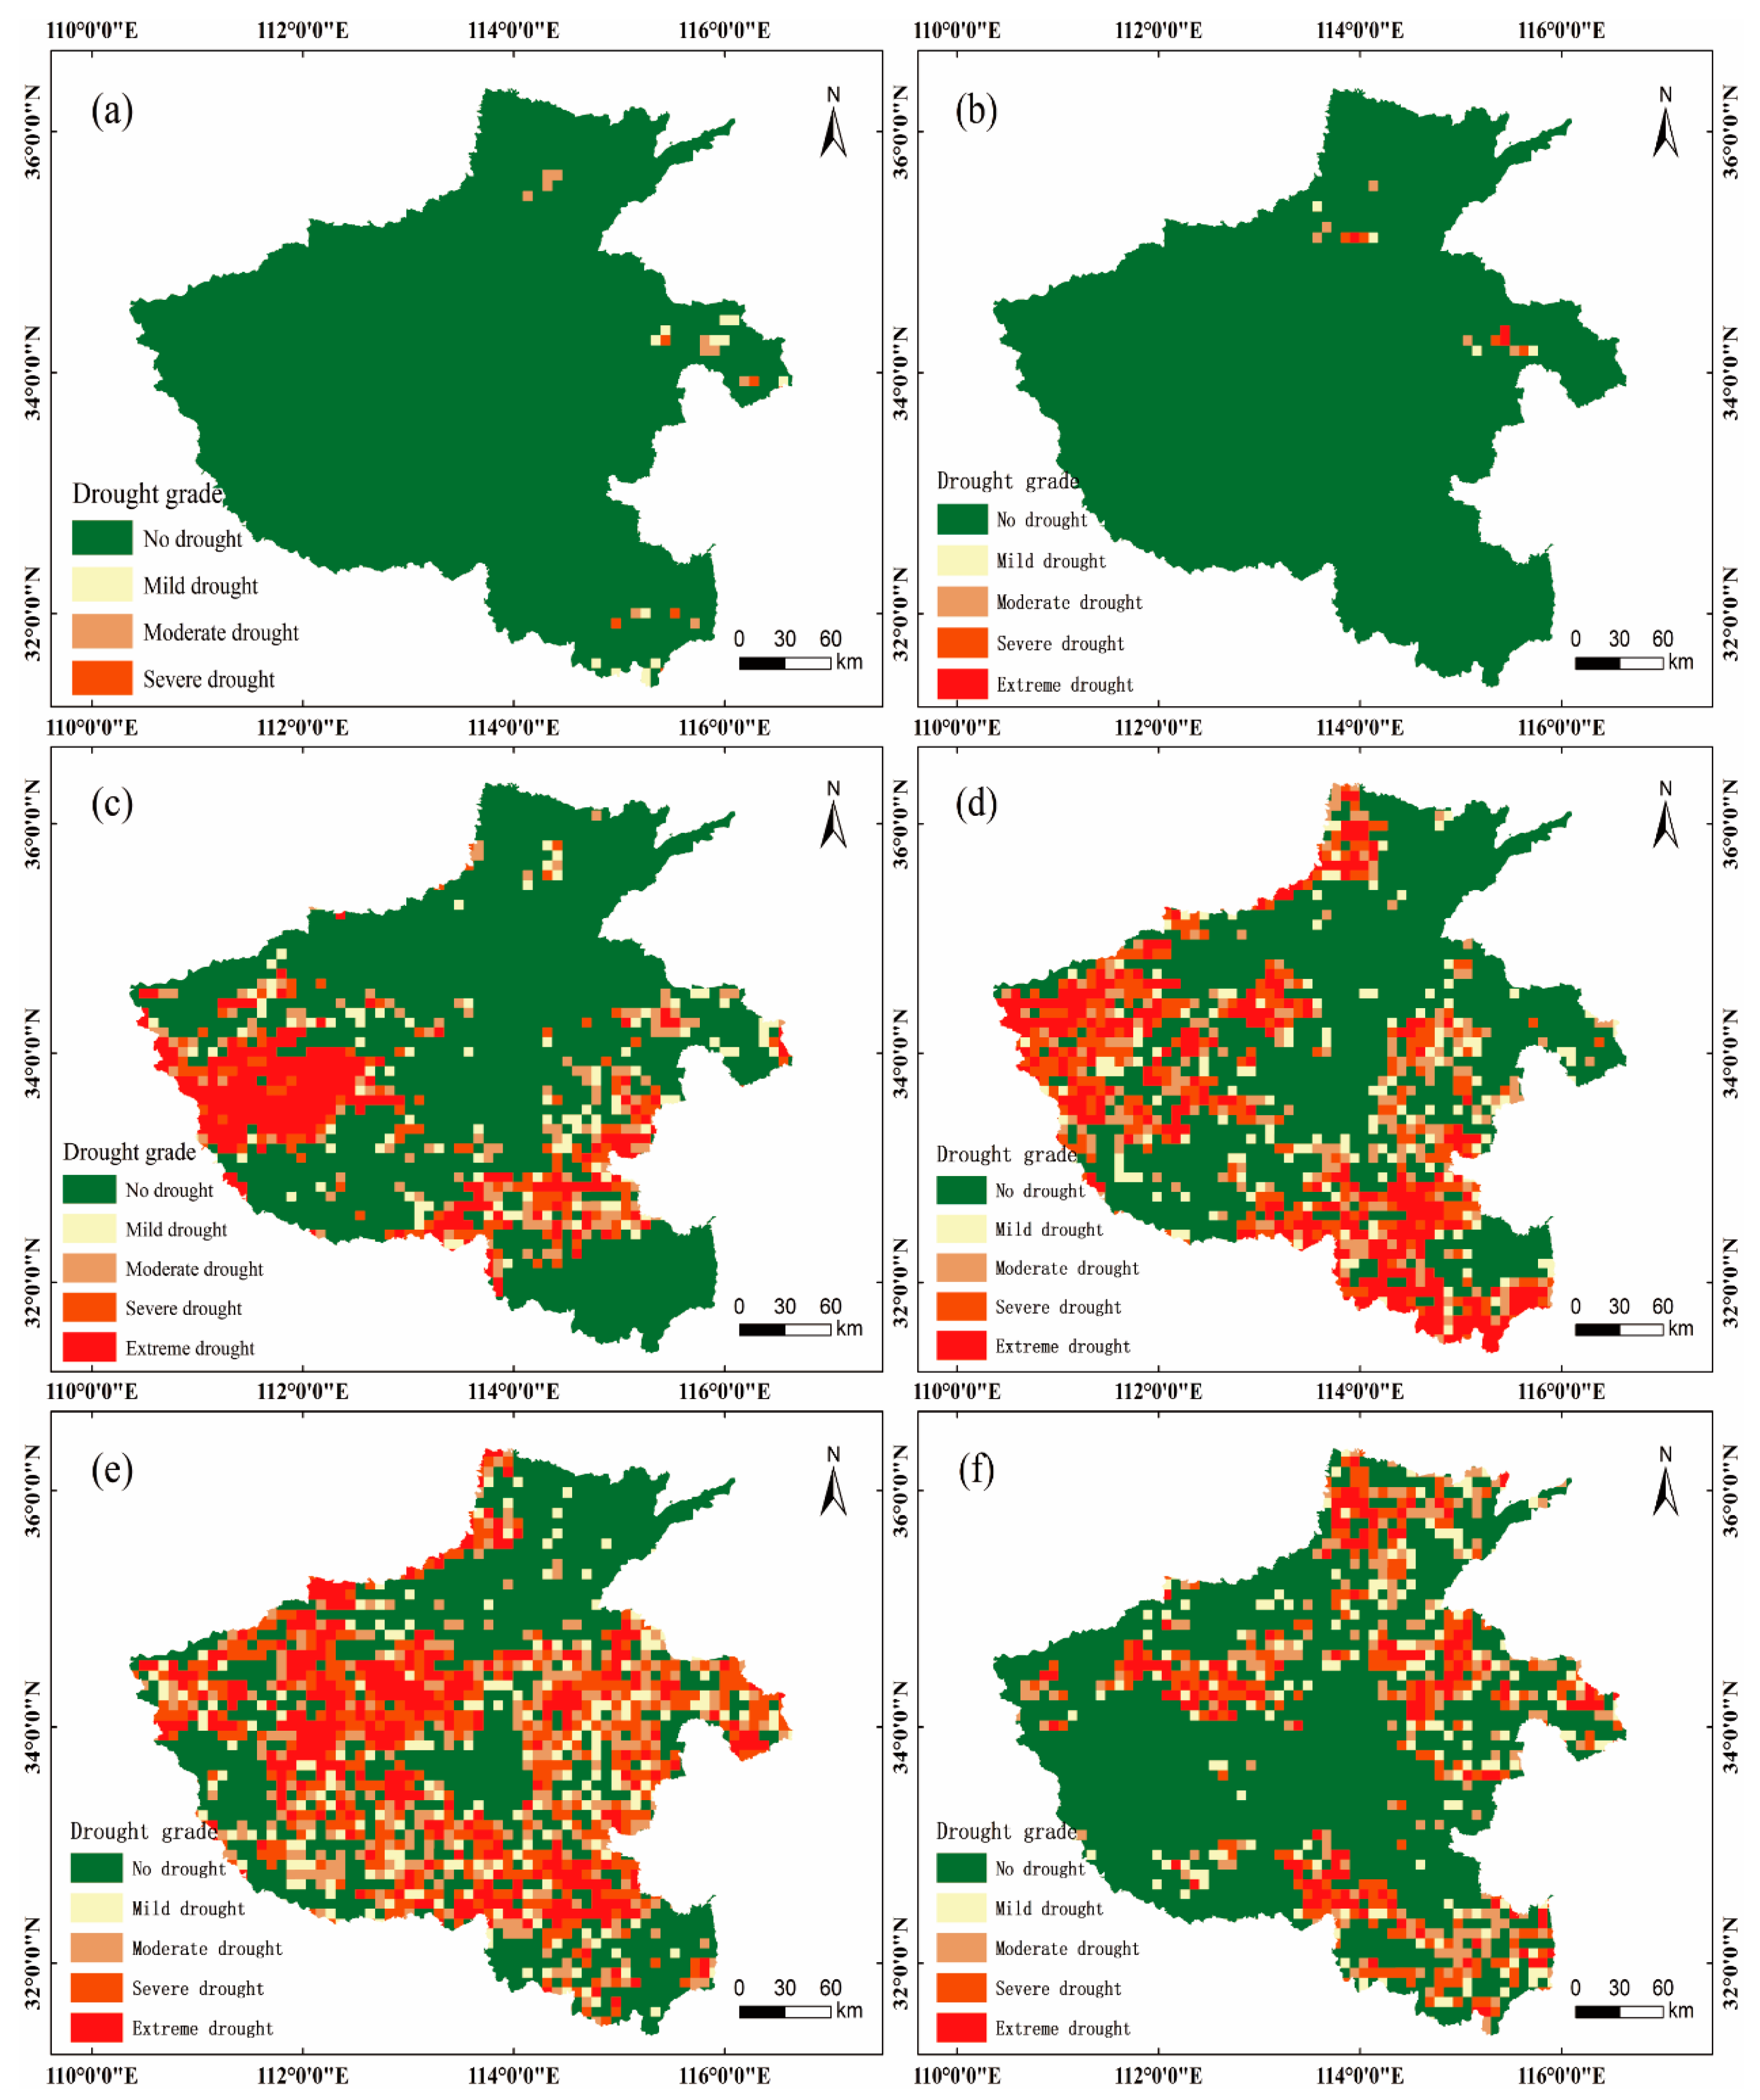
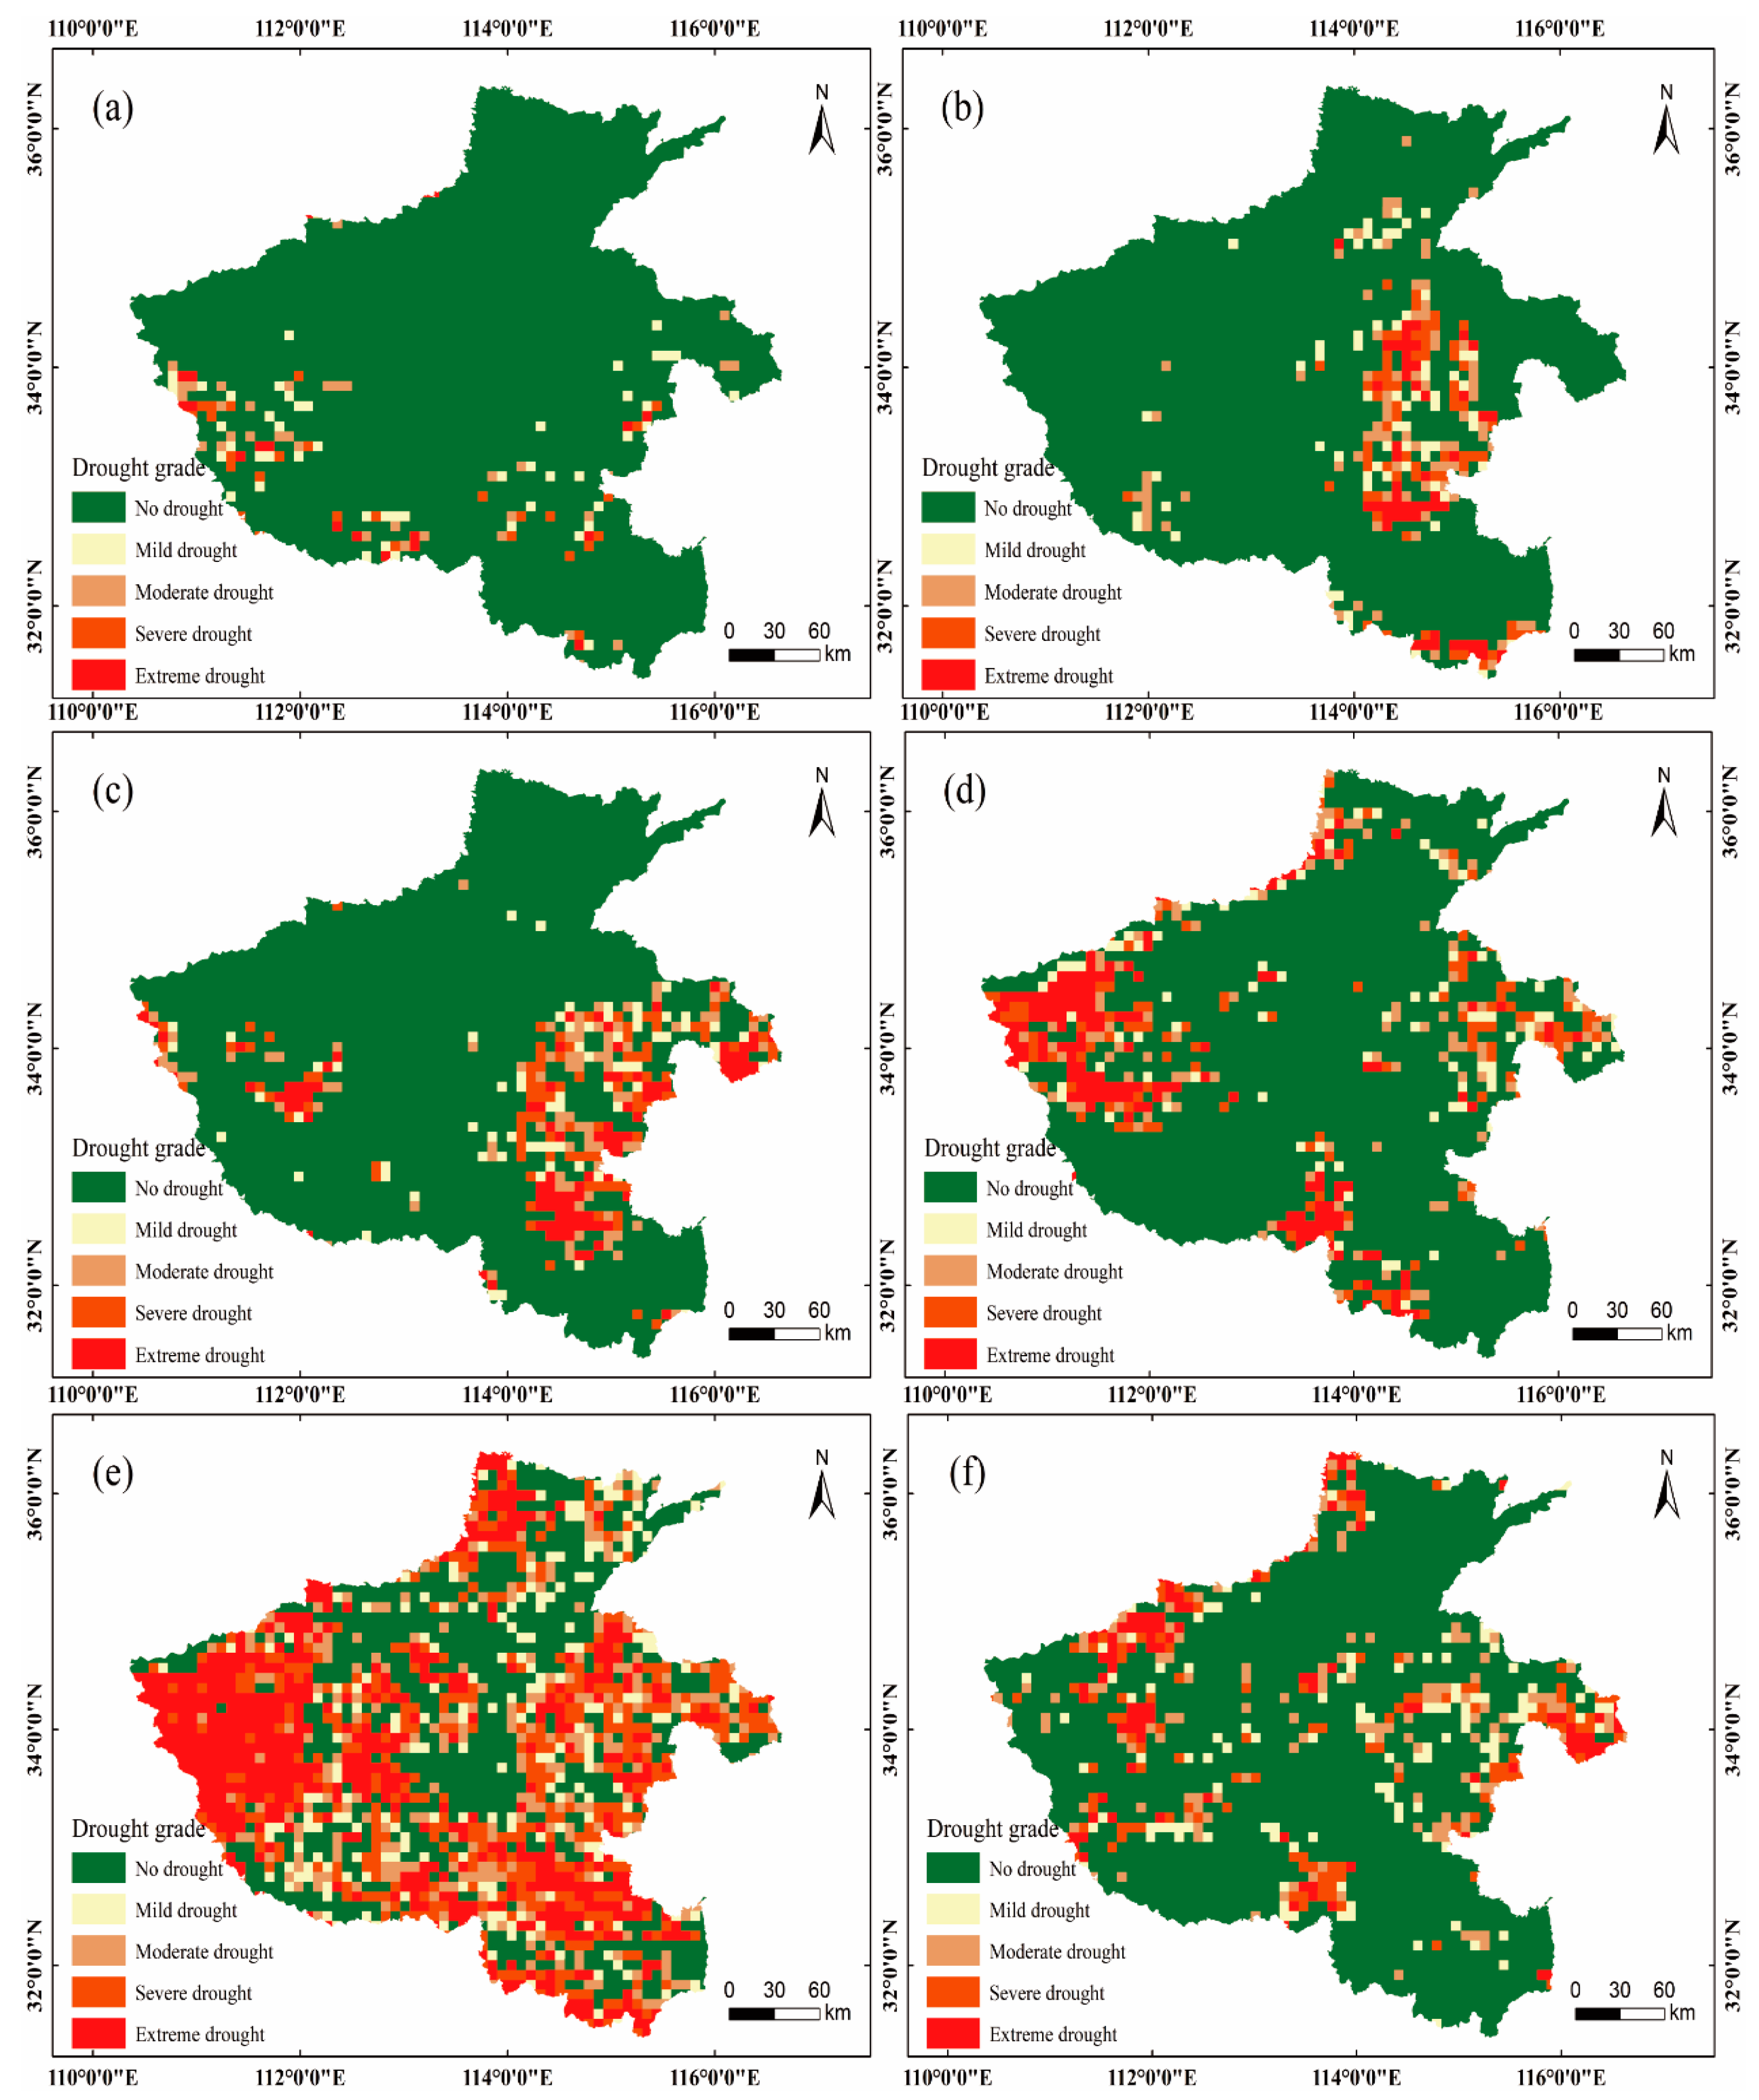
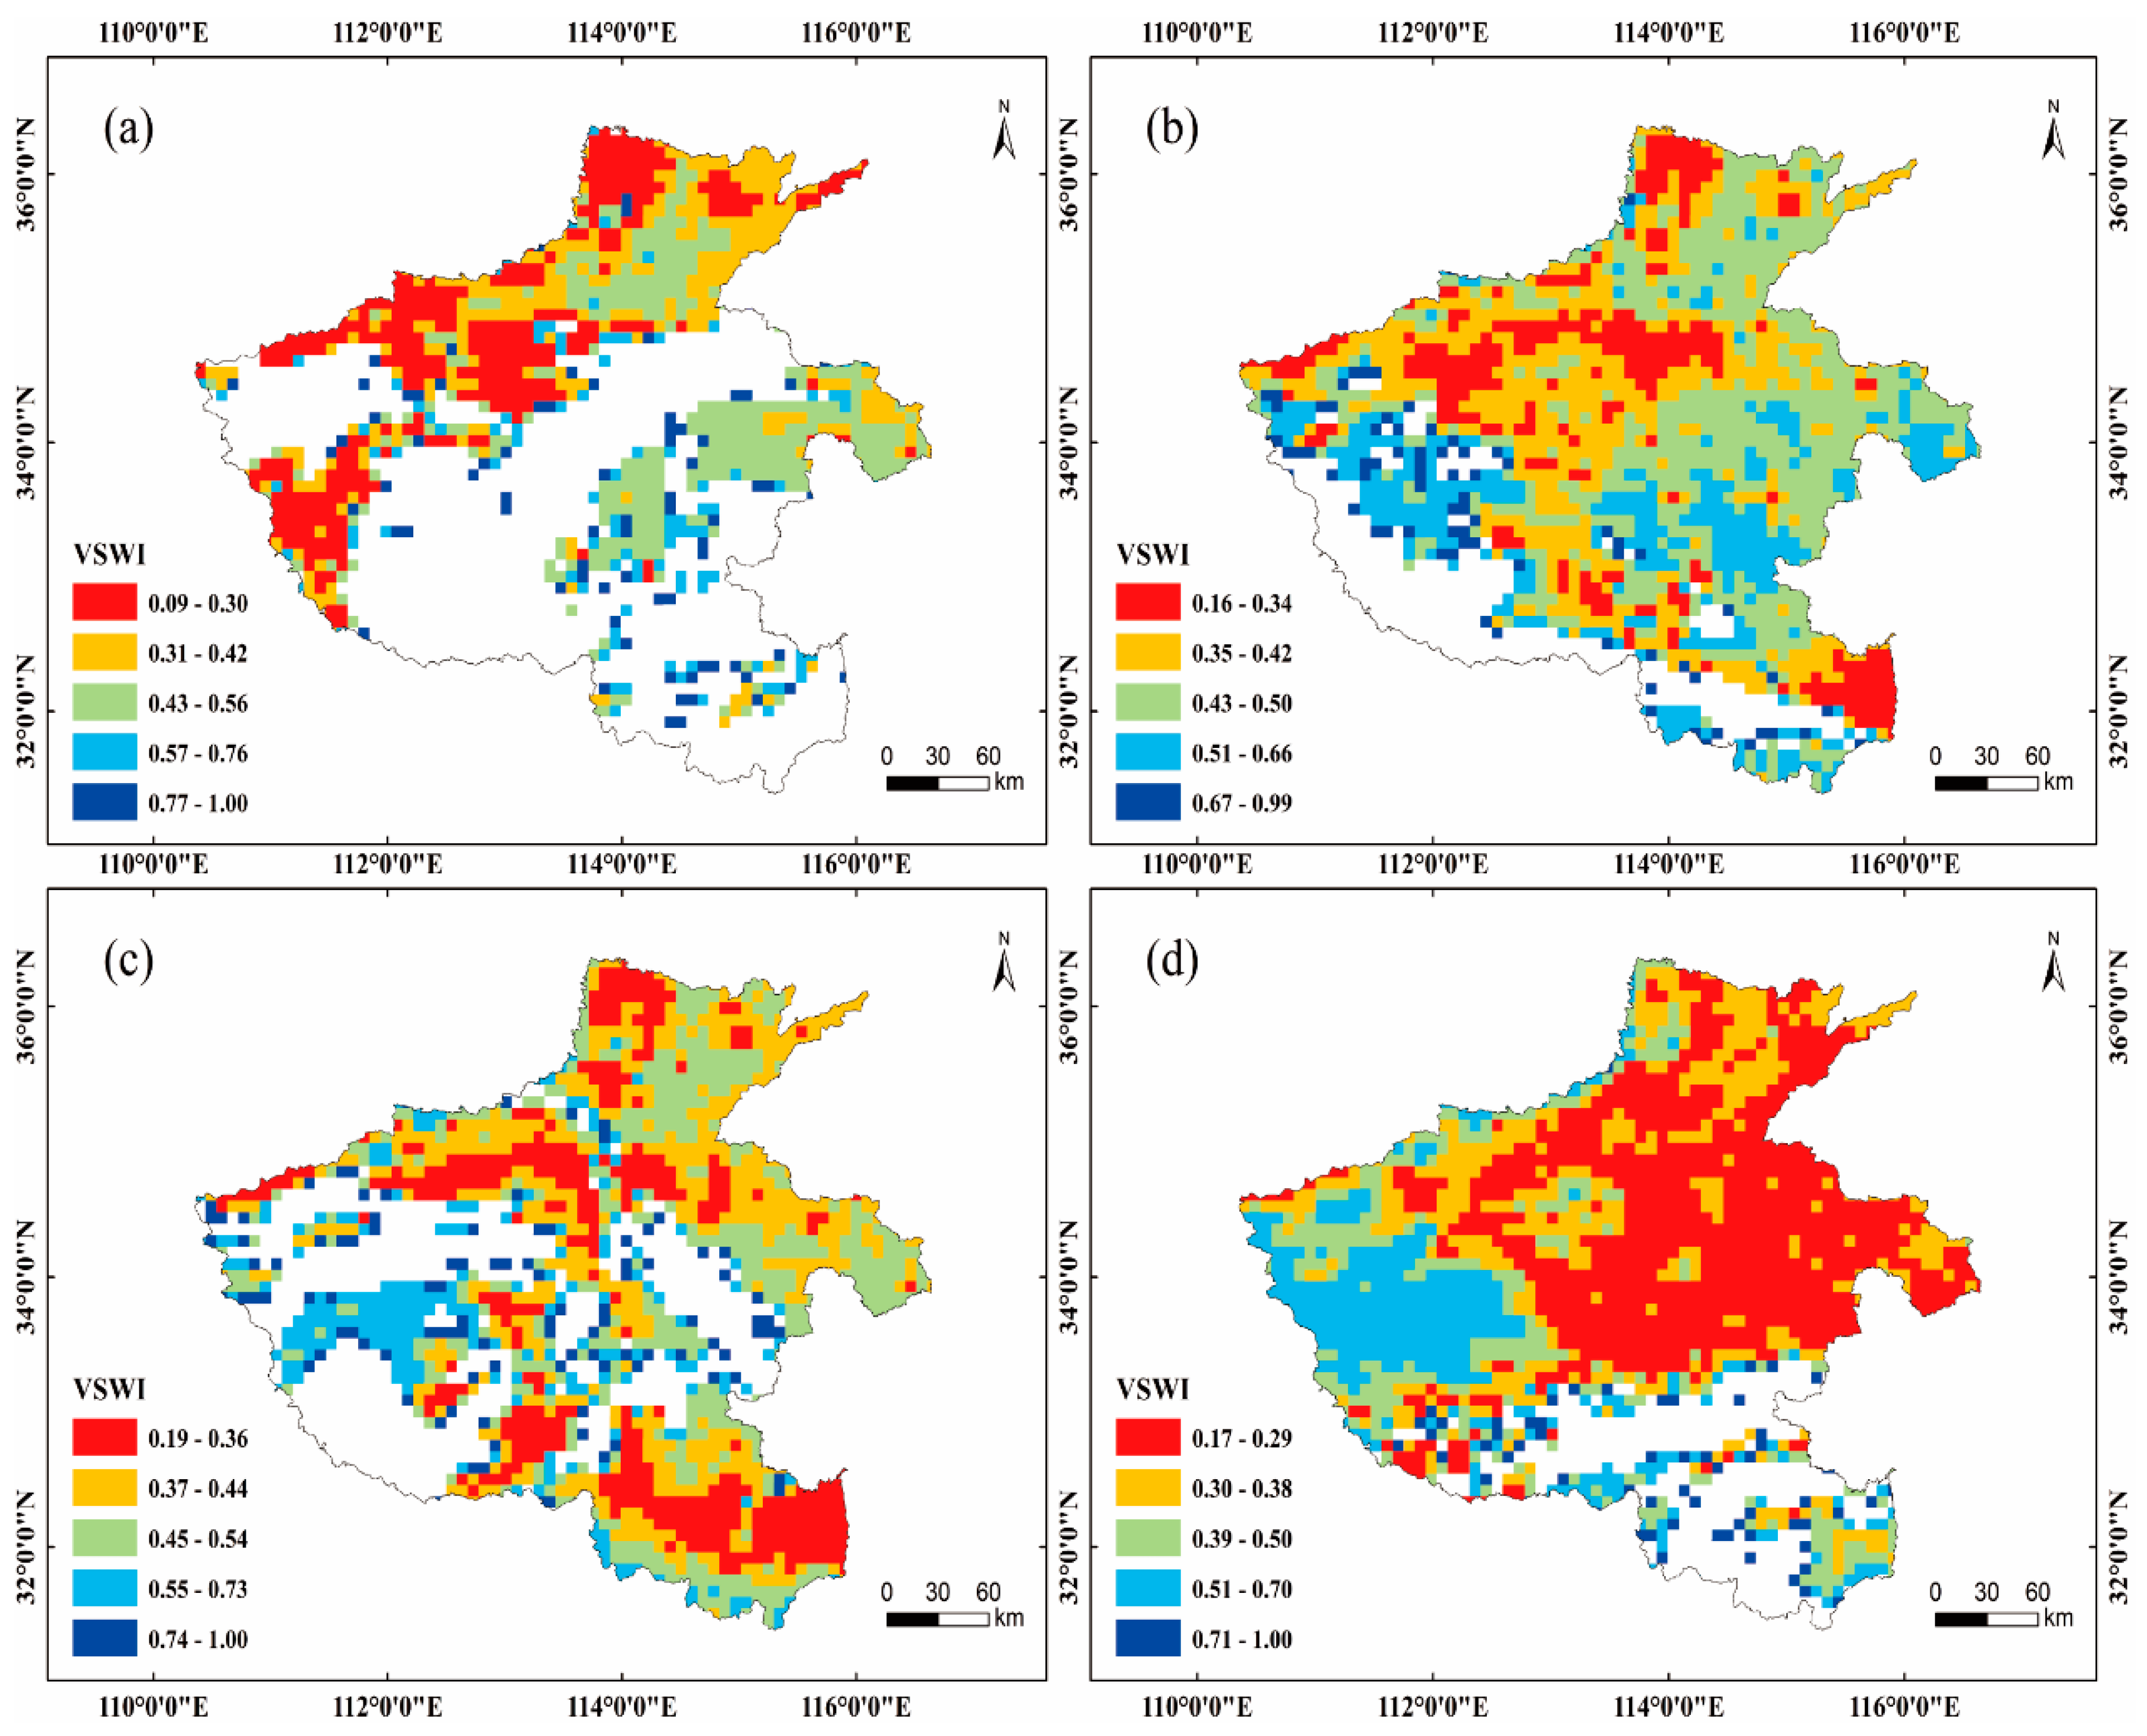
4.1. Drought Monitoring Results

This study selected drought events in Henan Province in 2018 and 2020 (Figure 2 and Figure 3). According to the results of random forest drought monitoring, the national meteorological distribution data of droughts and floods released by the National Climate Center of China Meteorological Administration, and the monthly report on agricultural meteorology in Henan Province, different degrees of drought occurred in the winter wheat growth period in Henan Province in 2018 and 2020. The following is the distribution of two drought events in the winter wheat growth period.
As shown in Figure 2, winter wheat grew during the wintering period, and there was basically no drought in a large area of Henan Province during the middle and late January of 2018. In late February, the drought in the west of Henan Province suddenly intensified, and various degrees of drought appeared in the central and southern parts of Henan Province. Among them, moderate drought and severe drought accounted for 5.6% and 5.4%, respectively, and extreme drought accounted for 11.8%. In late March, the probability of drought in the northern region was still low because the statistical irrigation water amount in Henan Province showed more irrigation water in the north and less irrigation water in the south. The drought further expanded in the southern region and showed a trend of spreading throughout Henan Province. Moderate drought and severe drought accounted for 8.5% and 12.4%, respectively, and extreme drought accounted for 15.3%. In late April, when the water demand of winter wheat reaches its maximum, the precipitation was significantly reduced, the wheat was most prone to drought during the entire growth period, and the drought distribution area of the province was the most extensive. The proportion of moderate drought and severe drought was as high as 12.3% and 17.1%, respectively, and the proportion of extreme drought was as high as 16.0%. In late May, when winter wheat was in its heading and filling period, the drought in Western China was further alleviated; moderate drought and severe drought were reduced to 7.7% and 9.6%, respectively, and moderate drought was reduced to 6.5%.
As shown in Figure 3, precipitation occurred for several consecutive days in late December 2019 and late January 2020. There was no drought in a large area of Henan Province, while only a mild drought occurred in the eastern part of Henan Province. In mid-February, during the winter wheat wintering period, the drought in the eastern region continued to worsen compared with January, and the precipitation was 1–4% less than the same period of the year. In late March, there was a severe drought in the west and south of Henan and a moderate drought in the east. In late April, during the jointing period for winter wheat, the water demand of winter wheat was large and a large area of drought occurred in Henan Province, accounting for 25.8% of the occurrence of extreme drought. The precipitation in the province continued to be low, and the temperature was higher than usual. The drought situation had a great change compared with March, making the drought situation in the region worse than that in March. In late May, the drought in Henan Province was significantly alleviated, and several days of continuous precipitation occurred. The areas of severe drought and above were mainly distributed in Jiyuan, Shangqiu, and other places.
In general, the occurrence of drought is a gradual process, and the occurrence of drought is often accompanied by a change in soil moisture. Therefore, the amount of soil moisture is a direct variable reflecting agricultural drought. In addition, affected by the growth state of vegetation, crops will also show different drought conditions. So, soil moisture and the vegetation index can be used to verify the agricultural drought.

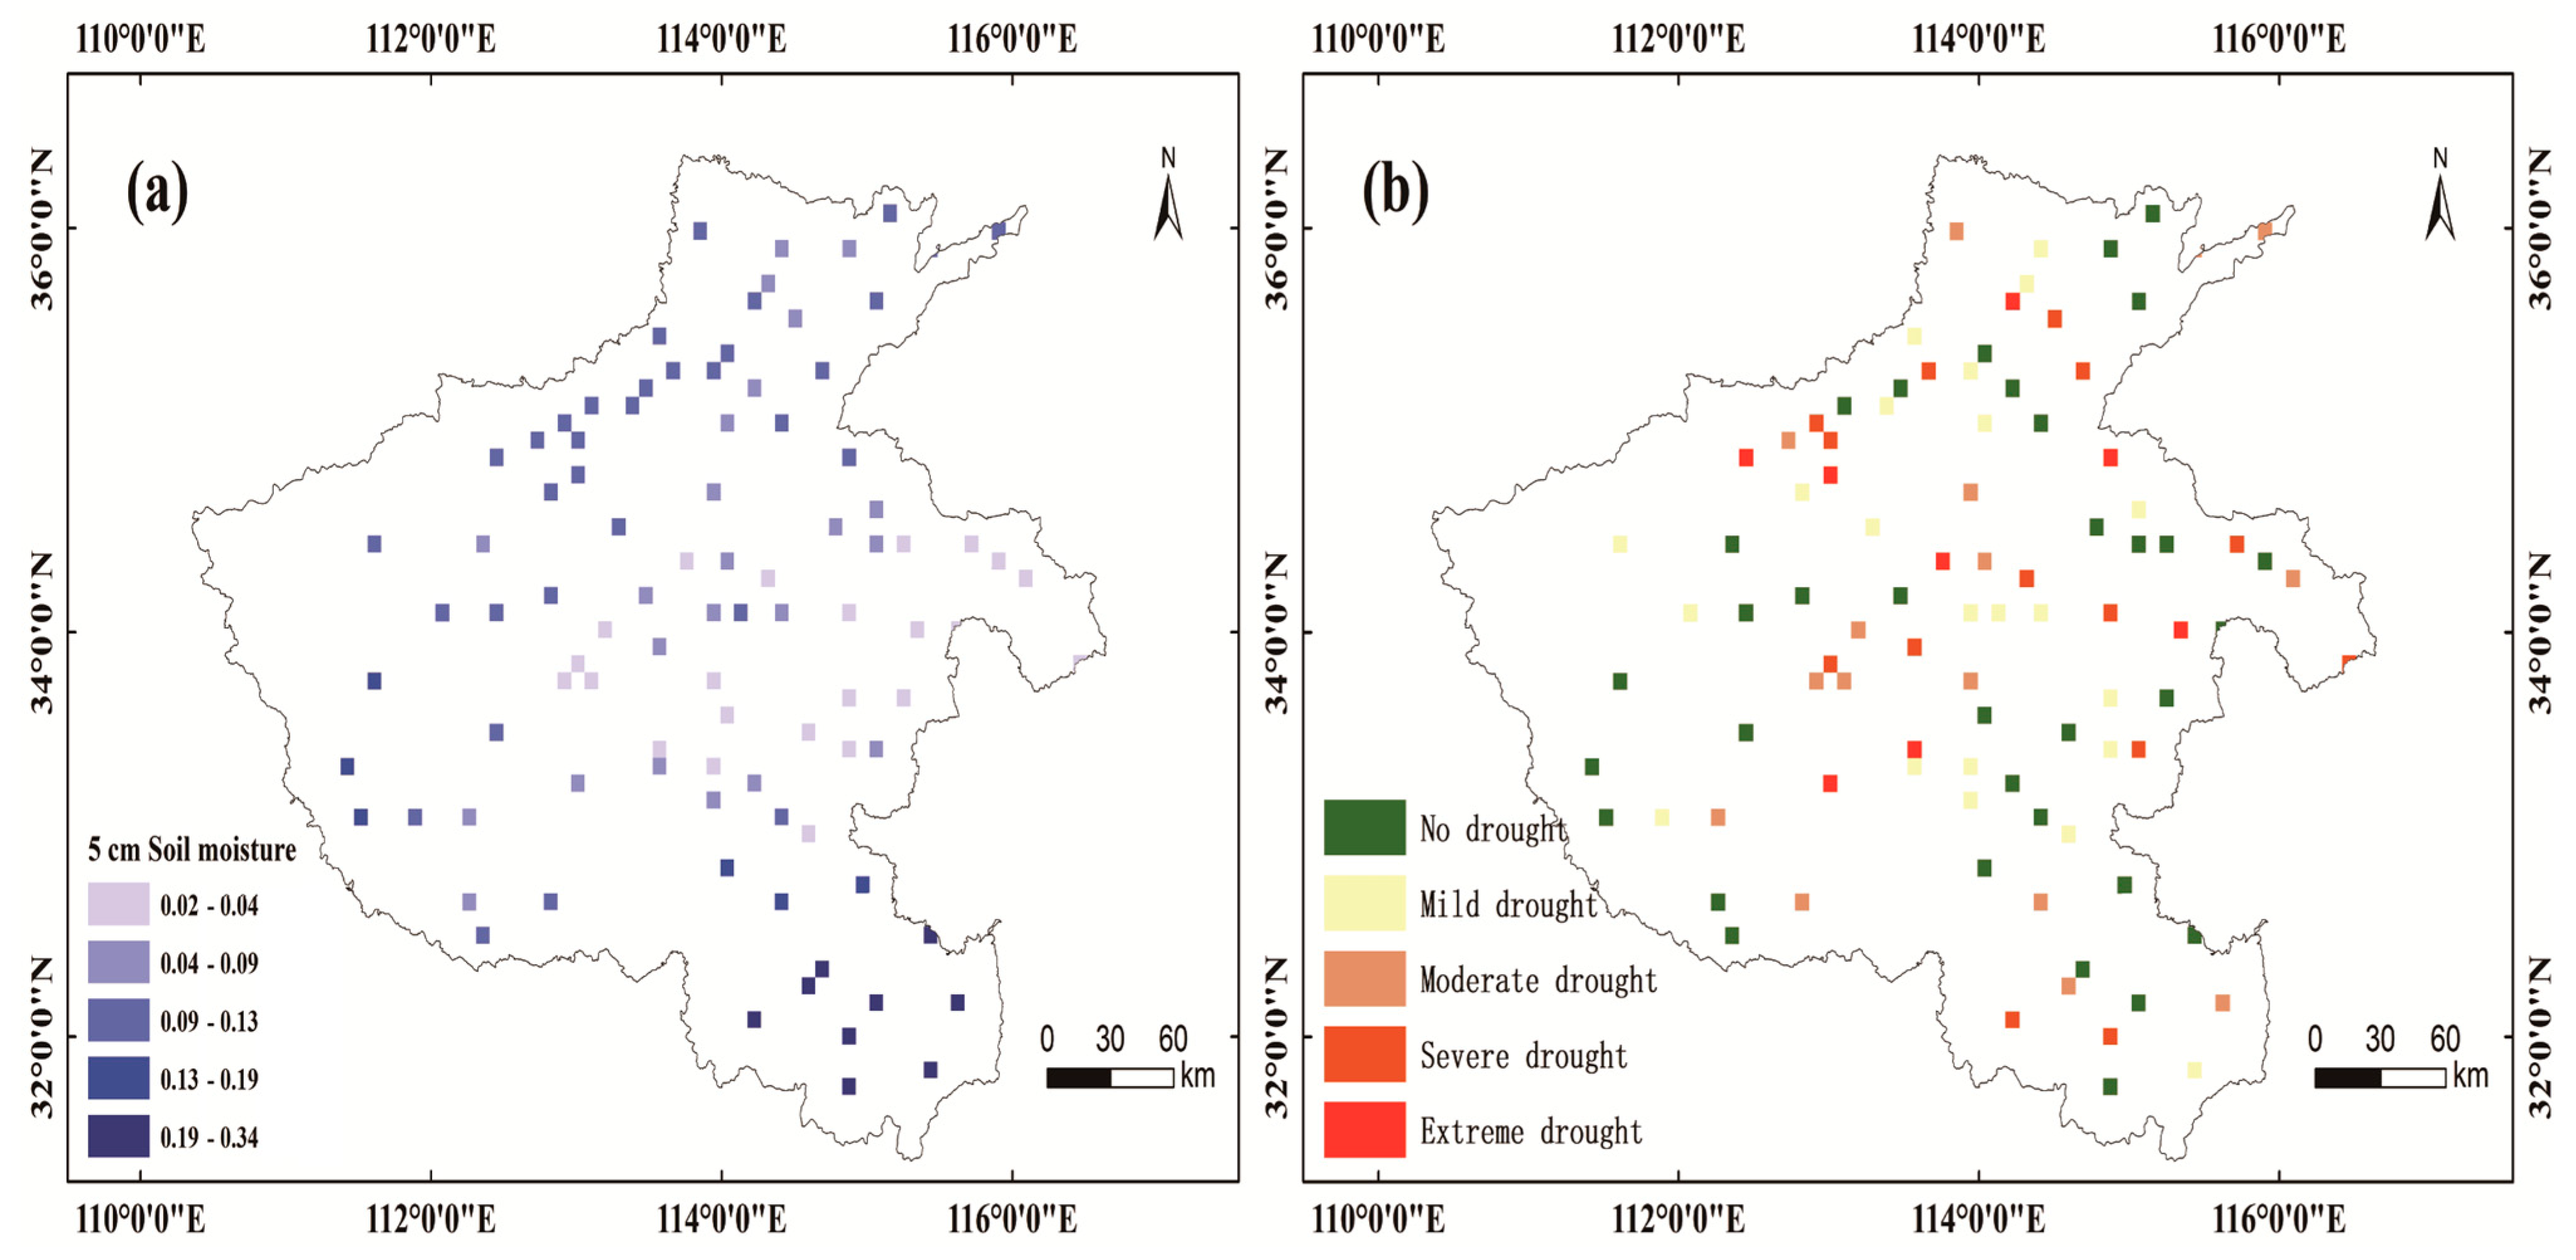
4.2. Verification of Site Soil Moisture

The soil moisture data from 55 strategically positioned soil moisture monitoring stations within the study area were collected, with all farmland soil moisture monitoring stations strategically placed to align with the agricultural production environment. During the data collection process, these monitoring stations acquired two types of data: soil volumetric water content and relative water content within 1 m of the surface. Soil moisture readings were obtained at intervals of 10 cm starting from 10 cm below the surface, utilizing time domain reflectometry (TDR) sensors. The soil moisture monitoring data at these stations were provided by the agricultural weather station of the local meteorological bureau. Based on the soil moisture data obtained from the soil moisture observation stations in the study area, the agricultural drought status at each station was assessed, thereby validating the accuracy of agricultural drought calculation using this research methodology.
Figure 4a displays the satellite soil moisture of a specific day during the growth period of winter wheat. It reveals a significant contrast in soil moisture content between the northern and southern regions of Henan Province, with higher levels observed in the former and lower levels in the latter. In Figure 4b, the drought grade divided by the soil moisture of the 20 cm site is depicted. While the southern region of Henan Province appears to be free from drought, a severe drought was evident in the central region. According to the Pearson correlation coefficient, the soil moisture of the 5 cm satellite data negatively correlated with the drought grade at the site. Therefore, it was evident that the monitoring of agricultural drought by soil moisture at the site displayed some accuracy.

4.3. Verification of Vegetation Supply Water Index

The vegetation supply water index is a method used to monitor drought based on the vegetation index and land surface temperature. This method comprehensively considers the response of crops in different reflection bands under the influence of drought and has the advantages of clear physical meaning and easy parameter acquisition. This index can be used to verify the accuracy of drought. Generally, the smaller the value, the lower soil moisture content, and the more severe drought grade in the region. In contrast, the larger the value, the higher soil moisture content and the less obvious the drought grade. Therefore, this study combined the local data of Henan Province because relevant national departments do not have strict criteria for classifying drought grade based on the vegetation supply water index (Table 10, Figure 5).
According to the change trend of VSWI during the growth period of winter wheat, excluding the influence of a null value or outlier value on the result, VSWI ranged from 0.09 to 1 on a certain day in March. A lower VSWI in the western part of Henan Province indicated that the soil water content in the region was lower and drought was more severe, while a higher VSWI in the eastern part of Henan Province indicated that the possibility of water stress was lower and the degree of agricultural drought less severe (Figure 5a). On a certain day in April, the VSWI ranged from 0.16 to 0.99, and the VSWI in Luoyang, Zhengzhou, and Xinyang was small and prone to drought (Figure 5b). The VSWI ranged between 0.19 and 1 on a certain day in early May, when winter wheat was heading and drought occurred in Xinyang, Zhengzhou, and other places as usual (Figure 5c). Figure 5d shows the VSWI values for a day in late May, with an overall range of 0.17 to 1. A large area of the VSWI value was low in the central and northern regions, indicating that large-scale agricultural drought had occurred, while a large area of VSWI value was between 0.51 and 0.70 in the western region, indicating that the occurrence of drought in the western region had slowed down. In general, compared with the monitoring results of the random forest model, the vegetation supply water index better verified the rationality of the drought monitoring results.

5. Discussion

To further explore the practical application of the model, the spatiotemporal evolution law of winter wheat drought monitoring in Henan Province was studied. The growth period of winter wheat in Henan Province was analyzed using the Mann–Kendall test of time series analysis and Moran’s I index of space analysis, and the change trends of agricultural drought in the growth period of winter wheat in Henan Province was studied from the perspective of time and space (Figure 6 and Figure 7).
The Mann–Kendall test was conducted on the surface microwave satellite soil moisture SMAP of the winter wheat growing period in Henan Province from 2017 to 2020. Given the significance level of 0.05, UFk is the standard normal distribution in the figure, and UBk is the reverse sequence of UFk. If there is an intersection point between the two curves, UFk and UBk, then the moment corresponding to the intersection is the beginning of the mutation. If Z > 0, then there is an upward trend in the time series, and vice versa. This passes the 95% confidence level when |Z| > 1.96. As shown in Figure 6, during the growth period of winter wheat in Henan Province from 2017 to 2020, the UFk curve significantly exceeded a significant horizontal line of 0.05. So, the change trend was relatively significant; there were more intersection points of UFk and UBk, and it showed obvious mutation points. Taking 2018 and 2020 as examples, two drought events occurred around 26 March 2018 and 13 March 2020 respectively, indicating that the degree of drought evolution was more drastic at this time.
As shown in Figure 7, Moran’s I index of global spatial auto-correlation in all regions was greater than 0.3 and was significant at a 99% confidence level. This finding means that the occurrence of agricultural drought has a significant spatial auto-correlation.
Taking the growth period of winter wheat in 2017 as an example, Figure 8 shows that the results of the local spatial auto-correlation test in most regions of Henan Province were non-significant. These data indicate little difference in the occurrence of agricultural drought between neighboring regions, while there was a significant high–high aggregation phenomenon in the western region on 19 February 2017 and 23 March 2017, indicating that the occurrence of agricultural drought in this region was significantly higher than that in neighboring regions and was significant at a 99% confidence level. On 24 April 2017 and 24 May 2017, there was a low–low aggregation phenomenon in central Henan Province, indicating that the occurrence of agricultural drought in this region was significantly lower than that in neighboring regions.

6. Conclusions

This study initially proposed a method for monitoring agricultural drought by SMAP satellite surface soil moisture data. However, due to the complexity of agricultural drought, relying only on soil moisture to monitor agricultural drought has certain limitations. Therefore, this study developed a random forest drought monitoring model with comprehensive multi-factor influence and considered the influence of various related factors for agricultural drought from multiple dimensions. The rationality of the drought monitoring results was verified through the verification of site soil moisture and the vegetation supply water index, and the spatiotemporal distribution of winter wheat in Henan Province was further studied.
The method proposed in this study is operable and requires more types of data, so it can be applied to agricultural drought monitoring research in large areas. According to the research results, the following conclusions can be drawn: (1) The original resolution of SMAP soil moisture products is 36 km, and the enhanced SMAP soil moisture products are 9 km. The enhanced SMAP soil moisture products used in this study have relatively high accuracy. (2) The comprehensive consideration of soil moisture at 20 cm stations and water requirements of winter wheat at different phenological periods as reference indexes can reflect the best agricultural drought accuracy. (3) Taking the two drought events as an example, the water demand of winter wheat was the largest around late April. Southwest Henan Province was the area with the highest incidence of agricultural drought, and the proportion of extreme drought in 2018 and 2020 was as high as 16.0% and 25.8%. Affected by precipitation and irrigation, the central and northern part of Henan Province had a low incidence area of agricultural drought. (4) From the perspective of time, the temporal variation trend of SMAP satellite soil moisture affecting agricultural drought during the winter wheat growth period was revealed. (5) From the perspective of space, the global spatial auto-correlation Moran’s I index of Henan Province was greater than 0.3, and was significant at a 99% confidence level, indicating that the occurrence of agricultural drought had a significant spatial auto-correlation.
The method proposed in this study presents an effective agricultural drought monitoring approach, particularly beneficial for regions lacking robust agricultural monitoring facilities. The monitoring and prediction of regional droughts provide crucial information for decision-makers and agricultural producers, enabling them to make informed choices. These include devising irrigation strategies, optimizing resource allocation, and enhancing resilience to agricultural disasters.

Author Contributions

Conceptualization, L.Z.; methodology, L.Z.; software, G.T.; validation, L.Z.; formal analysis, L.Z.; investigation, L.Z.; resources, L.Z.; data curation, L.Z. and G.T.; writing—original draft preparation, L.Z. and G.T.; writing—review and editing, L.Z.; visualization, L.Z.; supervision, L.Z.; project administration, L.Z. All authors have read and agreed to the published version of the manuscript.

Funding

This research was funded by the Foundation of Anhui Province Key Laboratory of Physical Geographic Environment, P.R. China (Grant No. 2022PGE002), Natural Science Foundation of Jiangsu Province (Grant No. BK20230603), Postdoctoral Research Funding Program of Jiangsu Province (Grant No. 2020Z223), and the Project of Green Yang and Golden Phoenix, the National Natural Science Foundation of China (Grant No. 41771478).

Informed Consent Statement

Informed consent was obtained from all subjects involved in the study.

Data Availability Statement

All data included in this study are available upon request by contact with the corresponding author.

Conflicts of Interest

The authors declare no conflict of interest.

References

  1. Dai, A. Drought under global warming: A review. Wiley Interdiscip. Rev. Clim. Chang. 2011, 2, 45–65. [Google Scholar] [CrossRef]
  2. Mishra, A.K.; Singh, V.P. A review of drought concepts. J. Hydrol. 2010, 391, 202–216. [Google Scholar] [CrossRef]
  3. Sanchez, N.; González-Zamora, Á.; Martínez-Fernández, J.; Piles, M.; Pablos, M. Integrated remote sensing approach to global agricultural drought monitoring. Agric. For. Meteorol. 2018, 259, 141–153. [Google Scholar] [CrossRef]
  4. Zhang, Y.; Liu, X.; Jiao, W.; Zeng, X.; Xing, X.; Zhang, L.; Yan, J.; Hong, Y. Drought monitoring based on a new combined remote sensing index across the transitional area between humid and arid regions in China. Atmos. Res. 2021, 264, 105850. [Google Scholar] [CrossRef]
  5. Food and Agriculture Organization Nations (FAO). Statistical Database of the Food and Agricultural Organization of the United Nations; FAO: Rome, Italy, 2013. [Google Scholar]
  6. Jiang, T.; Su, X.; Singh, V.P.; Zeng, X.; Xing, X.; Zhang, L.; Yan, J.; Hong, Y. A novel index for ecological drought monitoring based on ecological water deficit. Ecol. Indic. 2021, 129, 107804. [Google Scholar] [CrossRef]
  7. Zhu, Q.; Luo, Y.; Xu, Y.-P.; Tian, Y.; Yang, T. Satellite soil moisture for agricultural drought monitoring: Assessment of SMAP-derived soil moisture deficit index in Xiang River Basin, China. Remote Sens. 2019, 11, 362. [Google Scholar] [CrossRef]
  8. Wei, W.; Zhang, J.; Zhou, L.; Xie, B.; Zhou, J.; Li, C. Comparative evaluation of drought indices for monitoring drought based on remote sensing data. Environ. Sci. Pollut. Res. 2021, 28, 20408–20425. [Google Scholar] [CrossRef] [PubMed]
  9. Zou, L.; Cao, S.; Sanchez-Azofeifa, A. Evaluating the utility of various drought indices to monitor meteorological drought in Tropical Dry Forests. Int. J. Biometeorol. 2020, 64, 701–711. [Google Scholar] [CrossRef] [PubMed]
  10. Liu, W.; Ma, S.; Feng, K.; Gong, Y.; Liang, L.; Tsubo, M. The Suitability Assessment of Agricultural Drought Monitoring Indices: A Case Study in Inland River Basin. Agronomy 2023, 13, 469. [Google Scholar] [CrossRef]
  11. Zhu, L.; Liu, J.; Zhu, A.; Duan, Z. Spatial evaluation of L-band satellite-based soil moisture products in the upper Huai River basin of China. Eur. J. Remote Sens. 2019, 52, 194–205. [Google Scholar] [CrossRef]
  12. Wu, R.; Liu, Y.; Xing, X. Evaluation of evapotranspiration deficit index for agricultural drought monitoring in North China. J. Hydrol. 2021, 596, 710–720. [Google Scholar] [CrossRef]
  13. Cao, M.; Chen, M.; Liu, J.; Liu, Y. Assessing the performance of satellite soil moisture on agricultural drought monitoring in the North China Plain. Agric. Water Manag. 2022, 263, 107450. [Google Scholar] [CrossRef]
  14. Robinson, D.A.; Campbell, C.S.; Hopmans, J.W.; Hornbuckle, B.K.; Jones, S.B.; Knight, R.; Ogden, F.; Selker, J.; Wendroth, O. Soil moisture measurement for ecological and hydrological watershed-scale observatories: A review. Vadose Zone J. 2008, 7, 358–389. [Google Scholar] [CrossRef]
  15. Dorigo, W.A.; Wagner, W.; Hohensinn, R.; Hahn, S.; Paulik, C.; Xaver, A.; Gruber, A.; Drusch, M.; Mecklenburg, S.; van Oevelen, P.; et al. The international soil moisture network: A data hosting facility for global in situ soil moisture measurements. Hydrol. Earth Syst. Sci. 2011, 15, 1675–1698. [Google Scholar] [CrossRef]
  16. Babaeian, E.; Sadeghi, M.; Jones, S.B.; Montzka, C.; Vereecken, H.; Tuller, M. Ground, proximal and satellite remote sensing of soil moisture. Rev. Geophys. 2019, 57, 530–616. [Google Scholar] [CrossRef]
  17. Seneviratne, S.I.; Corti, T.; Davin, E.L.; Hirschi, M.; Jaeger, E.B.; Lehner, I.; Orlowsky, B.; Teuling, A.J. Investigating soil moisture-climate interactions in a changing climate: A review. Earth-Sci. Rev. 2010, 99, 125–161. [Google Scholar] [CrossRef]
  18. Mladenova, I.E.; Bolten, J.D.; Crow, W.; Sazib, N.; Reynolds, C. Agricultural drought monitoring via the assimilation of SMAP soil moisture retrievals into a global soil moisture balance model. Front. Big Data 2020, 3, 10. [Google Scholar] [CrossRef]
  19. Luo, S.; Cao, X.; Yang, P.; Zhao, N. Dedicated satellite remote sensing combined with global navigation satellite system data used to remotely measure the status of land desertification. J. Appl. Remote Sens 2022, 16, 015501. [Google Scholar] [CrossRef]
  20. Ma, Y.; Zhu, W.; Zhang, Z.; Chen, H.; Zhao, G.; Liu, P. Fusion level of satellite and UAV image data for soil salinity inversion in the coastal area of the Yellow River Delta. Int. J. Remote Sens. 2022, 43, 7039–7063. [Google Scholar] [CrossRef]
  21. Kerr, Y.H.; Waldteufel, P.; Richaume, P.; Wigneron, J.P.; Ferrazzoli, P.; Mahmoodi, A.; Al Bitar, A.; Cabot, F.; Gruhier, C.; Juglea, S.E.; et al. The SMOS soil moisture retrieval algorithm. IEEE Trans. Geosci. Remote Sens. 2012, 50, 1384–1403. [Google Scholar] [CrossRef]
  22. Peng, J.; Niesel, J.; Loew, A.; Zhang, S.; Wang, J. Evaluation of Satellite and Reanalysis Soil Moisture Products over Southwest China Using Ground-Based Measurements. Remote Sens. 2015, 7, 15729–15747. [Google Scholar] [CrossRef]
  23. Tian, Y.; Xu, Y.; Wang, G. Agricultural drought prediction using climate indices based on Support Vector Regression in Xiang jiang River basin. Sci. Total Environ. 2018, 622, 126057. [Google Scholar]
  24. Sehgal, V.; Gaur, N.; Mohanty, B.P. Global flash drought monitoring using surface soil moisture. Water Resour. Res. 2021, 57, e2021WR029901. [Google Scholar] [CrossRef]
  25. Zhu, L.; Wu, H.; Li, M.; Dou, C.; Zhu, A.-X. Estimation of Irrigation Water Use by Using Irrigation Signals from SMAP Soil Moisture Data. Agriculture 2023, 13, 1709. [Google Scholar] [CrossRef]
  26. Kerr, Y.H.; Waldteufel, P.; Wigneron, J.-P.; Delwart, S.; Cabot, F.; Boutin, J.; Escorihuela, M.-J.; Font, J.; Reul, N.; Gruhier, C.; et al. The SMOS mission: New tool for monitoring key elements of the global water cycle. Proc. IEEE 2010, 98, 666–687. [Google Scholar] [CrossRef]
  27. Pierdicca, N.; Pulvirenti, L.; Fascetti, F.; Crapolicchio, R.; Talone, M. Analysis of two years of ASCAT- and SMOS-derived soil moisture estimates over Europe and North Africa. Eur. J. Remote Sens. 2013, 46, 759–773. [Google Scholar] [CrossRef]
  28. Pan, M.; Cai, X.; Chaney, N.; Entekhabi, D.; Wood, E.F. An initial assessment of SMAP soil moisture retrievals using high-resolution model simulations and in situ observations. Geophys. Res. Lett. 2016, 43, 9662–9668. [Google Scholar] [CrossRef]
  29. Ahlmer, A.-K.; Cavalli, M.; Hansson, K.; Koutsouris, A.J.; Crema, S.; Kalantari, Z. Soil moisture remote-sensing applications for identification of flood-prone areas along transport infrastructure. Environ. Earth Sci. 2018, 77, 5–33. [Google Scholar] [CrossRef]
  30. AlJassar, H.; Temimi, M.; Abdelkader, M.; Petrov, P.; Kokkalis, P.; AlSarraf, H.; Roshni, N.; Al Hendi, H. Validation of NASA SMAP Satellite Soil Moisture Products over the Desert of Kuwait. Remote Sens. 2022, 14, 3328. [Google Scholar] [CrossRef]
  31. Kim, H.; Parinussa, R.; Konings, A.; Wagner, W.; Cosh, M.H.; Lakshmi, V.; Zohaib, M.; Choi, M. Global-scale assessment and combination of SMAP with ASCAT (active) and AMSR2 (passive) soil moisture products. Remote Sens. Environ. 2018, 204, 260–275. [Google Scholar] [CrossRef]
  32. Zhu, L.; Zhu, A. Extraction of Irrigation Signals by Using SMAP Soil Moisture Data. Remote Sens. 2021, 13, 2142. [Google Scholar] [CrossRef]
  33. Sarvia, F.; Xausa, E.; De Petris, S.; Cantamessa, G.; Borgogno-Mondino, E. A possible role of copernicus sentinel-2 data to support common agricultural policy controls in agriculture. Agronomy 2021, 11, 110. [Google Scholar] [CrossRef]
  34. Sugianto, S.; Rusdi, M.; Budi, M.; Farhan, A.; Akhyar, A. Agricultural Droughts Monitoring of Aceh Besar Regency Rice Production Center, Aceh, Indonesia–Application Vegetation Conditions Index using Sentinel-2 Image Data. J. Ecol. Eng. 2023, 24, 159–171. [Google Scholar] [CrossRef]
  35. Zhu, L.; Gu, Z.; Tian, G.; Zhang, J. A New Method for Estimating Irrigation Water Use via Soil Moisture. Agriculture 2023, 13, 757. [Google Scholar] [CrossRef]
  36. Zhang, G.; Zhang, S.; Wang, H.; Gan, T.Y.; Su, X.; Wu, H.; Shi, L.; Xu, P.; Fu, X. Evaluating Vegetation Vulnerability under Compound Dry and Hot Conditions Using Vine Copula across Global Lands. J. Hydrol. 2024, 631, 130775. [Google Scholar] [CrossRef]
  37. Mariette, V.; Isabella, P.G.; Wolfgang, P.; Camici, S.; Dorigo, W.; Enenkel, M.; van der Schalie, R.; Steele-Dunne, S.; Wagner, W. Microwave remote sensing for agricultural drought monitoring: Recent developments and challenges. Front. Water 2022, 4, 1045451. [Google Scholar]
  38. O’Neill, P.; Chan, S.; Colliander, A.; Dunbar, S.; Njoku, E.; Bindlish, R.; Chen, F.; Jackson, T.; Burgin, M.; Piepmeier, J.; et al. Evaluation of the validated Soil Moisture product from the SMAP radiometer. In Proceedings of the 2016 IEEE International Geoscience and Remote Sensing Symposium (IGARSS), Beijing, China, 10–15 July 2016; pp. 125–128. [Google Scholar]
  39. O’Neill, P.; Chan, S.; Bindlish, R.; Chaubell, M.; Colliander, A.; Chen, F.; Dunbar, S.; Jackson, T.; Peng, J.; Mousavi, M.; et al. Soil Moisture Active Passive (SMAP) Project: Calibration and Validation for the L2/3_SM_P Version 7 and L2/3_SM_P_E Version 4 Data Products; Tech. Rep JPL D-56297; Jet Propulsion Laboratory: Pasadena, CA, USA, 2020. [Google Scholar]
  40. Chan, S.; Bindlish, R.; O’Neill, P.; Jackson, T.; Chaubell, J.; Piepmeier, J.; Dunbar, S.; Colliander, A.; Chen, F.; Entekhabi, D.; et al. Development and validation of the SMAP enhanced passive soil moisture product. In Proceedings of the 2017 IEEE International Geoscience and Remote Sensing Symposium (IGARSS), Fort Worth, TX, USA, 23–28 July 2017; pp. 2539–2542. [Google Scholar]
  41. Colliander, A.; Jackson, T.J.; Chan, S.K.; O’Neill, P.; Bindlish, R.; Cosh, M.H.; Caldwell, T.; Walker, J.P.; Berg, A.; McNairn, H.; et al. An assessment of the differences between spatial resolution and grid size for the SMAP enhanced soil moisture product over homogeneous sites. Remote Sens. Environ. 2018, 207, 65–70. [Google Scholar] [CrossRef]
  42. Chan, K.S.; Bindlish, R.; O’Neill, E.P.; Njoku, E.; Jackson, T.; Colliander, A.; Chen, F.; Burgin, M.; Dunbar, S.; Piepmeier, J.; et al. Assessment of the SMAP Passive Soil Moisture Product. IEEE Trans. Geosci. Remote Sens. 2016, 54, 8. [Google Scholar] [CrossRef]
  43. Hongtao, J.; Huanfeng, S.; Xinghua, L.; Chao, Z.; Huiqin, L.; Fangni, L. Extending the SMAP 9-km soil moisture product using a spatiotemporal fusion model. Remote Sens. Environ. 2019, 231, 111224. [Google Scholar] [CrossRef]
  44. Chen, Y.; Guo, G. Wheat (Winter and Spring) Water Requirements and Irrigation. Main Crop Water Requirement and Irrigation of China, 1st ed.; Chen, Y., Li, H., Eds.; Water Resources and Hydropower Publishing House: Beijing, China, 1995; Volume 3, pp. 187–188. [Google Scholar]
Figure 1. (a) Elevation of Henan Province; (b) land use of Henan Province.
Agronomy 14 00758 g001
Figure 2. Drought distribution map of drought event during the winter wheat growth period in Henan Province (a) 9 January 2018; (b) 25 January 2018; (c) 17 February 2018; (d) 21 March 2018; (e) 22 April 2018; (f) 24 May 2018.
Agronomy 14 00758 g002
Figure 3. Drought distribution map of drought event during the winter wheat growth period in Henan Province (a) 19 December 2020; (b) 17 January 2020; (c) 18 February 2020; (d) 21 March 2020; (e) 22 April 2020; (f) 24 May 2020.
Agronomy 14 00758 g003
Figure 4. (a) The 5 cm soil moisture at the site; (b) drought grade of 20 cm soil moisture at the site.
Agronomy 14 00758 g004
Figure 5. Spatial variation of VSWI during the growth period of winter wheat in Henan Province: (a) March; (b) April; (c) Early May; (d) Late May.
Agronomy 14 00758 g005
Figure 6. Mann−Kendall test of soil moisture during the growth period of winter wheat from 2017 to 2020.
Agronomy 14 00758 g006
Figure 7. Global spatial auto-correlation of agricultural drought during winter wheat growth period from 2017 to 2020.
Agronomy 14 00758 g007
Figure 8. Local spatial auto-correlation of agricultural drought during the 2017 winter wheat growth period.
Agronomy 14 00758 g008
Table 1. Usage of MODIS data.
DataUnitProportional CoefficientTime ResolutionSpatial Resolution
NDVI 0.000116 day500 m
LSTK0.028 day1000 m
ETkg/m2/8 day0.18 day500 m
Table 2. Statistical irrigation water amount in urban areas of Henan Province from 2017 to 2020.
RegionArea
(10,000 km2)
2017
(100 Million m3)
2018
(100 Million m3)
2019
(100 Million m3)
2020
(100 Million m3)
Sanmenxia1.031.441.361.131.83
Xinyang1.8910.0510.1910.9210.95
Nanyang2.6613.1513.3613.4716.53
Zhoukou1.2011.3411.5312.0413.02
Shangqiu1.079.168.878.978.46
Anyang0.568.799.508.989.43
Pingdingshan0.793.072.792.722.76
Kaifeng0.639.129.918.968.43
Xinxiang0.8214.5212.7614.0213.26
Luoyang1.524.924.895.084.62
Luohe0.261.492.051.532.67
Puyang0.429.848.169.308.32
Jiaozuo0.418.598.118.106.89
Xuchang0.503.563.122.883.73
Zhengzhou0.745.444.234.243.68
Zhumadian1.514.595.285.475.13
Hebi0.232.812.692.802.56
Table 3. Sowing area and yield of winter wheat in Henan Province.
TimeSown Area (Thousand Hectares)Production (Tons)Wheat Planting Area Proportion (%)
20175714.643705.2154.23
20185739.853602.8552.38
20195706.653741.7753.21
20205673.673753.1354.42
Table 4. Changes of water amount in different soil layers under different water conditions.
Depth (cm)Percentage of Water Amount in Different Depths (%)
2041.0
4025.3
6017.2
806.3
1004.4
1204.0
Table 5. Drought classification of relative soil moisture.
GradeTypeRelative Soil Moisture at Depth of 20 cm
1No drought60% < RSM
2Mild drought50% < RSM ≤ 60%
3Moderate drought40% < RSM ≤ 50%
4Severe drought30% < RSM ≤ 40%
5Extreme droughtRSM ≤ 30%
Table 6. Changes of water demand in different phenological periods.
Winter Wheat Phenology PeriodNDVI Reflects the Change of Water
Requirement of Winter Wheat
Seeding emergence period0.2 < NDVI < 0.3
Tillering period0.3 < NDVI < 0.4
Wintering period0.3 < NDVI < 0.4
Regreening jointing period0.4 < NDVI < 0.5
Heading and filling period NDVI > 0.5
Table 7. Evaluation index of training set.
PrecisionRecallf1-Score Support
0111349
10.8210.91512
210.060.12161
300082
410.010.0368
500029
accuracy 0.852201
macro avg0.640.350.342201
weighted avg0.830.850.792201
Table 8. Evaluation index of testing set.
PrecisionRecallf1-Score Support
011145
10.850.990.91170
200016
30005
40008
50001
accuracy 0.87245
macro avg0.310.330.32245
weighted avg0.770.870.82245
Table 9. Global Moran ‘s I Index distribution.
Global Moran’s I IndexDegree of Correlation
0 < GMI < 1Positive correlation
−1 < GMI < 0Negative correlation
GMI = 0Uncorrelated
Table 10. Drought classification of the vegetation supply water index.
GradeTypeVegetation Supply Water Index
1No drought0.5 < VSWI
2Mild drought0.4 < VSWI ≤ 0.5
3Moderate drought0.3 < VSWI ≤ 0.4
4Severe drought0.2 < VSWI ≤ 0.3
5Extreme droughtVSWI ≤ 0.2
Disclaimer/Publisher’s Note: The statements, opinions and data contained in all publications are solely those of the individual author(s) and contributor(s) and not of MDPI and/or the editor(s). MDPI and/or the editor(s) disclaim responsibility for any injury to people or property resulting from any ideas, methods, instructions or products referred to in the content.

