
Identification and Expression Pattern Analysis of the SOS Gene Family in Tomatoes


 and
and 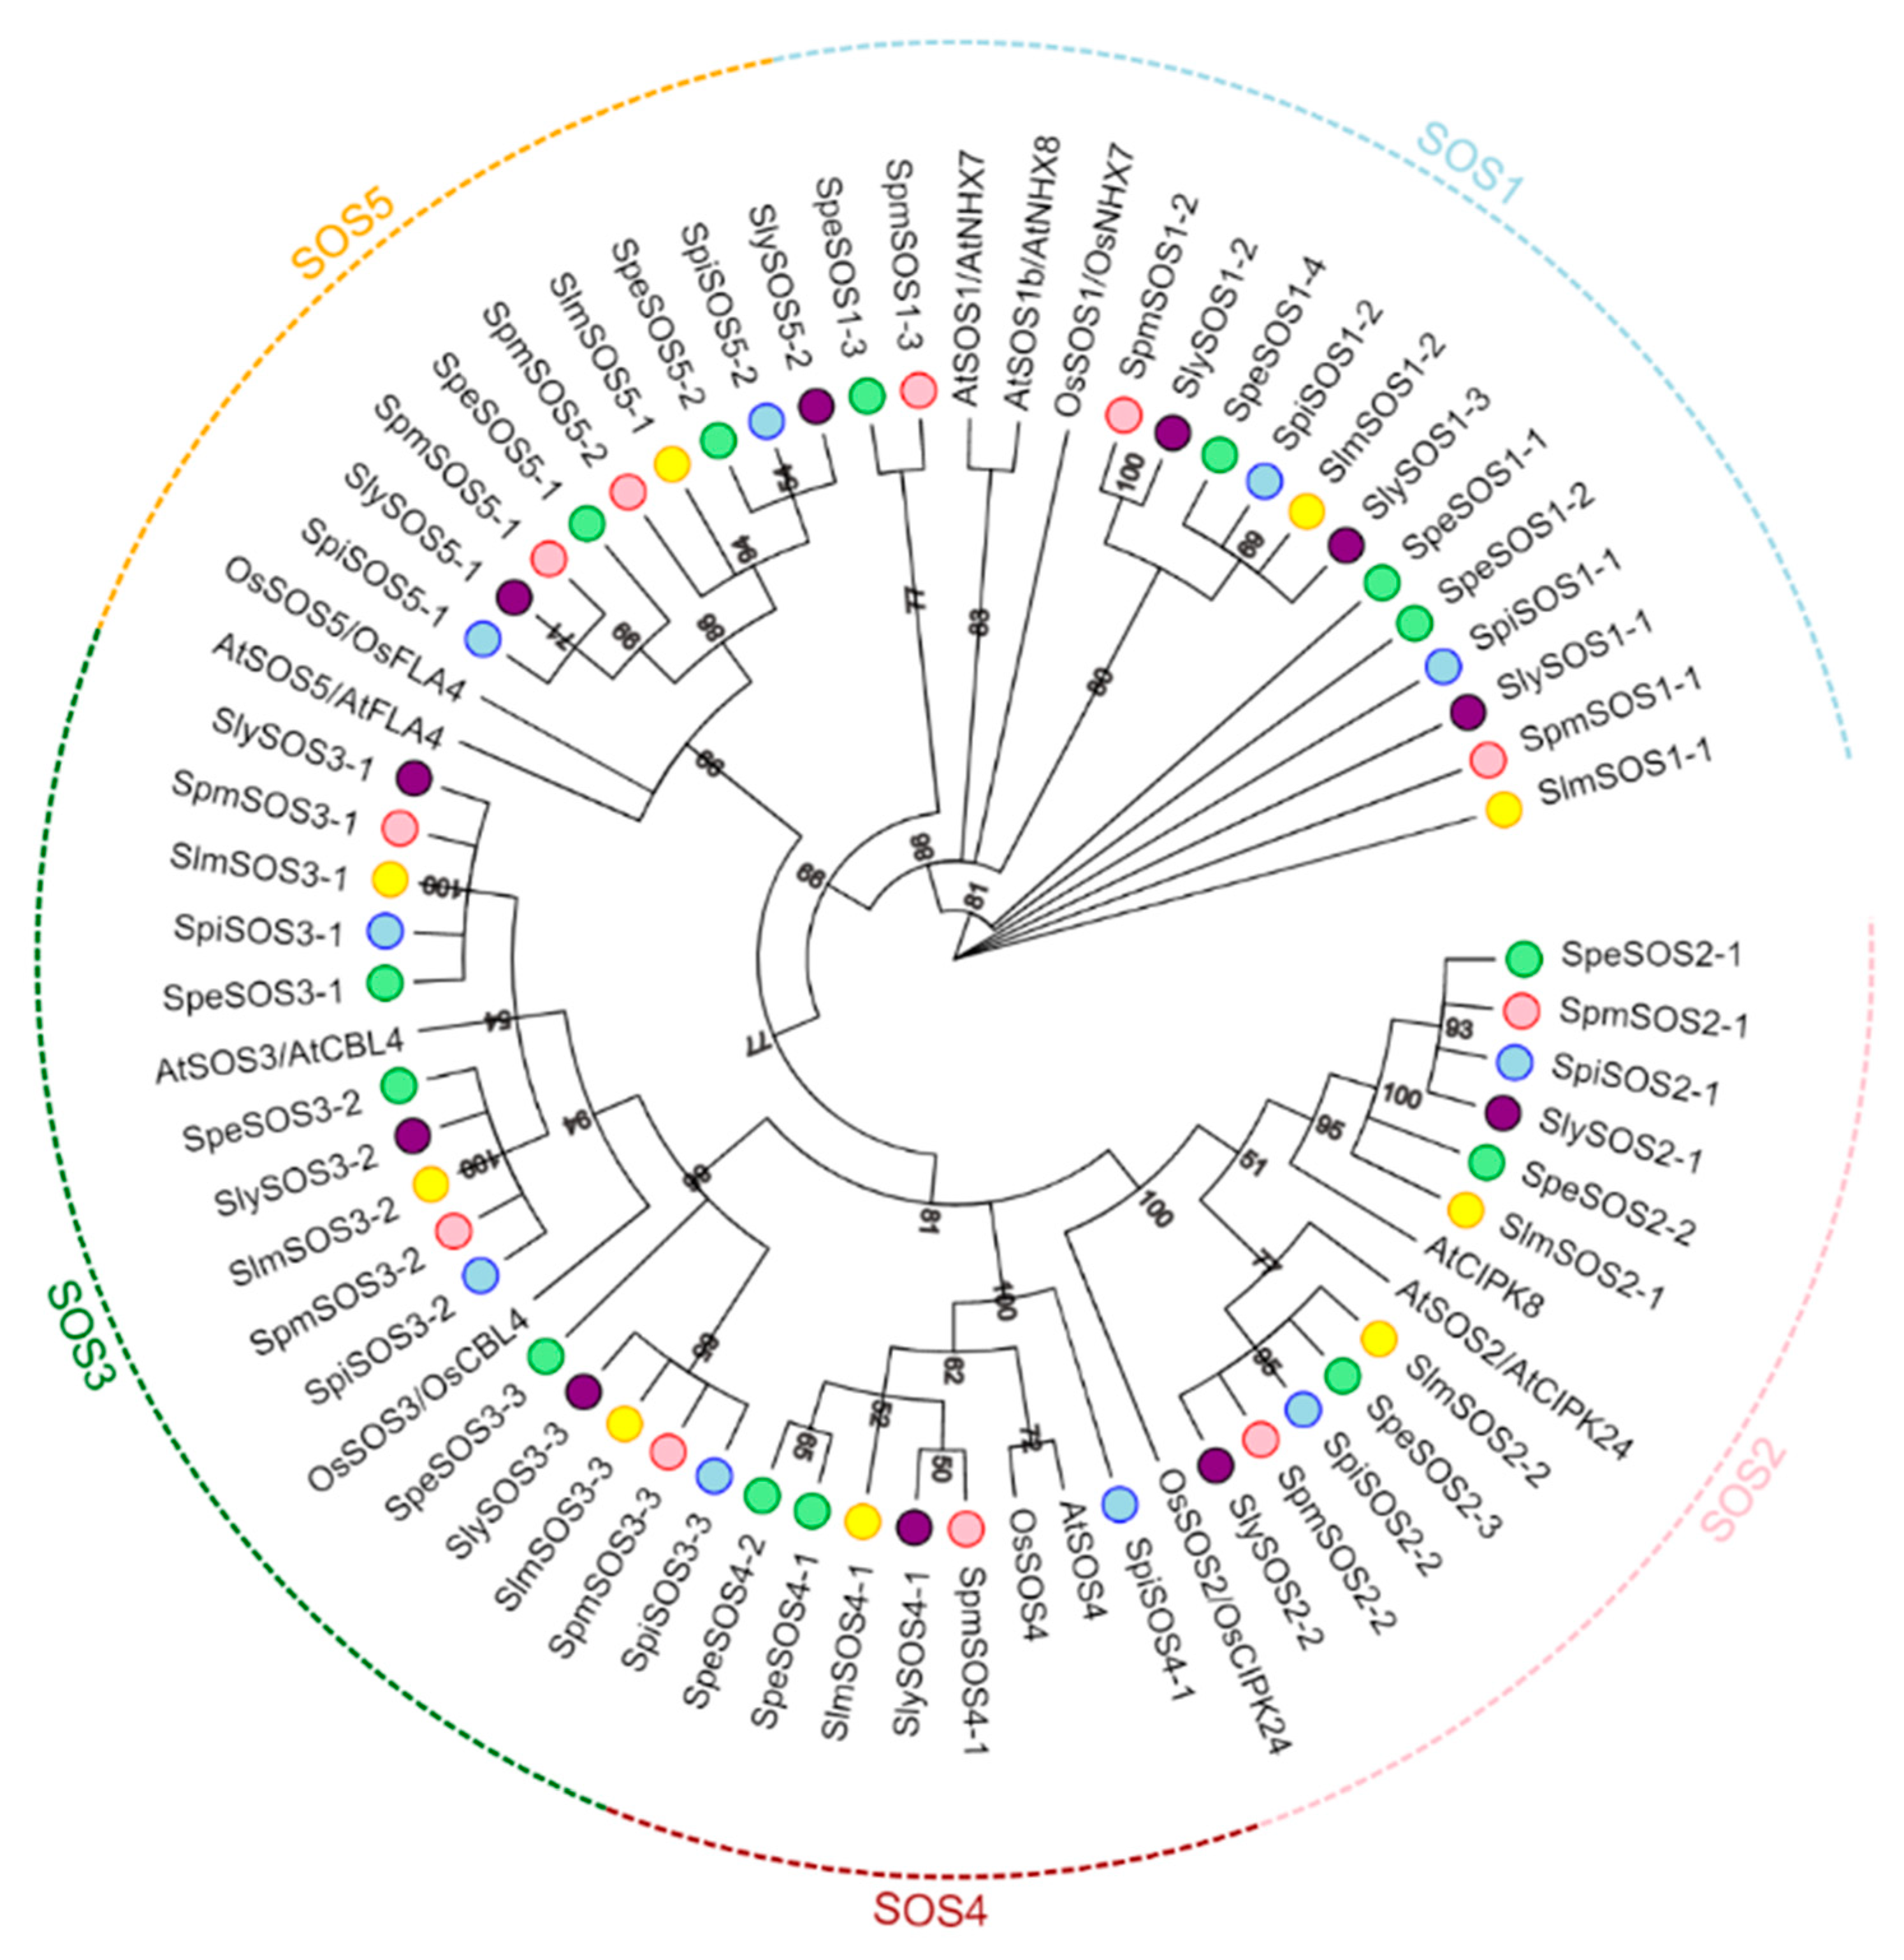
Abstract
:1. Introduction
2. Materials and Methods
2.1. Genome-Wide Identification of the SOS Family Genes in Tomatoes
2.2. Protein Property Analysis and the Prediction of the Subcellular Localization
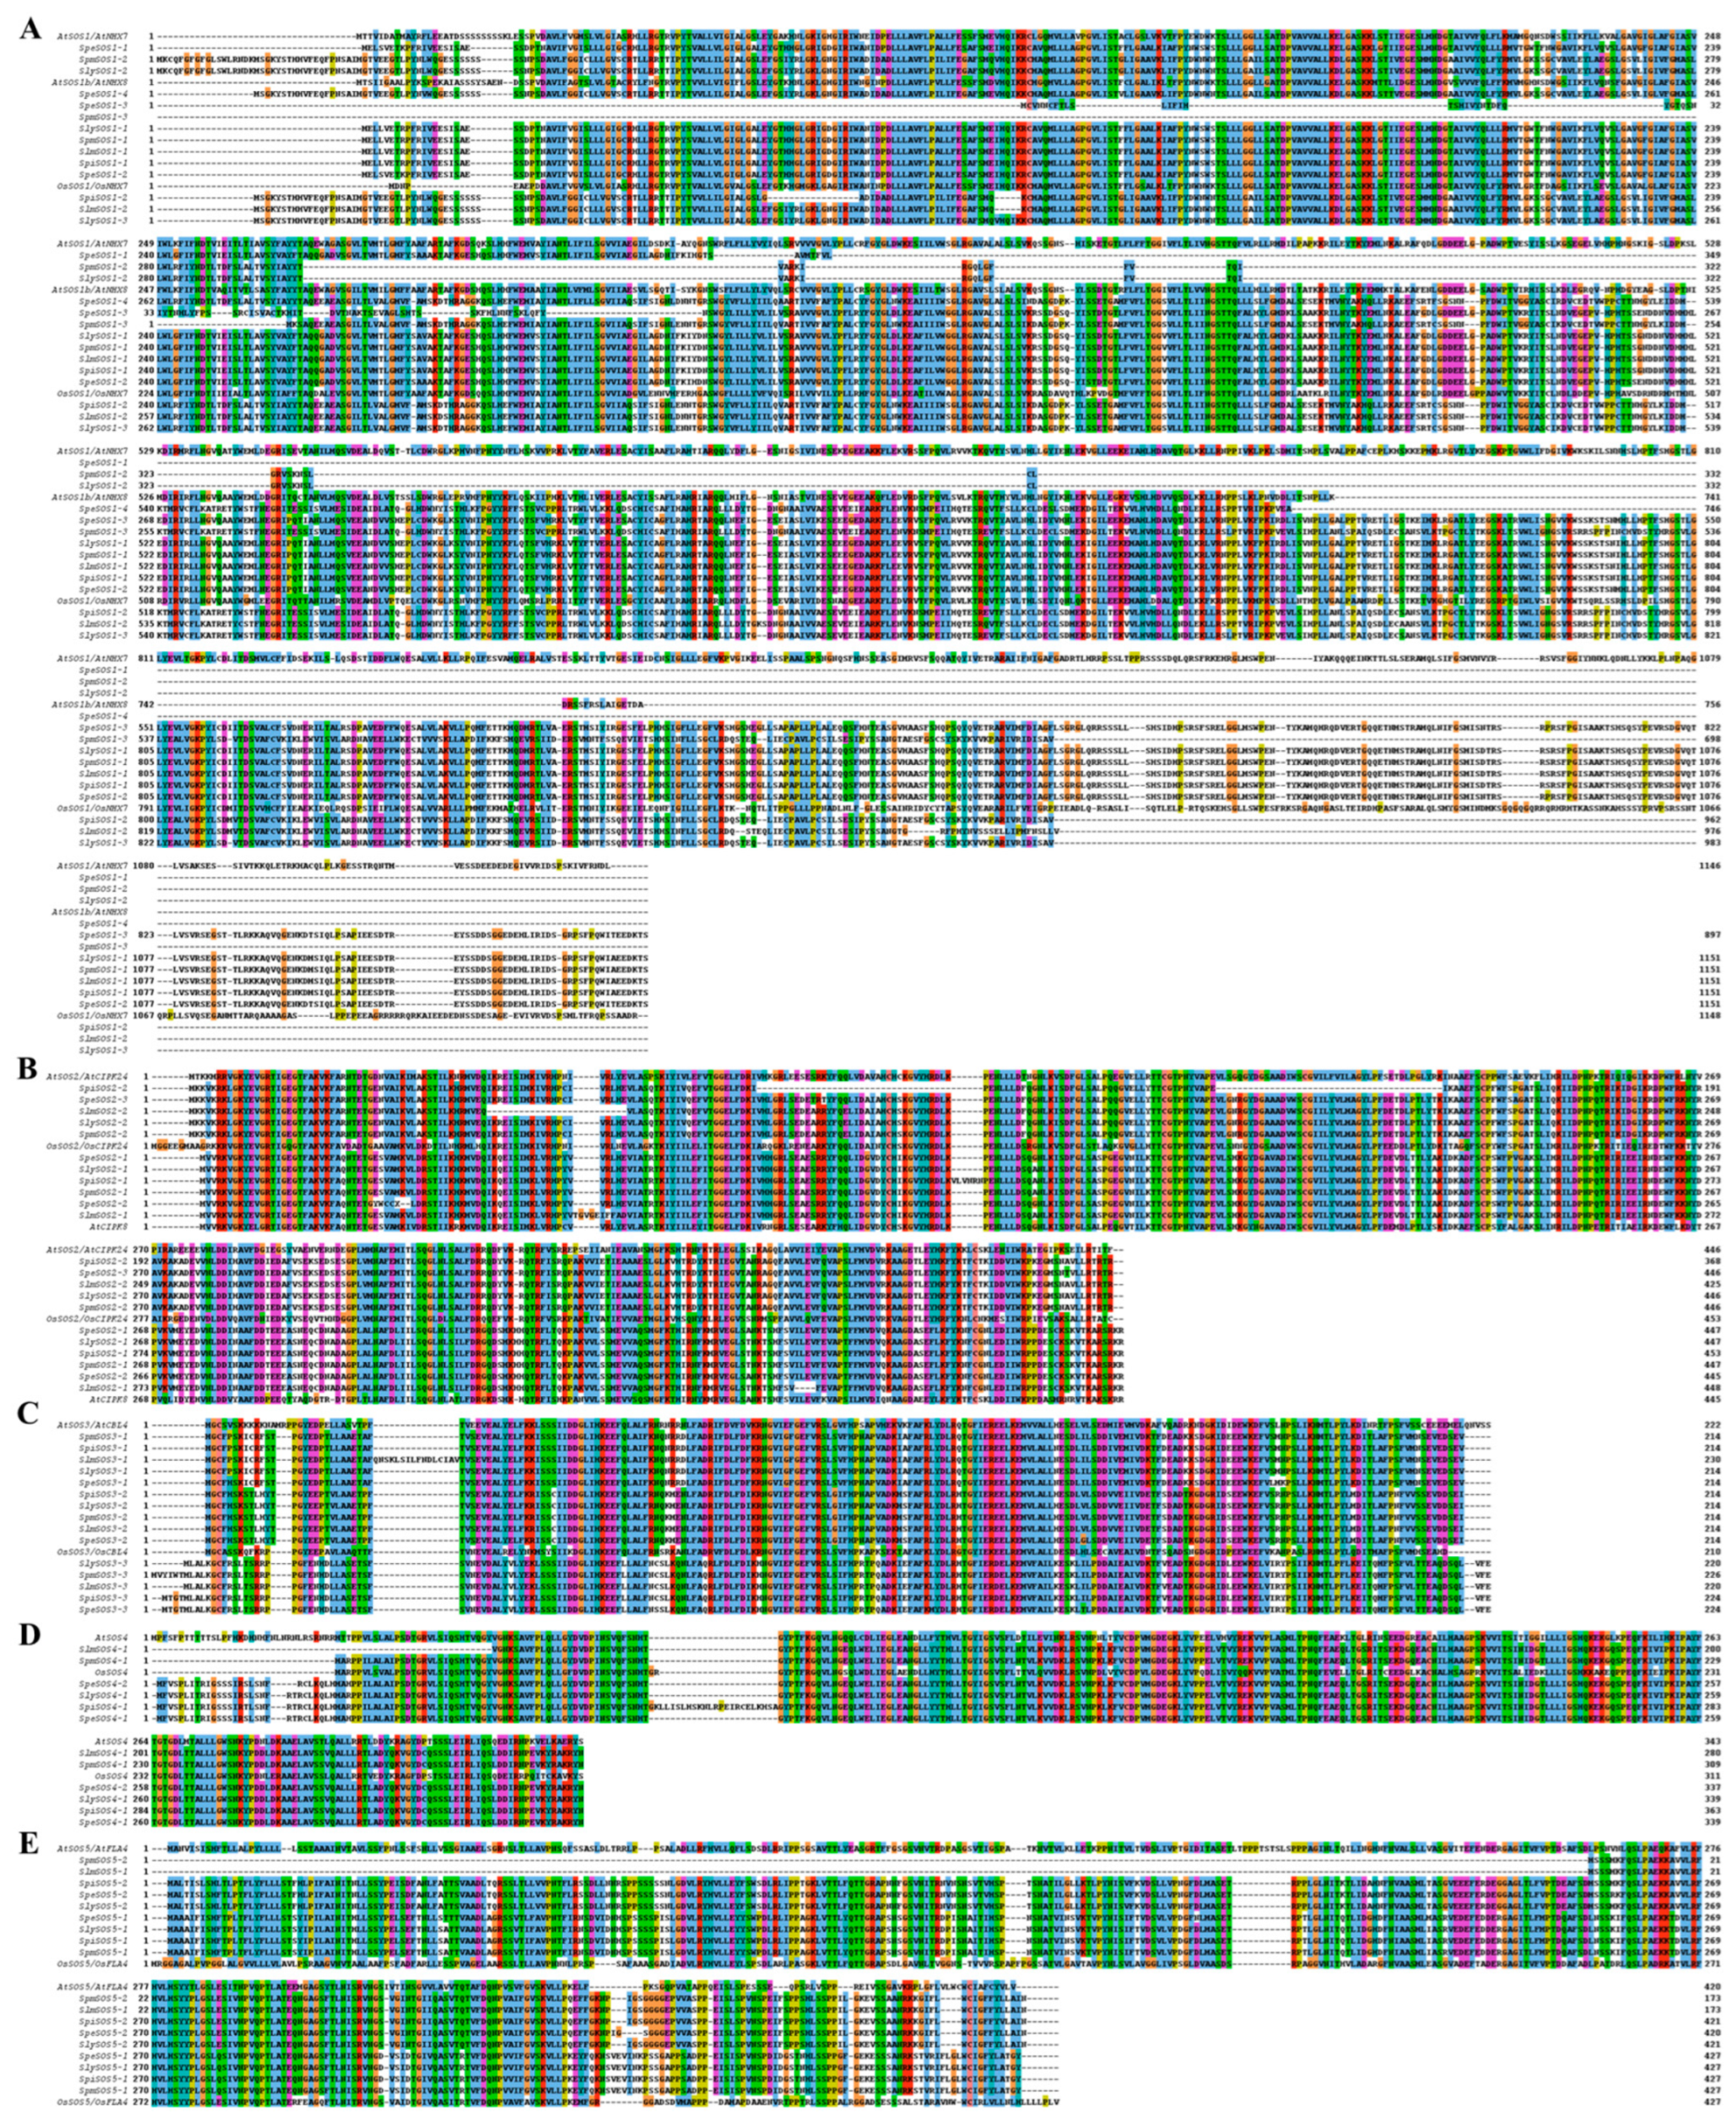
2.3. Protein Sequence Alignment and Phylogenetic Analysis of the SOS Family
2.4. Prediction of SOS Gene Characterization in Tomatoes
2.5. Spatial and Temporal Expression Analysis of the SOS Genes in Tomatoes
2.6. Statistical Analysis
3. Results
3.1. Whole Genome Identification and Analysis of the Tomato SOS Gene Family
3.1.1. Identification of the Tomato SOS Gene Family and Physicochemical Properties Analysis
3.1.2. Phylogenetic Analysis and Classification of the Tomato SOS Protein Family
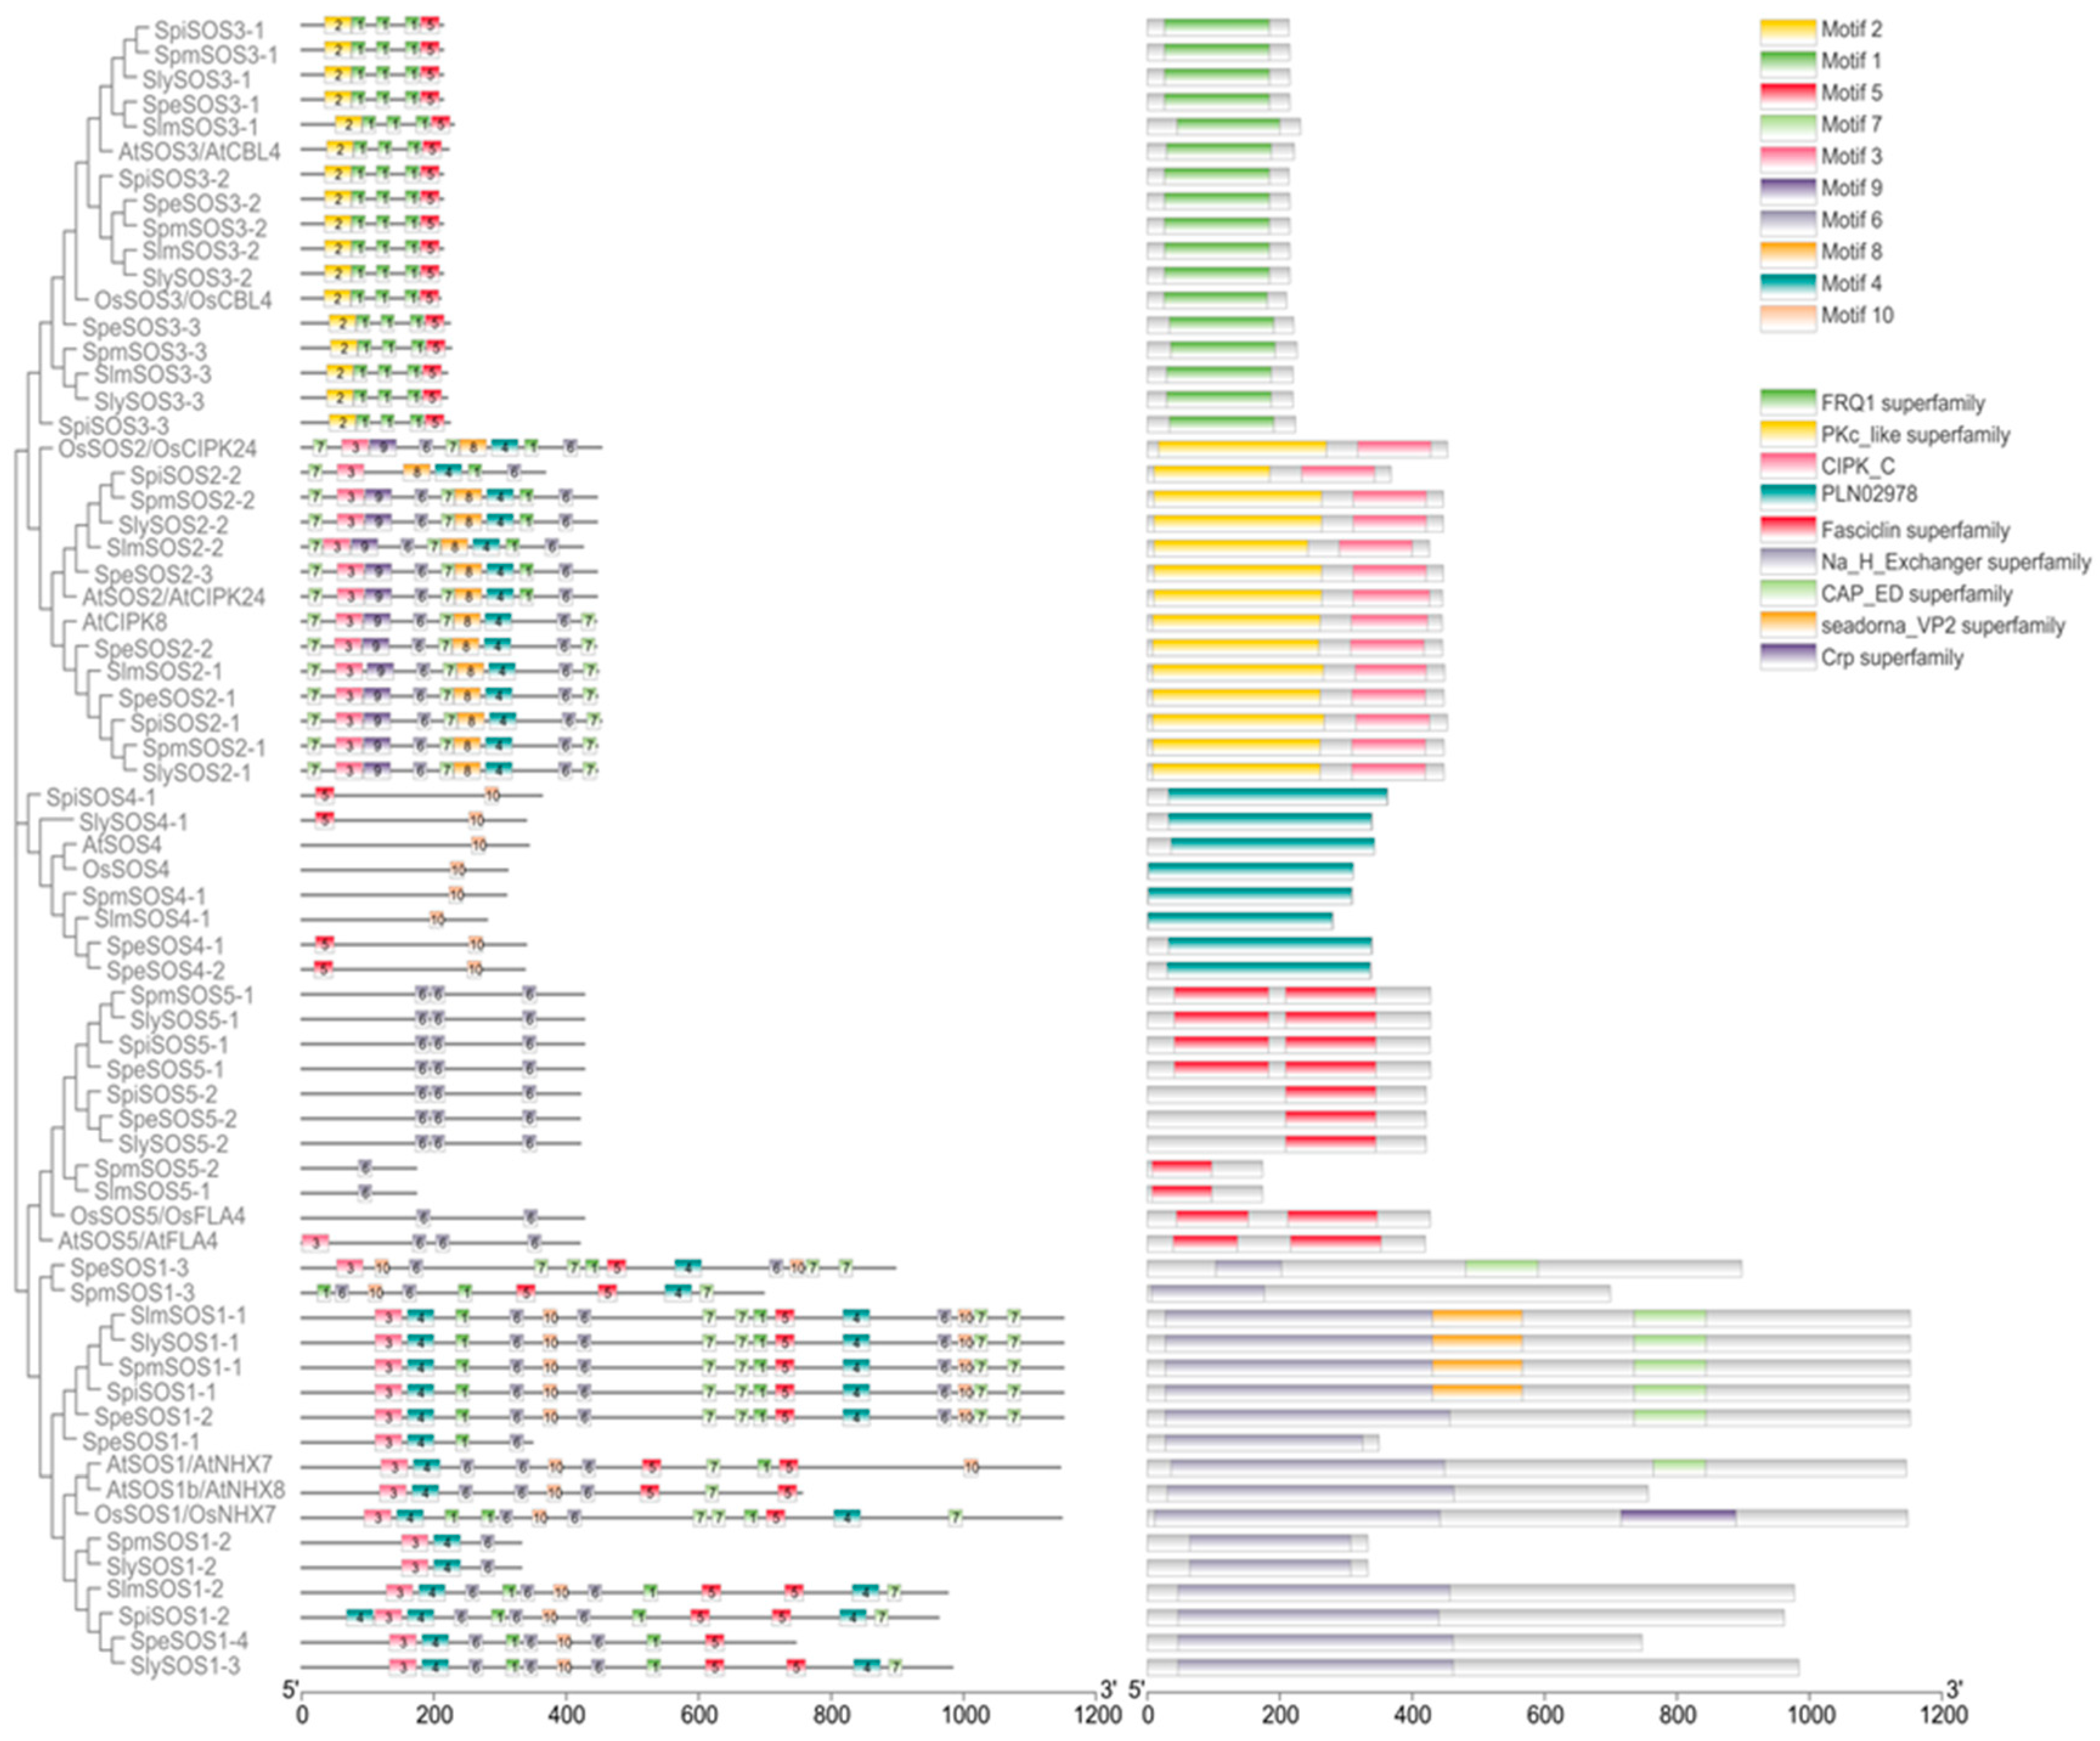
3.1.3. Analysis of the Conserved Motifs and Conserved Structural Domains of the Tomato SOS Proteins
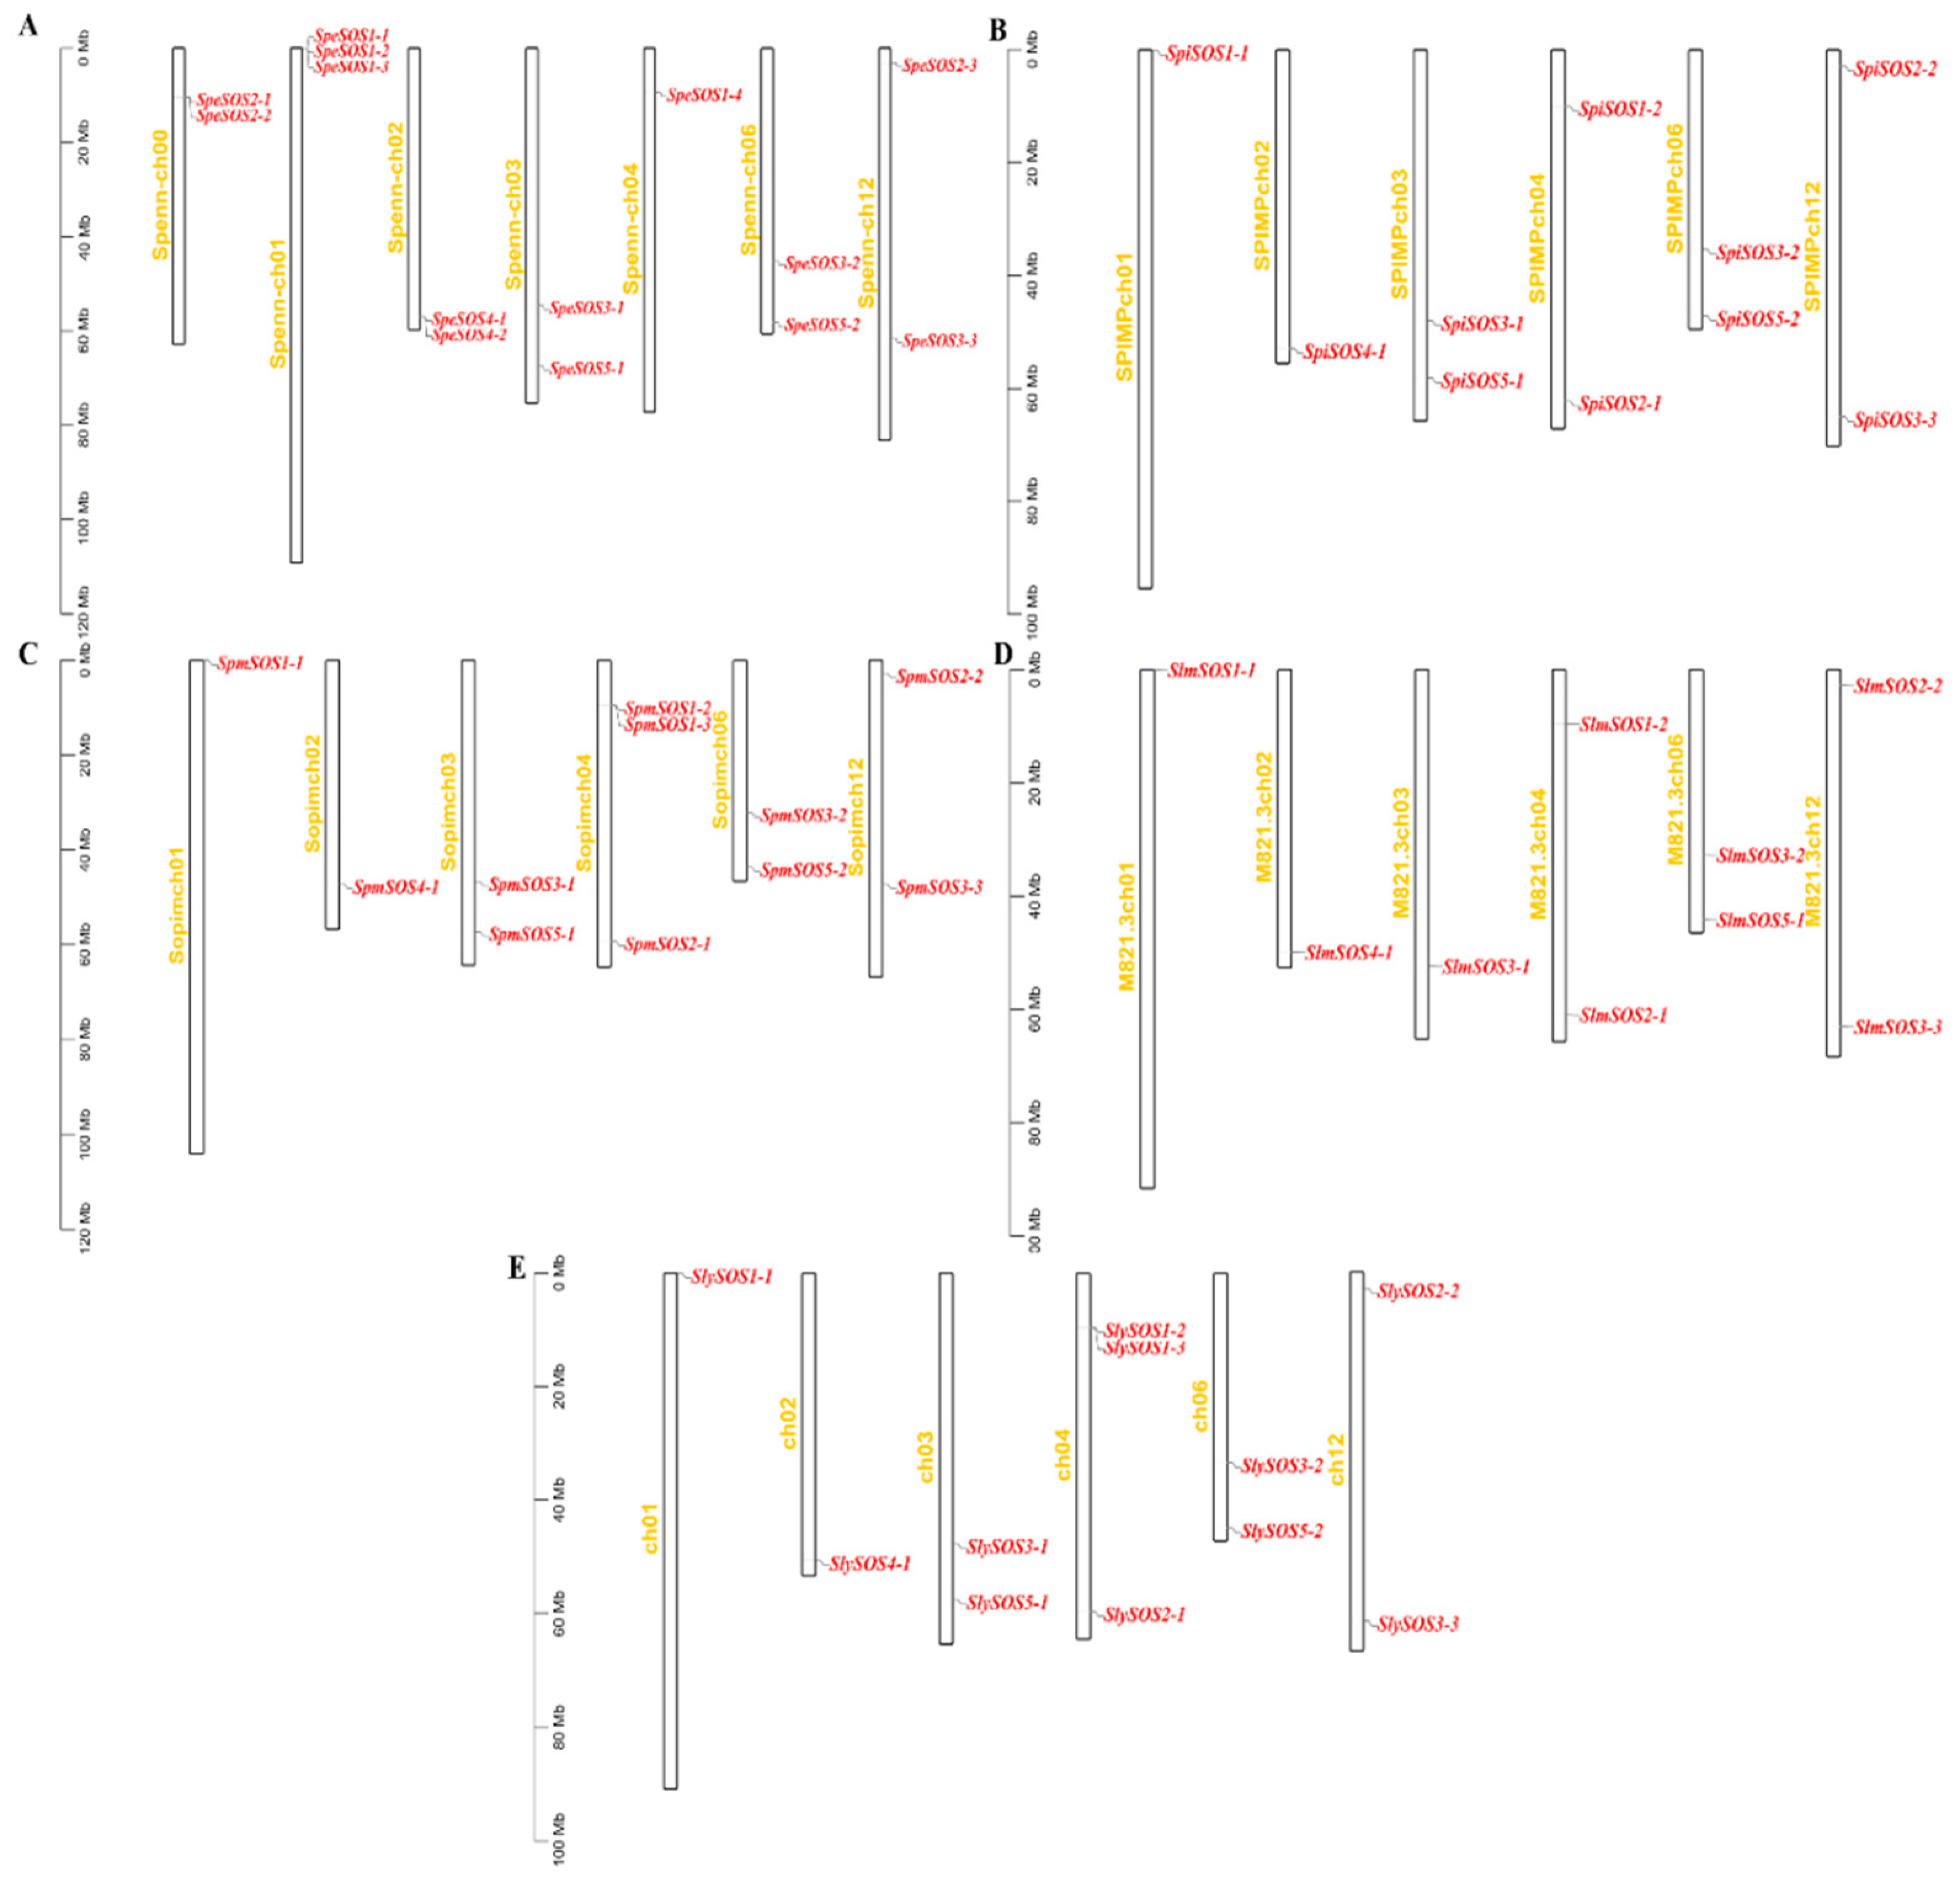
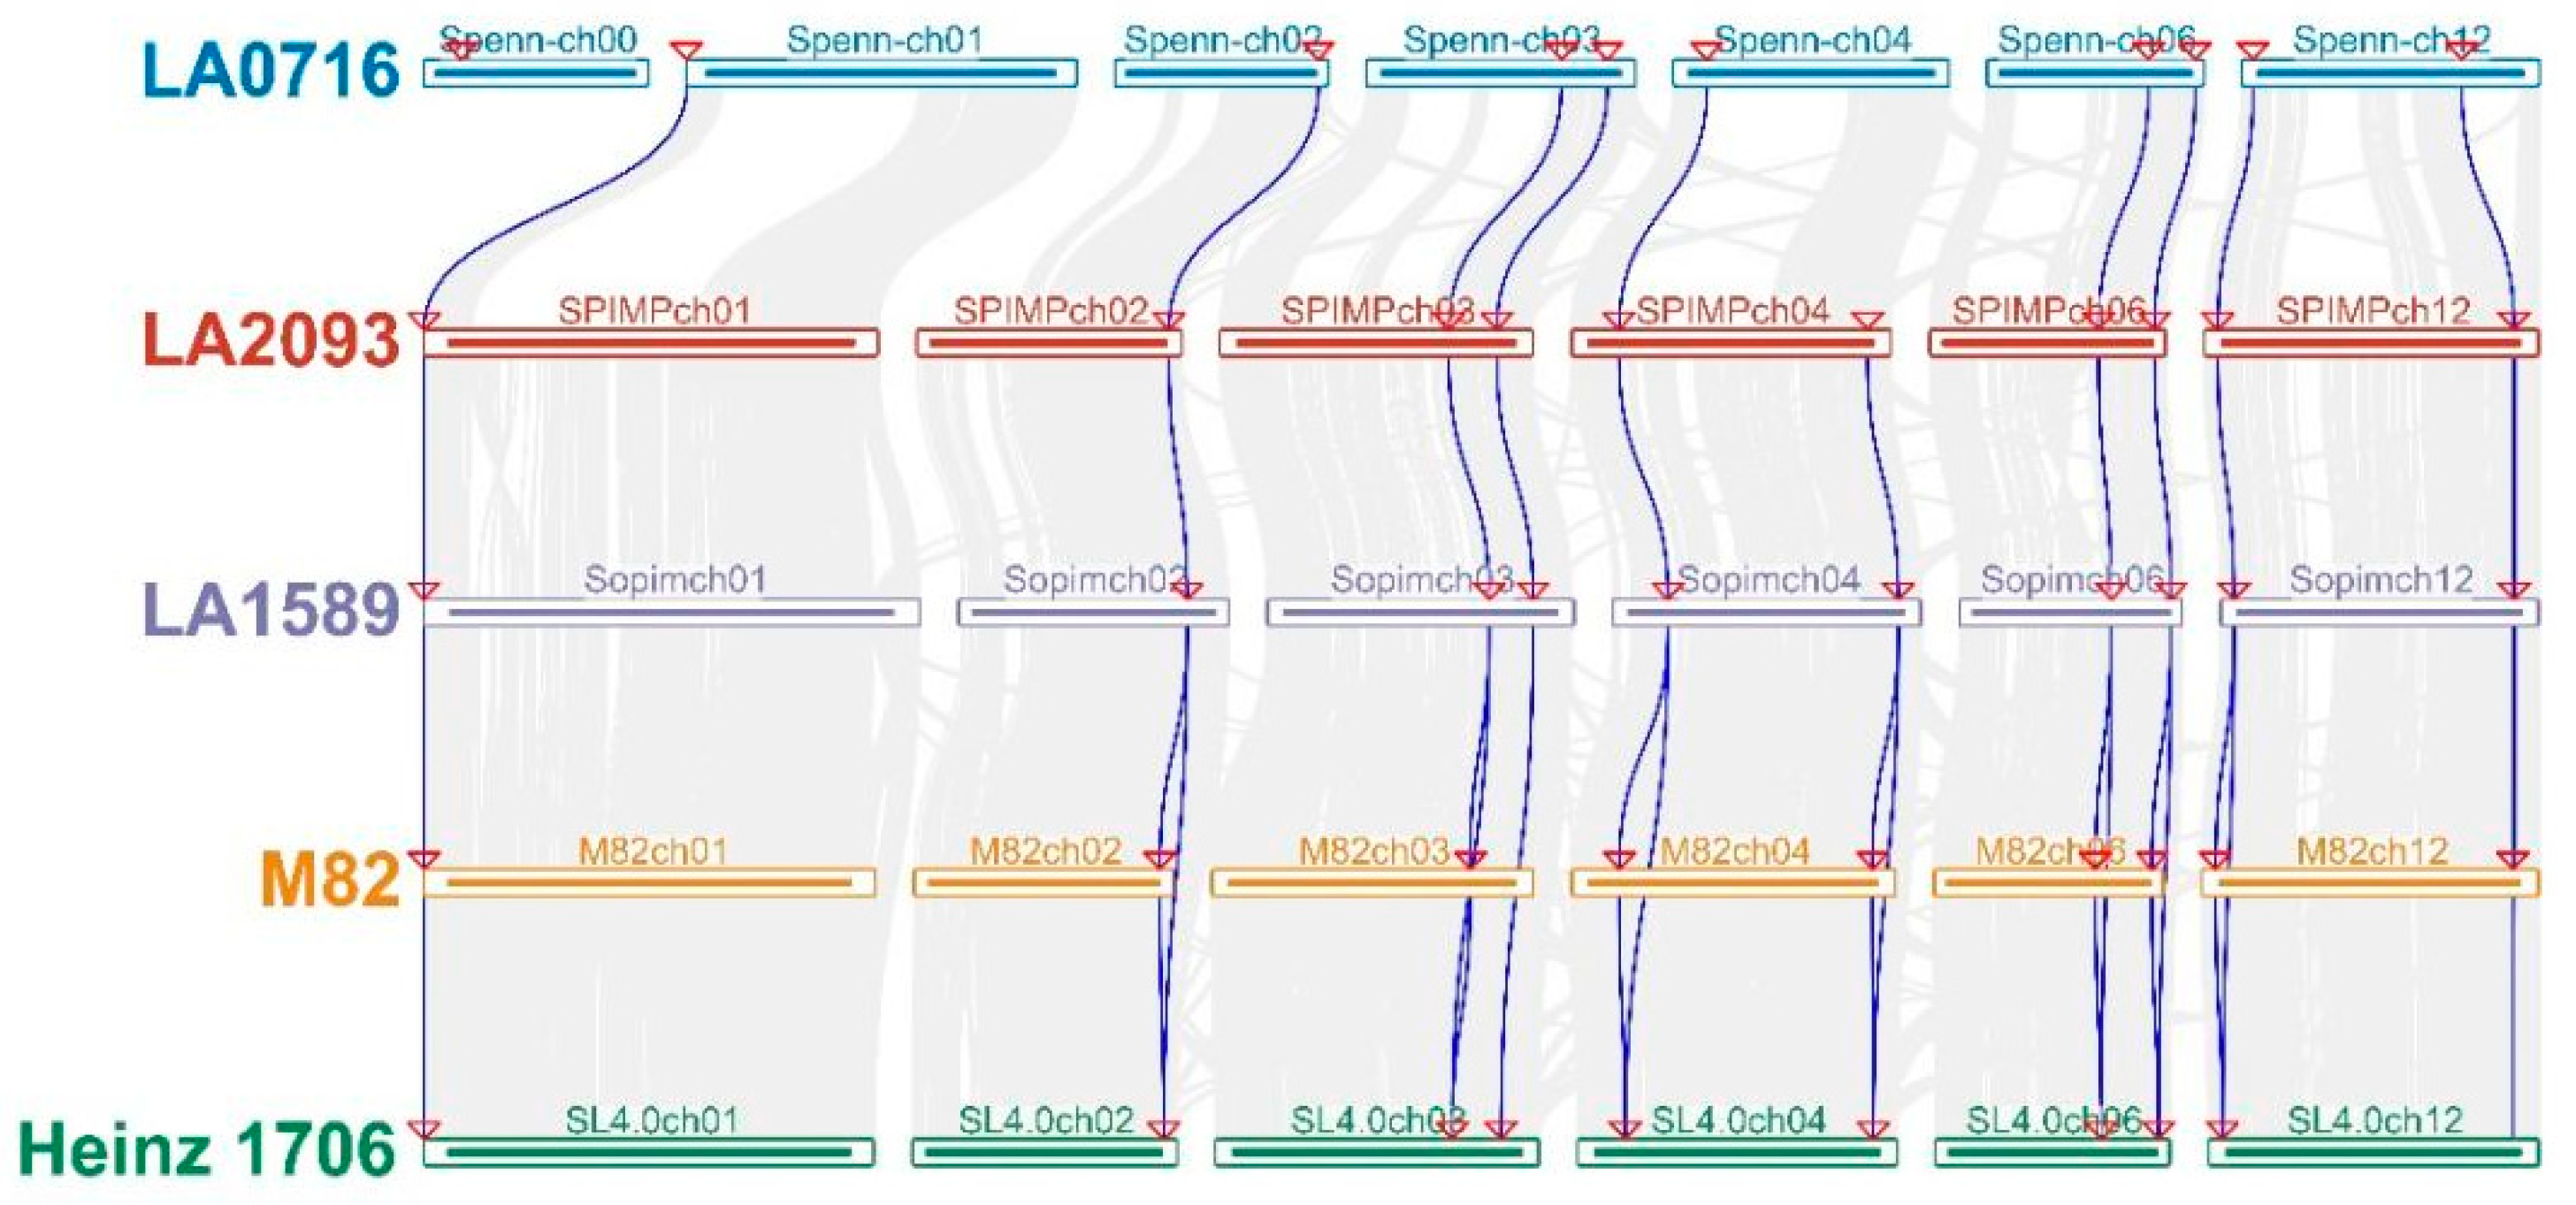
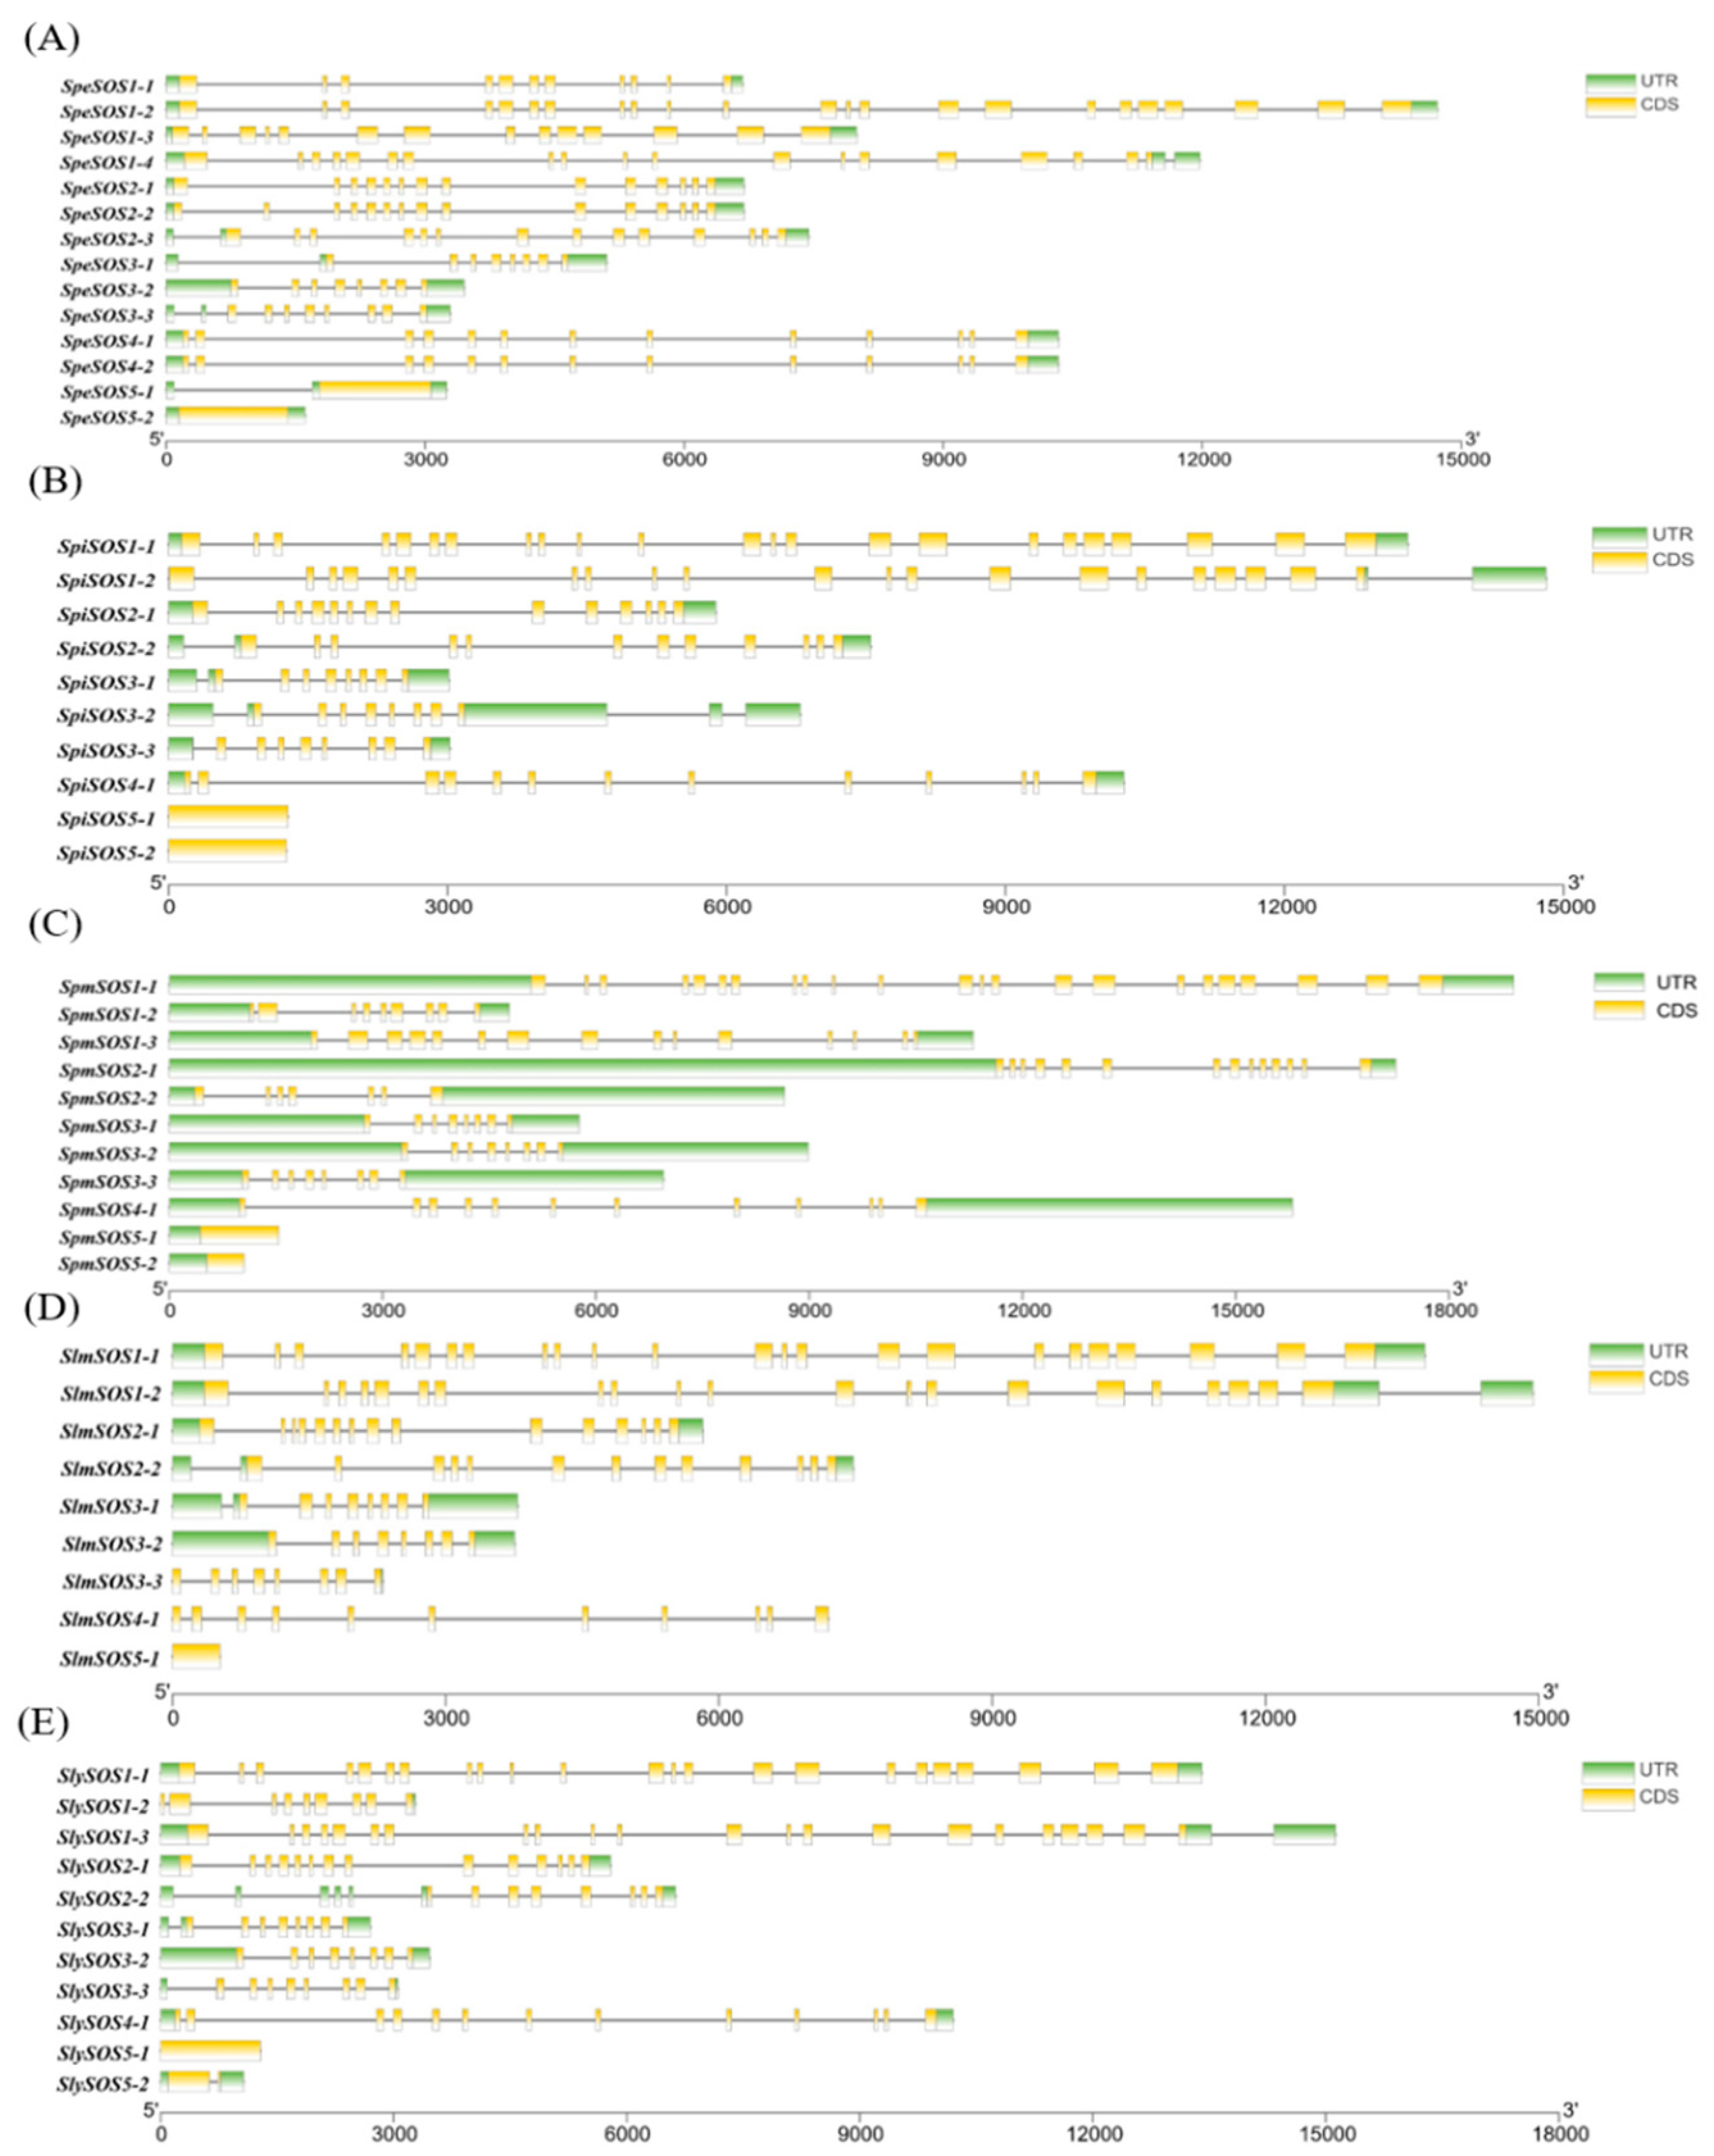
3.1.4. Chromosomal Localization and Collinearity and Structural Analysis of the Tomato SOS Genes
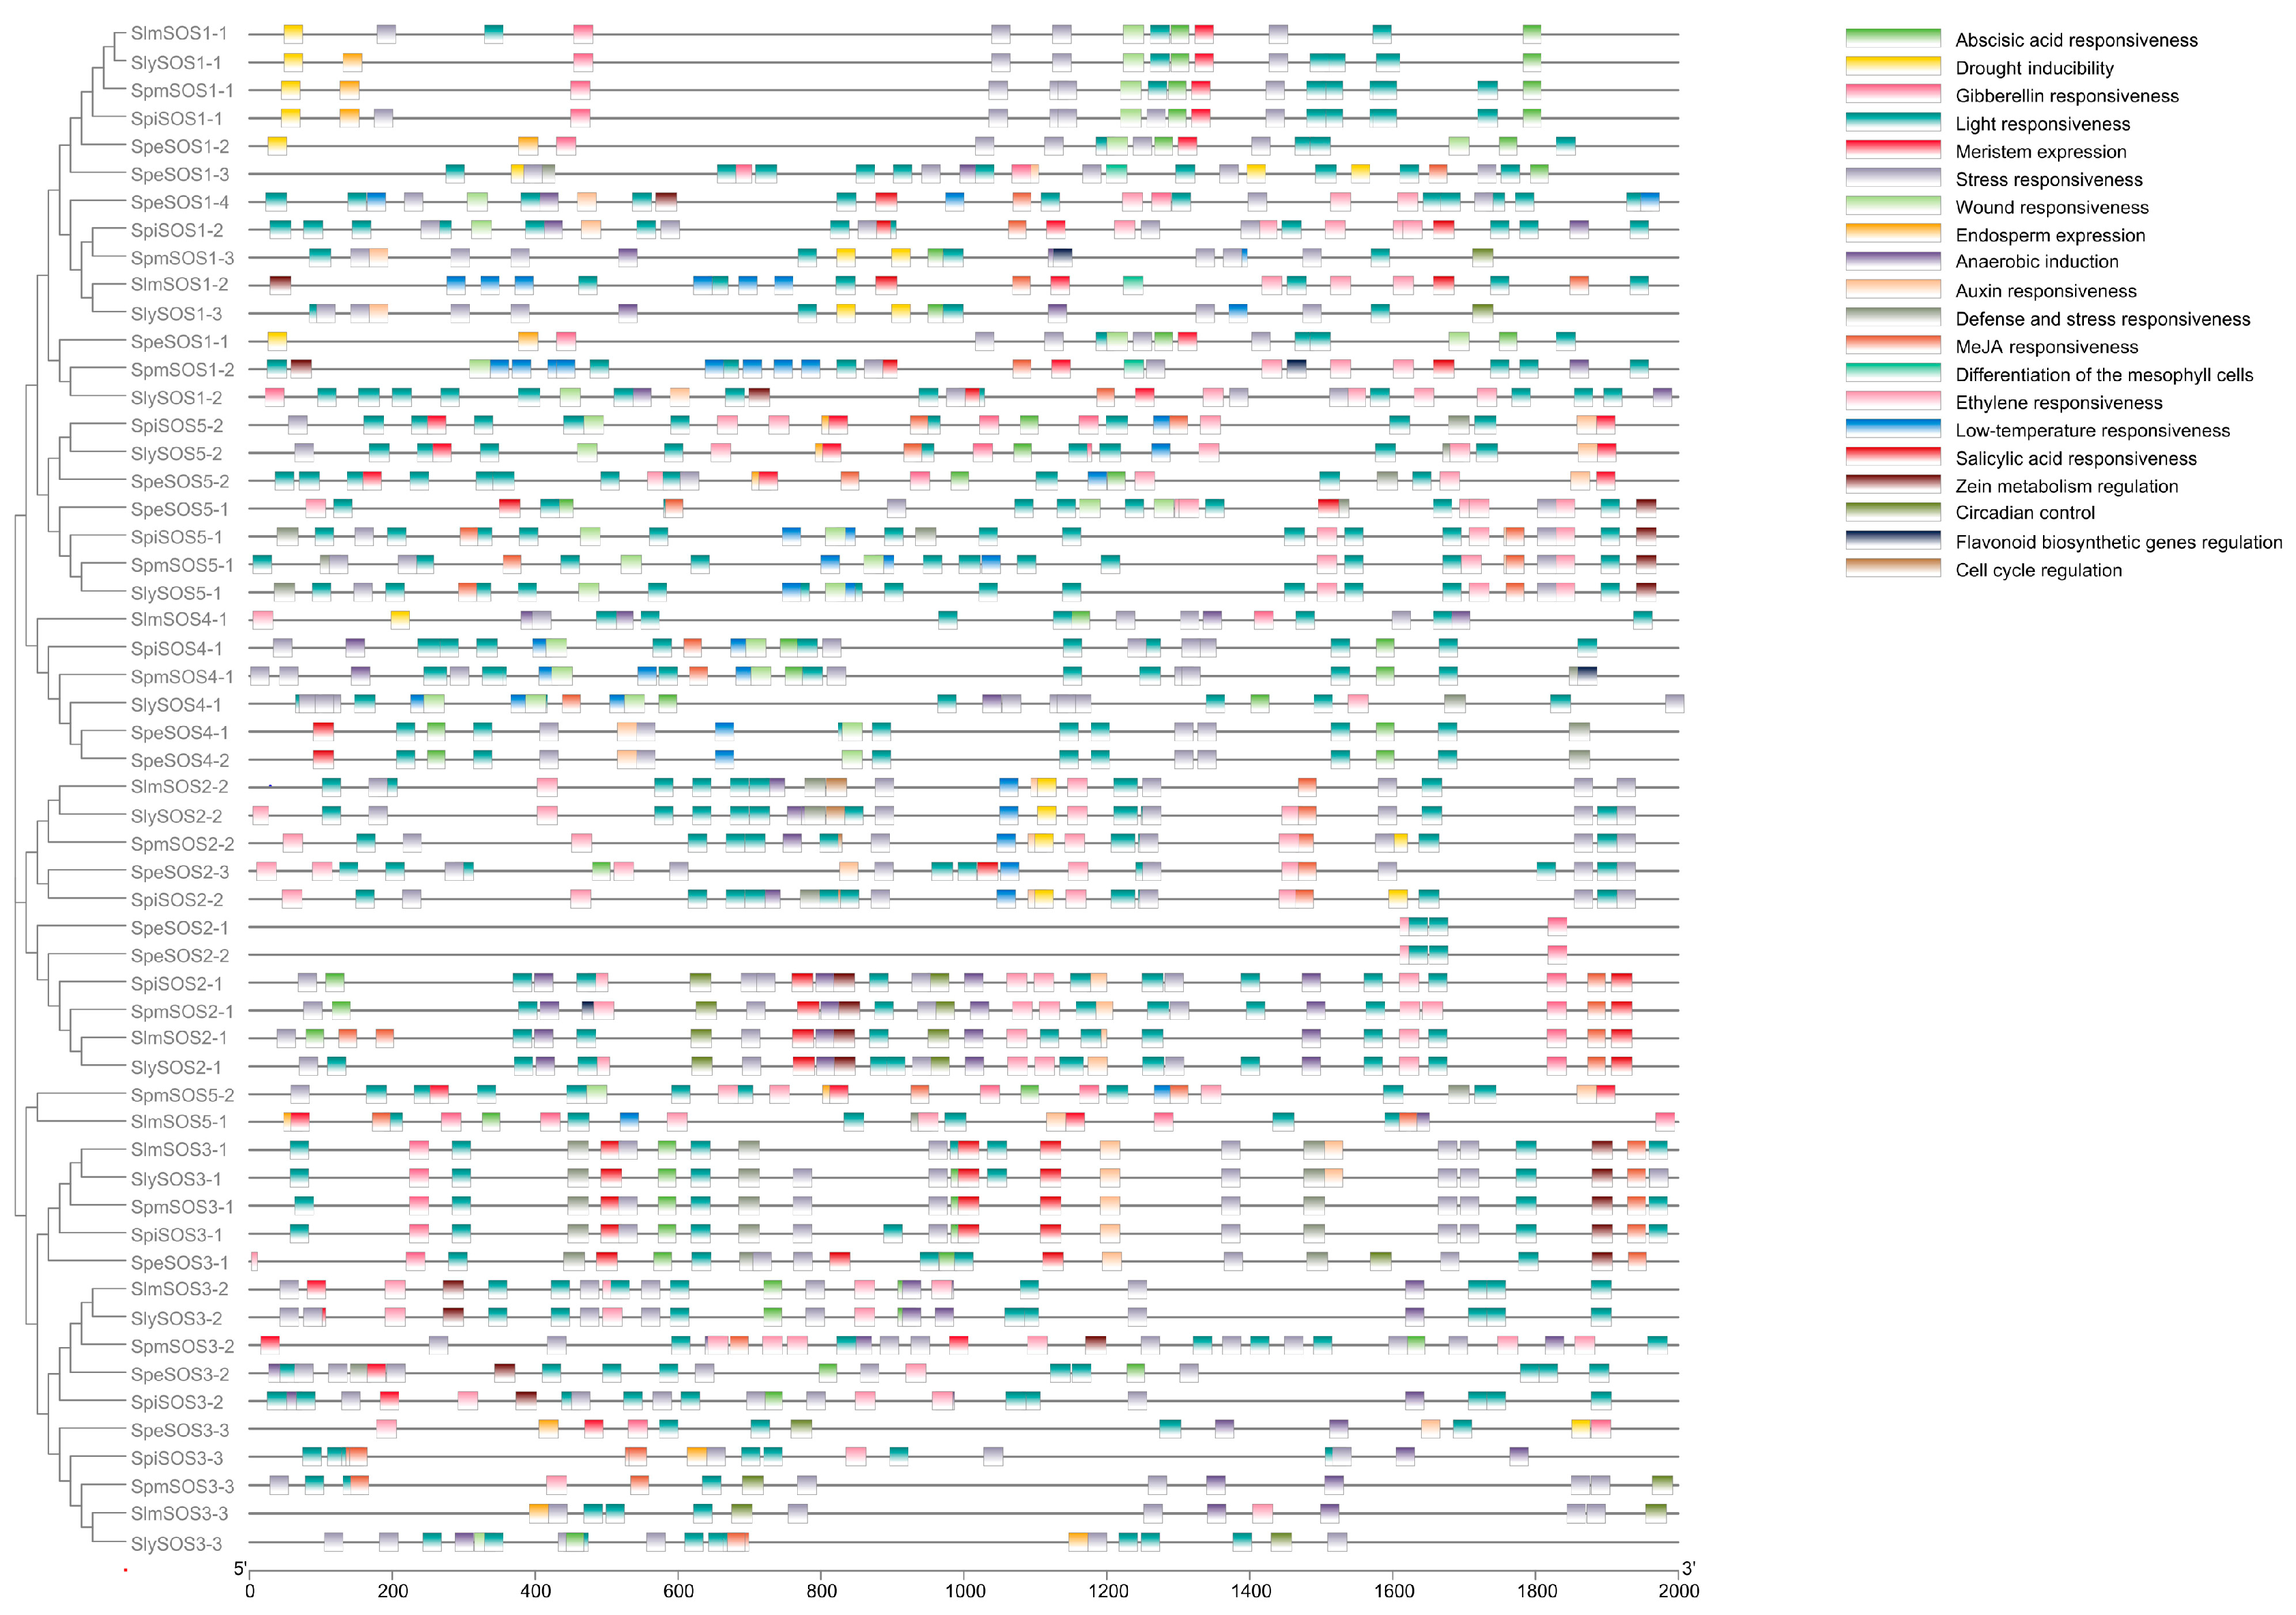
3.1.5. Analysis of the Cis-Acting Element in the Promoter Regions of the Tomato SOS Gene Family
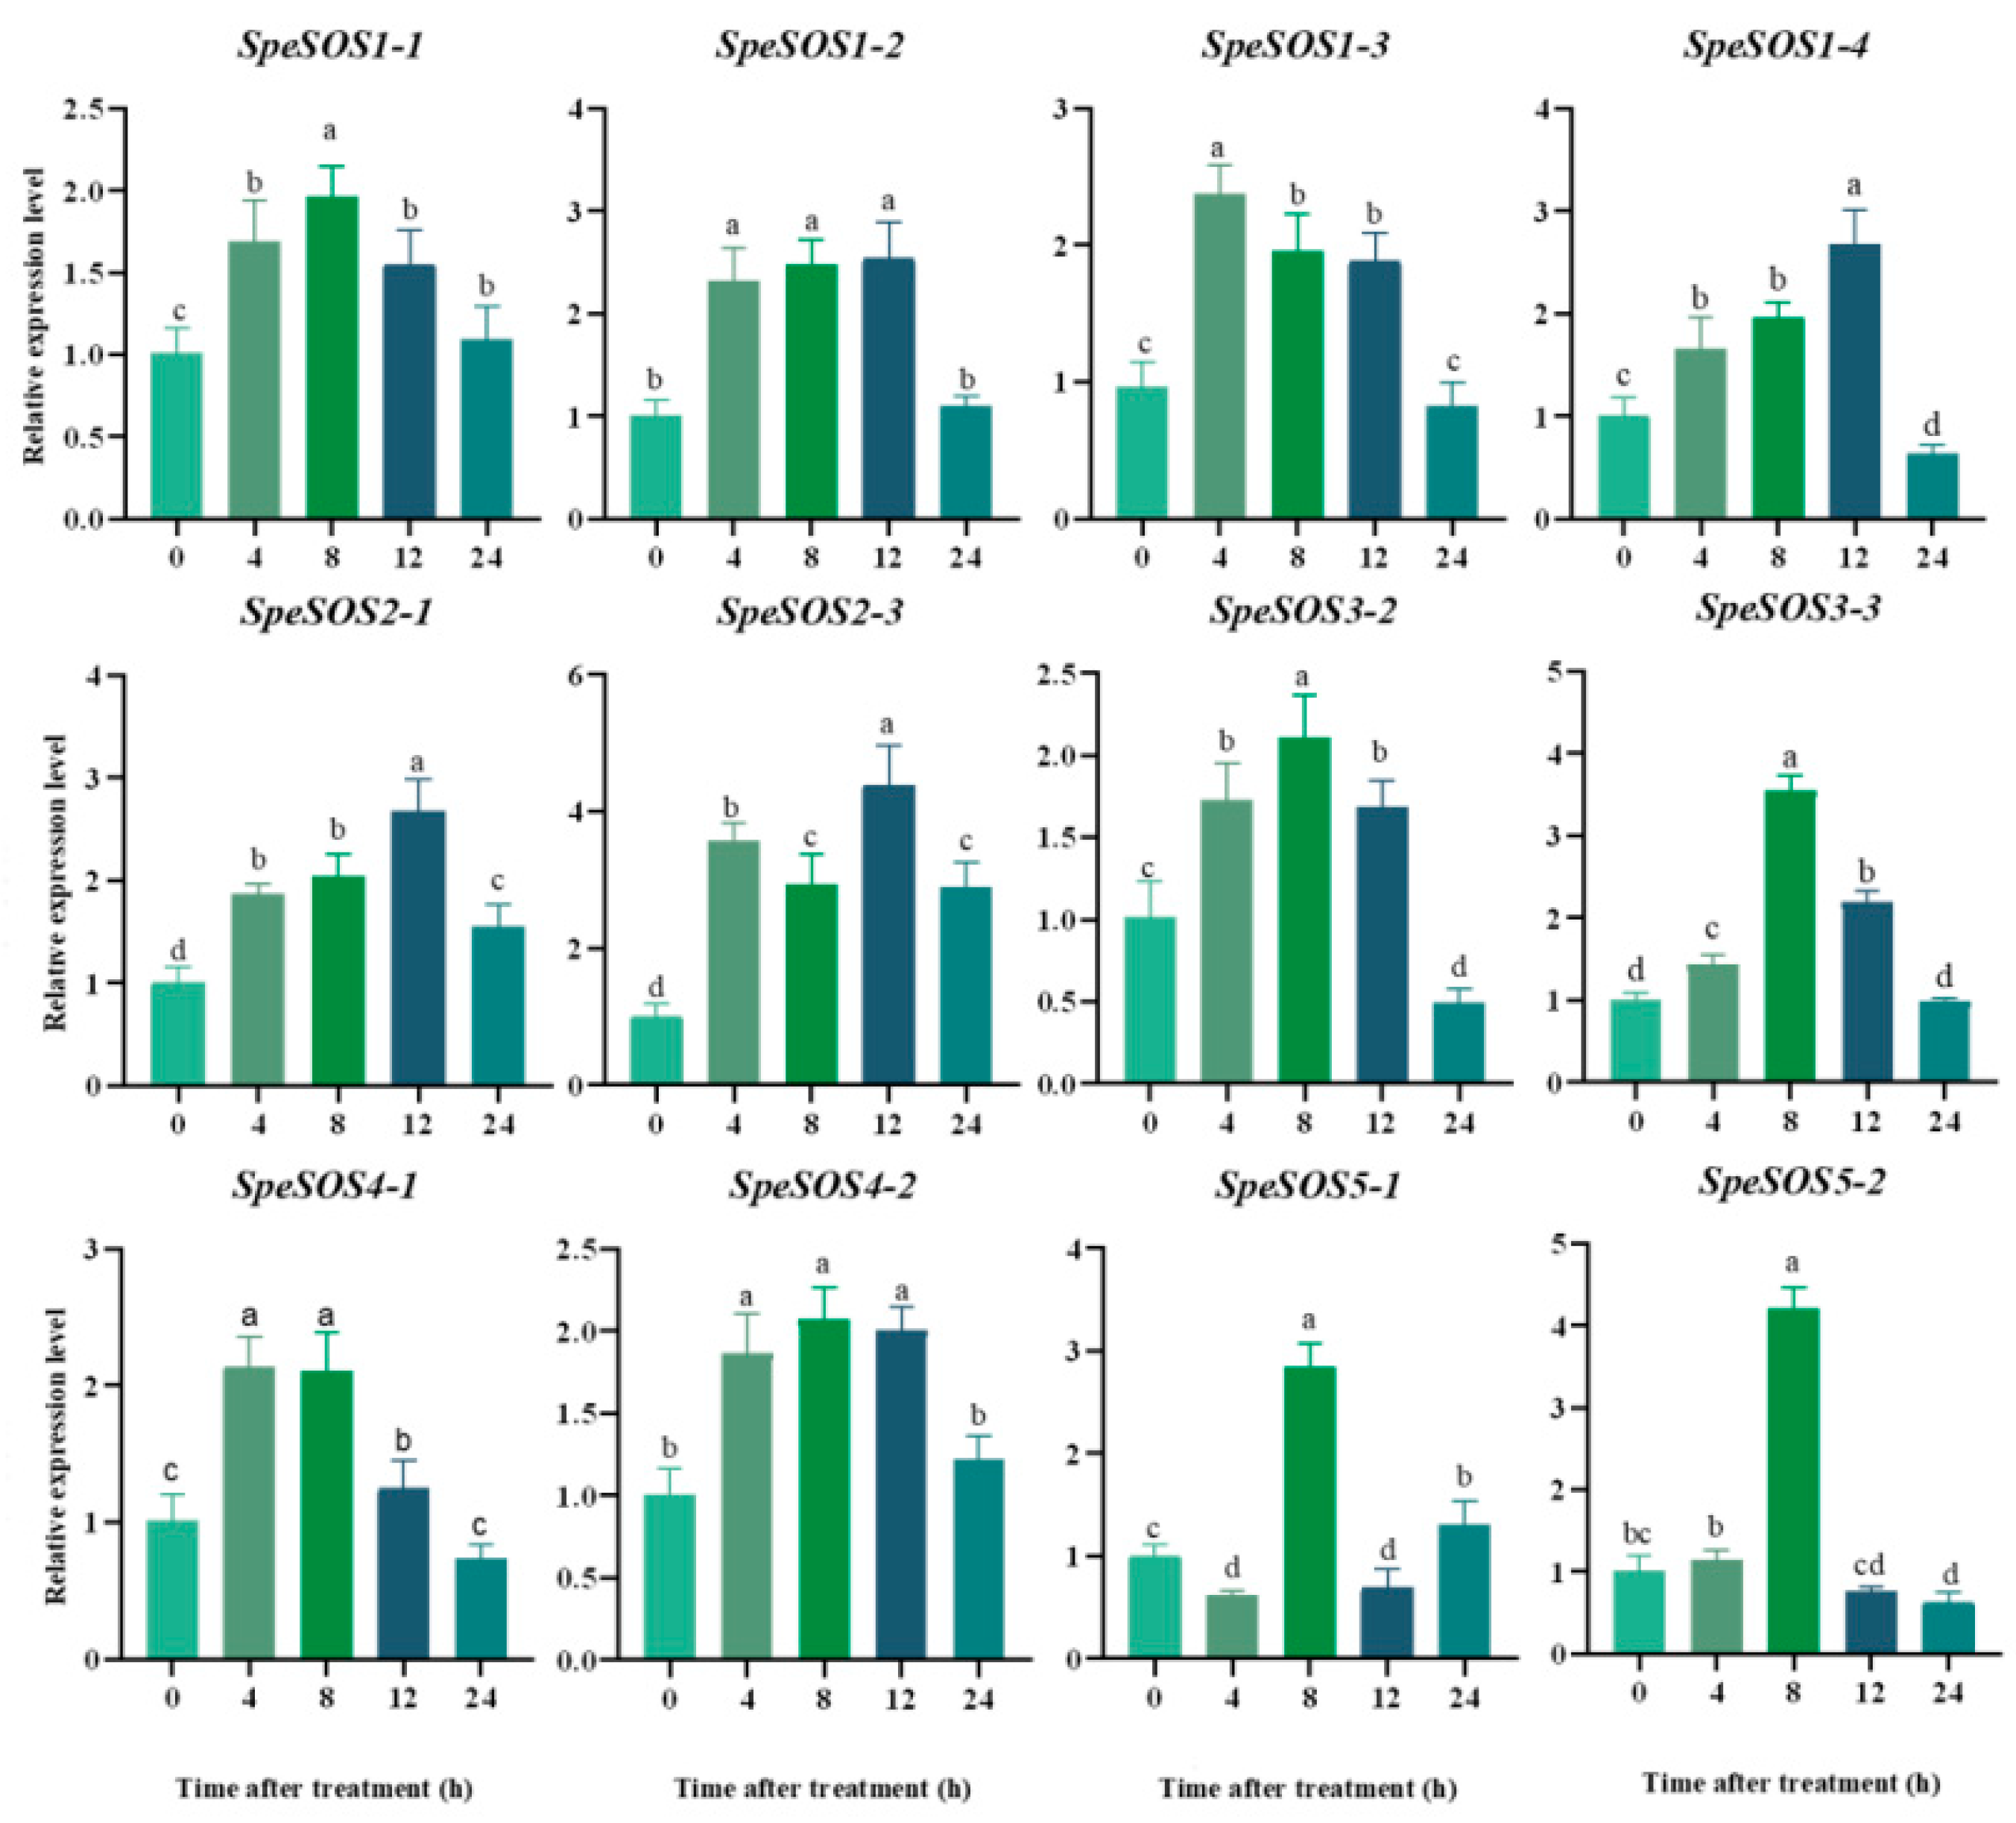
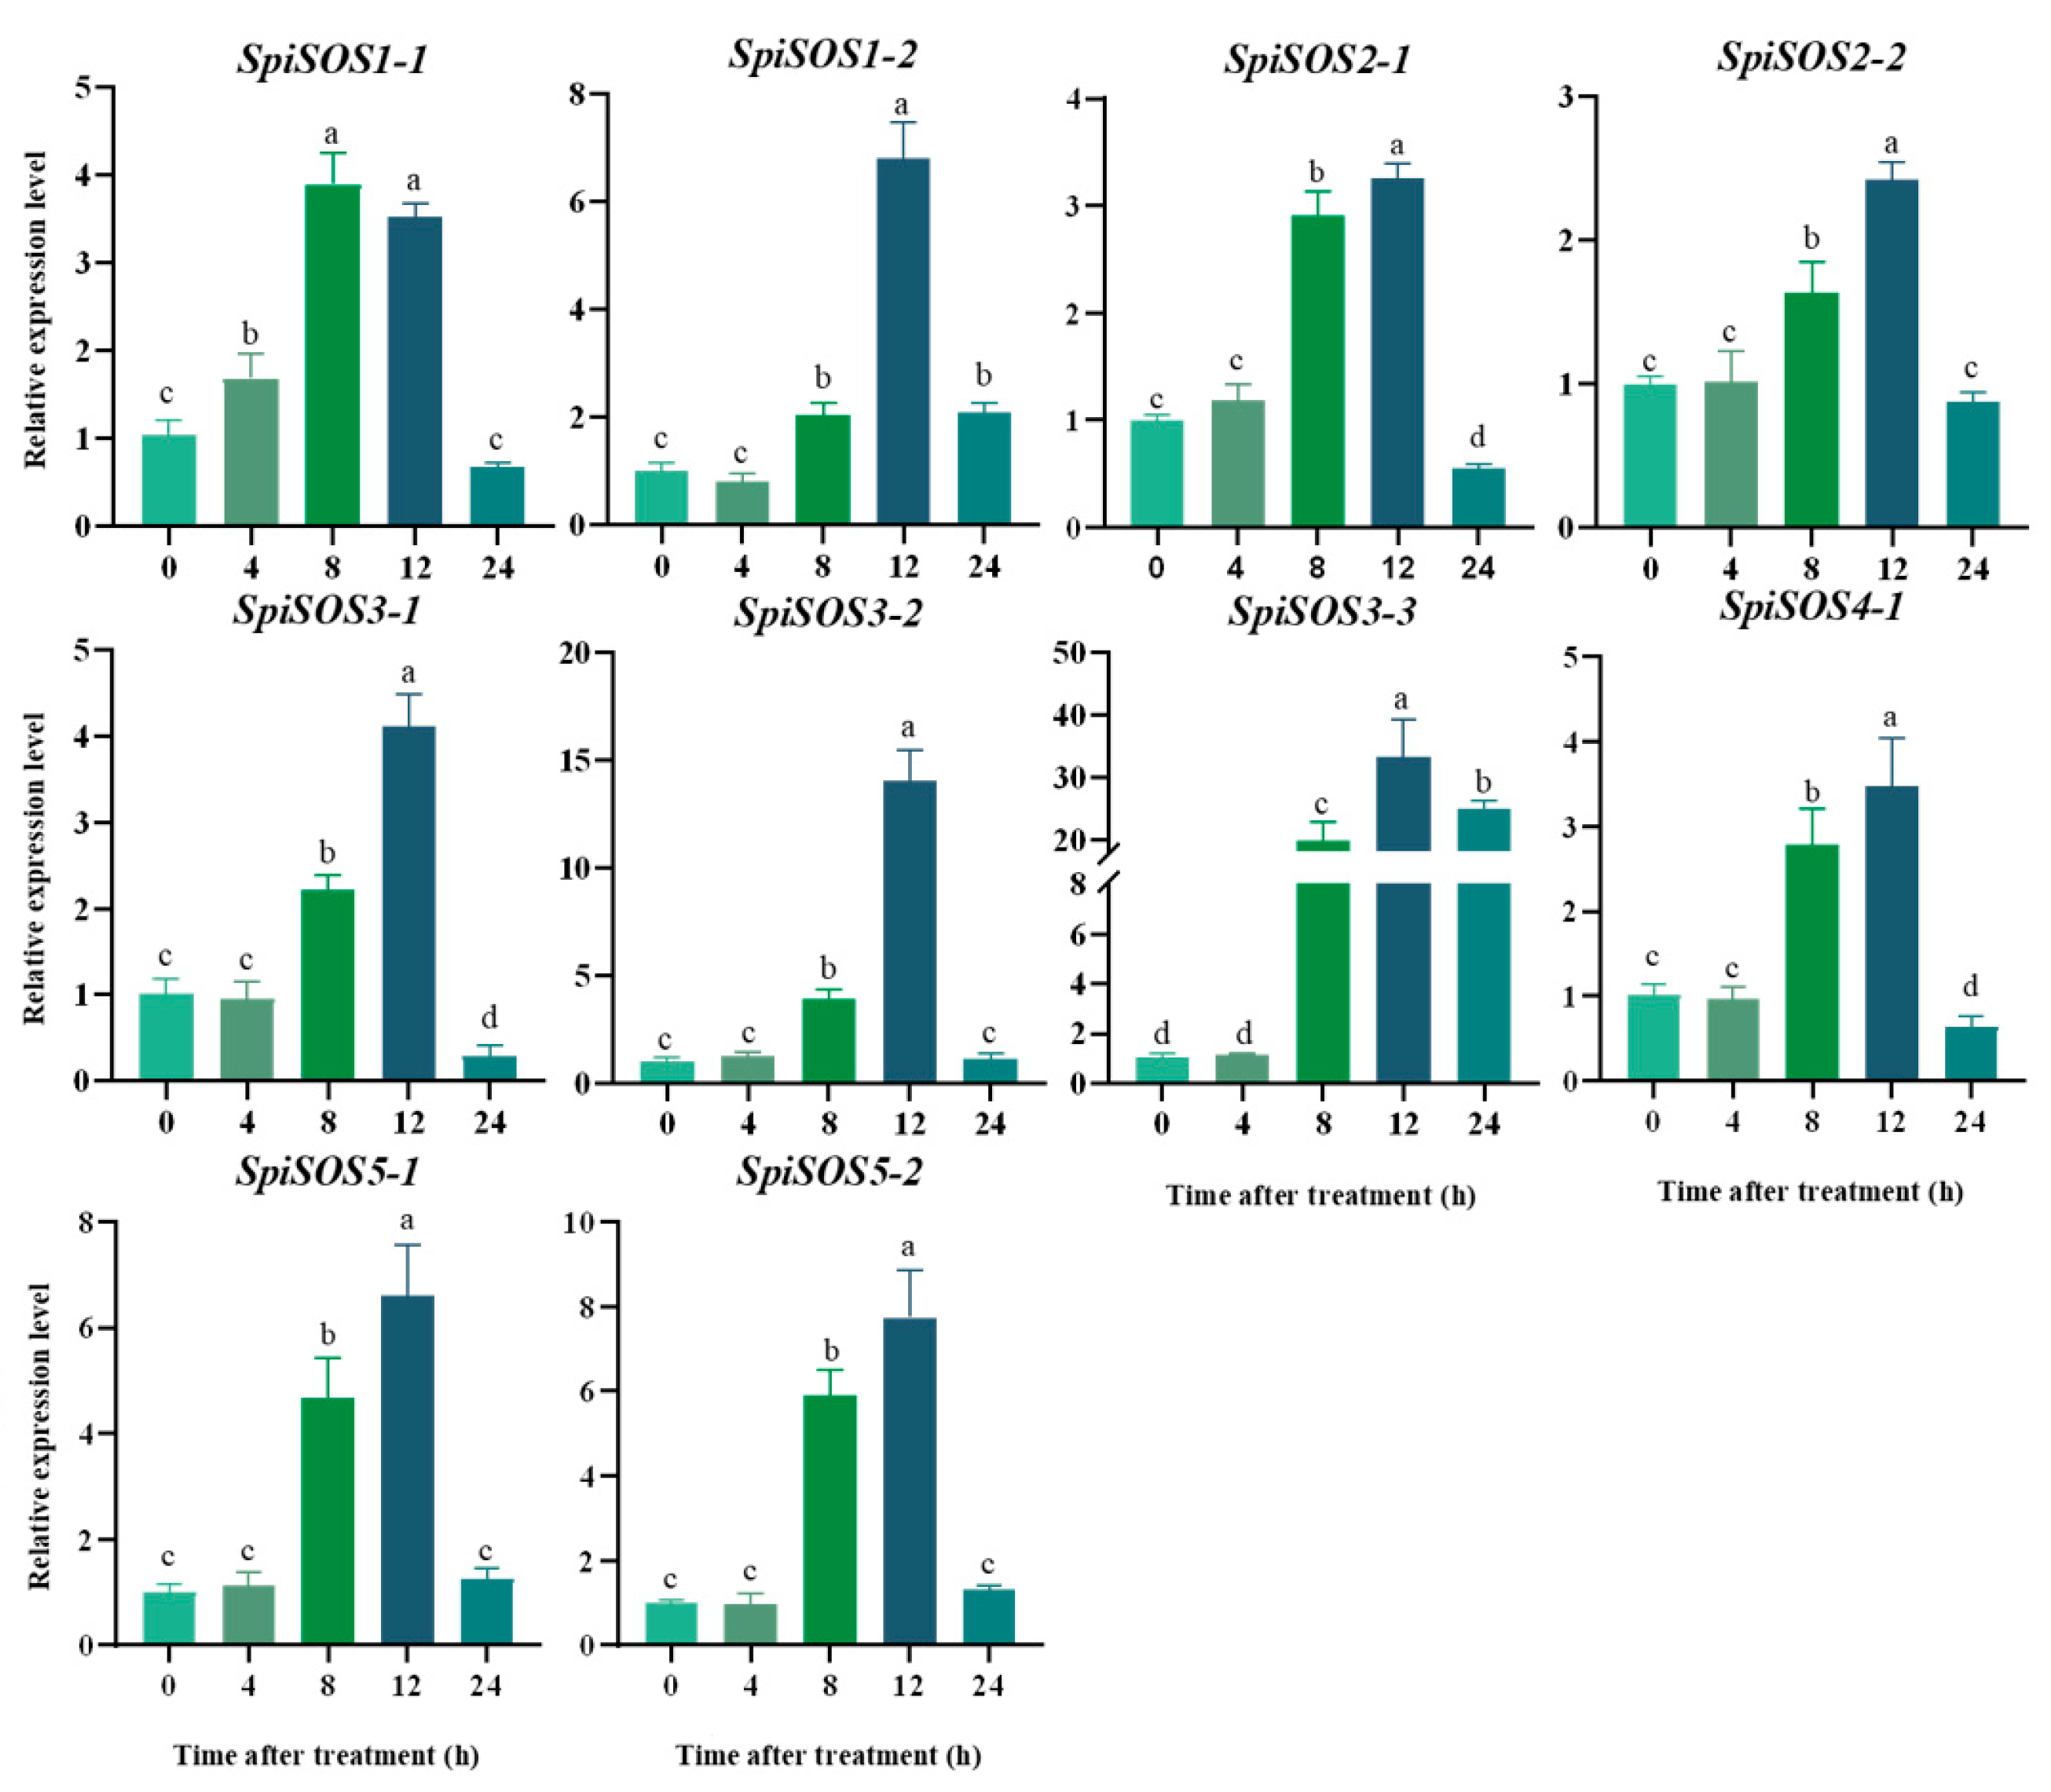
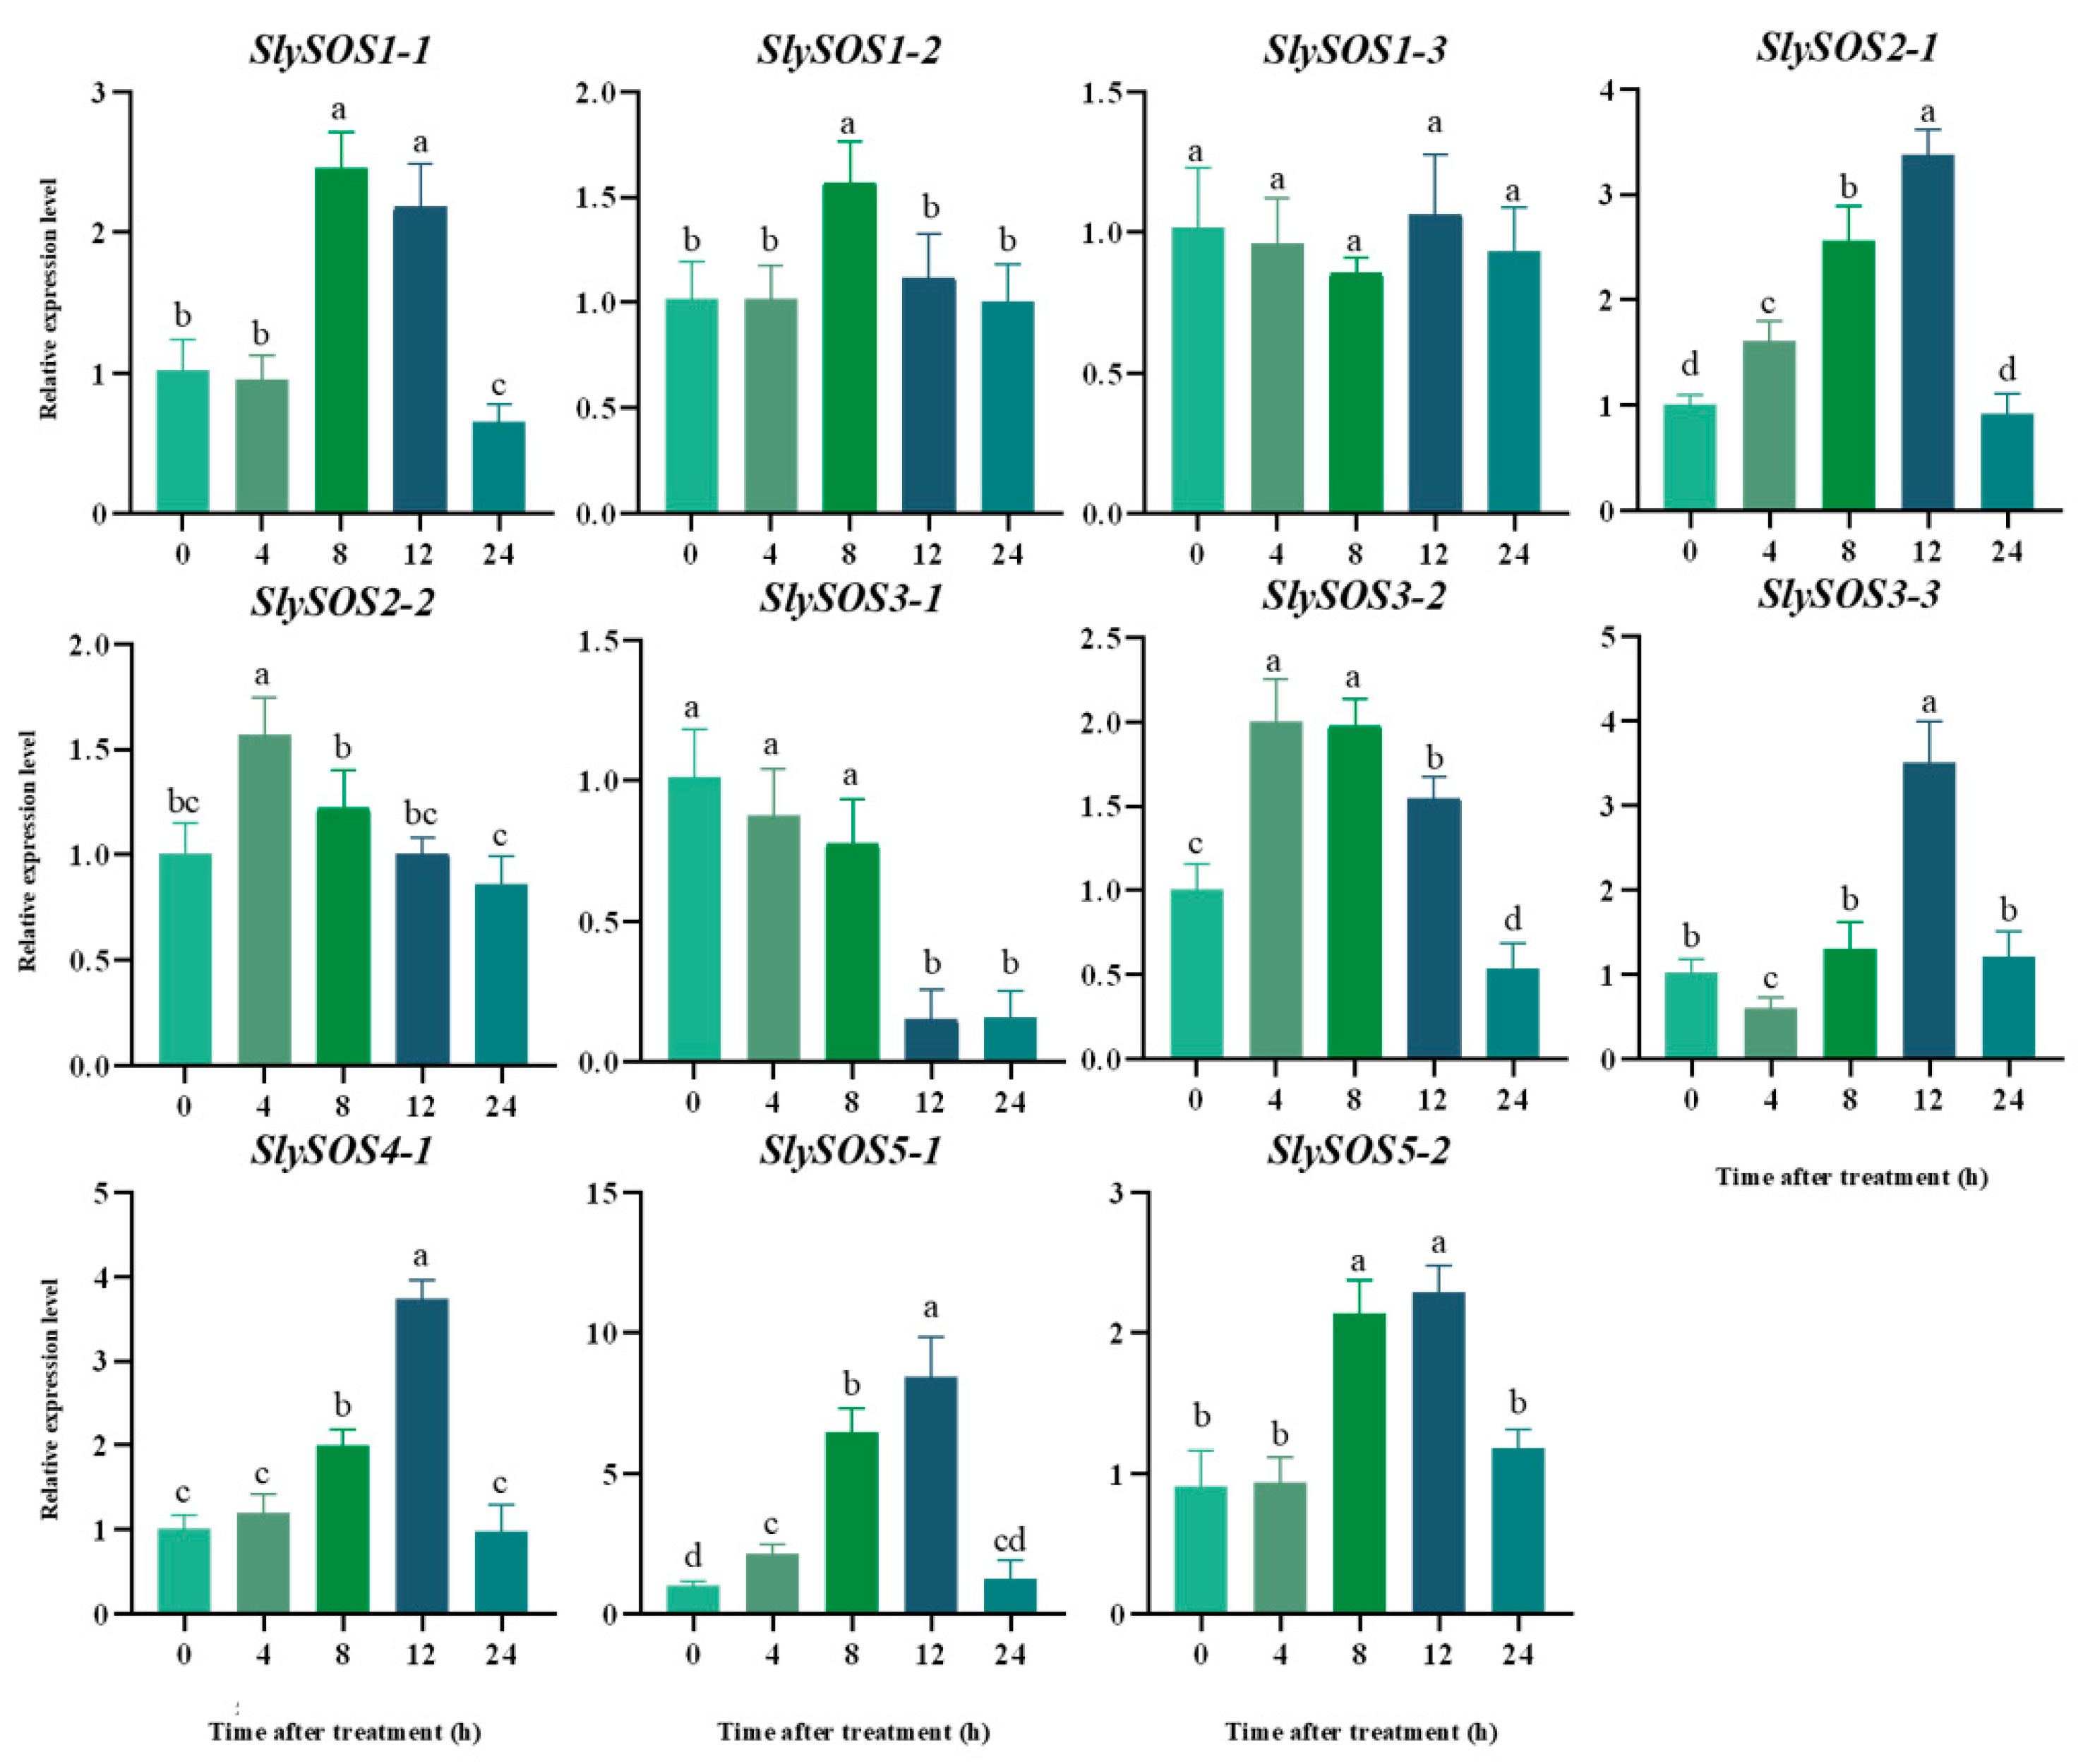
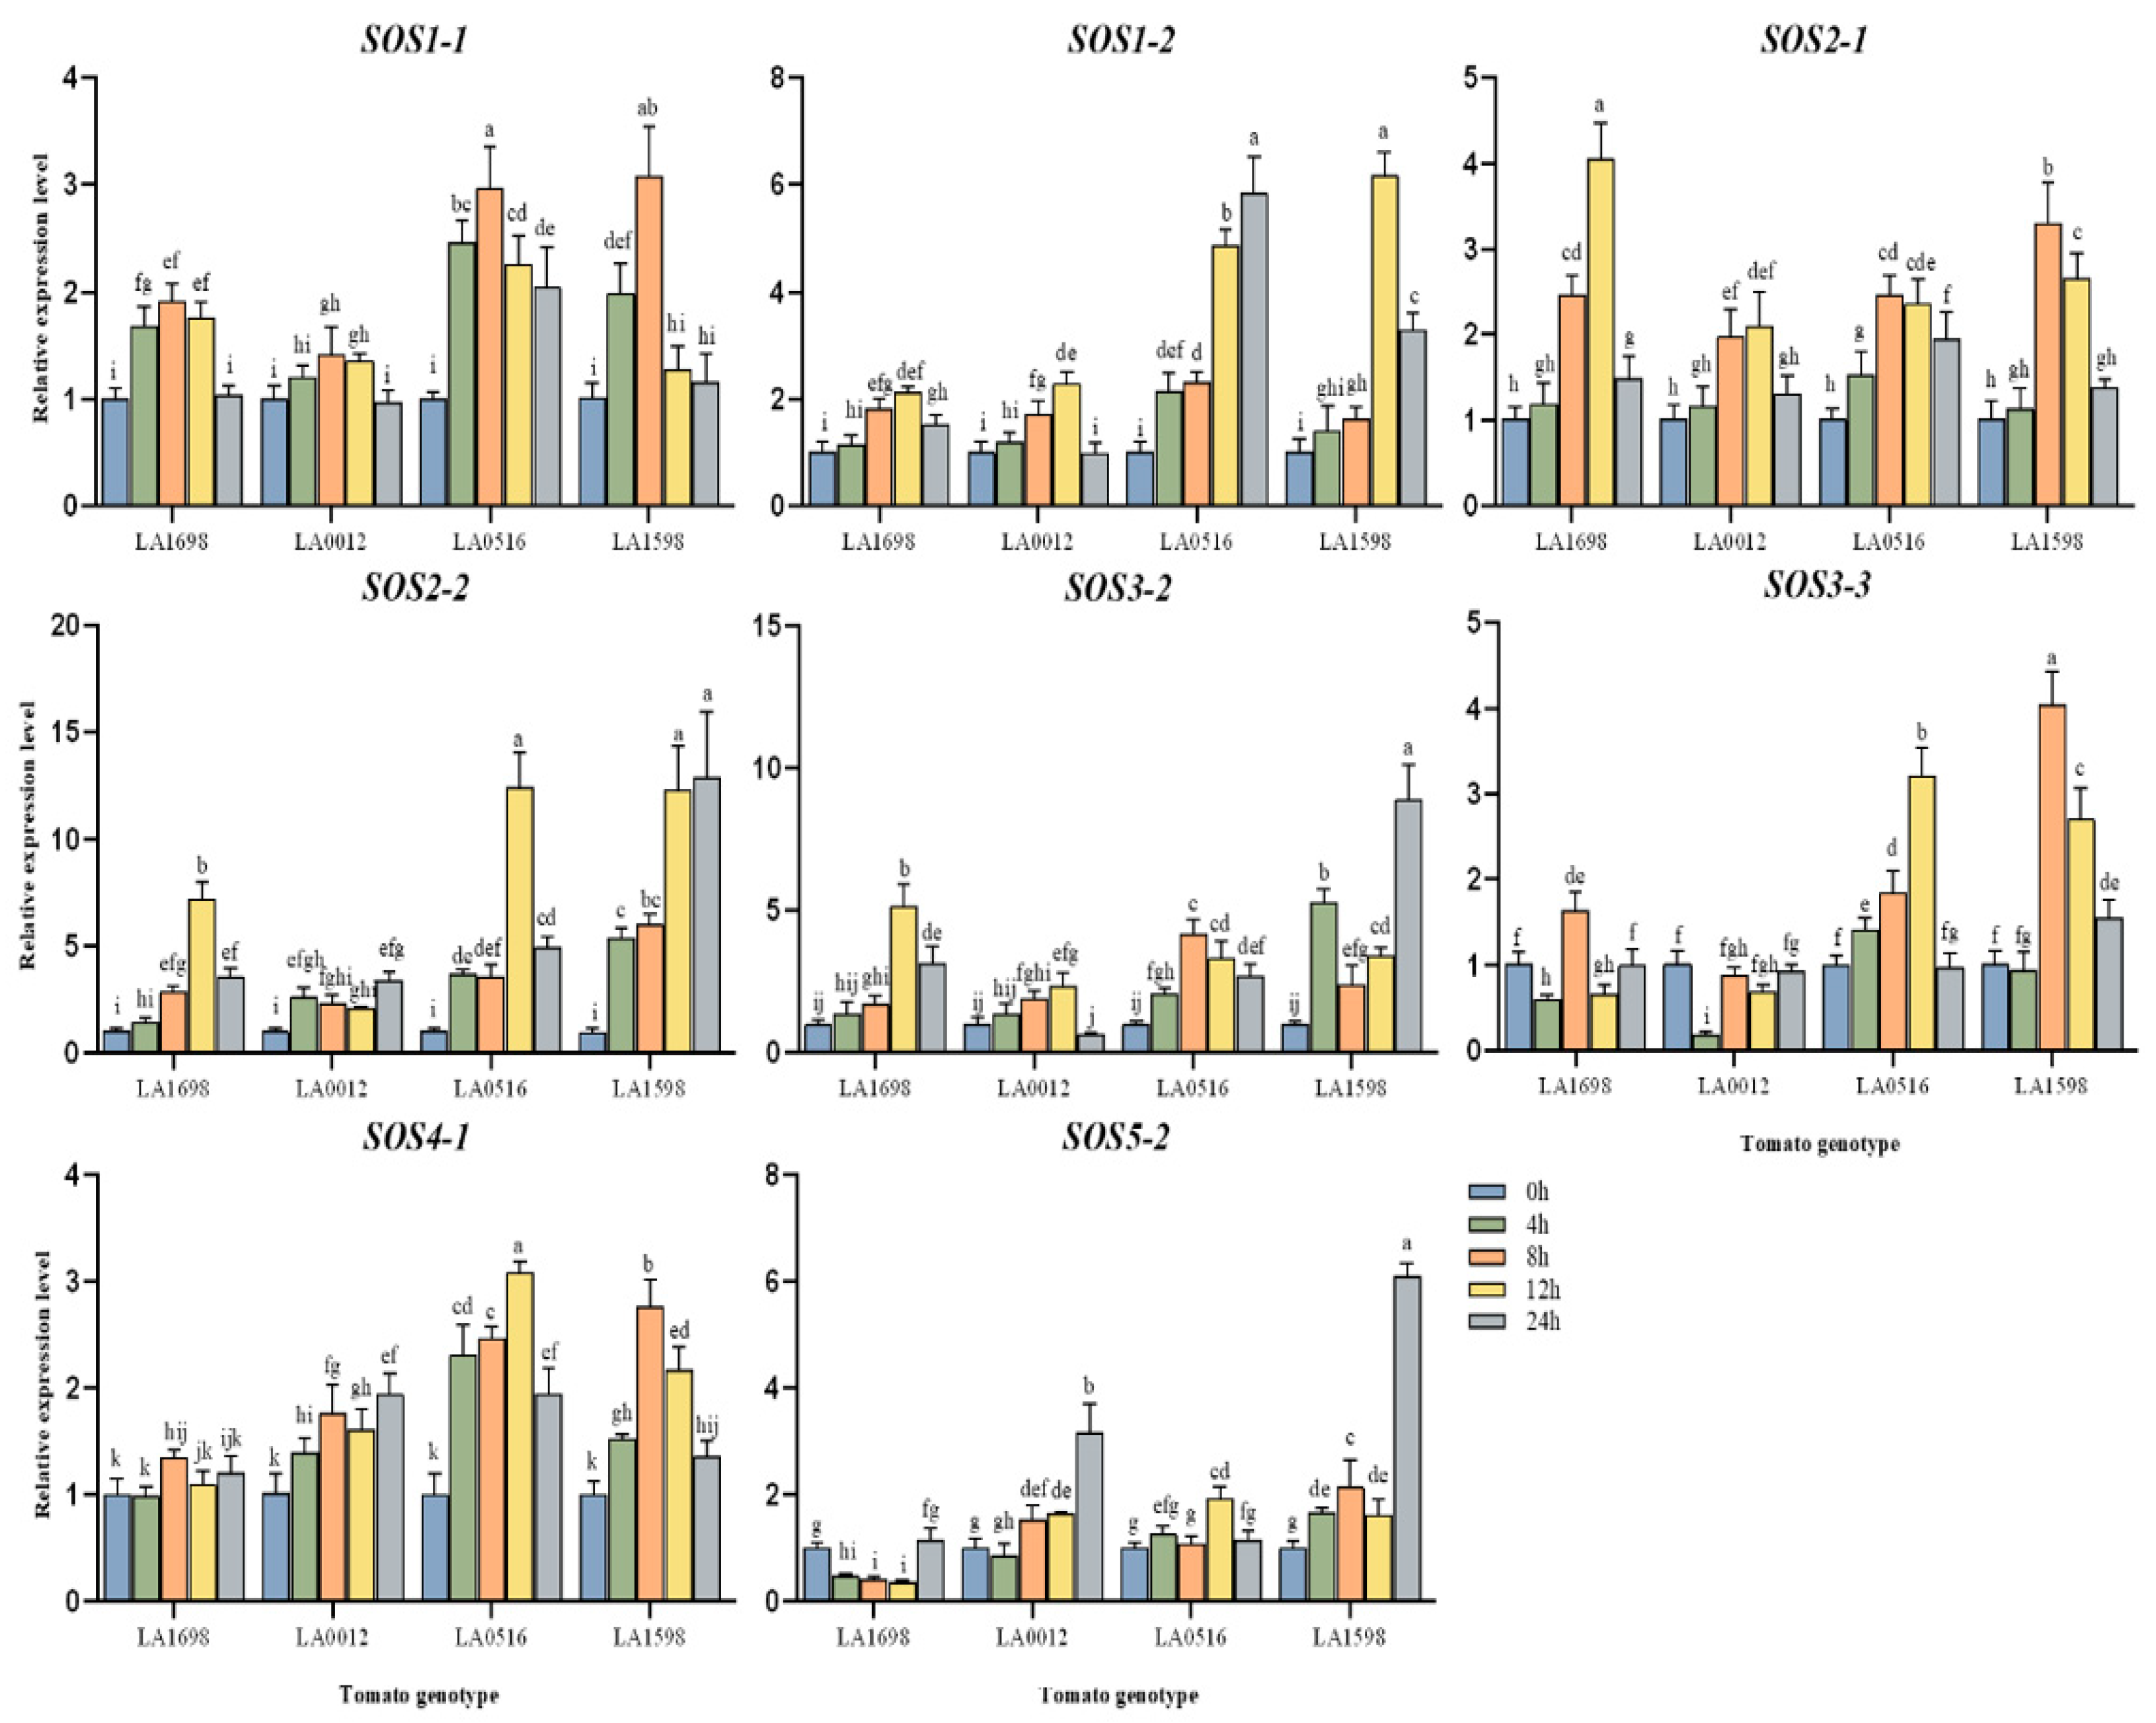
3.1.6. Spatio-Temporal Expression Pattern of the SOS Gene Family in Different Tomato Genotypes under Salt Stress
4. Discussion
4.1. Characteristics of the SOS Gene Family Members in Tomatoes
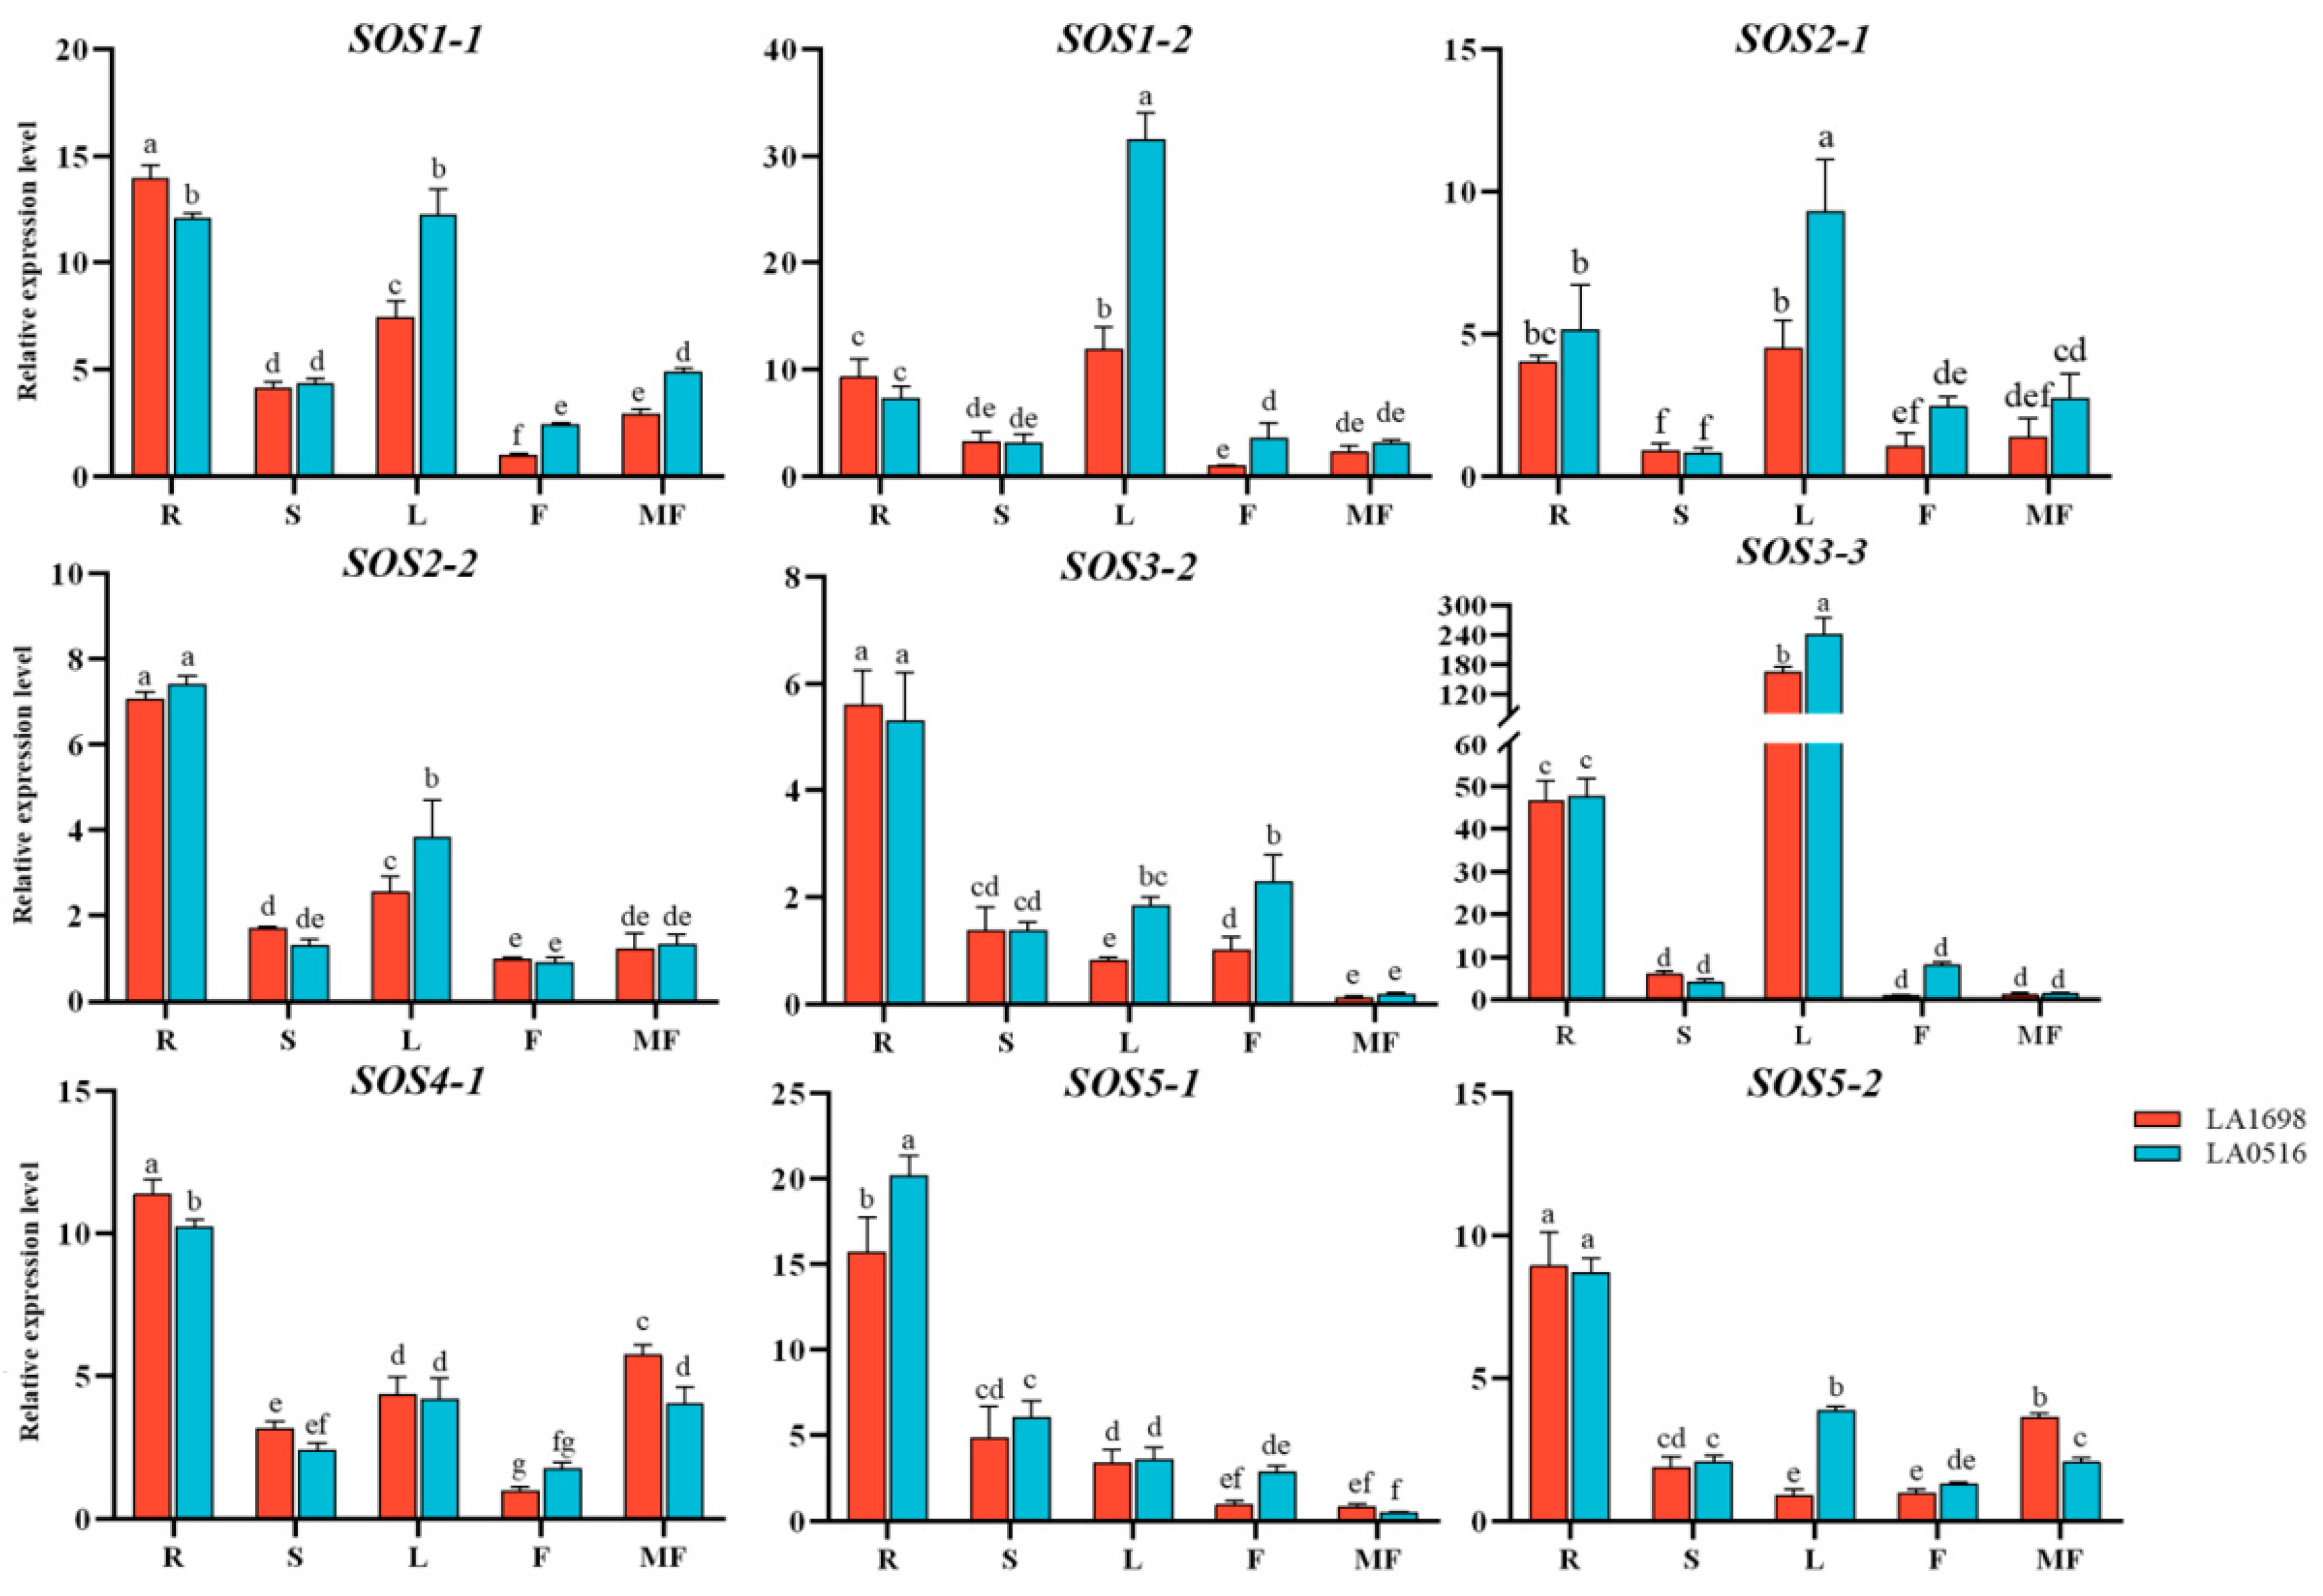
4.2. The Tomato SOS Gene Family May Be Positive Regulators in the Response to Salt Stress, with High Expression in the Roots and Leaves of Salt-Tolerant Tomatoes
Supplementary Materials
Author Contributions
Funding
Institutional Review Board Statement
Informed Consent Statement
Data Availability Statement
Acknowledgments
Conflicts of Interest
References
- FAO. 2023. Available online: https://www.fao.org/home/en/ (accessed on 3 March 2023).
- Cuartero, J.; Fernandez-Munoz, R. Tomato and salinity. Sci. Hortic. 1999, 1–4, 83–125. [Google Scholar] [CrossRef]
- Alam, P.; Arshad, M.; Al-Kheraif, A.A.; Azzam, M.A.; Al Balawi, T. Silicon Nanoparticle-Induced Regulation of Carbohydrate Metabolism, Photosynthesis, and ROS Homeostasis in Solanum lycopersicum Subjected to Salinity Stress. ACS Omega 2022, 7, 31834–31844. [Google Scholar] [CrossRef] [PubMed]
- Zhao, C.; Zhang, H.; Song, C.; Zhu, J.K.; Shabala, S. Mechanisms of plant responses and adaptation to soil salinity. Innovation 2020, 1, 100017. [Google Scholar] [CrossRef] [PubMed]
- Yang, Y.; Guo, Y. Elucidating the molecular mechanisms mediating plant salt-stress responses. New Phytol. 2018, 217, 523–539. [Google Scholar] [CrossRef] [PubMed]
- Takahashi, F.; Shinozaki, K. Long-distance signaling in plant stress response. Curr. Opin. Plant Biol. 2018, 47, 106–111. [Google Scholar] [CrossRef] [PubMed]
- Zhu, J. Abiotic Stress Signaling and Responses in Plants. Cell 2016, 167, 311–324. [Google Scholar] [CrossRef] [PubMed]
- Wu, S.J.; Ding, L.; Zhu, J.K. SOS1, a genetic locus essential for salt tolerance and potassium acquisition. Plant Cell 1996, 8, 617–627. [Google Scholar] [CrossRef] [PubMed]
- Zhu, J.; Liu, J.; Xiong, L. Genetic analysis of salt tolerance in Arabidopsis. Evidence for a critical role of potassium nutrition. Plant Cell 1998, 10, 1181–1191. [Google Scholar] [CrossRef]
- Liu, J.P.; Zhu, J.K. An Arabidopsis mutant that requires increased calcium for potassium nutrition and salt tolerance. Proc. Natl. Acad. Sci. USA 1997, 94, 14960–14964. [Google Scholar] [CrossRef]
- Shi, H.Z.; Zhu, J.K. SOS4, a pyridoxal kinase gene, is required for root hair development in Arabidopsis. Plant Physiol. 2002, 129, 585–593. [Google Scholar] [CrossRef]
- Shi, H.Z.; Kim, Y.; Guo, Y.; Stevenson, B.; Zhu, J.K. The Arabidopsis SOS5 locus encodes a putative cell surface adhesion protein and is required for normal cell expansion. Plant Cell 2003, 15, 19–32. [Google Scholar] [CrossRef] [PubMed]
- Cheng, C.H.; Zhong, Y.M.; Wang, Q.; Cai, Z.M.; Wang, D.D.; Li, C.M. Genome-wide identification and gene expression analysis of SOS family genes in tuber mustard (Brassica juncea var. tumida). PLoS ONE 2019, 14, e0224672. [Google Scholar] [CrossRef] [PubMed]
- Liu, Z.Y.; Xie, Q.J.; Tang, F.F.; Wu, J.; Dong, W.F.; Wang, C.; Gao, C.Q. The ThSOS3 Gene Improves the Salt Tolerance of Transgenic Tamarix hispida and Arabidopsis thaliana. Front. Plant Sci. 2021, 11, 597480. [Google Scholar] [CrossRef] [PubMed]
- Halfter, U.; Ishitani, M.; Zhu, J.K. The Arabidopsis SOS2 protein kinase physically interacts with and is activated by the calcium-binding protein SOS3. Proc. Natl. Acad. Sci. USA 2000, 97, 3735–3740. [Google Scholar] [CrossRef] [PubMed]
- Lin, H.X.; Yang, Y.Q.; Quan, R.D.; Mendoza, I.; Wu, Y.S.; Du, W.M.; Zhao, S.S.; Schumaker, K.S.; Pardo, J.M.; Guo, Y. Phosphorylation of SOS3-LIKE CALCIUM BINDING PROTEIN8 by SOS2 Protein Kinase Stabilizes Their Protein Complex and Regulates Salt Tolerance in Arabidopsis. Plant Cell 2009, 21, 1607–1619. [Google Scholar] [CrossRef] [PubMed]
- Qiu, Q.; Schumaker, K.S.; Zhu, J. Regulation of vacuolar membrane Na+/H+ exchange activity in Arabidopsis thalian a by the SOS pathway. Plant Biol. 2002, 2002, 69. [Google Scholar]
- Yin, X.C.; Xia, Y.Q.; Xie, Q.; Cao, Y.X.; Wang, Z.Y.; Hao, G.P.; Song, J.; Zhou, Y.; Jiang, X.Y. The protein kinase complex CBL10-CIPK8-SOS1 functions in Arabidopsis to regulate salt tolerance. J. Exp. Bot. 2020, 71, 1801–1814. [Google Scholar] [CrossRef] [PubMed]
- Olías, R.; Eljakaoui, Z.; Li, J.; De Morales, P.A.; Marin-Manzano, M.C.; Pardo, J.M.; Belver, A. The plasma membrane Na+/H+ antiporter SOS1 is essential for salt tolerance in tomato and affects the partitioning of Na+ between plantorgans. Plant Cell Environ. 2009, 32, 904–916. [Google Scholar] [CrossRef]
- Park, H.J.; Qiang, Z.; Kim, W.Y.; Yun, D.J. Diurnal and circadian regulation of salt tolerance in Arabidopsis. J. Plant Biol. 2016, 59, 569–578. [Google Scholar] [CrossRef]
- Huertas, R.; Olías, R.; Eljakaoui, Z.; Gálvez, F.J.; Li, J.; De Morales, P.A.; Belver, A.; Rodríguez-Rosales, M.P. Overexpression of SlSOS2 (SlCIPK24) confers salt tolerance to transgenic tomato. Plant Cell Environ. 2012, 35, 1467–1482. [Google Scholar] [CrossRef]
- Cheng, N.H.; Pittman, J.K.; Zhu, J.K.; Hirschi, K.D. The protein kinase SOS2 activates the Arabidopsis H+/Ca2+ antiporter CAX1 to integrate calcium transport and salt tolerance. J. Biol. Chem. 2004, 279, 2922–2926. [Google Scholar] [CrossRef] [PubMed]
- Verslues, P.E.; Batelli, G.; Grillo, S.; Agius, F.; Mm, Y.S.; Zhu, J.; Agarwal, M.; Katiyar-Agarwal, S.; Zhu, J.K. Interaction of SOS2 with nucleoside diphosphate kinase 2 and catalases reveals a point of connection between salt stress and H2O2 signaling in Arabidopsis thaliana. Mol. Cell. Biol. 2007, 27, 7771–7780. [Google Scholar] [CrossRef] [PubMed]
- Ji, H.T.; Pardo, J.M.; Batelli, G.; Van Oosten, M.J.; Bressan, R.A.; Li, X. The Salt Overly Sensitive (SOS) Pathway: Established and Emerging Roles. Mol. Plant. 2013, 6, 275–286. [Google Scholar] [CrossRef] [PubMed]
- Shi, H.Z.; Xiong, L.M.; Stevenson, B.; Lu, T.G.; Zhu, J.K. The Arabidopsis salt overly sensitive 4 mutants uncover a critical role for vitamin B6 in plant salt tolerance. Plant Cell 2002, 14, 575–588. [Google Scholar] [CrossRef] [PubMed]
- Seifert, G.J.; Xue, H.; Acet, T. The Arabidopsis thaliana FASCICLIN LIKE ARABINOGALACTAN PROTEIN 4 gene actssynergistically with abscisic acid signalling to control root growth. Ann. Bot. 2014, 114, 1125–1133. [Google Scholar] [CrossRef] [PubMed]
- Ma, D.M.; Xu, W.R.; Li, H.W.; Jin, F.X.; Guo, L.N.; Wang, J.; Dai, H.J.; Xu, X. Co-expression of the Arabidopsis SOS genes enhances salt tolerance in transgenic tall fescue (Festuca arundinacea Schreb.). Protoplasma 2014, 251, 219–231. [Google Scholar] [CrossRef] [PubMed]
- Martínez-Atienza, J.; Jiang, X.Y.; Garciadeblas, B.; Mendoza, I.; Zhu, J.K.; Pardo, J.M.; Quintero, F.J. Conservation of the salt overly sensitive pathway in rice. Plant Physiol. 2007, 143, 1001–1012. [Google Scholar] [CrossRef]
- Sathee, L.; Sairam, R.K.; Chinnusamy, V.; Jha, S.K. Differential transcript abundance of salt overly sensitive (SOS) pathway genes is a determinant of salinity stress tolerance of wheat. Acta Physiol. Plant. 2015, 37, 169. [Google Scholar] [CrossRef]
- Ma, Y.C.; Wang, L.; Wang, J.Y.; Zhong, Y.; Cheng, Z.M. Isolation and expression analysis of Salt Overly Sensitive gene family in grapevine (Vitisvinifera) in response to salt and PEG stress. PLoS ONE 2019, 14, e0212666. [Google Scholar] [CrossRef]
- Brindha, C.; Vasantha, S.; Raja, A.K.; Tayade, A.S. Characterization of the Salt Overly Sensitive pathway genes in sugarcane under salinity stress. Physiol. Plant. 2021, 171, 677–687. [Google Scholar] [CrossRef]
- Chen, C.J.; Chen, H.; Zhang, Y.; Thomas, H.R.; Frank, M.H.; He, Y.H.; Xia, R. TBtools: An Integrative Toolkit Developed for Interactive Analyses of Big Biological Data. Mol. Plant. 2020, 13, 1194–1202. [Google Scholar] [CrossRef] [PubMed]
- Marchler-Bauer, A.; Bo, Y.; Han, L.Y.; He, J.E.; Lanczycki, C.J.; Lu, S.N.; Chitsaz, F.; Derbyshire, M.K.; Geer, R.C.; Gonzales, N.R.; et al. CDD/SPARCLE: Functional classification of proteins via subfamily domain architectures. Nucleic Acids Res. 2017, 45, D200–D203. [Google Scholar] [CrossRef] [PubMed]
- Gasteiger, E.; Gattiker, A.; Hoogland, C.; Ivanyi, I.; Appel, R.D.; Bairoch, A. ExPASy: The proteomics server for in-depth protein knowledge and analysis. Nucleic Acids Res. 2003, 31, 3784–3788. [Google Scholar] [CrossRef] [PubMed]
- Chou, K.C.; Shen, H.B. Plant-mPLoc: A Top-Down Strategy to Augment the Power for Predicting Plant Protein Subcellular Localization. PLoS ONE 2010, 5, e11335. [Google Scholar] [CrossRef] [PubMed]
- Kumar, S.; Stecher, G.; Li, M.; Knyaz, C.; Tamura, K. MEGA X: Molecular Evolutionary Genetics Analysis across Computing Platforms. Mol. Biol. Evol. 2018, 35, 1547–1549. [Google Scholar] [CrossRef] [PubMed]
- Wang, Y.P.; Tang, H.B.; Debarry, J.D.; Tan, X.; Li, J.P.; Wang, X.Y.; Lee, T.H.; Jin, H.Z.; Marler, B.; Guo, H.; et al. MCScanX: A toolkit for detection and evolutionary analysis of gene synteny and collinearity. Nucleic Acids Res. 2012, 40, e49. [Google Scholar] [CrossRef]
- Lescot, M.; Déhais, P.; Thijs, G.; Marchal, K.; Moreau, Y.; Van de Peer, Y.; Rouzé, P.; Rombauts, S. PlantCARE, a database of plant cis-acting regulatory elements and a portal to tools for in silico analysis of promoter sequences. Nucleic Acids Res. 2002, 30, 325–327. [Google Scholar] [CrossRef] [PubMed]
- Hoffmann, J.; Berni, R.; Sutera, F.M.; Gutsch, A.; Hausman, J.F.; Saffie-Siebert, S.; Guerriero, G. The Effects of Salinity on the Anatomy and Gene Expression Patterns in Leaflets of Tomato cv. Micro-Tom. Genes 2021, 12, 1165. [Google Scholar] [CrossRef] [PubMed]
- Chen, H.X.; Wang, T.P.; He, X.N.; Cai, X.; Lin, R.M.; Liang, J.L.; Wu, J.; King, G.; Wang, X.W. BRAD V3.0: An upgraded Brassicaceae database. Nucleic Acids Res. 2022, 50, D1432–D1441. [Google Scholar] [CrossRef]
- Yamaguchi-Shinozaki, K.; Shinozaki, K. Organization of cis-acting regulatory elements in osmotic- and cold-stress-responsive promoters. Trends Plant Sci. 2005, 10, 88–94. [Google Scholar] [CrossRef]
- Feki, K.; Brini, F.; Ben Amar, S.; Saibi, W.; Masmoudi, K. Comparative functional analysis of two wheat Na+/H+ antiporter SOS1 promoters in Arabidopsis thaliana under various stress conditions. J. Appl. Genet. 2015, 56, 15–26. [Google Scholar] [CrossRef] [PubMed]
- Acet, T.; Kadioglu, A. SOS5 gene-abscisic acid crosstalk and their interaction with antioxidant system in Arabidopsis thaliana under salt stress. Physiol. Mol. Biol. Plants 2020, 26, 1831–1845. [Google Scholar] [CrossRef] [PubMed]
- Zhao, C.Y.; William, D.; Sandhu, D. Isolation and characterization of Salt Overly Sensitive family genes in spinach. Physiol. Plant. 2021, 171, 520–532. [Google Scholar] [CrossRef] [PubMed]
- Zhu, J.K. Cell signaling under salt, water and cold stresses. Curr. Opin. Plant Biol. 2001, 4, 401–406. [Google Scholar] [CrossRef]
- Caro, M.; Cruz, V.; Cuartero, J.; Estan, M.T.; Bolarin, M.C. Salinity tolerance of normal-fruited and cherry tomato cultivars. Plant Soil 1991, 136, 249–255. [Google Scholar] [CrossRef]
- Sun, W.; Xu, X.N.; Zhu, H.S.; Liu, A.H.; Liu, L.; Li, J.M.; Hua, X.J. Comparative Transcriptomic Profiling of a Salt-Tolerant Wild Tomato Species and a Salt-Sensitive Tomato Cultivar. Plant Cell Physiol. 2010, 51, 997–1006. [Google Scholar] [CrossRef] [PubMed]
- Chakraborty, K.; Sairam, R.K.; Bhattacharya, R.C. Differential expression of salt overly sensitive pathway genes determines salinity stress tolerance in Brassica genotypes. Plant Physiol. Biochem. 2012, 51, 90–101. [Google Scholar] [CrossRef] [PubMed]
- Nutan, K.K.; Kumar, G.; Singla-Pareek, S.L.; Pareek, A. A Salt Overly Sensitive Pathway Member from Brassica juncea BjSOS3 Can Functionally Complement ΔAtsos3 in Arabidopsis. Curr. Genom. 2018, 19, 60–69. [Google Scholar] [CrossRef] [PubMed]
- Shi, H.Z.; Quintero, F.J.; Pardo, J.M.; Zhu, J.K. The putative plasma membrane Na+/H+ antiporter SOS1 controls long-distance Na+ transport in plants. Plant Cell 2002, 14, 465–477. [Google Scholar] [CrossRef]
- Liu, J.; Ishitani, M.; Halfter, U.; Kim, C.S.; Zhu, J.K. The Arabidopsis thaliana SOS2 gene encodes a protein kinase that is required for salt tolerance. Proc. Natl. Acad. Sci. USA 2000, 97, 3730–3734. [Google Scholar] [CrossRef]
- Munns, R.; Tester, M. Mechanisms of salinity tolerance. Annu. Rev. Plant Biol. 2008, 59, 651–681. [Google Scholar] [CrossRef] [PubMed]


Disclaimer/Publisher’s Note: The statements, opinions and data contained in all publications are solely those of the individual author(s) and contributor(s) and not of MDPI and/or the editor(s). MDPI and/or the editor(s) disclaim responsibility for any injury to people or property resulting from any ideas, methods, instructions or products referred to in the content. |
© 2024 by the authors. Licensee MDPI, Basel, Switzerland. This article is an open access article distributed under the terms and conditions of the Creative Commons Attribution (CC BY) license (https://creativecommons.org/licenses/by/4.0/).
Share and Cite
Huang, J.; Liu, J.; Jiang, F.; Liu, M.; Chen, Z.; Zhou, R.; Wu, Z. Identification and Expression Pattern Analysis of the SOS Gene Family in Tomatoes. Agronomy 2024, 14, 773. https://doi.org/10.3390/agronomy14040773
Huang J, Liu J, Jiang F, Liu M, Chen Z, Zhou R, Wu Z. Identification and Expression Pattern Analysis of the SOS Gene Family in Tomatoes. Agronomy. 2024; 14(4):773. https://doi.org/10.3390/agronomy14040773
Chicago/Turabian StyleHuang, Jiahui, Jiayu Liu, Fangling Jiang, Min Liu, Zheng Chen, Rong Zhou, and Zhen Wu. 2024. "Identification and Expression Pattern Analysis of the SOS Gene Family in Tomatoes" Agronomy 14, no. 4: 773. https://doi.org/10.3390/agronomy14040773
APA StyleHuang, J., Liu, J., Jiang, F., Liu, M., Chen, Z., Zhou, R., & Wu, Z. (2024). Identification and Expression Pattern Analysis of the SOS Gene Family in Tomatoes. Agronomy, 14(4), 773. https://doi.org/10.3390/agronomy14040773