Article

Competition Indices and Economic Benefits of Winter Wheat and Winter Peas in Mixed Cropping

1
Department of Agronomy, Institute of Agronomy, Hungarian University of Agriculture and Life Sciences, Páter Károly út 1, 2100 Gödöllő, Hungary
2
Cereal Research Non-Profit Ltd., Alsó-kikötő sor 9, 6726 Szeged, Hungary
3
Institute of Plant Sciences and Environmental Protection, Faculty of Agriculture, University of Szeged, Andrássy út 15, 6800 Hódmezővásárhely, Hungary
4
Department of Applied Statistics, Institute of Mathematics and Basic Science, Hungarian University of Agriculture and Life Sciences, Villányi út 29-43, 1118 Budapest, Hungary
*
Author to whom correspondence should be addressed.
Agronomy 2024, 14(4), 786; https://doi.org/10.3390/agronomy14040786
Submission received: 4 March 2024 / Revised: 23 March 2024 / Accepted: 8 April 2024 / Published: 10 April 2024
(This article belongs to the Section Agroecology Innovation: Achieving System Resilience)

Abstract

:
Intensive wheat production, which produces high yields through the excessive use of chemical inputs and non-renewable energy, is unsustainable in the long term. Innovative cultivation methods such as intercropping can address emerging challenges. This kind of plant association offers the possibility of achieving a balanced yield with the use of a natural nitrogen source. An experiment was conducted for three growing seasons (2020/2021, 2021/2022, 2022/2023) with a combination of three winter wheat varieties (GK Szilárd, Cellule, GK Csillag) and a winter pea variety (Aviron) in three sowing densities to determine the species interaction and the economics of mixed plots. The intercropping systems were evaluated in terms of the land equivalent ratio (LER), aggressivity (A), competitive ratio CR), actual yield loss (AYL), monetary advantage index (MAI), and intercropping advantage (IA). In almost all mixtures, the values of partial A, CR, and AYL indicated that wheat was more competitive than peas due to the overconcentration of mixtures. For MAI, the mixture Cellule/Aviron 75:50 was more profitable than the others in the first two years. Our results draw attention to the influence of the seeding rate, which can contribute to new directions for current research.

1. Introduction

During the 20th century, a shift from predominantly labor-intensive systems to intensive cultivation brought about a major change in agriculture [1,2]. This development was clearly triggered by the invention of the industrial process for synthesizing N fertilizers. The use of synthetic fertilizers entailed new varieties and remarkable enhancements in crop yield around the world [3,4]. Modern agriculture is based on the choice of species that can ensure the best short-term profitability, replacing biodiversity with a few crops over large areas [5,6]. Agriculture is a tradition and heritage in Hungary. Significant development has accelerated since the 1960s, which is attributed both to the increased level of mechanization and agrochemical tools (plant protection and nutrition) and to breeding and genetic development [7]. Currently, five crops are grown on about two thirds of arable land, which inevitably leads to the oversimplification of the sowing structure [8]. The narrower range of products makes us vulnerable to fluctuating market demands and the increasing effects of extreme weather events [9]. Nitrogen is the most limiting nutrient in plant growth, and thus, its presence has been considered for many years as a guarantee of maintaining high yields [10,11]. However, the excessive use of nitrogen (N) fertilizers comes at a significant monetary cost [12] and can also cause serious environmental damage, such as nitrate leaching and greenhouse gas emissions [10,13,14]. In the long term, it is therefore necessary to transform the present sowing structure and reduce dependence on fossil fuels [15] and the overwhelming dominance of cereals [16,17,18].
The growing interest in new cultivation methods in developed countries is explained by the increasing awareness of the environmental hazards of excessive pesticide use [19,20,21]. Intercropping is an ancient practice in warmer climates around the world [22,23], first defined by Willey [24] as the simultaneous cultivation of two or more crops in the same place. Numerous species are suitable for intercropping, each suiting different purposes and growing conditions [2]. Currently, this practice is used in low-input farming systems or marginal areas in temperate regions [25,26], but it was common in developed countries before the intensification of agriculture [2]. The introduction of N fertilizers shows an alternative to leguminous pasture or cover crops, thus eliminating the fertility-generating stage of the crop rotation sequence [1,27]. As a result, there has been a steady decline in legume production in Europe [6,28], which now represents less than 4% of the arable land [5]. Intercropping cereals and peas can result in better land use efficiency [29] and shows a lower yield variability, with higher or equal yields than in sole crop [30]. Although, the most important advantage is the better utilization of available growth resources (light, water, and nutrients) [21] and increasing soil N efficiency [27]. The incidence of damage caused by pests and pathogens as well as weed growth is often observed to be lower [2,31]. Intercropping provides better lodging resistance for susceptible plants [23], potentially making systems more resilient to biotic and abiotic stresses [16,32,33]. However, it is important to mention the drawbacks of intercropping, which depend on the mixed species. These include competition for light, water, and nutrients; allelopathic effects [23]; different requirements for herbicides and pesticides [34]; and the cost of grain separation, as well as problems at harvest [33].
Yield advantage occurs when companion plants do not compete for the same ecological niche, and the interspecific competition for a given resource is less than intraspecific competition [23,34]. Yield advantage is often attributed to the complementary use of available resources [22]. Cereals are able to take up mineral nitrogen from deeper soil layers due to their faster and deeper root growth at the beginning of the crop cycle, while peas are primarily forced to partake in symbiotic N2 fixation due to their shallow root architecture and low competitive ability [13,30,35]. This spatial segregation is a conscious response of plants to avoid competition between companion plants [36]. Deeper roots allow wheat to be less prone to water stress during the growing season. Since companion plants use different soil layers, there is little risk of nitrate leaching in plant association [2]. However, the complementarity can only be maintained to a certain extent, because the interest of wheat is to keep the competitive ability of peas high due to increased nitrogen fixation [37]. Population density can determine the degree of competition or facilitation in intercropping systems [38]; by increasing the seeding rate, the dominant companion plant becomes even more powerful and changes the competitive dynamics between species [31]. Most arable crops are bred as monocrops, which is not necessarily favorable for intercropping [39]. Pankou et al. [40] emphasize that many varieties can yield differently in intercropping due to local selection pressures generated by interspecific neighbor interactions. Species interactions are complex and vary with the level of nutrients available, the time, and the associated species and varieties involved [25,41].
Competition is one of the main factors that significantly affect both growth and yield in plant association [15]. Several indices such as the land equivalent ratio (LER), competitive ratio (CR), aggressivity (A), actual yield loss (AYL), monetary advantage (MAI), and intercropping advantage (IA) have been used to assess competition and economic advantage in intercropping [15,19,21,36,40,42,43,44,45,46,47,48]. Most of this research has dealt with the selection of compatible varieties and sowing densities for intercropping, ignoring competitive ability and complementarity or relying on pure stand experiments.
The aim of this work was to determine whether mixtures of winter wheat and winter peas interact in a competitive or facilitative way, and to assess whether using lower-than-recommended seeding rates of both species together could result in a balanced composition.

2. Materials and Methods

2.1. Crop Management and Experimental Design

Our small-plot field experiment was conducted for 3 consecutive growing seasons (2020/2021, 2021/2022, 2022/2023) at the Applied Agronomy Research Station of the Hungarian University of Agriculture and Life Sciences in Szeged-Öthalom. The treatments were arranged in a randomized block design with 4 replications. Each plot size was 10 square meters. The soil type was a meadow chernozem soil with a humus content of 2.8–3.2%, and a slightly alkaline reaction (pH = 7.9). The soil contained nitrogen (24 mg/kg), phosphorus (248 mg/kg), and potassium (209 mg/kg). The previous crop each year was winter wheat. All the seeds were dressed, but the winter peas were not inoculated. There was no possibility of irrigation at the experimental site, and no organic fertilizer had been applied in the last 5 years. Before sowing, a multi-nutrient autumn fertilizer was applied at a rate of 200 kg ha−1 (complex NPK 15:15:15). Seedbed preparation included ploughing, disk harrowing, and cultivation. In our experiment, we used a seed mixture of 3 varieties of winter wheat (GK Szilárd, Cellule, GK Csillag) and one variety of winter pea (Aviron), which were sown in one pass at the same time and the same place. The plant density was chosen according to the local standard cropping practice in pure stands, where 5 million germ ha−1 was considered 100% in the case of winter wheat, and 1 million germ ha−1 in the case of winter peas. The 50% and 75% sowing densities were determined in the same way. The sowing densities are summarized in Table 1.
In the 3 growing seasons, the sowing dates were as follows: 21 October 2020, 19 October 2021, and 12 October 2022. Sowing was carried out with a Wintersteiger Plotseeder Plotman machine (Wintersteiger GmbH, Ried, Austria). A herbicide was used twice on the experimental plots: pre-sowing weed control was performed with Sharpen 330EC (Sharda Cropchem Ltd., Mumbai, India; active ingredient: pendimethalin) at a dose of 4.5 L ha−1; then, post emergence, we used a combination of Tropotox (Nufarm UK Ltd., Bradford, UK; active ingredient: MCPB Na) with a dose of 2 L ha−1 and Benta 480 SL (Sharda Cropchem Ltd., Mumbai, India; active ingredient: bentazone) with a dose of 2 L ha−1. In this case, the pea crops were no taller than 8–10 cm (BBCH 12). A fungicide was applied once in the growing season with Legado (Albaugh TKI d. o. o., Rache, Slovenia; active ingredient: azoxystrobin), with a dose of 1 L ha−1, in the wheat development stage of BBCH 34. Insecticide treatments were carried out with Mospilan 20 SG (Nisso Chemical Europe GmbH., Düsseldorf, Germany; active ingredient: acetamiprid) with a dose of 0.2 kg ha−1 and Karate Zeon 5 CS (Syngenta Crop Protection AG, Basel, Switzerland; active ingredient: lambda-cihalotrin) with a dose of 0.2 L ha−1. In the first case, the pea development stage is BBCH 64; in the second case, the wheat development stage is BBCH 60 and the pea development stage is BBCH 74.
GK Szilárd is an awnless winter wheat variety of medium maturity, characterized by high yield, good adaptability to environmental conditions, and high stem strength. Cellule was also a medium-mature, strong tillering variety with high yield stability and nutrient utilization capacity. GK Csillag was an early-maturing winter wheat variety that matured simultaneously and was easy to thresh. Aviron was a semi-leafless winter pea variety with excellent cold and disease resistance. It is suitable for feed and human consumption.
The single-stage harvest was adapted to the full maturity stage of winter wheat (BBCH 89) on 1 July 2021, 22 June 2022, and 30 June 2023. By this time, the winter peas had already reached the physiological maturity stage about two weeks prior. The moisture content was measured using a Wile 65 moisture meter before harvest. Due to the adequate moisture content, no correction was necessary for the yield calculation. Harvesting was carried out using a Wintersteiger Nurserymaster plot combine (Wintersteiger GmbH, Ried, Austria). Then, wheat and pea seeds were separated by a Pfeuffer sample cleaner and a hand sieve, or, if it was necessary, sorted by hand.

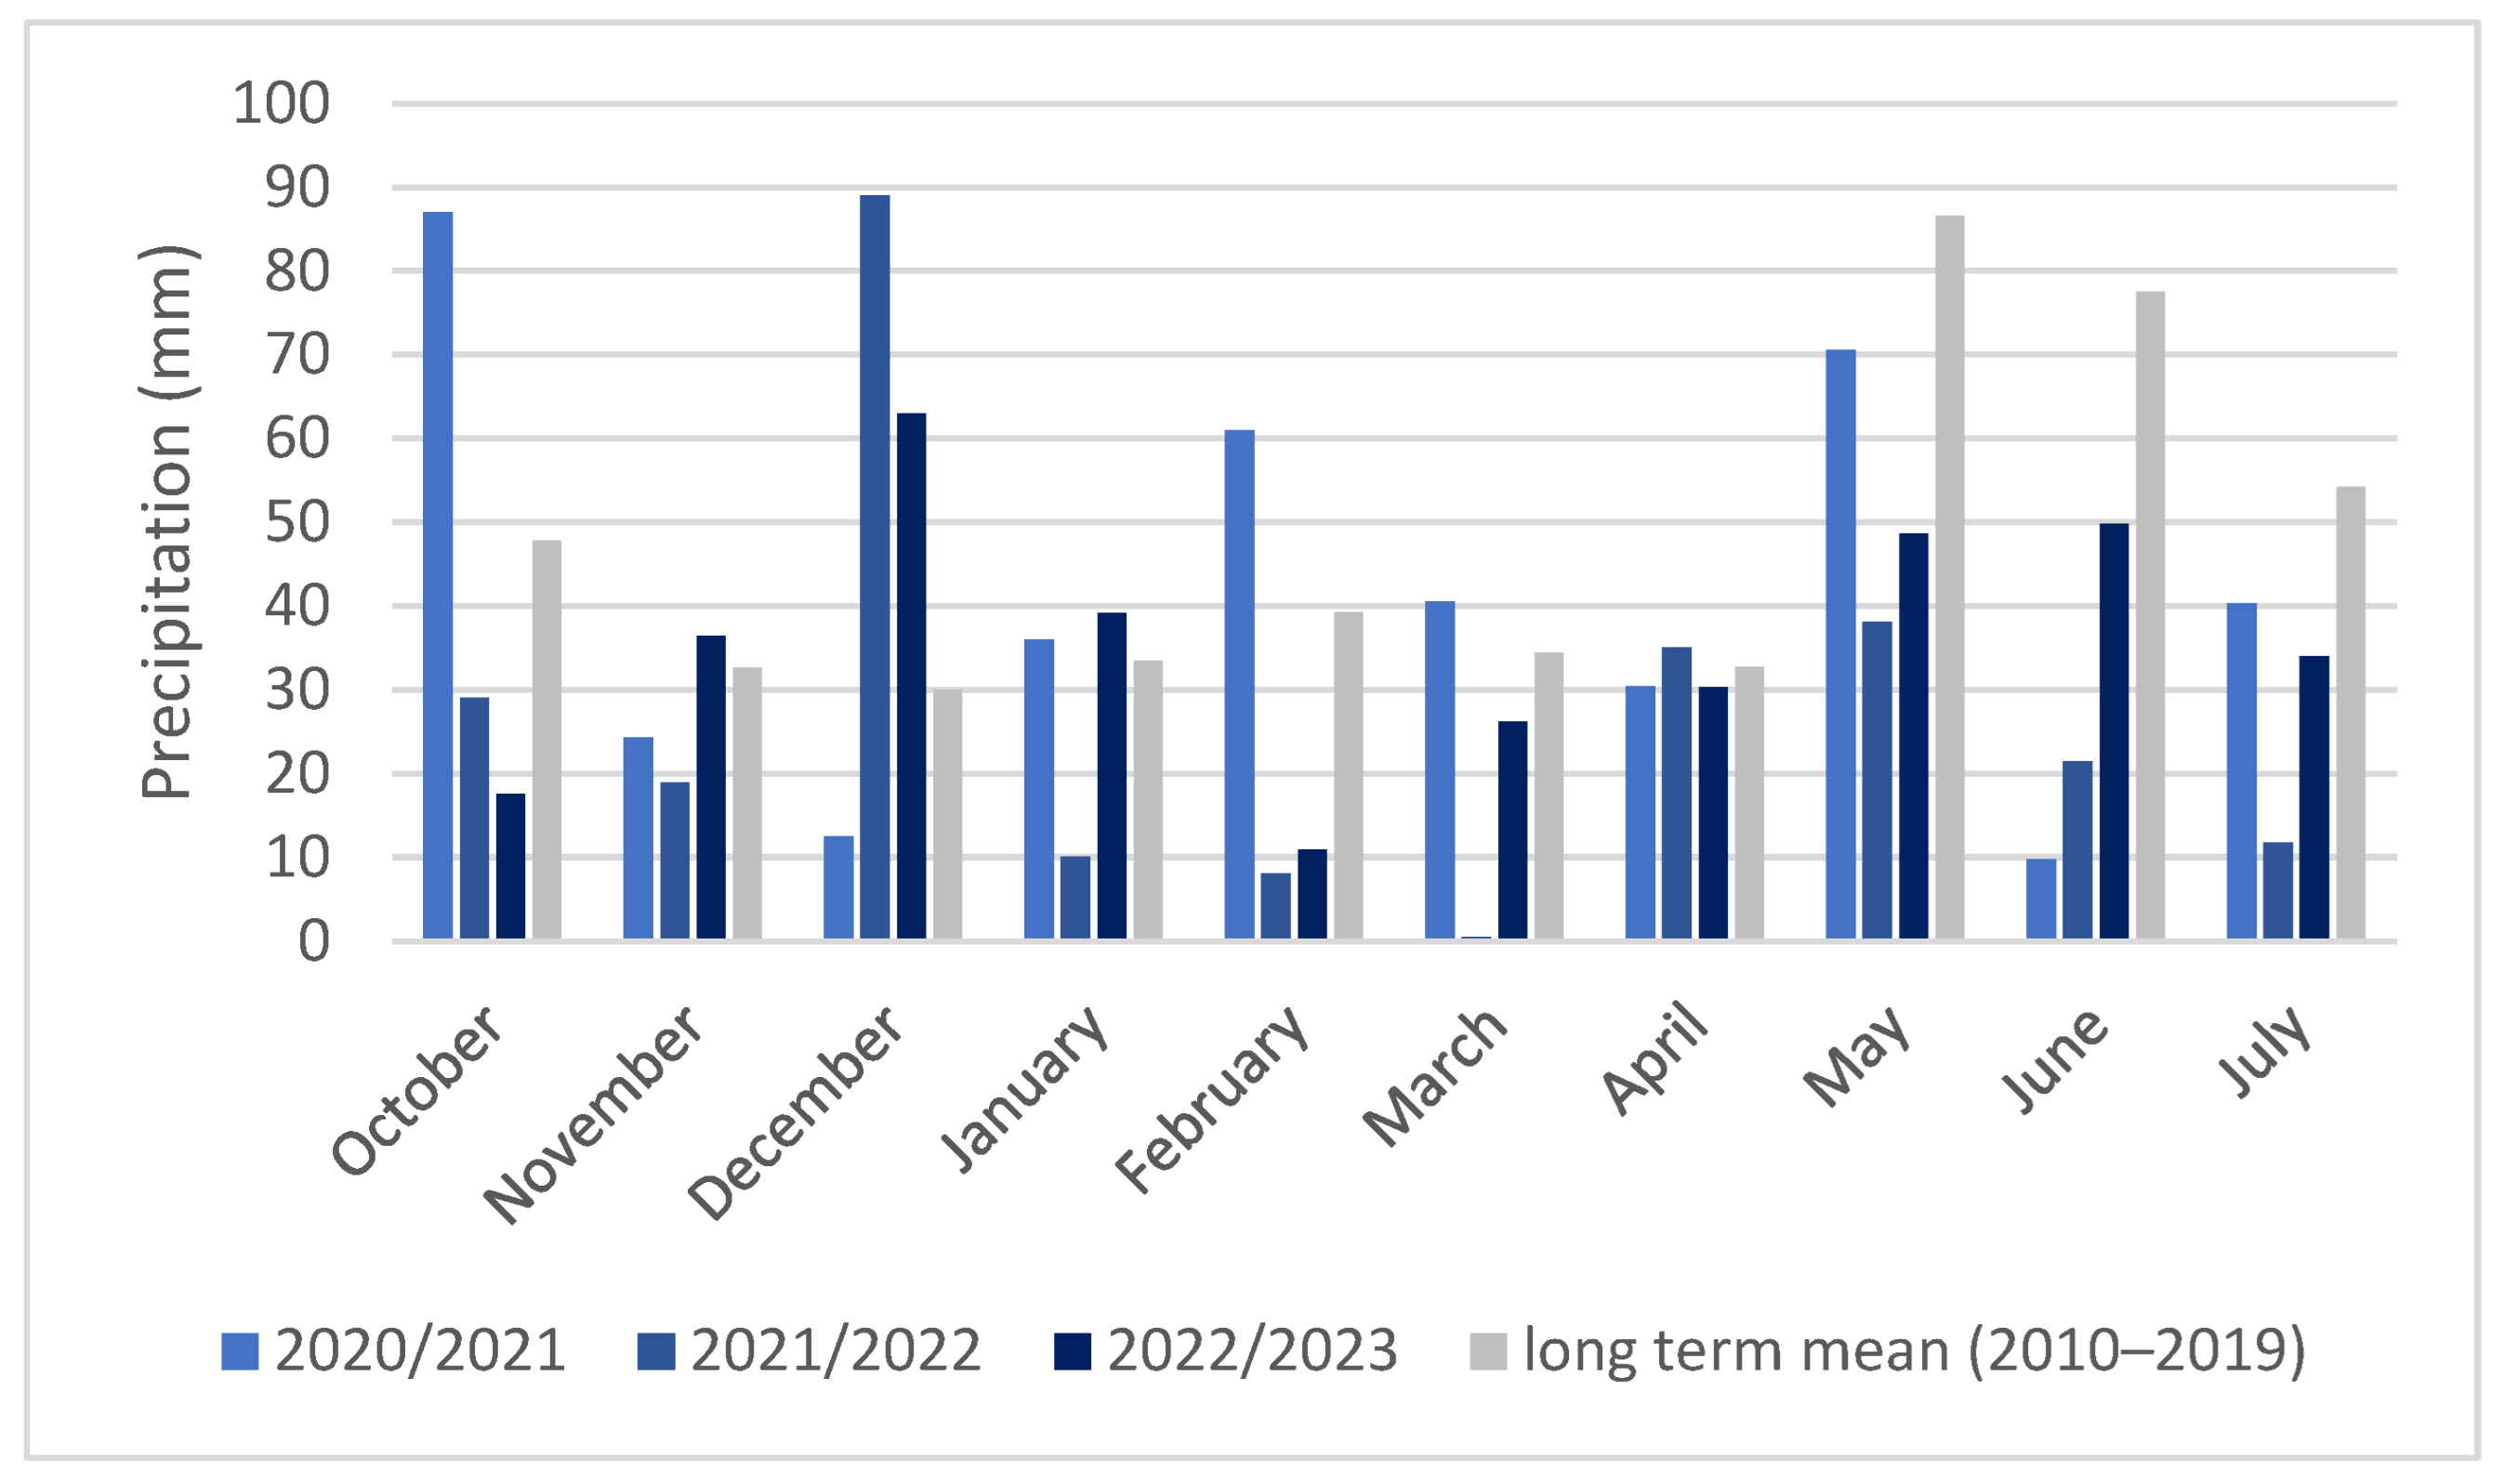
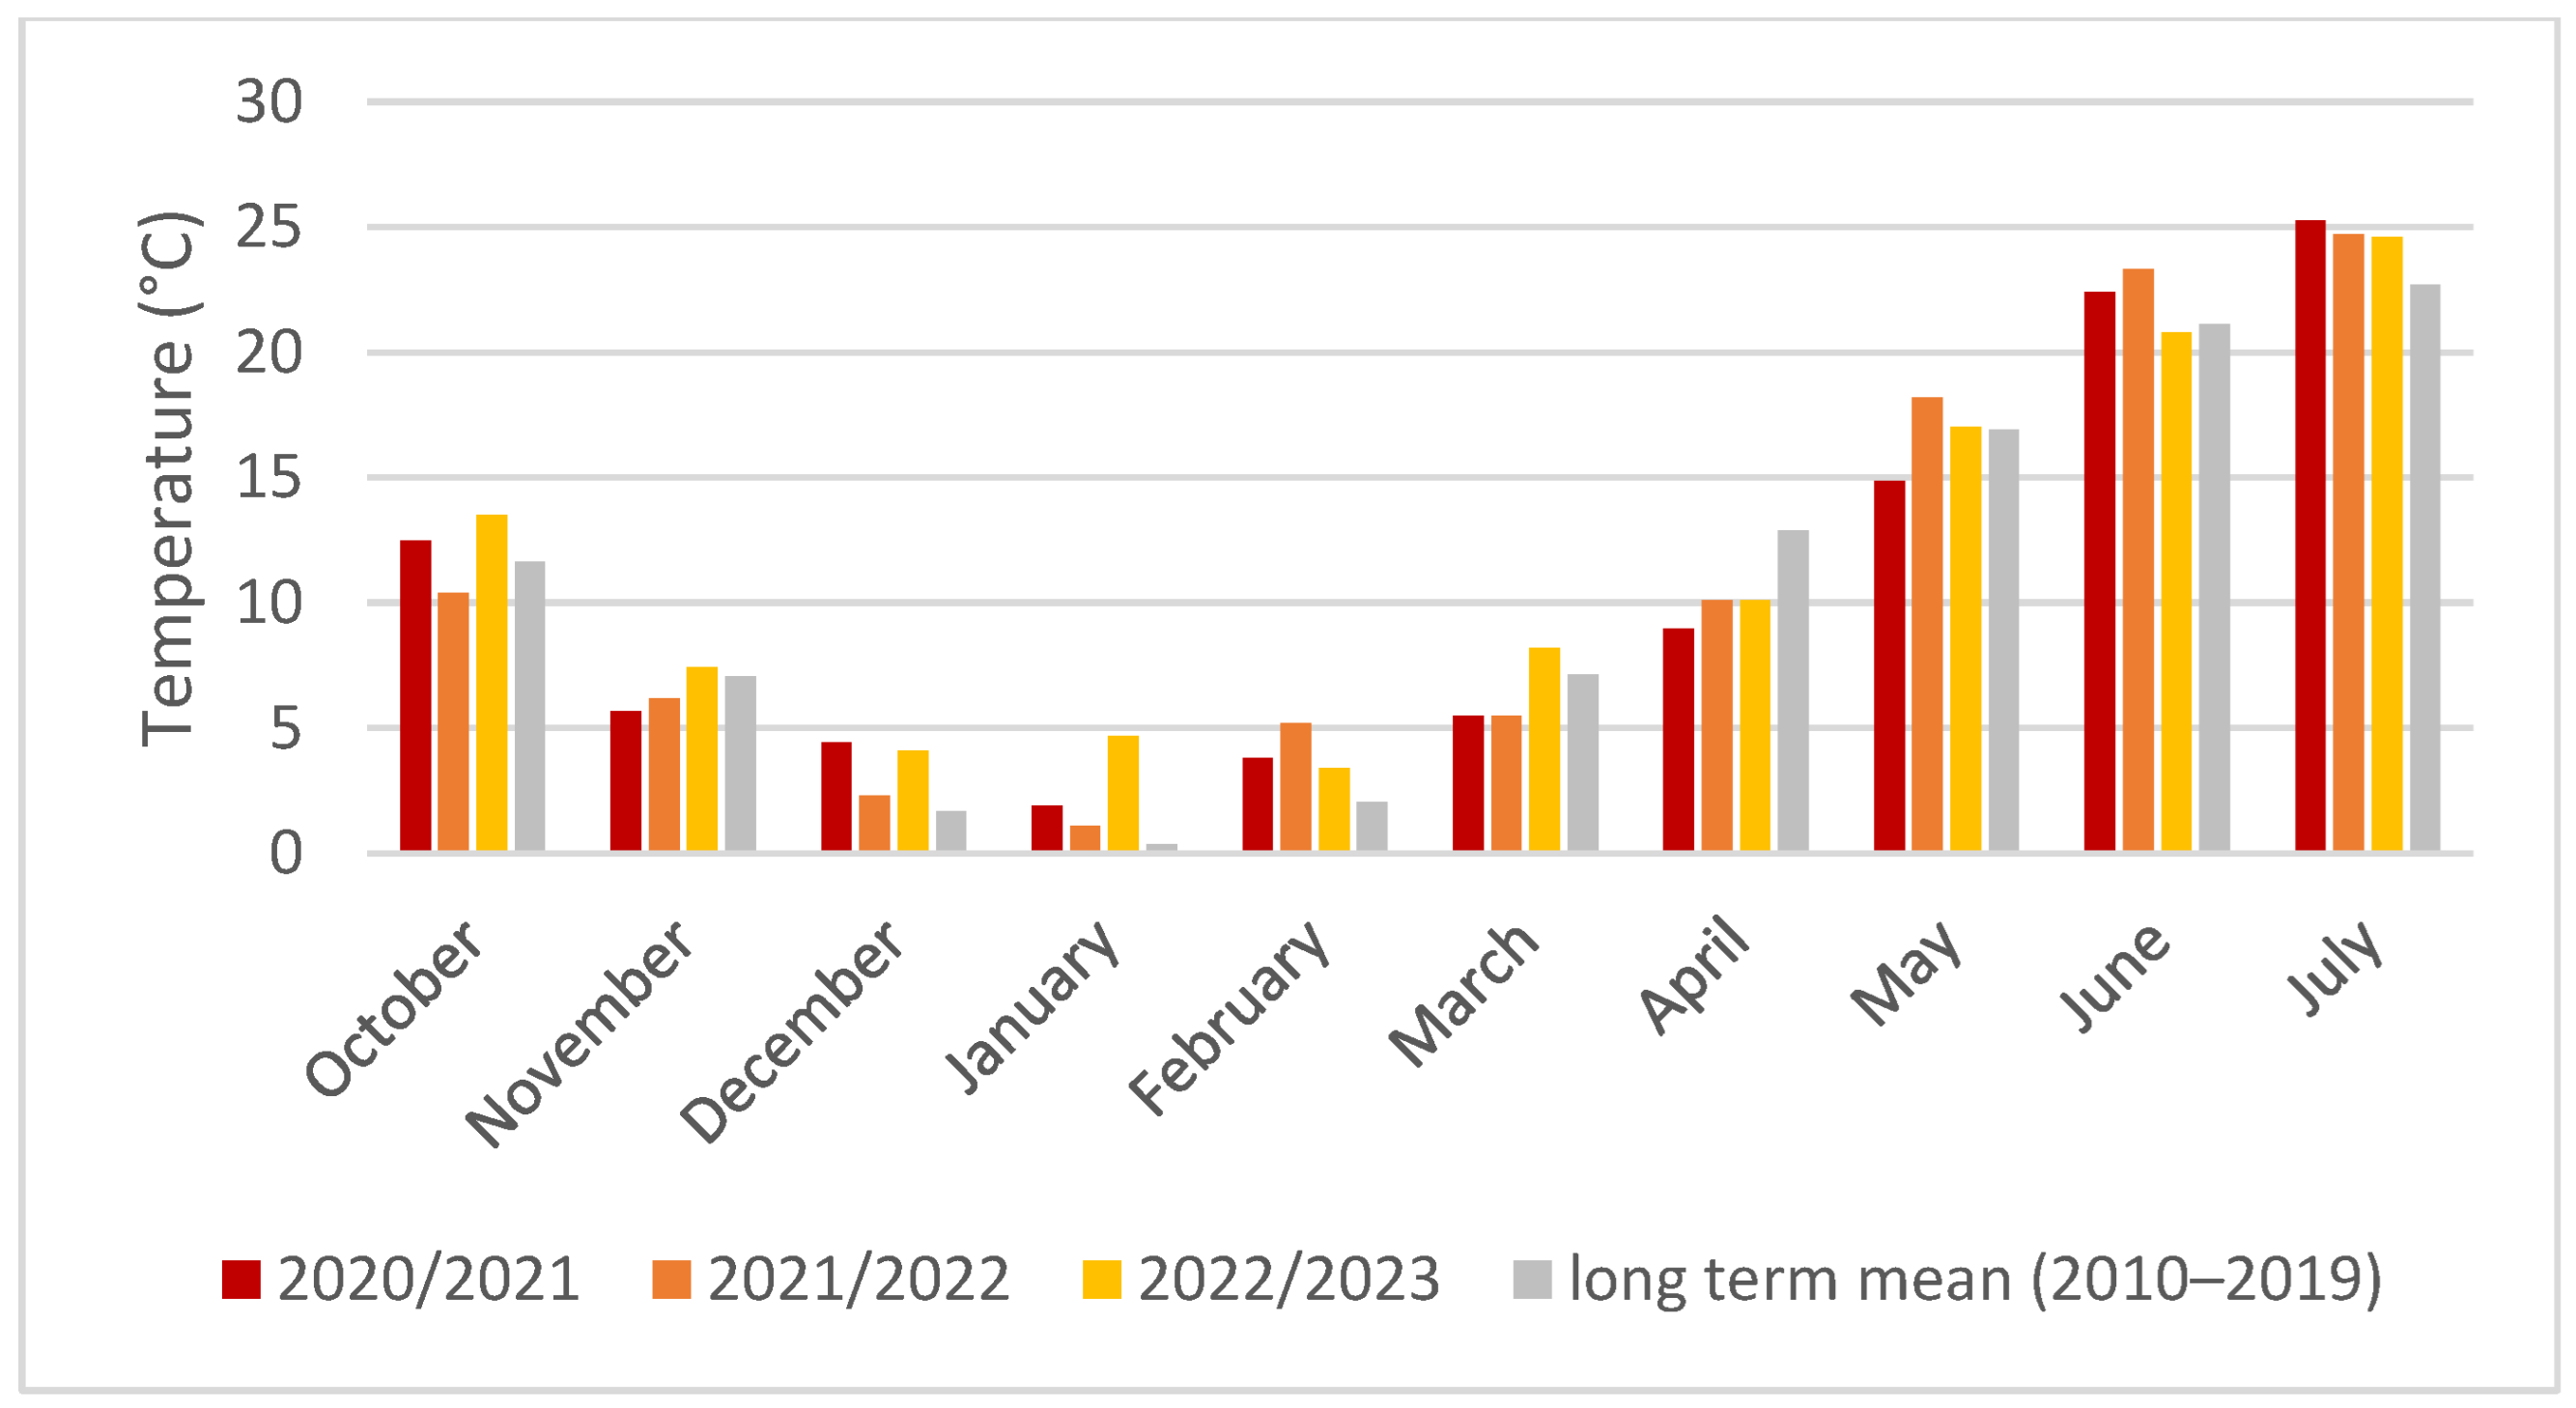
2.2. Weather Conditions

Figure 1 shows the changes in precipitation for the three years. In the year of 2020, the growing season started with twice as much precipitation as the average for October, and this was followed by a dry November and December. The lack of winter snow cover was no longer compensated by the greater amount of precipitation in February. This was then replaced by drier periods starting with a slightly wetter March. In contrast, the autumn of 2021 was much drier than the average, which increased until March. Then, after an average April, the lack of precipitation was felt especially during flowering and seed formation in May and June. This year was undoubtedly the driest of all experimental years. In 2022, the relatively dry October was followed by a much wetter winter, which helped the initial growth of our associated plants. Unfortunately, after that, the entire growing season was then characterized by a drier-than-average period.
Figure 2 shows the average monthly temperature in the years studied. The first and third years were warmer than the average at the time of sowing. Warming climates are particularly noticeable in winter: in all three years, winter was milder than the long-term average. In May 2022, as well as in June 2021 and 2022, it was warmer than what is typical for this time of year in Hungary.

2.3. Competition Indices and Monetary Advantages

The benefits of intercropping and the effect of the competition between the companion plants were calculated using various competition indices. The land equivalent ratio (LER) indicates the efficiency of intercropping in using environmental resources compared to pure stands. The critical value is considered to be 1. When the LER is greater than 1, intercropping favors the growth and yield of the companion plants, whereas when the LER is less than one, intercropping has a negative effect on the growth and yield of the species. The LER was calculated as per Willey and Rao [47] (Equation (1)):
L E R = ( L E R w + L E R p ) ,
L E R w = ( Y w i / Y w ) ,
L E R p = ( Y p i / p ) ,
where Yw and Yp are the yields of winter wheat and peas, as pure stands, respectively. Ywi and Ypi are the yields of winter wheat and peas as intercrops.
The data on the wheat yield in 2021 were been published with the aim of a comparison of different seeding rates and wheat varieties [48].
Aggressivity (A) is often used to indicate how much the relative yield increase of one companion plant is greater than that of the other in plant association [42,49]. If A is 0, both plants are equally competitive; if Aw is positive, then the wheat species is dominant; and if Aw is negative, then the wheat is the dominated species.
Aggressivity is derived from Equations (4) and (5):
A w = Y w i Y w · Z w i ( Y p i Y p · Z p i ) ,
A p = ( Y p i Y p · Z p i ) ( Y w i Y w · Z w i ) .
where Zpi is the seeding rate of winter peas sown in the mixture, and Zwi is the seeding rate of winter wheat in the mixture.
The competitive ratio (CR) is another way of assessing competition between different species [47]. The CR provides a better measure of the competitive ability of companion plants and is also an advantageous index over aggressivity. The CR simply represents the ratio of the individual LERs of the companion plants, taking into account their seeding rate.
The CR is calculated using the following formula (Equation (6)):
C R = C R w + C R p ,
C R w = L E R w L E R p Z p i Z w i ,
C R p = L E R p L E R w Z w i Z p i ,
If CRw < 1, there is a positive benefit and the crop can be grown in plant association; if CRw ˃ 1, there is negative benefit. The reverse is true for CRp.
In addition, Banik et al. [45] mentioned that the actual yield loss (AYL) index gives more accurate information about competition between and within component plants and the behavior of each species in intercropping than the other indices, as it is based on the yield per plant. The AYL is the proportional yield loss or gain of intercrops compared to the corresponding monocrop. The AYL can have positive or negative values, indicating the accumulated advantage or disadvantage of intercropping when the main objective is to compare the yield per plant.
The AYL was calculated as per Equation (9):
A Y L = A Y L w + A Y L p ,
A Y L w = [ ( Y w i / Z w i ) / ( Y w / Z w ) ] 1 ,
A Y L p = [ ( Y p i / Z p i ) / ( Y p / Z p ) ] 1 ,
The monetary advantage index (MAI) and the intercropping advantage (IA) provide information on the economic advantage of intercropping. The MAI was calculated based on the LER as per Ghosh et al. [49] (Equation (12)):
M A I = ( v a l u e   o f   c o m b i n e d   i n t e r c r o p s ) · [ ( L E R 1 ) / L E R ] ,
The value of combined intercrops was calculated as
Y p i · P p + Y w i · P w ,
where Pp is the commercial value of winter peas on the day of harvest in a given year (the price was set at EUR 269.9 t−1 in 2021, EUR 294.37 t−1 in 2022, and EUR 592.78 t−1 in 2023) and Pw is the commercial value of winter wheat (the price was set at EUR 213.82 t−1 in 2021, EUR 332.99 t−1 in 2022, and EUR 172.98 t−1 in 2023). The prices were determined by the database of the Central Statistical Office and the advertisement of Agroinform site [50,51,52,53].
The index of intercropping advantage (IA) was calculated according to Banik et al. [45] as follows (Equation (14)):
I A = I A w + I A p ,
I A w = A Y L w · P w ,
I A p = A Y L p · P p ,
The higher the index value, the more profitable the whole cropping system.

2.4. Statistical Analysis

The data for the LER, A, CR, AYL, MAI, and IA were analyzed statistically using the method of multivariate analysis of variance (MANOVA) in a 3-way random block design with the factors ‘variety’ (of winter wheat), Zpi (the seeding rate of winter peas in the mixture), and Zwi (the seeding rate of winter wheat in the mixture) and the three growing seasons as blocks. In each growing season, the experiment was based on a randomized block design, with 4 replications and 27 intercropped plots. The overall MANOVA was evaluated based on the unexplained variance rate expressed by Wilk’s lambda. Following a significant MANOVA result, subsequent three-way random block design univariate ANOVA tests were performed with Bonferroni’s correction to avoid Type I error probability inflation. To ensure the normality requirements of the linear model, LER, CR and AYL were subjected to an ln transformation. The normality of the model residuals was accepted based on the absolute values of their skewness and kurtosis as they were all below 1 and 2, respectively. The homogeneity of variances was tested using Levene’s test (p > 0.05). Finally, for the significant factors, post hoc tests were carried out using Tukey’s HSD method: the homogeneous groups of varieties were separated for all Zpi∗Zwi combinations, while Zwi and Zpi levels were compared for all variety∗Zpi and variety∗Zwi combinations. The results are presented separately for the three years. All statistical analyses were performed using the statistical software IBM SPSS v.29 (IBM SPSS, Armonk, NY, USA, 2022) [54].

3. Results

The overall MANOVA was significant for all the three factors (Wilk’s lambda values are 0.76, 0.28, and 0.77 for variety, Zwi, and Zpi all with p < 0.001). Obviously, the year effect was also significant (Wilk’s lambda = 0.02, p < 0.001). However, none of the two-way or three-way factorial interactions were significant (variety∗Zwi, variety∗Zpi, Zwi∗Zpi and variety∗Zwi∗Zpi were all with p > 0.05).
The subsequent three-way random block design univariate ANOVA tests revealed significance in the following:
  • Year effect on all the competition indices;
  • Zwieffect on all the competition indices except CR;
  • Variety and Zpi effect on A and CR (Table 2).

3.1. Competition Indices

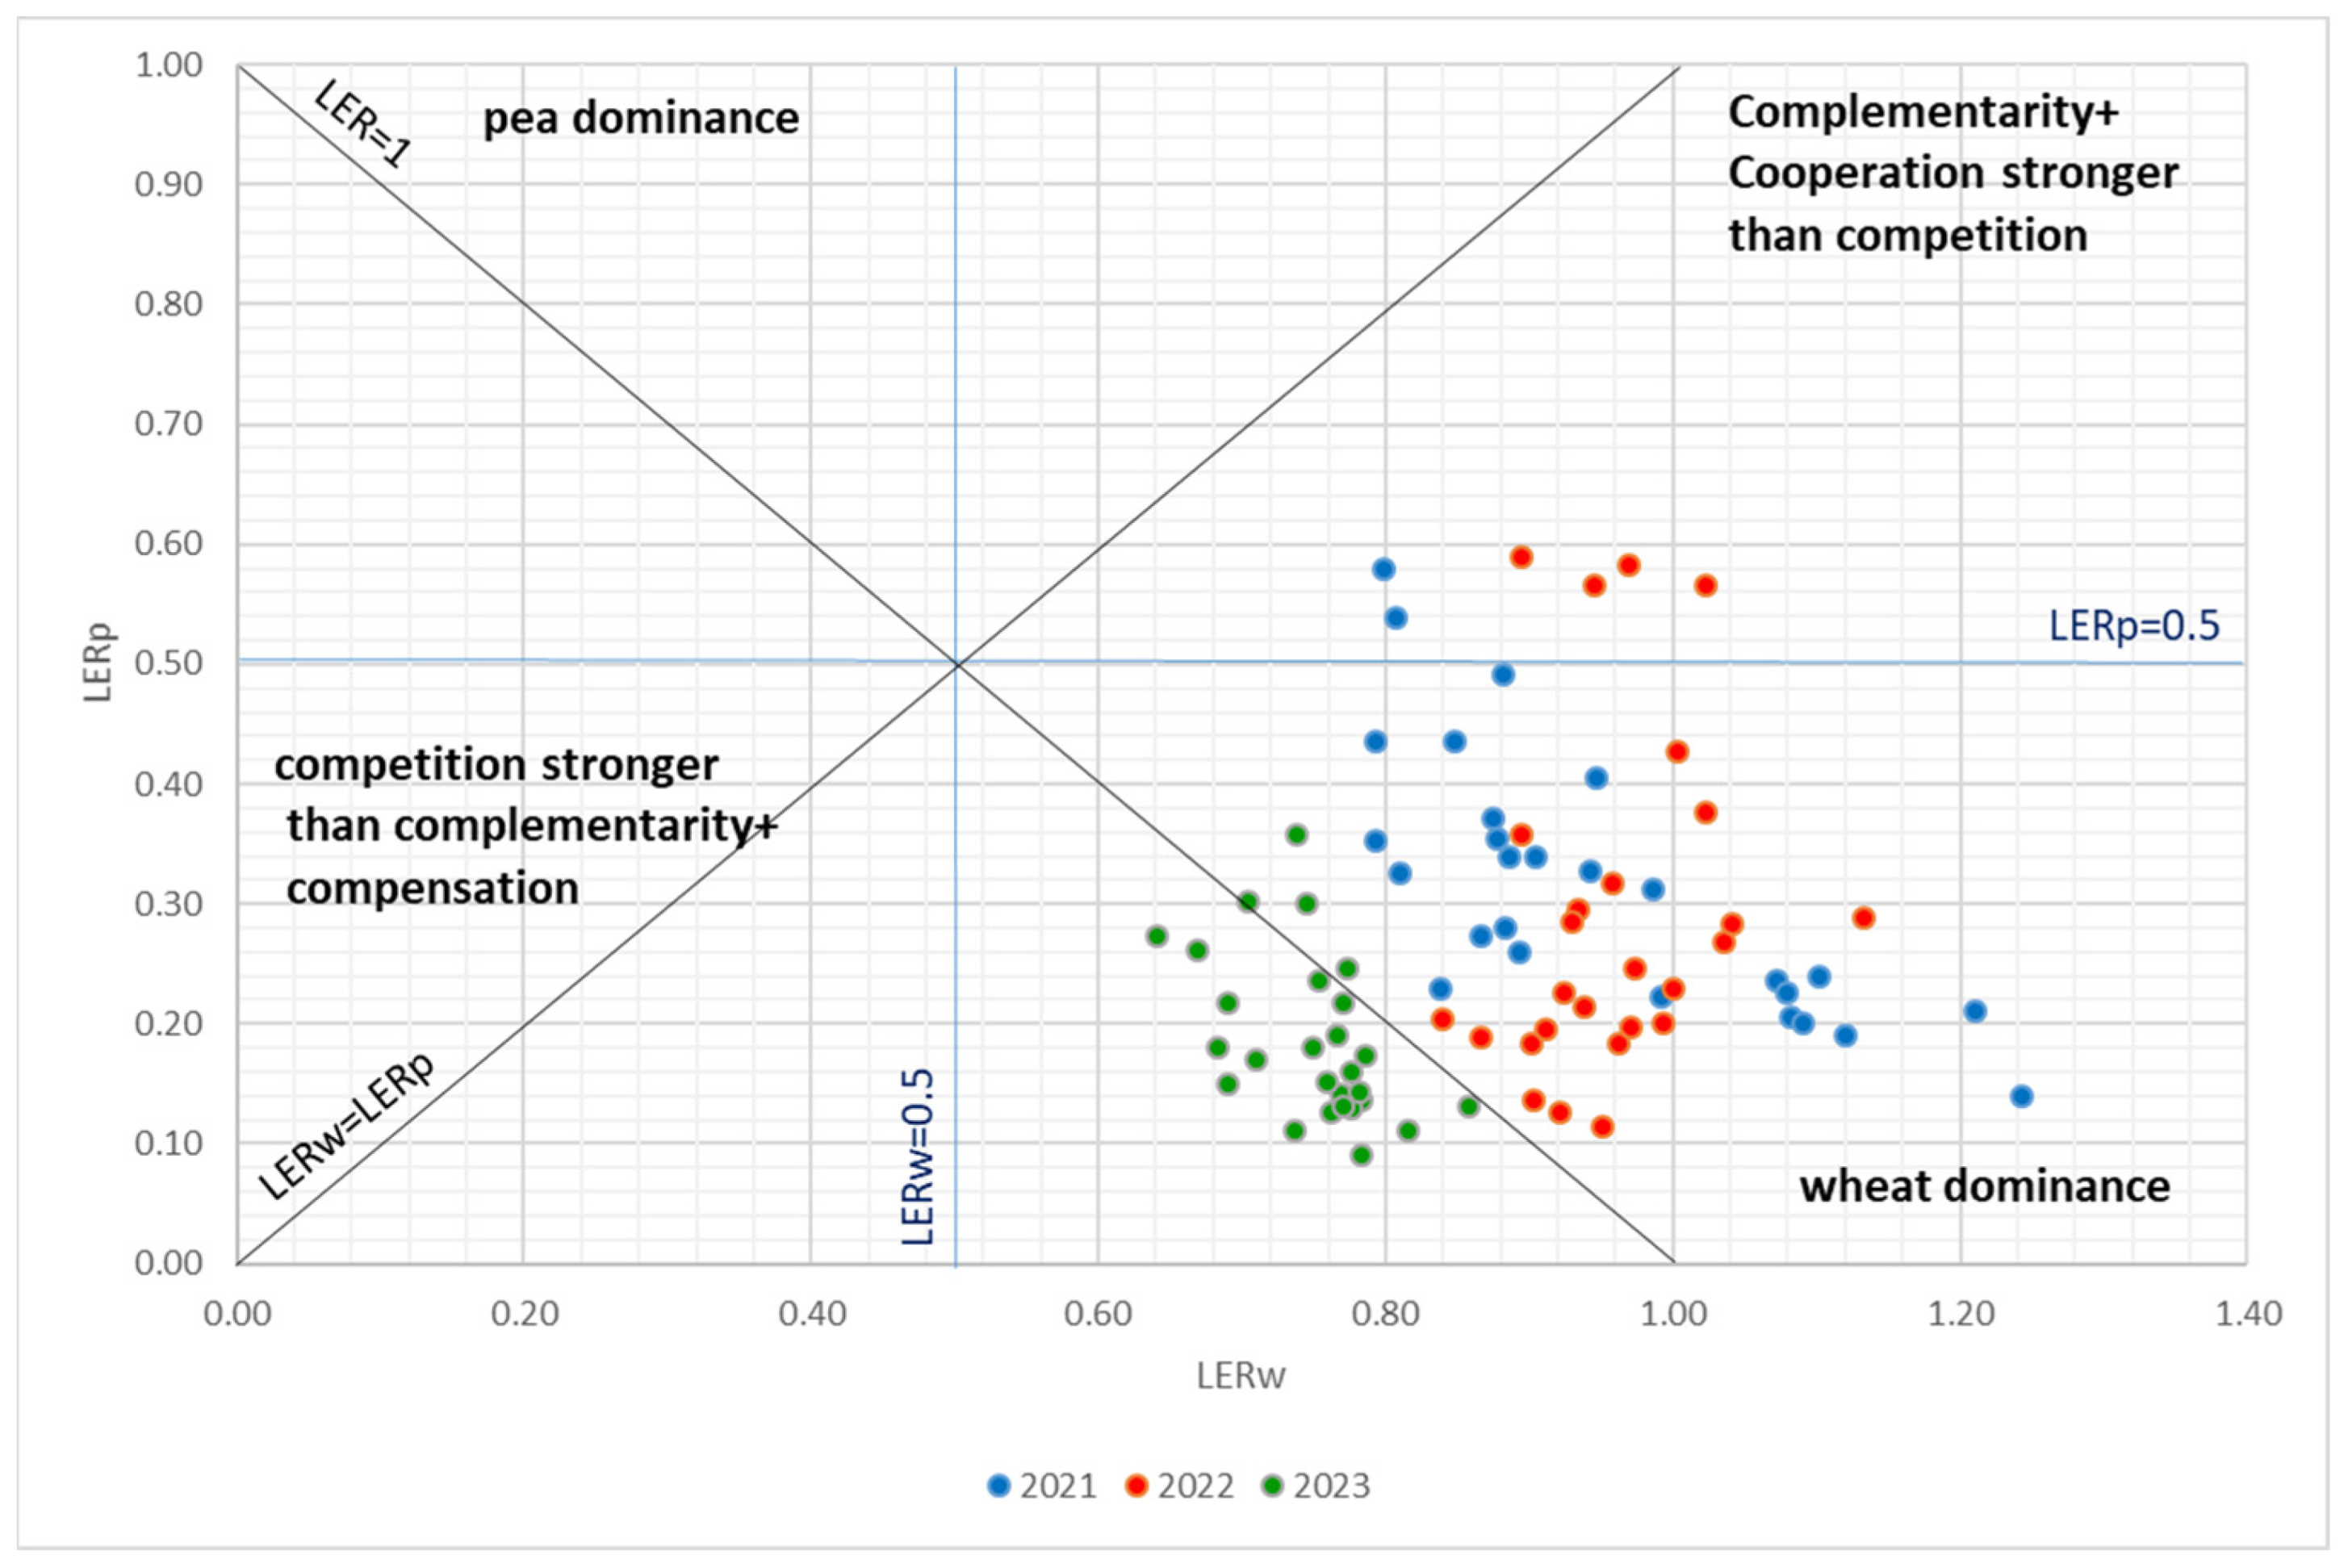
3.1.1. Land Equivalent Ratio (LER)

The most used and accepted formula for measuring complementarity is the land equivalent ratio (LER). This calculation is used to represent the efficiency of resource use and indicates the relative land area that is required for pure stands to produce the same yield as mixtures. In the first growing season (2020–2021), all mixtures had an LER greater than one, ranging from 1.07 to 1.42. This means that for a value of 1.42, 42% more land is required in monoculture than in a mixture to achieve the same yield. The highest total LER (1.42) was observed for the mixture GK Csillag/Aviron 100:75. The partial LERs of peas were, in all cases, below 1.00, indicating a disadvantage of this companion plant in mixtures compared to pure stands. In contrast, the combination of GK Csillag with Aviron showed higher partial LERw values than 1.00 in eight out of nine mixtures except for the seeding rate of 50:100. In the other mixtures, the wheat yielded less per unit area in intercropping than in pure stands. The averages of the LER values and the results of the statistical analysis can be seen in Table 3. In 2021, the LER values were affected by the seeding rate of wheat (Zwi). There was a significant difference at p < 0.001 for Cellule/Aviron mixtures between 75:50 and 100:50.
The results of the second growing season (2021–2022) were similar in that the total LER values always exceeded 1.00, but for completely different mixtures than in the previous year. The maximum total LER (1.59) was recorded for the 75:50 seeding rate of the mixture of Cellule and Aviron. The LER values were between 1.04 and 1.59. Partial LERs of peas were below 1.00 in all crop combinations, the highest being only 0.59 at the 50:100 seeding rate of Cellule with Aviron. Partial LERs of wheat were higher than 1.00 in the next five cases: mixture GK Szilárd/Aviron 50:50, 50:100, 100:50, and Cellule/Aviron 75:50, 100:50 combinations. The 50:50 mixture of GK Csillag showed only 1.00 partial LER compared to the first growing season. The same value was shown by the combination of Cellule/Aviron at a seeding rate of 75:75. In 2022, the LER values were affected by the wheat variety: the 50:75 and 75:75 combinations had significant differences between the GK Csillag and Cellule varieties, in favor of Cellule (Table 4).
The total LER values in the next growing season (2022–2023) were not consistent with the previous years. The yield advantage was only found for the mixture GK Szilárd/Aviron 50:50, as well as the Cellule/Aviron at 50:75 and the GK Csillag/Aviron combinations at 50:50 and 50:75 seeding rates. In the other cases, the total LER was below 1.00, which means that, during this year, it was more favorable to grow these species in monoculture per unit area. All partial LER values were below 1.00 for both companion plants. The maximum partial LER for peas was 0.36 at the 50:50 seeding rate of GK Csillag with Aviron. The highest partial LER for wheat was 0.86 at the 100:50 seeding rate of the mixture Cellule/Aviron. In the third year, we could not prove statistical difference at all (Table 5).
The graphical representation of the LER values, adapted from Williams and McCarthy [55], can represent all possible outcomes of the interaction of the companion plants in one coordinate system. Since they used a replacement design (each species sown at half of the local standard seeding rate), the partial LER reference line (LERp and LERw) was slightly modified by Bedoussac and Justes [41], then later refined by Justes et al. [17], where it took a value of 0.5 instead of 1. If we apply this representation and plot the LERw values in space as a function of the LERp values, the LER values (except for six) are in a square. In all the experimental years, these values are below the diagonal reference line, which means that wheat suppresses peas by modifying the environment. In this case, the dominance of wheat strengthens the competitiveness of peas and increases the amount of fixed atmospheric N2. The total LER > 1 shows more production per unit area in an intercrop, but they are poorly balanced mixtures due to there being too much competition between the companion plants. The six outliers are in the upper right quadrant; in this case, species complementarity and cooperation effects are stronger than competition. These values occurred in 2021 at the 50:100 and 75:50 seeding rates of the mixture of Cellule/Aviron. Then, in 2022, not only these mixtures, but also Cellule/Aviron 50:75 and 50:50 were included in this category. In 2023, the LER value of almost all plant associations was less than one, which shows that most of the mixtures were detrimental to the companion plants in that year. A graphical representation can be seen in Figure 3.

3.1.2. Aggressivity (A)

Aggressivity shows how much greater the relative yield increase is for one companion plant than for the other. Positive figures were obtained every year for wheat, while the opposite was true for peas. There was only one exception in the case of the 75:50 proportion intercropping of Cellule/Aviron in 2021 (Aw = −0.09, Ap = 0.09). The positive values clearly indicate the dominance of wheat; this one case suggests that aggressivity can easily be reversed under changing environmental conditions. The values of Aw ranged from −0.09 to 1.89 in the first growing season, and the interval of the occurring values narrowed (from 0.23 to 1.8 in 2022, and from 0.52 to 1.25 in 2023). In the first growing season variety, pea and wheat seeding density had an effect on aggressivity. There was statistical difference between the Cellule and GK Csillag varieties for the 75:50 mixture, and between GK Szilárd and GK Csillag for the 100:50 combination. In the first case, the only negative value gave the deviation, while in the second case, GK Csillag proved to be more aggressive against GK Szilárd. In terms of the pea seeding rate, the already mentioned inverse value (when pea is more aggressive than wheat) clearly made a statistical difference for the Cellule/Aviron mixture between 75:50, 75:75, and 75:100. The lower the seeding rate of wheat, the more aggressive the varieties proved to be statistically. This is true for Cellule/Aviron in the mixtures between 100:75 and 75:75 and 50:75, 100:100, and 50:100, as well as in the case of GK Csillag/Aviron, between the 100:100 and 50:100 mixtures, where doubling the seeding rate resulted in double aggressivity. For the GK Szilárd variety, there is a statistical difference between the 100:75 and 50:75; 75:100, 100:100, and 50:100; and 100:50 and 50:50 mixtures. However, in the latter case, increasing the seeding rate did not increase the aggressivity. In 2022, GK Szilárd proved to be more aggressive than Cellule for the 50:100 seeding ratio mixture. Except for Cellule, it is true for all associations that increasing the seeding rate leads to lower aggression. In the third year, there was no difference between the varieties. A significant difference was noted for the GK Csillag/Aviron mixture between seeding rates of 50:50, 50:75, and 50:100. Aggressivity increased with the increased proportion of peas. In contrast, the wheat seeding rate had the opposite effect on aggression. In this year, this was proven statistically in all mixtures, except for the smallest pea seeding ratio with the GK Szilárd variety. A detailed statistical analysis is contained in Table A1, Table A2 and Table A3 in Appendix A.

3.1.3. Competitive Ratio (CR)

This index assesses the competitiveness: similarly to aggressivity, the values of the CR for wheat were higher than for peas (except for the Cellule/Aviron 75:50 mixture in 2021), indicating the dominance of wheat under these crop mixtures. In most cases, the CRw values were several times higher than the CRp values. In the first growing season, the variety and the seeding rate of wheat had an effect on the competitive ratio. There was verified a statistical difference between the Cellule, GK Szilárd, and GK Csillag mixtures at 75:50 and 100:50 seeding rates, and also between Cellule and GK Csillag in the case of the 50:75 seeding rate, in favor of GK Csillag. The Cellule/Aviron mixture was more competitive at the 50:50 seeding rate than at 75:50, which means that the lower wheat seeding density resulted in higher CR values. In 2022, there was also a significant difference between Cellule and GK Csillag, but the wheat/pea sowing ratio was reversed. Based on this, there was a statistical deviation between these two varieties in the mixtures of 50:75 and 50:100. In the latter case, this was also true between the Cellule and GK Szilárd varieties. In this year, the pea seeding rate also had an effect on the CR values. The competitiveness was higher in the GK Csillag/Aviron mixture at the 75:100 seeding rate than at 75:50. Finally, in the third year, the seeding density of wheat had an effect on the development of the CR values. A significant difference was only seen between the 50:50 and 75:50 seeding rates of the GK Csillag/Aviron mixture. The more wheat was in the mixture, the more competitive it was. These results can be seen in Table A4, Table A5 and Table A6 in Appendix A.

3.1.4. Actual Yield Loss (AYL)

The AYL index usually evaluates the yield loss or gain of plant association compared to pure stands. In all cases, negative values were found among the total AYL values, indicating that in this mixture ratio, both companion plants suffered significant yield losses. The minimum relative yield loss (−1%) and the maximum relative yield loss (−21%) were found for wheat AYL values at the 100:75 and 75:100 seeding rates of the mixture of GK Szilárd/Aviron in 2021. Positive values in this growing season can only be found in the partial values of GK Csillag. The minimum yield gain (+7%) occurred at the proportion of 50:50 of GK Csillag/Aviron intercropping; the maximum yield gain was at the 50:100 seeding rate of the mixture of GK Csillag/Aviron (+24%). In contrast, the values of the partial actual yield loss of the peas were always negative. This year, we could not prove a statistical difference. In the next year, the maximum yield gain (+13%) was observed only for wheat at the 50:50 seeding rate of the GK Szilárd/Aviron combination. A yield gain of 4% was detected in the AYL of wheat at both the 50:100 and 100:50 seeding rates of the GK Szilárd/Aviron plant combination, and a yield gain of 2% was observed at both the 75:50 and 100:50 seeding rates of the mixture of Cellule/Aviron. There were no differences in wheat yield compared to the monoculture at the 75:75 seeding rate of Cellule/Aviron, nor at the 50:50 seeding rate of the GK Csillag/Aviron mixture. In all other cases, there was yield loss, ranging from −13% for wheat to −89% for peas. We could only prove a significant difference between the 75:75 mixtures of Cellule and GK Csillag and between the 50:100 mixtures of the Cellule, Szilárd, and GK Csillag varieties. In 2023, only negative values could be found for both companion plants: the highest yield loss was 33% for wheat at the 50:100 seeding rate of the GK Csillag/Aviron mixture, and 91% for peas at the 100:75 seeding rate of the GK Szilárd/Aviron combination. We could not prove any statistical difference this year either. The values of the AYL can be seen in Table A7, Table A8 and Table A9 of Appendix A.

3.2. Monetary Advantages

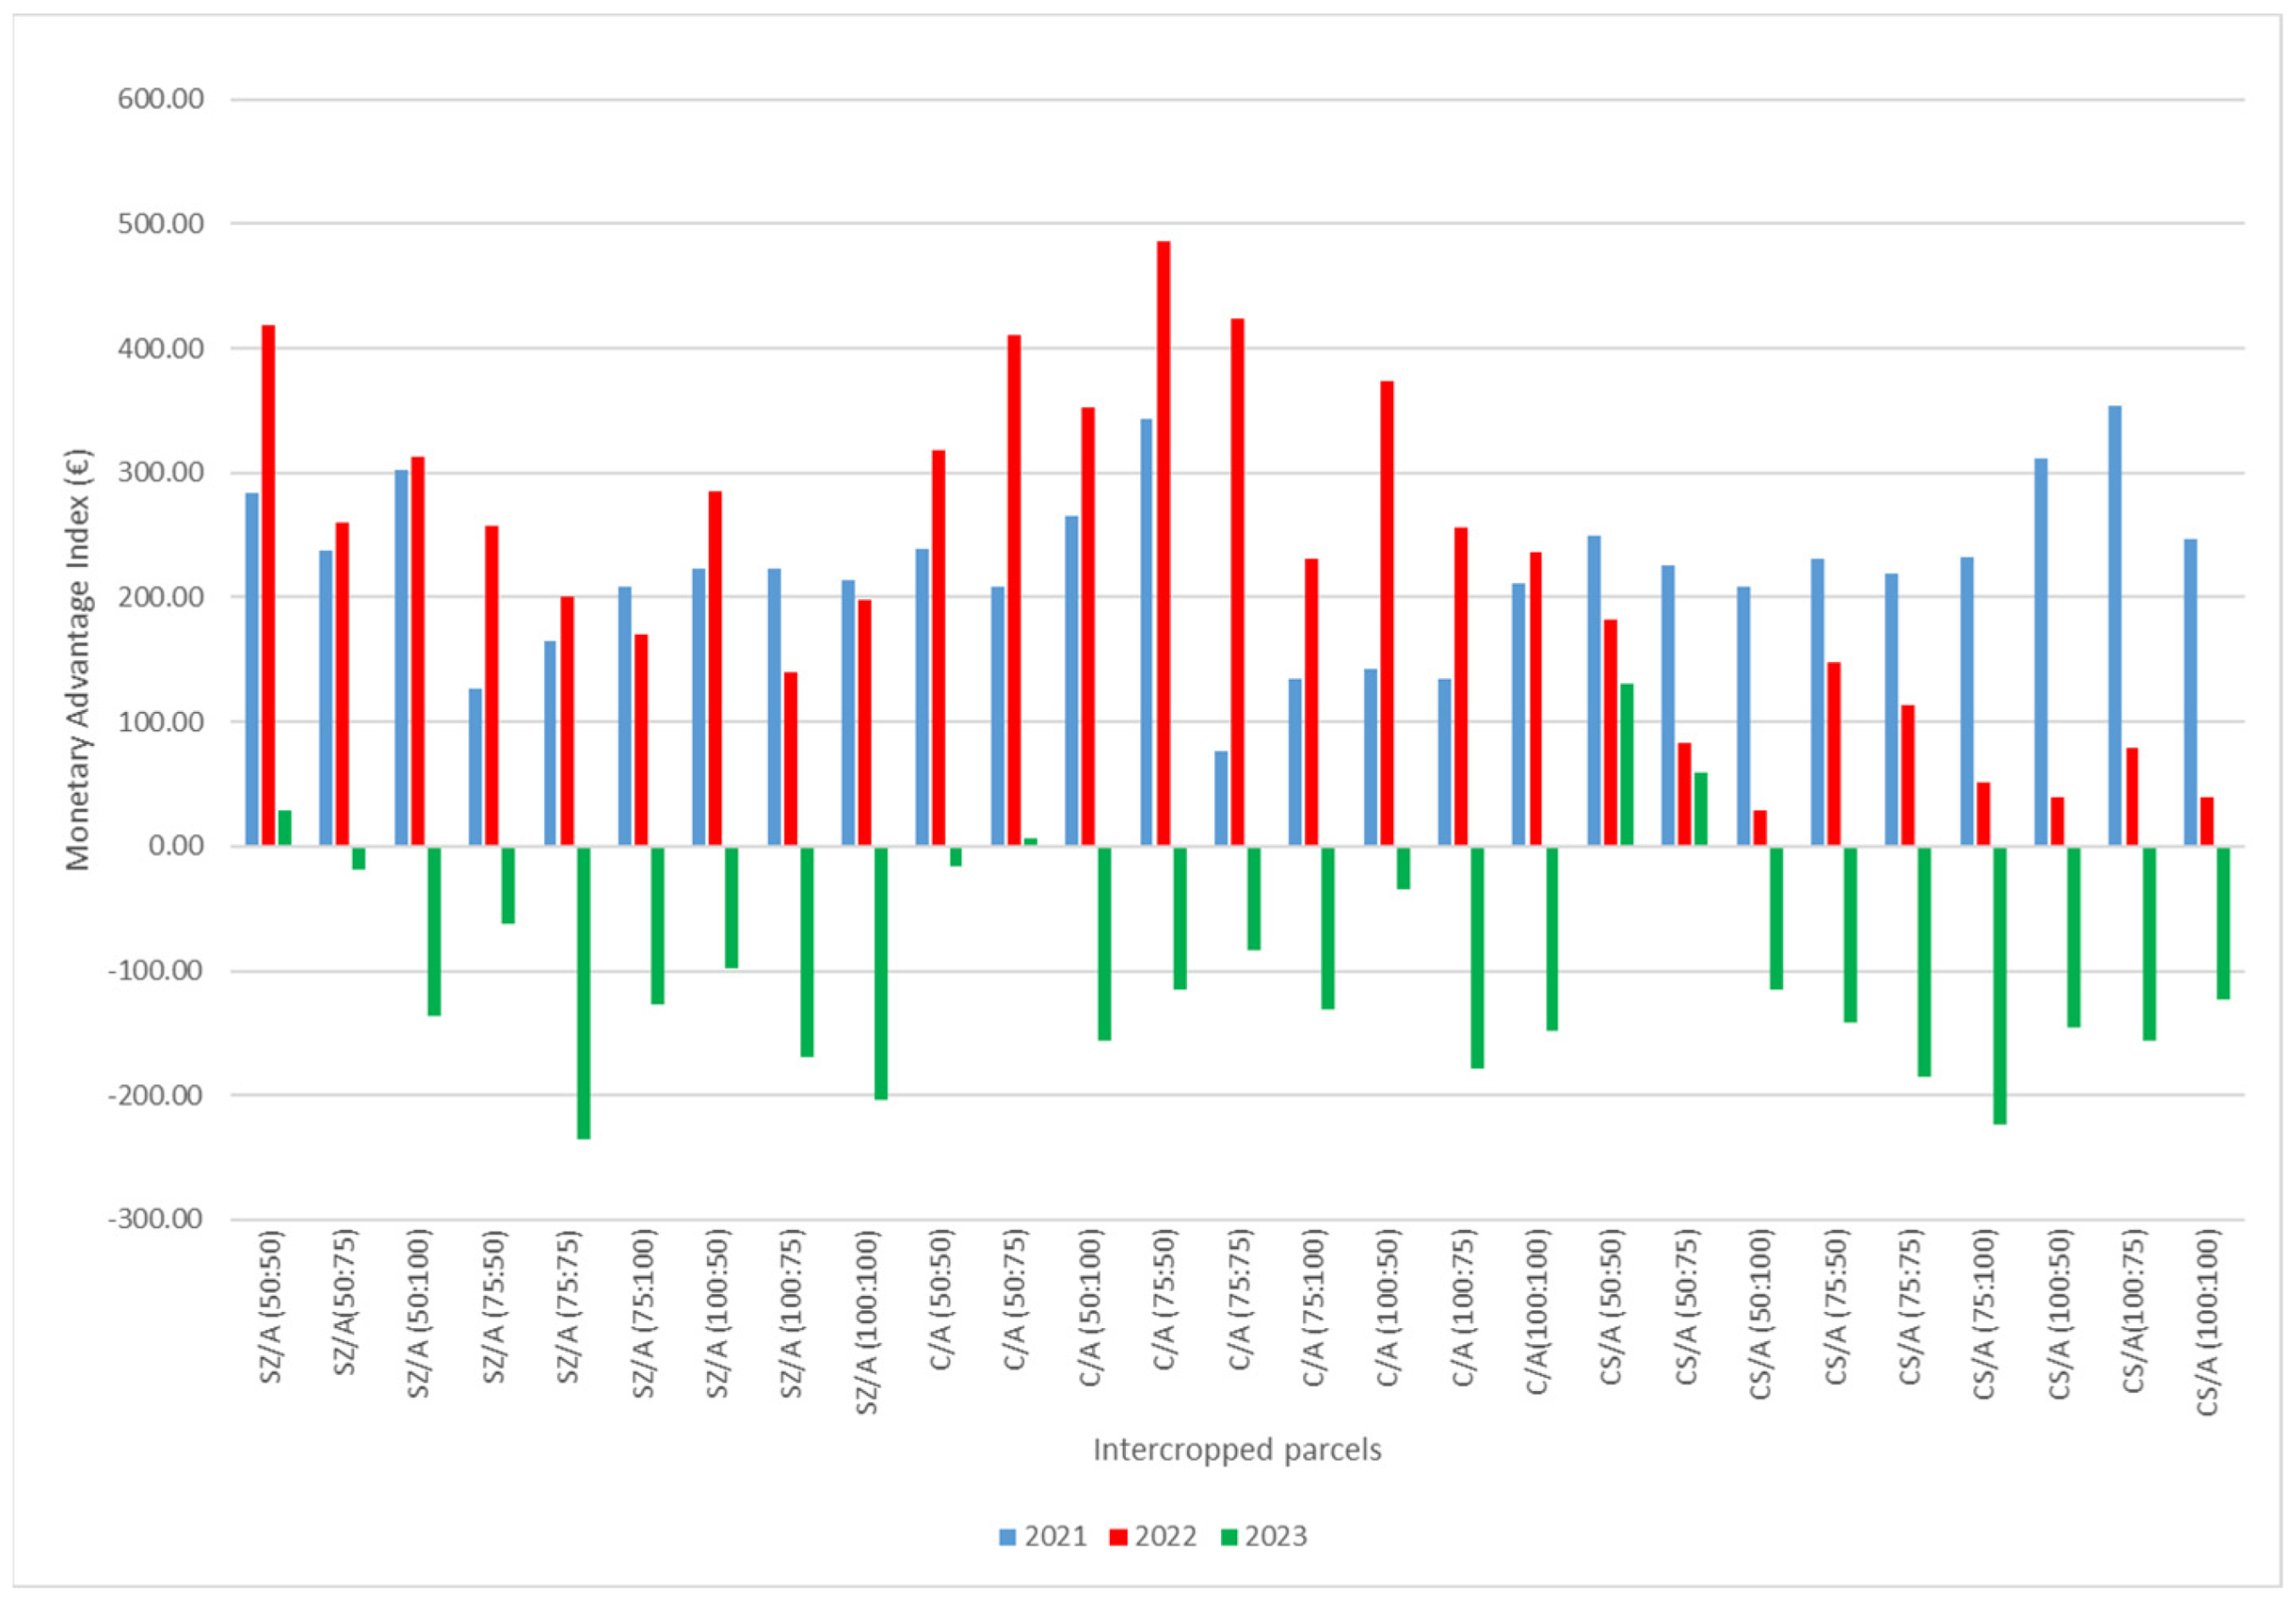
3.2.1. Monetary Advantage Index (MAI)

The MAI values were positive in all plots in the first two experimental years, indicating that these plots had high economic advantage. In 2021, the most profitable intercrop was the mixture of GK Csillag/Aviron with a seeding rate of 100:75 (EUR 353.71). On the other hand, the lowest value was given by the combination of Cellule/Aviron with a seeding rate of 75:75 (EUR 76.83). The profitability of the largest plot was many times higher than that of the smallest one. All the other values were between these two. However, the mixture of Cellue/Aviron at 75:50 achieved the second best result (EUR 343.18), being the only combination where the peas showed aggressivity and a higher competitive ratio value. In this year, we could not prove a significant difference. In the second year, we received the most pronounced monetary advantage indices, related to both the change in the world market price and the higher LERw values. The partial LER values shifted in favor of wheat, while the LERp values decreased slightly. The reason for this was a significant difference between the values of pure sown peas and the associated plots in favor of the monoculture. The most profitable intercrop was the mixture of Cellue/Aviron at 75:50 (EUR 485.47). In this combination, wheat was more dominant than peas in this year, and the AYLw value was 2% higher per plant than in pure stands. Consequently, IAw was also much higher. The variety had an impact on the MAI values, which we were able to verify statistically. There was a significant difference between GK Csillag and Cellule in the mixtures of 75:50, 50:75, and 50:100, in favor of Cellule. The profitability of these plots was many times that of GK Csillag. On the other hand, the third year, with mainly negative values, showed a strong economic disadvantage. The lowest monetary benefit was recorded for the mixture of GK Szilárd/Aviron with a 75:75 seeding rate (−EUR 235.45). The monetary advantage index was positive in a total of four cases: the mixtures GK Szilárd/Aviron 50:50 (EUR 29.19), Cellule/Aviron 50:75 (EUR 6.22), and GK Csillag/Aviron at 50:50 (EUR 130.8) and 50:75 (EUR 59.06). The reasons for the decrease in profitability were found to be unfavorable weather phenomena, which affected both companion plants. Under less ideal conditions, the plant combinations with lower seeding rates remained profitable. Finally, in the third year, we could not prove significant differences. Figure 4 illustrates the monetary advantage indices in the three growing seasons. Detailed statistical analysis can be seen in Table A10, Table A11 and Table A12 in Appendix A.

3.2.2. Intercropping Advantage (IA)

In the case of intercropping advantage, it can be concluded that this mixture composition can only be favorable for wheat, but the effectiveness of intercropping is clearly determined by peas. Intercropping advantage is the product of unit price and actual yield loss (AYL). Based on this, the index followed the actual yield loss pattern. In the first growing season, intercropping was found to be beneficial for wheat only in the mixtures of the variety GK Csillag (except for the 50:100 mixture). With regard to peas, none of the crop mixtures were beneficial, so intercropping as a whole could not be effective. In this year, only the seeding rate of peas had an effect on the IA values. There was a significant difference between the Cellule/Aviron mixture at the 75:75 and 75:50 seeding rates. The lower seeding rate of peas resulted in less negative values. Similarly to the first season, in the second growing season, an intercropping advantage in favor of wheat was detected. For the mixture of GK Szilárd/Aviron, the 50:50, 50:100, and 100:50 seeding rates were beneficial; for the Cellule/Aviron combination, the seeding rates of 75:50, 75:75, and 100:50 were advantageous. In the case of variety, a statistical difference was proven between GK Csillag and Cellule in the 75:75 mixtures. Cellule was more advantageous compared to GK Csillag. The third growing season was not ideal for any of the companion plants, clearly due to the pronounced yield loss. In terms of intercrop advantage, the wheat seeding rate was an influencing factor in 2023. There was a significant difference between GK Csillag/Aviron mixtures at 100:50, 75:50, and 50:50, as well as between 100:75 and 50:75. The same was experienced for the Cellule variety: there was a statistical deviance between the 100:75 and 50:75 mixtures and the 50:100 and 100:100 mixtures. The lower seeding rate of wheat gave less negative values of intercropping advantage. The annual IA values can be found in Table A13, Table A14 and Table A15 of Appendix A.

4. Discussion

Intensive crop cultivation made it possible to achieve high yields through the breeding of new varieties and using chemical inputs produced by non-renewable energy [3,5]. However, recent years have shown just how costly this short-term benefit has been indeed [11,56]. The question is that with rising energy prices and more frequent extreme weather events, can we afford to remain vulnerable?
The most common advantage of intercropping is providing a higher yield per unit area than in sole crops [23]. Most researchers attribute this yield advantage to the more efficient utilization of environmental resources [21,25,26,34,35]. Therefore, a successful mixture shows complementarity rather than competition [13,42,57]. However, this statement is not entirely true for wheat and pea mixtures, where their synchronous demand for water, nutrients, and light leads to the appearance of competition. The land equivalent ratio (LER) clearly shows the yield advantages of the plant association of wheat and peas [2,22], although this essential indicator is not used to interpret interactions, but rather to quantify the productivity of mixtures compared to pure stands [16]. In our experiment, there was a yield advantage in all growing seasons. This means that it was more beneficial to grow in a mixture than in a single crop. According to Justes et al. [17], the performance of the mixtures varies from year to year and is influenced simultaneously and dynamically by several ecological processes. This was probably the case in the third growing season, when unfavorable weather conditions limited nutrient uptake, thereby increasing competition between species, and affected the final yield of both companion crops. If we follow the ideas of Bedoussac and Justes [41] and graphically represent the partial LER values in a coordinate system, almost all points appear in a square. In this square, wheat dominated over peas. This superiority completely agrees with the observations of Ghaley et al. [35] and Andersen et al. [58] that, in wheat and pea intercropping, wheat plays a dominant role due to its stronger competitive tendency. Complementarity is based on a fine balance that can quickly turn into competitive relationships [56]. A perfect example of this is the complementary interaction of the outliers, which appeared in 2021 and 2022. Based on this experience, it is likely that the interactions defined by Justes et al. [17] (competition, complementarity, cooperation, compensation) alternate during the development process of companion plants. The interaction of species is more complex than being limited to just a single effect. Competition is one factor that can significantly affect yield in plant association.
In our experiment, the yield of the intercropped parcels was lower every year than in the pure stands, despite the crop rotation. This suggests that the choice of variety and the seeding rate influenced the success of the plant association at least as much as the weather or pedoclimatic conditions. The dominant role of wheat was also observed in the case of aggressivity, where, with one exception, wheat was more aggressive and recorded positive values. In contrast, peas remained strongly negative. Our selected wheat varieties have a strong growth tendency and good adaptability even in pure stands, traits that are also maintained in plant association. In addition, rapid initial growth and high N requirements give wheat an early competitive advantage [58]. Most plant breeding programs focus on developing varieties for sole cropping [39,40]. But these bred varieties may not necessarily be optimal for intercropping [34] and yield differently in stressful situations such as competition. Crop competitiveness is not a constant trait, but is strongly influenced by the genotype, the environment, and their interactions [36,56]. Due to the limited knowledge of the interactions and their unpredictable outcome, it is difficult to design a balanced combination that is suitable for intercropping [44].
The competitive ratio reflects the competitiveness of companion plants. The partial CR values of wheat were much higher than those of peas in our tested mixtures. According to Lithourgidis et al. [19], legumes often have a low competitive ability; thus, they may require higher plant densities than cereals to achieve intercropping benefits. Under weedy conditions, increasing the seeding rate is a well-established method of improving the competitive ability of peas [59]. The success of intercropping lies precisely in its ability to suppress weeds at high seeding densities. This statement is in agreement with Hauggaard-Nielsen et al. [43]: that the effective utilization of the growth resources of component plants enables higher plant densities than in monoculture. This has been contradicted by Caballero et al. [38] and Agegnehu et al. [43], who argue that high cereal densities lead to strong dominance of the companion plant, and that increased seeding rates clearly affect the competitive dynamics.
In our experiment, we combined 50, 75, and 100% of the optimum seeding rate of the companion plants, and the percentage of wheat in the mixture was not always higher than that of peas. Despite this, we experienced a high dominance of wheat, which was particularly evident in the case of actual yield loss. Yield gain was recorded only in the case of wheat, and the pea yield losses were so great that they covered almost the entire crop. The overconcentration of the parcels was caused by the high percentage of wheat and peas together, rather than by the seeding densities separately. The calculation of the monetary advantage index gave different results in each year studied. The fluctuating world market price was favorable from the point of view of winter peas, but at the same time, it appreciably depressed the selling prices of cereals both in Hungary and abroad. These prices in combination with the LER values can only be considered as profitable in the first two years. The underproduction of the last year rather resulted in a deficit. Similar negative values were also obtained for the intercrop advantage (IA). With such a high degree of yield loss, the intercrop advantage remained mostly negative.
In summary, the percentage of the companion plants to each other is at least as important as the appropriate choice of variety. Whether in the case of new bred varieties or already used varieties, knowledge of the variety itself, its role in plant association, and its developmental process is a key issue in planning experiments of this nature. In the case of seed mixtures, the purpose of intercropping determines which is the main plant among the companion plants. If we focus on wheat, its seeding rate and relative proportion within the association can significantly influence the strength of the competition between the companion plants. Unsuitable varieties may not be able to compensate for the strong competition resulting from overconcentration; therefore, benefits from wheat and pea association, such as the acquisition of natural nitrogen, are partially lost. Moreover, strong competition between the companion plants can shift the balance in favor of wheat, but this causes crop failure for both plants.
The competition for the available growth resources may also be affected by the height of the companion plants and shading. Therefore, we would like to continue our research work in this direction in the future.

5. Conclusions

Most research works confirm the effectiveness of intercropping with the presence of yield advantage, i.e., when complementarity is stronger than competition. In plant associations where the competition ability is significantly different and the peak requirements of the growing resources are the same, finding a balance between the interactions is a real challenge.
Our results lead to the following conclusions:
  • Competition definitely occurs during the development process in wheat and pea intercropping. Wheat is more dominant than peas, as confirmed by both the aggressivity (IA) and competitive ratio (CR).
  • The performance of the mixtures varies annually, and it is influenced by weather conditions. The yield of both companion plants was lower in intercropping than in monocropping.
  • Competitive ability is strongly influenced by the environment and the interactions between the companion plants. The raised competitive ability of peas is beneficial to wheat, because it has its own source of N.
  • Interactions quickly turn from one to the other and alternate during the development process of wheat and peas.
  • The relative high proportion of wheat strengthened its dominance over peas, and clearly affected the competitive dynamics. The overconcentration resulted in such a strong competition that that it led to significant yield losses for both species, but especially for peas. This can be seen in the case of actual yield loss (AYL).
  • The associated plots were only profitable in the first two years according to the monetary advantage index (MAI). The intercrop advantage (IA) remained negative based on the actual yield loss.

Author Contributions

Conceptualization, M.V.-N.; methodology, M.V.-N. and M.L.; software, M.L.; validation, M.V.-N.; formal analysis, M.V.-N. and M.L.; investigation, M.V.-N., I.K., M.T., A.R., L.S., K.I. and G.P.K.; resources, M.V.-N., I.K., M.T., A.R., L.S., K.I. and G.P.K.; data curation, M.V.-N. and M.L.; writing—original draft preparation, M.V.-N. and M.L.; writing—review and editing, M.V.-N., I.K., M.T., A.R., L.S., K.I., G.P.K. and M.L.; visualization, M.V.-N., I.K. and M.L.; supervision, M.T., I.K. and G.P.K.; project administration, M.V.-N.; funding acquisition, M.V.-N., M.T. and G.P.K. All authors have read and agreed to the published version of the manuscript.

Funding

This research was supported by the ÚNKP-23-3-II-MATE-11 New National Excellence Program of the Ministry for Culture and Innovation from the source of the National Research, Development and Innovation Fund.

Data Availability Statement

The data presented in this study are available on request from the corresponding author.

Conflicts of Interest

The authors declare no conflict of interest.

Appendix A

Table A1. Mean and standard deviation of aggressivity (A) values in 2021 for mixed cropping of wheat varieties GK Szilárd (SZ), Cellule (C), and GK Csillag (CS), as well as pea variety Aviron (A), with different seeding ratios (wheat (Zwi)/pea (Zpi)).
Pea Ratio (Zpi)
= 50%
Pea Ratio (Zpi)
= 75%
Pea Ratio (Zpi)
= 100%
Wheat/Pea VarietyWheat Ratio (Zwi)Mean ± StDevMean ± StDevMean ± StDev
Cellule/Aviron501.01 ± 0.361.29 ± 0.23 B1.08 ± 0.22 Ba
75−0.09 ± 0.36 αa0.81 ± 0.11 βA0.71 ± 0.36 βAB
1000.32 ± 0.20 ab0.55 ± 0.09 A0.41 ± 0.31 A
GK Csillag/Aviron501.68 ± 0.391.89 ± 0.781.66 ± 0.32 Bb
751.11 ± 0.54 b1.19 ± 0.621.21 ± 0.47 AB
1000.96 ± 0.35 b0.93 ± 0.220.86 ± 0.17 A
GK Szilárd/Aviron501.09 ± 0.45 B1.45 ± 0.39 B1.27 ± 0.22 Bab
750.45 ± 0.26A Bab0.81 ± 0.35 AB0.62 ± 0.44 A
1000.23 ± 0.45 Aa0.70 ± 0.27 A0.55 ± 0.21 A
Significantly different groups are indicated by different letters (Tukey’s p < 0.05). Lower-case letters in cells within a column with consistent shades of gray backgrounds are for the effect of wheat variety when testing it under fixed wheat ratio (Zwi) and pea ratio (Zpi); upper-case letters in cells directly below each other are for the effect of wheat ratio (Zwi) when testing it within fixed wheat variety and under fixed pea ratio (Zpi); Greek letters are for the effect of pea ratio (Zpi) when testing it within fixed wheat variety and under fixed wheat ratio (Zwi) (read horizontally).
Table A2. Mean and standard deviation of aggressivity (A) values in 2022 for mixed cropping of wheat varieties GK Szilárd (SZ), Cellule (C), and GK Csillag (CS), as well as pea variety Aviron (A), with different seeding ratios (wheat (Zwi)/pea (Zpi)).
Pea Ratio (Zpi)
= 50%
Pea Ratio (Zpi)
= 75%
Pea Ratio (Zpi)
= 100%
Wheat/Pea VarietyWheat Ratio (Zwi)Mean ± StDevMean ± StDevMean ± StDev
Cellule/Aviron501.54 ± 0.411.13 ± 0.361.20 ± 0.43 a
750.23 ± 0.950.77 ± 0.380.84 ± 0.21
1000.27 ± 0.630.54 ± 0.100.65 ± 0.10
GK Csillag/Aviron501.55 ± 0.46 B1.56 ± 0.28 B1.48 ± 0.17 Bab
750.82 ± 0.22 A0.96 ± 0.10 A0.97 ± 0.18 A
1000.67 ± 0.19 A0.80 ± 0.20 A0.77 ± 0.16 A
GK Szilárd/Aviron501.69 ± 0.32 B1.49 ± 0.38 B1.80 ± 0.20 Bb
750.81 ± 0.26 A1.03 ± 0.21 AB1.10 ± 0.17 A
1000.50 ± 0.46 A0.62 ± 0.27 A0.79 ± 0.09 A
Significantly different groups are indicated by different letters (Tukey’s p < 0.05). Lower-case letters in cells within a column with consistent shades of gray backgrounds are for the effect of wheat variety when testing it under fixed wheat ratio (Zwi) and pea ratio (Zpi); upper-case letters in cells directly below each other are for the effect of wheat ratio and under fixed pea ratio (Zpi). The effect of Zpi was not found to be significant in 2022 (p > 0.05).
Table A3. Mean and standard deviation of aggressivity (A) values in 2023 for mixed cropping of wheat varieties GK Szilárd (SZ), Cellule (C), and GK Csillag (CS), as well as pea variety Aviron (A), with different seeding ratios (wheat (Zwi)/pea (Zpi).
Pea Ratio (Zpi)
= 50%
Pea Ratio (Zpi)
= 75%
Pea Ratio (Zpi)
= 100%
Wheat/Pea VarietyWheat Ratio (Zwi)Mean ± StDevMean ± StDevMean ± StDev
Cellule/Aviron501.04 ± 0.15 B1.01 ± 0.17 B1.01 ± 0.15 B
750.72 ± 0.03 A0.77 ± 0.13 AB0.82 ± 0.12 AB
1000.60 ± 0.18 A0.59 ± 0.18 A0.63 ± 0.15 A
GK Csillag/Aviron500.76 ± 0.03 αB1.09 ± 0.17 βB1.08 ± 0.17 βB
750.71 ± 0.08 B0.72 ± 0.20 A0.73 ± 0.08 A
1000.52 ± 0.08 A0.59 ± 0.10 A0.64 ± 0.09 A
GK Szilárd/Aviron501.05 ± 0.431.25 ± 0.39 B1.14 ± 0.24 B
750.70 ± 0.340.72 ± 0.12 AB0.91 ± 0.24 AB
1000.60 ± 0.120.67 ± 0.10 A0.63 ± 0.12 A
Significantly different groups are indicated by different letters (Tukey’s p < 0.05). Upper-case letters in cells directly below each other are for the effect of wheat ratio and under fixed pea ratio (Zpi); Greek letters are for the effect of pea ratio (Zpi) when testing it within fixed wheat variety and under fixed wheat ratio (Zwi) (read horizontally). The effect of wheat variety was not found to be significant in 2023 (p > 0.05).
Table A4. Mean and standard deviation of competitive ratio (CR) values in 2021 for mixed cropping of wheat varieties GK Szilárd (SZ), Cellule (C), and GK Csillag (CS), as well as pea variety Aviron (A), with different seeding ratios (wheat (Zwi)/pea (Zpi)).
Pea Ratio (Zpi)
= 50%
Pea Ratio (Zpi)
= 75%
Pea Ratio (Zpi)
= 100%
Wheat/Pea VarietyWheat Ratio (Zwi)Mean ± StDevMean ± StDevMean ± StDev
Cellule/Aviron502.92 ± 0.66 B4.00 ± 0.34 a3.54 ± 0.71
752.08 ± 0.11 Aa4.31 ± 1.394.27 ± 1.78
1002.31 ± 0.30 ABa3.03 ± 0.373.12 ± 0.89
GK Csillag/Aviron504.96 ± 1.338.34 ± 3.58 b7.44 ± 3.16
754.29 ± 1.21 b7.10 ± 4.146.79 ± 2.33
1004.90 ± 1.58 b4.76 ± 1.326.77 ± 4.99
GK Szilárd/Aviron503.02 ± 1.104.90 ± 1.54 ab4.05 ± 1.13
752.37 ± 0.41 a3.84 ± 1.633.32 ± 1.12
1002.41 ± 0.34 a4.05 ± 1.223.34 ± 1.10
Different groups are indicated by different letters. Lower-case letters in cells within a column with consistent shades of gray backgrounds are for the effect of wheat variety when testing it under fixed wheat ratio (Zwi) and pea ratio (Zpi) (Tukey’s, significant at p < 0.05); upper-case letters in cells directly below each other are for the effect of wheat ratio and under fixed pea ratio (Zpi). (Tukey’s, only slightly significant at p < 0.1, and only in case of mixed cropping Cellulite/Aviron with pea ratio 50%.) The effects of wheat ratio (Zwi) and pea ratio (Zpi) were not found to be significant in 2021 at p > 0.05.
Table A5. Mean and standard deviation of competitive ratio (CR) values in 2022 for mixed cropping of wheat varieties GK Szilárd (SZ), Cellule (C), and GK Csillag (CS), as well as pea variety Aviron (A), with different seeding ratios (wheat (Zwi)/pea (Zpi)).
Pea Ratio (Zpi)
= 50%
Pea Ratio (Zpi)
= 75%
Pea Ratio (Zpi)
= 100%
Wheat/Pea VarietyWheat Ratio (Zwi)Mean ± StDevMean ± StDevMean ± StDev
Cellule/Aviron509.55 ± 9.353.37 ± 1.21 a4.35 ± 1.74 a
752.73 ± 0.703.61 ± 1.644.52 ± 1.60
1003.52 ± 2.332.98 ± 0.534.01 ± 1.15
GK Csillag/Aviron507.30 ± 4.467.92 ± 2.51 b8.58 ± 1.57 b
753.54 ± 1.03 α4.99 ± 0.83 αβ6.39 ± 1.31 β
1008.86 ± 10.157.68 ± 3.708.80 ± 4.31
GK Szilárd/Aviron504.86 ± 1.965.58 ± 2.24 ab7.71 ± 1.34 b
753.29 ± 1.016.39 ± 4.008.19 ± 3.82
1004.24 ± 2.784.59 ± 2.506.13 ± 2.49
Significantly different groups are indicated by different letters (Tukey’s p < 0.05). Lower-case letters in cells within a column with consistent shades of gray backgrounds are for the effect of wheat variety when testing it under fixed wheat ratio (Zwi) and pea ratio (Zpi); Greek letters are for the effect of pea ratio (Zpi) when testing it within fixed wheat variety and under fixed wheat ratio (Zwi) (read horizontally).The effect of wheat ratio (Zwi) was not found to be significant in 2022 (p > 0.05).
Table A6. Mean and standard deviation of competitive ratio (CR) values in 2023 for mixed cropping of wheat varieties GK Szilárd (SZ), Cellule (C), and GK Csillag (CS), as well as pea variety Aviron (A), with different seeding ratios (wheat (Zwi)/pea (Zpi)).
Pea Ratio (Zpi)
= 50%
Pea Ratio (Zpi)
= 75%
Pea Ratio (Zpi)
= 100%
Wheat/Pea VarietyWheat Ratio (Zwi)Mean ± StDevMean ± StDevMean ± StDev
Cellule/Aviron503.65 ± 0.644.07 ± 1.094.39 ± 0.91
753.80 ± 0.874.60 ± 1.386.56 ± 3.23
1004.00 ± 1.476.04 ± 3.036.82 ± 3.68
GK Csillag/Aviron502.56 ± 0.13 A4.30 ± 1.086.01 ± 2.24
753.73 ± 0.48 B4.66 ± 1.465.53 ± 1.10
1003.56 ± 0.99 AB5.31 ± 2.026.22 ± 2.24
GK Szilárd/Aviron505.14 ± 3.758.06 ± 5.495.91 ± 2.40
754.40 ± 1.796.57 ± 3.5410.00 ± 5.26
1004.43 ± 1.6711.26 ± 8.9721.26 ± 26.19
Slightly significantly different groups are indicated by different upper-case letters in cells directly below each other for the effect of wheat ratio and under fixed pea ratio (Zpi) (Tukey’s, p < 0.1, and only in case of mixed cropping GK Csillag/Aviron with pea ratio 50%). None of the effects of wheat variety, Zwi, or Zpi were found to be significant in 2023 at p > 0.05.
Table A7. Mean and standard deviation of actual yield loss (AYL) values in 2021 for mixed cropping of wheat varieties GK Szilárd (SZ), Cellule (C), and GK Csillag (CS), as well as pea variety Aviron (A), with different seeding ratios (wheat (Zwi)/pea (Zpi). None of the effects of wheat variety, Zwi, or Zpi were found to be significant in 2021 (p > 0.05).
Pea Ratio (Zpi)
= 50%
Pea Ratio (Zpi)
= 75%
Pea Ratio (Zpi)
= 100%
Wheat/Pea VarietyWheat Ratio (Zwi)Mean ± StDevMean ± StDevMean ± StDev
Cellule/Aviron 50−0.76 ± 0.03−0.77 ± 0.19−0.66 ± 0.31
75−0.62 ± 0.14−0.93 ± 0.19−0.86 ± 0.13
100−0.86 ± 0.13−0.85 ± 0.23−0.72 ± 0.43
GK Csillag/Aviron50−0.69 ± 0.25−0.72 ± 0.38−0.71 ± 0.35
75−0.69 ± 0.45−0.71 ± 0.38−0.70 ± 0.36
100−0.62 ± 0.35−0.58 ± 0.20−0.66 ± 0.40
GK Szilárd/Aviron50−0.65 ± 0.15−0.73 ± 0.09−0.63 ± 0.09
75−0.85 ± 0.12−0.84 ± 0.12−0.77 ± 0.11
100−0.76 ± 0.12−0.79 ± 0.10−0.78 ± 0.08
Table A8. Mean and standard deviation of actual yield loss (AYL) values in 2022 for mixed cropping of wheat varieties GK Szilárd (SZ), Cellule (C), and GK Csillag (CS), as well as pea variety Aviron (A), with different seeding ratios (wheat (Zwi)/pea (Zpi)).
Pea Ratio (Zpi)
= 50%
Pea Ratio (Zpi)
= 75%
Pea Ratio (Zpi)
= 100%
Wheat/Pea VarietyWheat Ratio (Zwi)Mean ± StDevMean ± StDevMean ± StDev
Cellule/Aviron 50−0.82 ± 0.23−0.49 ± 0.32−0.52 ± 0.48 b
75−0.41 ± 0.54−0.57 ± 0.25 b−0.75 ± 0.29
100−0.60 ± 0.46−0.77 ± 0.18−0.79 ± 0.19
GK Csillag/Aviron50−0.77 ± 0.18−0.91 ± 0.12−0.96 ± 0.11 a
75−0.85 ± 0.13−0.90 ± 0.05 a−0.94 ± 0.13
100−0.95 ± 0.13−0.93 ± 0.08−0.96 ± 0.07
GK Szilárd/Aviron50−0.58 ± 0.11−0.73 ± 0.17−0.68 ± 0.17 b
75−0.78 ± 0.06−0.83 ± 0.01 ab−0.86 ± 0.08
100−0.70 ± 0.36−0.85 ± 0.26−0.81 ± 0.24
Significantly different groups are indicated by different lower-case letters in cells within a column with consistent shades of gray backgrounds for the effect of wheat variety when testing it under fixed wheat ratio (Zwi) and pea ratio (Zpi) (Tukey’s p < 0.05). The effects of Zwi and Zpi were not found to be significant in 2022 (p > 0.05).
Table A9. Mean and standard deviation of actual yield loss (AYL) values in 2023 for mixed cropping of wheat varieties GK Szilárd (SZ), Cellule (C), and GK Csillag (CS), as well as pea variety Aviron (A), with different seeding ratios (wheat (Zwi)/pea (Zpi)). None of the effects of wheat variety, Zwi, or Zpi were found to be significant in 2023 (p > 0.05).
Pea Ratio (Zpi)
= 50%
Pea Ratio (Zpi)
= 75%
Pea Ratio (Zpi)
= 100%
Wheat/Pea VarietyWheat Ratio (Zwi)Mean ± StDevMean ± StDevMean ± StDev
Cellule/Aviron 50−1.01 ± 0.06−0.99 ± 0.09−0.99 ± 0.09
75−1.07 ± 0.14−1.04 ± 0.13−1.07 ± 0.08
100−1.01 ± 0.17−1.11 ± 0.09−1.09 ± 0.05
GK Csillag/Aviron50−0.90 ± 0.13−0.95 ± 0.11−1.07 ± 0.10
75−1.09 ± 0.13−1.12 ± 0.10−1.14 ± 0.13
100−1.10 ± 0.10−1.10 ± 0.07−1.08 ± 0.07
GK Szilárd/Aviron50−0.98 ± 0.12−1.01 ± 0.12−1.01 ± 0.06
75−1.04 ± 0.21−1.16 ± 0.17−1.08 ± 0.19
100−1.08 ± 0.06−1.13 ± 0.08−1.15 ± 0.11
Table A10. Mean and standard deviation of monetary advantage index (MAI) values in 2021 for mixed cropping of wheat varieties GK Szilárd (SZ), Cellule (C), and GK Csillag (CS), as well as pea variety Aviron (A), with different seeding ratios (wheat (Zwi)/pea (Zpi)). None of the effects of wheat variety, Zwi, or Zpiwere found to be significant in 2021 (p > 0.05).
Pea Ratio (Zpi)
= 50%
Pea Ratio (Zpi)
= 75%
Pea Ratio (Zpi)
= 100%
Wheat/Pea VarietyWheat Ratio (Zwi)Mean ± StDevMean ± StDevMean ± StDev
Cellule/Aviron 50239.57 ± 60.45209.16 ± 153.48265.66 ± 197.06
75343.18 ± 82.0276.83 ± 207.40134.07 ± 124.96
100142.64 ± 129.33134.93 ± 244.72210.70 ± 292.34
GK Csillag/Aviron50250.11 ± 151.79225.28 ± 272.75208.99 ± 239.39
75230.50 ± 276.90219.47 ± 233.82232.26 ± 208.00
100312.12 ± 249.61353.71 ± 126.67246.78 ± 265.58
GK Szilárd/Aviron50284.21 ± 112.61237.76 ± 78.55302.91 ± 44.42
75126.23 ± 135.29165.58 ± 118.08209.16 ± 107.05
100223.47 ± 79.94223.46 ± 92.64213.83 ± 54.17
Table A11. Mean and standard deviation of monetary advantage index (MAI) values in 2022 for mixed cropping of wheat varieties GK Szilárd (SZ), Cellule (C), and GK Csillag (CS), as well as pea variety Aviron (A), with different seeding ratios (wheat (Zwi)/pea (Zpi)).
Pea Ratio (Zpi)
= 50%
Pea Ratio (Zpi)
= 75%
Pea Ratio (Zpi)
= 100%
Wheat/Pea VarietyWheat Ratio (Zwi)Mean ± StDevMean ± StDevMean ± StDev
Cellule/Aviron 50175.71 ± 263.70410.51 ± 160.62 b353.24 ± 223.37 b
75485.47 ± 288.02 b424.23 ± 184.36231.60 ± 231.57
100374.07 ± 329.93256.50 ± 141.26235.84 ± 180.05
GK Csillag/Aviron50182.72 ± 79.4982.69 ± 115.33 a28.39 ± 77.75 a
75147.35 ± 118.70 a113.25 ± 62.5751.50 ± 122.55
10039.73 ± 156.7079.27 ± 89.7739.74 ± 83.68
GK Szilárd/Aviron50418.43 ± 136.01260.60 ± 161.63 ab313.48 ± 149.29 ab
75257.32 ± 84.18 ab200.83 ± 18.77170.75 ± 86.55
100285.06 ± 238.24139.71 ± 287.60197.98 ± 198.50
Significantly different groups are indicated by different lower-case letters in cells within a column with consistent shades of gray backgrounds for the effect of wheat variety when testing it under fixed wheat ratio (Zwi) and pea ratio (Zpi) (Tukey’s p < 0.05). The effects of Zwi and Zpiwere not found to be significant in 2022 (p > 0.05).
Table A12. Mean and standard deviation of monetary advantage index (MAI) values in 2023 for mixed cropping of wheat varieties GK Szilárd (SZ), Cellule (C), and GK Csillag (CS), as well as pea variety Aviron (A), with different seeding ratios (wheat (Zwi)/pea (Zpi)). None of the effects of wheat variety, Zwi, or Zpi were found to be significant in 2023 (p > 0.05).
Pea Ratio (Zpi)
= 50%
Pea Ratio (Zpi)
= 75%
Pea Ratio (Zpi)
= 100%
Wheat/Pea VarietyWheat Ratio (Zwi)Mean ± StDevMean ± StDevMean ± StDev
Cellule/Aviron 50−16.34 ± 94.196.22 ± 150.0513.85 ± 149.97
75−114.56 ± 228.76−83.50 ± 221.35−131.10 ± 144.10
100−34.48 ± 258.52−178.26 ± 126.13−148.46 ± 84.88
GK Csillag/Aviron50130.80 ± 175.8959.06 ± 146.08−115.81 ± 158.56
75−141.21 ± 196.41−185.56 ± 151.48−223.26 ± 211.87
100−144.99 ± 148.20−156.01 ± 111.08−123.37 ± 122.22
GK Szilárd/Aviron5029.19 ± 164.03−19.10 ± 174.88−18.53 ± 89.70
75−62.82 ± 292.17−235.44 ± 242.50−126.70 ± 275.92
100−98.15 ± 75.40−169.42 ± 114.56−204.20 ± 156.79
Table A13. Mean and standard deviation of intercropping advantage (IA) values in 2021 for mixed cropping of wheat varieties GK Szilárd (SZ), Cellule (C), and GK Csillag (CS), as well as pea variety Aviron (A), with different seeding ratios (wheat (Zwi)/pea (Zpi)).
Pea Ratio (Zpi)
= 50%
Pea Ratio (Zpi)
= 75%
Pea Ratio (Zpi)
= 100%
Wheat/Pea VarietyWheat Ratio (Zwi)Mean ± StDevMean ± StDevMean ± StDev
Cellule/Aviron 50−196.18 ± 5.73−200.46 ± 41.27−165.72 ± 76.76
75−156.76 ± 36.99 β−242.40 ± 44.65 α−219.11 ± 39.35 αβ
100−224.53 ± 29.62−222.73 ± 54.23−184.65 ± 112.06
GK Csillag/Aviron50−190.86 ± 55.77−196.82 ± 80.23−188.84 ± 83.43
75−193.10 ± 98.84−196.35 ± 80.13−192.05 ± 76.97
100−180.49 ± 76.47−168.15 ± 44.94−183.56 ± 92.68
GK Szilárd/Aviron50−171.89 ± 34.89−193.58 ± 19.51−162.47 ± 23.23
75−219.58 ± 28.06−219.32 ± 21.50−196.80 ± 25.45
100−198.89 ± 34.97−211.48 ± 17.99−202.95 ± 20.58
Significantly different groups are indicated by different Greek letters for the effect of pea ratio (Zpi) when testing it within fixed wheat variety and under fixed wheat ratio (Zwi) (read horizontally) (Tukey’s p < 0.05). The effects of wheat variety and wheat ratio (Zwi) were not found to be significant in 2021 (p > 0.05).
Table A14. Mean and standard deviation of intercropping advantage (IA) values in 2022 for mixed cropping of wheat varieties GK Szilárd (SZ), Cellule (C), and GK Csillag (CS), as well as pea variety Aviron (A), with different seeding ratios (wheat (Zwi)/pea (Zpi).
Pea Ratio (Zpi)
= 50%
Pea Ratio (Zpi)
= 75%
Pea Ratio (Zpi)
= 100%
Wheat/Pea VarietyWheat Ratio (Zwi)Mean ± StDevMean ± StDevMean ± StDev
Cellule/Aviron 50−242.57 ± 74.13−145.78 ± 97.53−156.11 ± 142.05
75−120.63 ± 161.21−167.36 ± 72.85 b−224.35 ± 87.81
100−176.11 ± 141.34−229.23 ± 54.84−233.92 ± 57.88
GK Csillag/Aviron50−227.12 ± 52.04−272.78 ± 38.95−287.90 ± 34.75
75−251.61 ± 42.35−266.28 ± 16.64 a−282.88 ± 43.20
100−283.06 ± 39.73−276.64 ± 28.25−286.50 ± 22.10
GK Szilárd/Aviron50−165.24 ± 34.17−214.75 ± 53.06−197.31 ± 53.06
75−230.76 ± 20.31−246.28 ± 3.56 ab−253.18 ± 27.54
100−203.23 ± 112.65−253.12 ± 82.63−237.63 ± 74.65
Significantly different groups are indicated by different lower-case letters in cells within a column with consistent shades of gray backgrounds for the effect of wheat variety when testing it under fixed wheat ratio (Zwi) and pea ratio (Zpi) (Tukey’s p < 0.05). The effects of Zwi and Zpi were not found to be significant in 2022 (p > 0.05).
Table A15. Mean and standard deviation of intercropping advantage (IA) values in 2023 for mixed cropping of wheat varieties GK Szilárd (SZ), Cellule (C), and GK Csillag (CS), as well as pea variety Aviron (A), with different seeding ratios (wheat (Zwi)/pea (Zpi)).
Pea Ratio (Zpi)
= 50%
Pea Ratio (Zpi)
= 75%
Pea Ratio (Zpi)
= 100%
Wheat/Pea VarietyWheat Ratio (Zwi)Mean ± StDevMean ± StDevMean ± StDev
Cellule/Aviron 50−495.82 ± 33.45−464.95 ± 54.83 B−449.77 ± 43.32 B
75−536.94 ± 47.80−520.50 ± 44.01 AB−529.56 ± 34.90 AB
100−540.13 ± 40.75−558.67 ± 35.07 A−548.45 ± 24.91 A
GK Csillag/Aviron50−425.61 ± 47.72 B−459.08 ± 62.73 B−495.14 ± 58.78
75−544.95 ± 35.17 A−542.08 ± 16.39 AB−541.10 ± 46.48
100−554.98 ± 30.56 A−554.36 ± 36.03 A−545.80 ± 30.17
GK Szilárd/Aviron50−485.85 ± 84.15−503.24 ± 77.10−478.19 ± 52.76
75−526.52 ± 79.52−557.35 ± 73.80−548.99 ± 57.15
100−558.91 ± 23.01−576.40 ± 46.27−572.04 ± 68.93
Significantly different groups are indicated by different upper-case letters in cells directly below each other for the effect of wheat ratio and under fixed pea ratio (Zpi) (Tukey’s p < 0.05). The effects of wheat variety and Zpi were not found to be significant in 2023 (p > 0.05).

References

  1. Crews, T.E.; Peoples, M.B. Legume versus fertilizer sources of nitrogen: Ecological tradeoffs and human needs. Agric. Ecosyst. Environ. 2004, 10, 279–297. [Google Scholar] [CrossRef]
  2. Hauggaard-Nielsen, H.; Jensen, E.S. Facilitative root interactions in intercrops. Plant Soil 2005, 274, 237–250. [Google Scholar] [CrossRef]
  3. Maitra, S.; Hossain, A.; Brestic, M.; Skalicky, M.; Ondrisik, P.; Gitari, H.; Brahmachari, K.; Shankar, T.; Bhadra, P.; Palai, J.B.; et al. Intercropping-A Low Input Agricultural Strategy for Food and Environmental Security. Agronomy 2021, 11, 343. [Google Scholar] [CrossRef]
  4. Mamine, F.; Farés, M. Barriers and Levers to Developing Wheat-Pea Intercropping in Europe: A Review. Sustainability 2020, 12, 6962. [Google Scholar] [CrossRef]
  5. Voisin, A.-S.; Guéguen, J.; Huyghe, C.; Jeuffroy, M.-H.; Magrini, M.-B.; Meynard, J.-M.; Mougel, C.; Pellerin, S.; Pelzer, E. Legumes for feed, food, biomaterials and bioenergy in Europe: A review. Agron. Sustain. Dev. 2014, 34, 361–380. [Google Scholar] [CrossRef]
  6. Divéky-Ertsey, A.; Gál, I.; Madaras, K.; Pusztai, P.; Csambalik, L. Contribution of Pulses to Agrobiodiversity in the View of EU Protein Strategy. Stresses 2022, 2, 90–112. [Google Scholar] [CrossRef]
  7. Jolánkai, M. Gabonafélék. In A Növénytermesztés Alapjai. Gabonafélék, 1st ed.; Antal, J., Jolánkai, M., Eds.; Mezőgazda Kiadó: Budapest, Hungary, 2005; pp. 180–181. [Google Scholar]
  8. Pepó, P.; Sárvári, M. Gabonanövények Termesztése, Agrármérnöki MsC szak Tananyagfejlesztése; TÁMOP-4.1.2-08/1/A-2000-0010 projekt; Debreceni Egyetem: Debrecen, Hungary, 2011; pp. 3–6. [Google Scholar]
  9. Kristó, I.; Vályi-Nagy, M.; Rácz, A.; Tar, M.; Irmes, K.; Szentpéteri, L.; Ujj, A. Effects of weed control treatments on weed composition nad yield components of winter wheat (Triticum aestivum L.) and winter pea (Pisum sativum L.) intercrops. Agronomy 2022, 12, 2590. [Google Scholar] [CrossRef]
  10. Fustec, J.; Lesuffleur, F.; Mahieu, S.; Cliquet, J.-B. Nitrogen rhizodeposition of legumes. A review. Agron. Sustain. Dev. 2010, 30, 57–66. [Google Scholar] [CrossRef]
  11. Thilakarathna, M.S.; McElroy, M.S.; Chapagain, T.; Papadopoulos, Y.A.; Raizada, M.N. Belowground nitrogen transfer from legumes to non-legumes under managed herbaceous cropping systems. A review. Agron. Sustain. Dev. 2016, 36, 58. [Google Scholar] [CrossRef]
  12. Abi-Ghanem, R.; Carpenter-Boggs, L.; Smith, J.L. Cultivar effects on nitrogen fixation in peas and lentils. Biol. Fertil. Soils 2011, 47, 115–120. [Google Scholar] [CrossRef]
  13. Pelzer, E.; Bazot, M.; Makowski, D.; Corre-Hellou, G.; Naudin, C.; Al Rifai, M.; Baranger, E.; Bedoussac, L.; Biarnes, V.; Boucheny, P.; et al. Pea-wheat intercrops in low-input conditions combine high economic performances and low environmental impacts. Eur. J. Agron. 2012, 40, 39–53. [Google Scholar] [CrossRef]
  14. Louarn, G.; Bedoussac, L.; Gaudio, N.; Journet, E.-P.; Moreau, D.; Jensen, E.S.; Justes, E. Plant nitrogen nutrition status in intercrops-a review of concepts and methods. Eur. J. Agron. 2021, 124, 126229. [Google Scholar] [CrossRef]
  15. Kherif, O.; SEghouani, M.; Zemmouri, B.; Bouhenache, A.; Keskes, M.I.; Yacer-Nazih, R.; Ouaret, W.; Latati, M. Understanding the Response of Wheat-Chickpea Intercropping to Nitrogen Fertilization Using Agro-Ecological Competitive Indices under Contrasting Pedoclimatic Conditions. Agronomy 2021, 11, 1225. [Google Scholar] [CrossRef]
  16. Bedoussac, L.; Journet, E.-P.; Hauggaard-Nielsen, H.; Naudin, C.; Corre-Hellou, G.; Jensen, E.S.; Prieur, L.; Justes, E. Ecological principles underlying the increase of productivity achieved by cereal-grain legume intercrops in organic farming, A review. Agron. Sustain. Dev. 2015, 35, 911–935. [Google Scholar] [CrossRef]
  17. Justes, E.; Bedoussac, L.; Dordas, C.; Frak, E.; Louarn, G.; Boudsocq, S.; Journet, E.-P.; Lithourgidis, A.; Pankou, C.; Zhang, C.; et al. the 4C approach as a way to understand species interactions determining intercropping productivity. Front. Agric. Sci. Eng. 2021, 8, 387–399. [Google Scholar] [CrossRef]
  18. Pelzer, E.; Bazot, M.; Guichard, L.; Jeuffroy, M.-H. Crop Management Affects the Performance of a Winter Pea-Wheat Intercrop. Agron. J. 2016, 108, 1089–1100. [Google Scholar] [CrossRef]
  19. Lithourgidis, A.S.; Vlachostergios, D.N.; Dordas, C.A.; Damalas, C.A. Dry matter yield, nitrogen content, and competition in pea-cereal intercropping systems. Eur. J. Agron. 2011, 34, 287–294. [Google Scholar] [CrossRef]
  20. Naudin, C.; van der Welf, H.M.G.; Jeuffroy, M.-H.; Corre-Hellou, G. Life cycle assessment applied to pea-wheat intercrops: A new method for handling the impacts of co-products. J. Clean. Prod. 2014, 73, 80–87. [Google Scholar] [CrossRef]
  21. Bacchi, M.; Monti, M.; Calvi, A.; Lo Presti, E.; Pellicanó, A.; Preiti, G. Forage Potential of Cereal/Legume intercrops: Agronomic Performances, Yield, Quality Forage and LER in Two Harvesting Times in a Mediterranean Environment. Agronomy 2021, 11, 121. [Google Scholar] [CrossRef]
  22. Fujita, K.; Ofosu-Budu, K.G.; Ogata, S. Biological nitrogen fixation in mixed legume-cereal cropping systems. Plant Soil 1992, 141, 155–175. [Google Scholar] [CrossRef]
  23. Lithourgidis, A.S.; Dordas, C.A.; Damalas, C.A.; Vlachosterios, D.N. Annual intercrops: An alternative pathway for sustainable agriculture. Aust. J. Crop Sci. 2011, 5, 396–410. [Google Scholar]
  24. Willey, R.W. Resource use in intercropping systems. Agric. Water Manag. 1990, 17, 215–231. [Google Scholar] [CrossRef]
  25. Corre-Hellou, G.; Fustec, J.; Crozat, Y. Interspecific competition for soil N and its interaction with N2 fixation, leaf expansion and crop growth in pea-barley intercrops. Plant Soil 2006, 282, 195–208. [Google Scholar] [CrossRef]
  26. Bedoussac, L.; Justes, E. The efficiency of a durum wheat-winter pea intercrop to improve yield and wheat grain protein concentration depends on N availability during early growth. Plant Soil 2010, 330, 19–35. [Google Scholar] [CrossRef]
  27. Jensen, E.S.; Carlsson, G.; Haggaard-Nielsen, H. Intercropping of grain legumes and cereals improves the use of soil N resources and reduces the requirement for synthetic fertilizer N: A global-scale analysis. Agron. Sustain. Dev. 2020, 40, 5. [Google Scholar] [CrossRef]
  28. Gonzáles, A.M.; Pesqueira, A.M.; García, L.; Santalla, M. Effects of Photoperiod and Drought on Flowering and Growth Development of Protein-Rich Legumes under Atlantic Environments. Agronomy 2023, 13, 1025. [Google Scholar] [CrossRef]
  29. Neugschwandtner, R.W.; Kaul, H.-P. Sowing ratio and N fertilization affect yield and yield components of oat and pea in intercrops. Field Crop. Res. 2014, 155, 159–163. [Google Scholar] [CrossRef]
  30. Naudin, C.; Aveline, A.; Corre-Hellou, G.; Dibet, A.; Jeuffroy, M.-H.; Crozat, Y. Agronomic analysis of the performance of spring and winter cereal-legume intercrops in organic farming. J. Agric. Sci. Technol. 2009, 3, 17–28. [Google Scholar]
  31. Hauggaard-Nielsen, H.; Andersen, M.K.; Jornsgaard, B.; Jensen, E.S. Density and relative frequency effects on competitive interactions and resource use in pea-barley intercrops. Field Crop. Res. 2006, 95, 256–267. [Google Scholar] [CrossRef]
  32. Vályi-Nagy, M.; Rácz, A.; Irmes, K.; Szentpéteri, L.; Tar, M.; Kassai, K.M.; Kristó, I. Evaluation of the Development Process of Winter Wheat (Triticum aestivum L.) and Winter Pea (Pisum sativum L.) in Intercropping by Yield Components. Agronomy 2023, 13, 1323. [Google Scholar] [CrossRef]
  33. Pankou, C.; Lithourgidis, A.; Dordas, C. Use of intercropping for a better resource use efficiency in a Mediterranean climate. Asp. Appl. Biol. 2021, 146, 1–7. [Google Scholar]
  34. Hauggaard-Nielsen, H.; Jensen, E.S. Evaluating pea and barley cultivars for complementarity in intercropping at different levels of soil N availability. Field Crop. Res. 2001, 72, 185–196. [Google Scholar] [CrossRef]
  35. Ghaley, B.B.; Hauggaard-Nielsen, H.; Hogh-Jensen, H.; Jensen, E.S. Intercropping of wheat and pea influenced by nitrogen fertilization. Nutr. Cycl. Agroecosyst. 2009, 73, 201–212. [Google Scholar] [CrossRef]
  36. Baxevanos, D.; Tsialtas, I.; Vlachostergios, D.N.; Hadjigeorgiou, I.; Dordas, C.; Lithourgidis, A. Cultivar competitiveness in pea-oat intercrops under Mediterranean conditions. Field Crop. Res. 2017, 214, 94–103. [Google Scholar] [CrossRef]
  37. Guiducci, M.; Tosti, G.; Falcinelli, B.; Benincasa, P. Sustainable management of nitrogen nutrition in winter wheat through temporary intercropping with legumes. Agron. Sustain. Dev. 2018, 38, 31. [Google Scholar] [CrossRef]
  38. Caballero, R.; Goicoechea, E.L.; Hernaiz, P.J. Forage yields and quality of common vetch and oat sown at varying seeding ratios and seeding rates of vetch. Field Crop. Res. 1995, 41, 135–140. [Google Scholar] [CrossRef]
  39. Nelson, W.C.D.; Siebrecht-Schöll, D.J.; Hoffmann, M.P.; Rötter, R.P.; Whitbread, A.M.; Link, W. What determines a productive winter bean-wheat genotype combination for intercropping in central Germany? Eur. J. Agron. 2021, 128, 126294. [Google Scholar] [CrossRef]
  40. Pankou, C.; Lithourgidis, A.; Menexes, G.; Dordas, C. Importance of Selection of Cultivars in Wheat-Pea Intercropping systems for High Productivity. Agronomy 2022, 12, 2367. [Google Scholar] [CrossRef]
  41. Bedoussac, L.; Justes, E. A comparison of commonly used indices for evaluating species interactions and intercrop efficiency: Application to durum wheat-winter pea intercrops. Field Crop. Res. 2011, 124, 25–36. [Google Scholar] [CrossRef]
  42. Dhima, K.V.; Lithourgidis, A.S.; Vasilakoglou, I.B.; Dordas, C.A. Competition indices of common vetch and cereal intercrops in two seeding ratio. Field Crop. Res. 2007, 100, 249–256. [Google Scholar] [CrossRef]
  43. Agegnehu, G.; Ghizaw, A.; Sinebo, W. Yield potential and land-use efficiency of wheat and faba bean mixed intercropping. Agron. Sustain. Dev. 2008, 28, 257–263. [Google Scholar] [CrossRef]
  44. Dordas, C.A.; Vlachostergios, D.N.; Lithourgidis, A.S. Growth dynamics and agronomic-economic benefits of pea-oat and pea-barley intercrops. Crop Pasture Sci. 2012, 63, 45–52. [Google Scholar] [CrossRef]
  45. Banik, P.; Sasmal, T.; Ghosal, P.K.; Bagchi, D.K. Evaluation of Mustard (Brassica compestris Var. Toria) and Legume Intercropping under 1:1 and 2:1 Row-Replacement Series Systems. J. Agron. Crop Sci. 2000, 185, 9–14. [Google Scholar] [CrossRef]
  46. Banik, P.; Midya, A.; Sarkar, B.K.; Ghose, S.S. Wheat and chickpea intercropping systems in an additive series experiment: Advantages and weed smothering. Eur. J. Agron. 2006, 24, 325–332. [Google Scholar] [CrossRef]
  47. Willey, R.W.; Rao, M.R. A competitive ratio for quantifying competition between intercrops. Exp. Agric. 1980, 16, 117–125. [Google Scholar] [CrossRef]
  48. Vályi-Nagy, M.; Tar, M.; Rácz, A.; Irmes, K.; Kristó, I. Yield stability of winter wheat in intercrop makes better adaptation to climate conditions. Columella J. Agric. Environ. Sci. 2023, 10, 25–35. [Google Scholar] [CrossRef]
  49. Ghosh, P.K. Growth, yield, competition and economics of groundnut/cereal fodder intercropping systems in the semi-arid tropics of India. Field Crop. Res. 2004, 88, 227–237. [Google Scholar] [CrossRef]
  50. Average Procurement Prices of Dried Pulses. Available online: https://www.ksh.hu/stadat_files/ara/hu/ara0015.html (accessed on 18 October 2023).
  51. Average Procurement Prices of Cereals. Available online: https://www.ksh.hu/stadat_files/ara/hu/ara0013.html (accessed on 18 October 2023).
  52. Average Procurement Prices of Main Crop Products. Available online: https://www.ksh.hu/stadat_files/ara/hu/ara0052.html (accessed on 18 October 2023).
  53. Agroinform. Available online: www.agroinform.hu/aprohirdetes/borsó (accessed on 18 October 2023).
  54. IBM Corp. IBM SPSS Statistics for Windows; Version 29.0; IBM Corp: Armonk, NY, USA, 2022. [Google Scholar]
  55. Williams, A.C.; McCarthy, B. A new index of interspecific competition for replacement and additive designs. Ecol. Res. 2001, 16, 29–40. [Google Scholar] [CrossRef]
  56. Duchene, O.; Vian, J.-F.; Celette, F. Intercropping with legume for agroecological cropping systems: Complementarity and facilitation processes and the importance of soil microorganisms. A review. Agric. Ecosyst. Environ. 2017, 240, 148–161. [Google Scholar] [CrossRef]
  57. Ksiezak, J.; Staniak, M.; Stalenga, J. Restoring the Importance of Cereal-Grain Legume Mixtures in Low-Input Farming Systems. Agriculture 2023, 13, 341. [Google Scholar] [CrossRef]
  58. Andersen, M.K.; Hauggaard-Nielsen, H.; Ambus, P.; Jensen, E.S. Biomass production, symbiotic nitrogen fixation and inorganic N use in dual and tri-component annual intercrops. Plant Soil 2004, 266, 273–287. [Google Scholar] [CrossRef]
  59. Syrovy, L.D.; Banniza, S.; Shirtliffe, S.J. Yield and Agronomic advantages of Pea Leaf Type Mixtures under Organic Management. Agron. J. 2015, 107, 113–120. [Google Scholar] [CrossRef]
Figure 1. Precipitation (mm) in the 3 growing seasons compared to the average of the previous 10 years.
Agronomy 14 00786 g001
Figure 2. Temperature (°C) in the 3 growing seasons compared to the average of the previous 10 years.
Agronomy 14 00786 g002
Figure 3. Graphical representation of partial LER of the two companion plants showing all possible outcomes of the interaction experiment. The diagonal line corresponding to LERw = LERp separates the areas in which wheat or peas dominate, while above the diagonal line of LER = 1 means yield advantage. Areas corresponding to partial LER values below 0.5 for wheat and peas indicate that species grain yield is less in the mixture than in sole crop. Conversely, values above 0.5 for wheat and pea show that species grain yield is higher when intercropped (adapted from Bedoussac and Justes [41]).
Agronomy 14 00786 g003
Figure 4. Monetary advantage indices of intercropping in the examined years (commercial value in Euros). Based on the difference between each year, clearly visible profits or deficits can be seen in the intercropped parcels. Capital letters mean varieties; the seeding rates are in parenthesis (SZ = GK Szilárd, C = Cellule, CS = GK Csillag, A = Aviron).
Agronomy 14 00786 g004
Table 1. Different sowing densities in the experiment for winter wheat and peas.
Winter Peas (Number of Seeds m−2)
0 5075100
Winter wheat (number of seeds m−2)0 -0:500:750:100
25050:050:5050:7550:100
37575:075:5075:7575:100
500 100:0100:50100:75100:100
Table 2. The follow-up three-way univariate random block design ANOVA result expressing the effects of factors wheat variety, wheat ratio (Zwi), and pea ratio (Zpi) as well as the year on the competition indices (F values with degrees of freedom 2 and 289).
IndicesFactors
VarietyZwiZpiYear
Land equivalent ratio (LER)2.75 +7.15 ***1.85 ns97.21 ***
Aggressivity (A)17.89 ***118.20 ***7.75 ***7.19 ***
Competitive ratio (CR)15.40 ***1.00 ns19.82 ***8.72 ***
Actual yield loss (AYL)2.76 +8.92 ***2.05 ns111.32 ***
Monetary advantage index (MAI)4.45 +6.46 **2.98 ns107.96 ***
Intercropping advantage (IA)4.08 +13.30 ***1.39 ns878.13 ***
significant at + p < 0.1, ** p < 0.01, *** p < 0.001, ns: not significant.
Table 3. Mean and standard deviation of land equivalent ratio (LER) values in 2021 for mixed cropping of wheat varieties GK Szilárd (SZ), Cellule (C), and GK Csillag (CS), as well as pea variety Aviron (A), with different seeding ratios (wheat (Zwi)/pea (Zpi).
Pea Ratio (Zpi)
= 50%
Pea Ratio (Zpi)
= 75%
Pea Ratio (Zpi)
= 100%
Wheat/Pea VarietyWheat Ratio (Zwi)Mean ± StDevMean ± StDevMean ± StDev
Cellule/Aviron 501.25 ± 0.03 AB1.23 ± 0.191.35 ± 0.31
751.38 ± 0.14 B1.07 ± 0.191.14 ± 0.13
1001.14 ± 0.13 A1.15 ± 0.231.29 ± 0.43
GK Csillag/Aviron501.31 ± 0.251.29 ± 0.381.30 ± 0.35
751.31 ± 0.451.29 ± 0.381.30 ± 0.36
1001.38 ± 0.351.42 ± 0.201.34 ± 0.40
GK Szilárd/Aviron501.35 ± 0.151.27 ± 0.091.37 ± 0.09
751.14 ± 0.141.16 ± 0.121.23 ± 0.11
1001.25 ± 0.121.22 ± 0.101.23 ± 0.08
Significantly different groups are indicated by different upper-case letters in cells directly below each other when testing the effect of wheat ratio (Zwi) within fixed wheat variety and under fixed pea ratio (Zpi) (Tukey’s p < 0.05). The effects of wheat variety and Zpi were not found to be significant in 2021 (p > 0.05).
Table 4. Mean and standard deviation of land equivalent ratio (LER) values in 2022 for mixed cropping of wheat varieties GK Szilárd (SZ), Cellule (C), and GK Csillag (CS), as well as pea variety Aviron (A), with different seeding ratios (wheat (Zwi)/pea (Zpi)).
Pea Ratio (Zpi)
= 50%
Pea Ratio (Zpi)
= 75%
Pea Ratio (Zpi)
= 100%
Wheat/Pea VarietyWheat Ratio (Zwi)Mean ± StDevMean ± StDevMean ± StDev
Cellule/Aviron 501.18 ± 0.231.51 ± 0.32 b1.48 ± 0.48
751.59 ± 0.541.43 ± 0.25 b1.25 ± 0.29
1001.40 ± 0.461.23 ± 0.181.22 ± 0.19
GK Csillag/Aviron501.23 ± 0.181.09 ± 0.12 a1.04 ± 0.11
751.15 ± 0.131.11 ± 0.05 a1.06 ± 0.13
1001.05 ± 0.131.07 ± 0.081.04 ± 0.07
GK Szilárd/Aviron501.42 ± 0.111.28 ± 0.17 ab1.32 ± 0.17
751.22 ± 0.061.17 ± 0.01 ab1.15 ± 0.08
1001.31 ± 0.361.15 ± 0.261.20 ± 0.24
Significantly different groups are indicated by different lower-case letters in cells within a column with consistent shades of gray backgrounds when testing the effect of wheat variety under fixed wheat ratio (Zwi) and pea ratio (Zpi) (Tukey’s p < 0.05). The effects of Zwi and Zpi were not found to be significant in 2022 (p > 0.05).
Table 5. Mean and standard deviation of land equivalent ratio (LER) values in 2023 for mixed cropping of wheat varieties GK Szilárd (SZ), Cellule (C), and GK Csillag (CS), as well as pea variety Aviron (A), with different seeding ratios (wheat (Zwi)/pea (Zpi)). None of the effects of wheat variety, Zwi, or Zpi were found to be significant in 2023 (p > 0.05).
Pea Ratio (Zpi)
= 50%
Pea Ratio (Zpi)
= 75%
Pea Ratio (Zpi)
= 100%
Wheat/Pea VarietyWheat Ratio (Zwi)Mean ± StDevMean ± StDevMean ± StDev
Cellule/Aviron500.99 ± 0.061.01 ± 0.091.01 ± 0.09
750.94 ± 0.140.96 ± 0.130.93 ± 0.08
1000.99 ± 0.170.89 ± 0.090.91 ± 0.05
GK Csillag/Aviron501.10 ± 0.131.05 ± 0.110.93 ± 0.10
750.91 ± 0.130.88 ± 0.100.86 ± 0.13
1000.91 ± 0.100.90 ± 0.070.93 ± 0.07
GK Szilárd/Aviron501.02 ± 0.120.99 ± 0.120.99 ± 0.06
750.96 ± 0.210.84 ± 0.170.92 ± 0.19
1000.93 ± 0.060.87 ± 0.080.85 ± 0.11
Disclaimer/Publisher’s Note: The statements, opinions and data contained in all publications are solely those of the individual author(s) and contributor(s) and not of MDPI and/or the editor(s). MDPI and/or the editor(s) disclaim responsibility for any injury to people or property resulting from any ideas, methods, instructions or products referred to in the content.

