Article

Productive, Environmental and Economic Effects of Organic and Conventional Farms—Case Study from Poland

by
Beata Feledyn-Szewczyk
* and
Jerzy Kopiński
Department of Systems and Economics of Crop Production, Institute of Soil Science and Plant Cultivation—State Research Institute, Czartoryskich 8 Str., 24-100 Pulawy, Poland
*
Author to whom correspondence should be addressed.
Agronomy 2024, 14(4), 793; https://doi.org/10.3390/agronomy14040793
Submission received: 14 March 2024 / Revised: 6 April 2024 / Accepted: 9 April 2024 / Published: 11 April 2024
(This article belongs to the Section Farming Sustainability)

Abstract

:
Due to the changes in the agricultural sector, there is a demand among policymakers, administration, advisors and farmers for comparisons of the economic efficiency of organic versus conventional farms and their environmental impact. The authors of the paper hypothesised that in some conditions, organic farms can reach similar productive and economic results as conventional farms and, at the same time, achieve better environmental effects. The aim of the research was to compare the production, environmental and economic effects of selected organic and conventional farms from eastern Poland (mixed, crop production, animal production). The basis for the comparative analysis was the data from 12 farms obtained using the questionnaire method (direct interview) from the years 2020 to 2021. The yields of cereals in the tested organic farms were about one-third lower than the average obtained on conventional farms. Total organic crop production in cereal units per ha was 43% of conventional production. Balances of NPK indicated surpluses or deficiency, which suggested that in both systems nutrient management should be improved and optimised. The compared groups of organic farms generally had higher economic efficiency—both with and without subsidies—than conventional farms, despite the fact that the latter obtained significantly higher incomes. Gross farm income on conventional farms was higher than on organic farms by 28%, but conventional farms had higher direct costs by 332% than organic ones. As a result, the economic efficiency of agricultural production of organic farms was higher by 59% than conventional farms. The lower level of inputs incurred on organic farms was the main factor determining their high economic efficiency. Organic farms pursuing an intensive model of agricultural production (milk production), but also with specialisation in crop production, proved to be the most economically efficient. Despite diversified production, reducing the income risk, the mixed production, both organic and conventional, in the studied set of farms turned out to be the least profitable, indicating the need to support it. It is suggested that moderate specialisation increases the efficiency of management in organic farming.

1. Introduction

Agriculture in Poland is subject to constant change, increasingly driven by external conditions. A significant factor is Poland’s functioning in the structures of the European Union, which influences agriculture through the Common Agricultural Policy [1]. The level of observed changes is visible, among others, in the structure of land use, in the structure of plant sowing, and in the livestock. The changes also concern the level of production intensity and its organisation. The basis for distinguishing agricultural production systems is the degree of dependence of agriculture on industrial means of production, mainly mineral fertilisers and pesticides, and its impact on the environment. An agricultural system is most often defined as a way of managing agricultural space in terms of plant and animal production and their processing, valued by ecological and economic criteria [2,3]. In modern agriculture, three farming systems are most often distinguished: conventional, organic and integrated. On the other hand, the direction of production results from the degree of specialisation of farm production, defined according to the share of individual activities (branches) in final production [4]. In recent years, a progressive specialisation of production has been observed in organic farming. More and more farms of this type, in order to improve their income situation, decide to focus production strictly, as a rule, towards a selected branch of plant production [5].
The current and future development of organic farming is closely linked to its cost-effectiveness and competitiveness against other farming systems. Currently, EU agriculture, including Poland, is influenced by new strategies, such as the European Green Deal, the Farm-to-Fork Strategy and the European Biodiversity Strategy, which oblige countries to reduce the use of synthetic fertilisers (by 20%) and pesticides (by 50%) and to significantly increase the organic area (up to 25% of agricultural land) by 2030. In Poland, the share of organic farming in agricultural areas in 2020 was 3.5% (with an EU average of 8.5%), while organic farms accounted for only 1.4% of all farms in Poland [6,7]. In implementing the new Poland Strategic Plan 2023–2027, Polish agriculture is expected to implement various types of interventions affecting the development of environmentally friendly and economically viable agriculture, which could be organic farming [8,9].
According to Zieliński et al. [10], organic farming is an important part of the agricultural sector in Europe, which is of multifunctional significance. This is the basic form of sustainable agriculture. In addition to providing production volume and economic benefits to the farmer, it also provides benefits for society and the natural environment. Organic agriculture is a farming system that activates natural production mechanisms through the use of natural inputs that are not technologically processed. A key issue in the debate on the contribution of organic agriculture to the future of world agriculture is whether organic agriculture can produce sufficient food to feed the world. Organic agriculture is also criticised for lower yields and higher risk of production decrease and fluctuations [11]. By contrast, conventional agriculture is typically highly productive, but the environmental costs to achieve such productivity are high due to the abundant use of resources and the release of pollutants per unit of area [12,13].
Numerous reports have compared the performance of organic and conventional agriculture in terms of yield and environmental effects [14,15,16,17], but there is a smaller number of study the economic aspects. There is a demand among policymakers, administration, advisors and farmers for research results on comparisons of the profitability of organic versus conventional agricultural production and their environmental impact, as well as on the local scale. The conclusions can be useful in adjusting policy and support tools for farmers and creating the future direction of agriculture development. To meet this need, we undertook a study on the comparison of organic and conventional systems on the example of selected individual farms in central and eastern Poland (case study). The hypothesis of the research was that in some conditions, organic farms can reach similar productive and economic results as conventional farms and, at the same time, achieve environmental protection goals to a greater extent. The aim of the research and analysis carried out was to compare the production, environmental and economic effects of selected individual organic and conventional farms from eastern Poland.

2. Materials and Methods

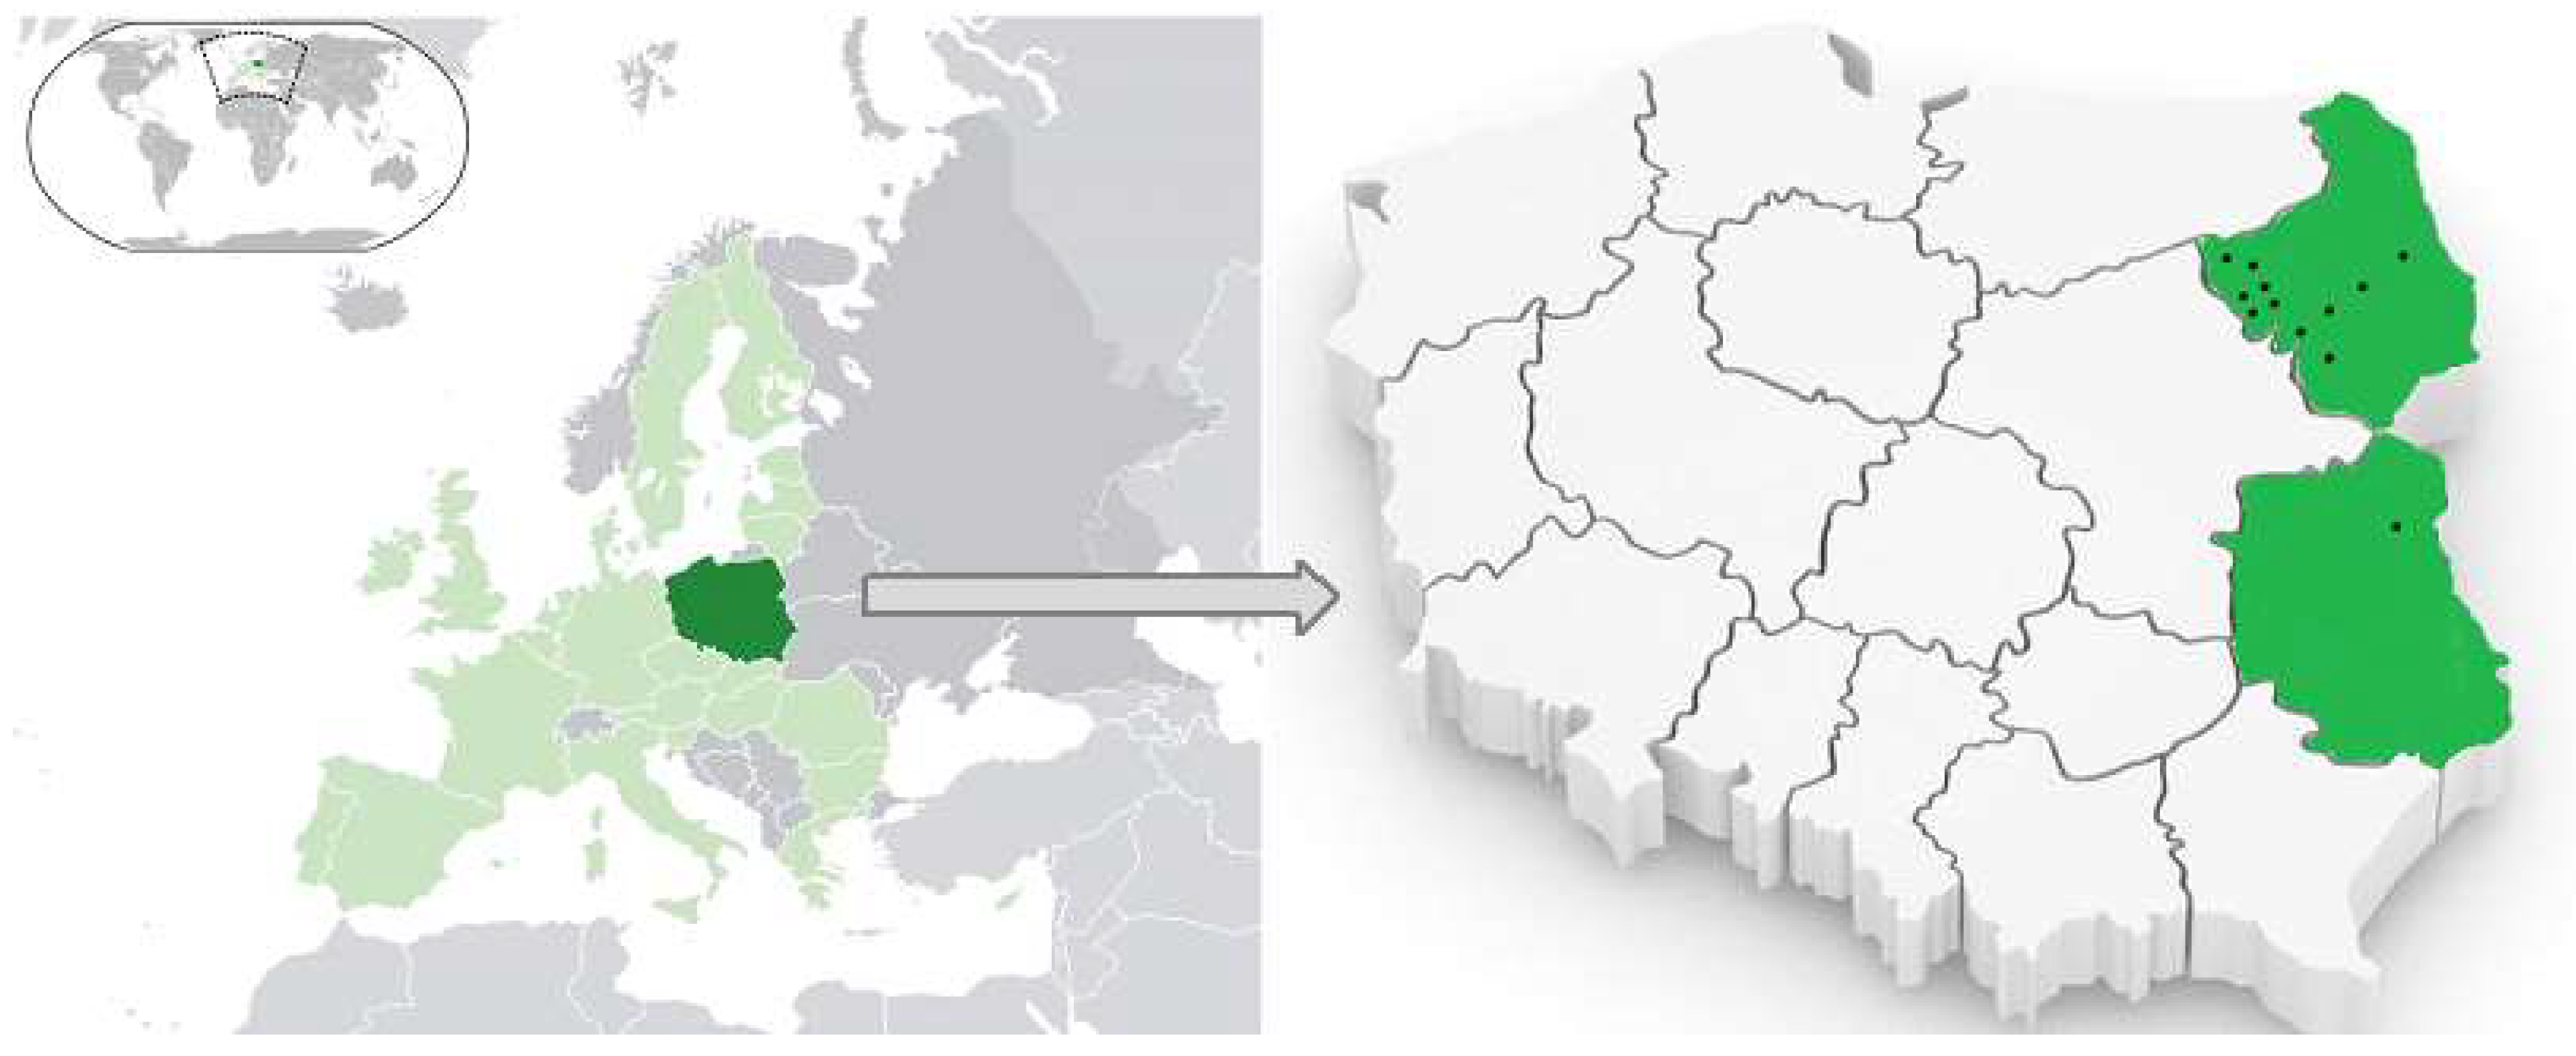
2.1. Farms Characteristics

The research was conducted in the eastern Poland (Podlaskie and Lubelskie voivodeships) (Figure 1). There is a region with good conditions for organic agriculture development, but dominated with conventional farm, especially with milk production. The basis for the comparative analysis was the data of 12 farms, obtained using the questionnaire method (direct interview), from the years 2020 to 2021.
Six organic and conventional farms cooperated with the Institute of Soil Science and Plant Cultivation-State Research Institute, which agreed to participate in the project, and each was selected for the study. There were two farms in each group representing the following production directions: (1) without main specialisation (mixed production), (2) those with cattle, and (3) specialised in crop production (non-inventory). The criterion for the division of farms was the percentage share of the branch in gross final production. In farms oriented to plant or animal production, the dominant branch had at least a 60% share in the total gross final production. In mixed farms, the share of a particular branch ranged from 40 to 60%.

2.2. Productive and Economic Indicators

On the basis of the data obtained, the indicators proposed by Madej and Harasim [18], characterising the production and economic conditions of the farms studied, were calculated. In order to compare total production in different types of farms, cereal units were used, which is a measure that allows for a reduction in the value of plant and animal products to a common denominator. It is assumed that one cereal unit corresponds to 100 kg of wheat grain. The value for individual agricultural products is obtained by multiplying their weight by appropriate coefficients. The following parameters were included in the economic account: revenue from sales (production value), sales structure, direct costs and indirect cost elements, labour inputs and subsidies, including subsidies in organic farming. On this basis, the different economic indicators were calculated [19]: (1) Gross farm income (P) in PLN·ha−1 UAA (Utilized Agricultural Area); (2) Commodity production (T) in PLN·ha−1 UAA; (3) Gross final production (Pkb) in PLN ha−1 UAA; (3a) including the value of subsidies (dp) in PLN·ha−1 UAA; (4) Direct costs (K) in PLN·ha−1 UAA Direct costs included the cost of seed material, manure and fertilisers, seed dressing and plant protection products used; (5) Material and monetary inputs (N) in PLN·ha−1 UAA; (6) Direct surplus (Pkb − K) in PLN·ha−1 UAA; (7) Gross farm income (Drb = P − N) in PLN·ha−1 UAA; (8) Total economic efficiency of agricultural production (Eef = P/N); (8a) Economic efficiency of agricultural production without subsidies (Eef = (P − dp)/N); (9) Share of subsidies in farm income (db/Drb ∗ 100) in %.
In order to compare the labour in tested farms, two indicators were used: AWU (Annual Work Unit, 2120 h of work per year) and FWU (Family Work Unit) [19].

2.3. Environmental Indicators

Due to the importance of organic farming, the research was extended to include selected environmental indicators: sowing structure, share of cereals, catch crops and degree of winter vegetation cover (%), soil organic matter balance and NPK balance. Basic agri-environmental indicators were adopted: (1) balance of fertiliser components (NPK); (2) soil organic matter balance (t dry matter∙ha−1 of arable lands); (3) index of soil cover by vegetation in winter (%). Mineral balances, as a recognised method of OECD for assessing their losses and fluxes in the environment, are one of the basic elements (agro-indicators) for determining the potential risks from agricultural production at the country and farm levels [20]. The soil organic matter balance was developed [21] using its degradation and reproduction coefficients proposed by Eich and Kundler and adapted by Fotyma and Mercik [22]. The primary source of information on the farms analysed was the questionnaire entries made by the farm owners under the supervision of the authors of the paper. All doubts and ambiguities were verified and clarified. In order to ensure comparability of results, a uniform method of analysis and identical evaluation criteria were applied to the surveyed farms, regardless of their production system.

2.4. Statistical Analysis

Differences between organic and conventional farms were assessed using the non-parametric Mann–Whitney U test because data do not meet the criteria of parametric analysis of variance ANOVA. Analysis was performed using the STATISTICA program ver. 13.1 (StatSoft, Inc., Tulsa, OK, USA).

3. Results

General data describing the production potential of the compared groups of organic and conventional farms, specialising in different production directions, were presented in Table 1. In addition to the different structures of agricultural production, they were also characterised by a different level of farming intensity. The analysed organic farms from eastern Poland were smaller compared to the group of studied conventional farms. The average area of arable land in organic farms was 18.8 ha of arable land, while in conventional farms, it was 53% larger (28.9 ha) (Table 1).
Conventional cattle farms were the largest in terms of area, followed by farms specialising in crop production (Table 1). However, the economic potential of individual farms, expressed in ESU (European Size Unit, 1 ESU = 1200€), did not depend directly on the area of farms, as the structure and efficiency of production also had a significant impact on its strength. Conventional dairy farms had the highest economic size class. This size was about three times higher than in the other conventional farm groups and several times higher than in the organic farm groups. The share of permanent grasslands in the land use structure for most of the farms surveyed was an important factor in determining the direction of production, although it was also quite significant on organic farms with only crop production (Table 1). The level of employment in agricultural activities is an important differentiating characteristic of farms. Living labour on organic farms was higher than on the compared groups of conventional farms, especially in dairy farms (Table 1). Some farms used hired labour.
Conventional farms were generally distinguished by their better use of land resources, as reflected in their productivity in grain units. This was largely due to their higher production intensity, expressed in terms of the level of mineral fertiliser use (Table 1). However, it should be noted that the average mineral fertiliser application rates for the conventional farms surveyed were two to three times higher than the national average of 135 kg NPK·ha−1 UAA in 2019/2020 [23]. Only a few organic farms used the natural mineral (potassium) fertilisers authorised in this system.
In most of the studied farm groups (except for conventional farms with one-sided crop production), the whole organisation of crop production was directly subordinated to the needs of animal production, taking into account their directional specialisation. The structure of crops in the studied organic farms differed from the average for conventional farms (Table 2). The organic character of the farms was revealed by a higher share of crops that were less technologically intensive (low-input), e.g., rye, and more organisationally intensive (labour-intensive), e.g., potato, seed legumes and vegetables. Mixed organic farms were characterised by the highest share of cereals in the sowing structure (83%). On specialised farms, both organic and conventional, with cattle, the share of cereals was 41–43%, and a significant share of the sown area was accounted for by field fodder crops, constituting the main fodder base. Conventional multidirectional farms were also distinguished by a large share of field fodder crops. In most farm groups, apart from organic farms with cattle, potato cultivation was of marginal importance (about 1%), which was grown for self-supply. A characteristic feature of the surveyed farms was the absence of sugar beet (except for one farm) and oilseed crops in the sowings, with the exception of farms with conventional seed mustard production. In addition, a higher share of vegetable crops was recorded in the compared group of organic farms with exclusive crop production. This is typical for organic farming, as farmers can more easily obtain price premiums for these crops as direct consumption products. A similarly high share, 30%, of seed legumes in the sowing structure was recorded in the group of organic farms with cattle.
On average, in 2020–2021, the crop productivity of all the farms studied was 46.5 cereal units per ha. In the groups compared, it was more than two times higher on conventional farms than on organic farms (Table 3). The greatest differences occurred between the groups of farms with only crop production. The yields of most cereal species on the evaluated organic farms were about one-third lower than the average obtained on conventional farms. Total organic crop production in cereal units per ha was 43% of conventional production.
The stocking density and structure of the studied farm groups reflected their production orientation (Table 4). The highest concentration of animal density was achieved by farms specialising in livestock production (cattle). Organic and conventional farms with multidirectional production were also quite high in stocking density. The most diverse livestock structure was in organic farms with mixed production. The variation in production rates per ha was derived from the stocking density and their unit yields (Table 4). The milk yield of cows on conventional specialised farms averaged 8382 L·unit−1 per year and was about two-thirds higher than in organic farms that produced milk. In contrast, there were no major differences in terms of unit livestock production per hectare of agricultural area.
The main agri-environmental indicators identifying possible threats to the environment from farms differing in production systems and production specialisation are presented in Figure 2A–C. The balance of nutrients (NPK) of the groups of farms according to production systems and directions varied. Significant excesses of three macroelements (N, P, K) were exhibited by conventional mixed farms without specialisation (Figure 2A) and farms specialising in cattle production (Figure 2B), indicating their potentially negative environmental impact from their production. Conventional farms without livestock (Figure 2C) also had similarly high nitrogen balance surpluses. Negative phosphorus and potassium balances were found in all groups of organic farms, and additionally nitrogen deficiency was found in organic farms with crop production (Figure 2A–C). The presented indicators show that the implementation of optimal nutrient management on many farms, regardless of the production system, still leaves much to be desired. All farm groups, except the organic farms specialising in crop production, had a positive organic matter balance (Figure 2A–C). The evaluation of the analysed farm groups, in terms of the index of soil cover with vegetation in winter, varied. The share of these plants in the arable land area was higher than 32%, and it was highest in the group of conventional farms with crop production, but this indicator should be tested on the biggest group of farms.
The production results, which were a derivative of the obtained yields and animal performance, as well as the amount of agricultural production inputs incurred, determined the economic performance of the analysed farm groups (Table 5). The compared groups of organic farms generally had higher economic efficiency—both with and without subsidies—than conventional farms, despite the fact that the latter obtained significantly higher incomes. The lower level of inputs incurred on organic farms was the main factor determining their high economic efficiency. Direct costs were four times lower in organic farms (1019 PLN·ha−1) compared to conventional farms (4399 PLN·ha−1) (Table 5).
Gross final production per hectare on all groups of conventional farms was higher than on organic farms, and the differences were greatest between the compared groups of multidirectional organic and conventional farms (Table 5). However, conventional farms had nearly two times higher material and monetary inputs for production than similar groups of organic farms. These affected the resultant economic evaluation categories, i.e., direct surplus and farm income. A different assessment was applied to the groups of farms that were compared with crop production. It should also be emphasised that the value of the subsidies only partly determine the amount of agricultural income obtained from the farm. They were of the least importance in relation to the obtained income in farms with animal production. The most profitable, in relation to the area of 1 ha of UAA, turned out to be the farms rearing cattle, regardless of the farming system. Farms with multidirectional production had the relatively lowest income. Despite diversified production, reducing the income risk, mixed direction of production, both organic and conventional, in the studied set of farms turned out to be the least profitable, indicating the need to support it.

4. Discussion

Organic farming, as a system aimed at producing food with minimal harm to ecosystems, animals or humans, is often proposed as an alternative to conventional farming [24]. However, critics argued that organic agriculture may have lower yields and, therefore, we would need more land to produce the same amount of food as conventional farms, resulting in more widespread deforestation and biodiversity loss [24]. Comparisons of organic and conventional yields play a central role in this debate [15]. In the presented study, the yields of most cereal species on organic farms were about one-third lower than those obtained on conventional farms. Total organic crop production in cereal units was 43% of conventional production. Many authors confirmed that organic agriculture may have lower yields than conventional farming, and the yield difference ranges most often from 5% to 34% [16,24,25]. Yield data collected from 105 studies that compared organic and conventional farming showed that the yield of organic farming was 18.4% lower than that of conventional farming, regardless of climate conditions and crop type [26]. Klima and Łabza [27] found that the yielding of oats and their mixtures with other cereals cultivated in the organic system was 12% lower compared to the conventional farming system. Sometimes, under certain conditions with good management practices, particular crop types in organic systems can nearly match conventional yields [16]. According to Ponti et al. [15], the yield gap between organic and conventional systems relates, in particular, to the role of legumes in the rotation and the farming system and to the availability of (organic) manure at the farm and regional levels. In order to establish organic agriculture as an important tool in sustainable food production, the factors limiting organic yields need to be more fully understood, alongside assessments of the many social, environmental and economic benefits of organic farming systems [24].
The results confirmed that the organic system was more labour-intensive than the conventional system, as the labour input has to compensate for the lower level of industrial inputs used [3]. In mixed farms and crop production farms the difference was not high (4–21%), while in dairy farms it reached 372%. Pimentel et al. [28] study showed that the labour inputs were higher by 15% in the organic agriculture than in the conventional agriculture.
According to Fotyma [29], balanced plant fertilisation, combining the use of mineral fertilisers, natural fertilisers, and biological nitrogen fixation, provides the greatest production effects and minimises environmental risks. In a study by Rembiałkowska et al. [30] conducted in Poland, Mazowieckie Voivodeship, organic and mineral fertilisation was used by 98% of the conventional and 94% of the organic farms surveyed (mineral fertilisers approved for use in this system). According to Krause and Machek [31], a lower input of fertilisers, pesticides and energy is one of the main positive effects of organic farming compared to conventional farming. Mader et al. [32] found that the input of fertilisers in organic farms was 34–53% smaller than in conventional systems. It was also shown that the soil organic matter was consistently greater in organic farming [28]. Organic farming, generally on a per-area basis, has low environmental impacts, but the benefits of organic farming are reduced when using product unit comparison [17]. Moreover, high levels of variation exist within both organic and conventional systems. A study by Durham and Mizik [25] confirmed that organic farming provided significant local environmental benefits. The main source of environmental benefits is reduced pesticide use, which implies a decreased need for fuel and labour. However, according to Toumisto et al. [17], modelling studies tend to overestimate the benefits of organic farming. The relative impacts of the systems vary between different product groups.
Organic farms, pursuing an intensive model of agricultural production (milk production) but also with specialisation in crop production, proved to be the most economically efficient. In contrast, conventional farms with mixed production were the least efficient. Similarly, Klima and Łabza [27] found that the direct costs of cultivation in an organic system were almost five times lower when the use of artificial fertilisers and pesticides was abandoned. Despite the lower production value gained from the organic system, the personal income obtained from this farming system was, on average, four times higher than the personal income from the conventional farming system. Crowder and Reganold [33] stated that organic farms have higher labour costs, but their total costs are not significantly higher. A meta-analysis by Durham and Mizik [25] confirmed that economically, organic generally outperformed conventional systems due to their lower production costs and higher market price. However, organic farms reached lower yields, especially in the fruit, vegetable, and animal husbandry sectors. A study by Krause and Machek [31] indicated that organic agricultural farms outperform conventional farms in terms of profitability, but their asset turnover is considerably lower. On the other hand, they did not find any statistically significant differences in terms of income and profit margin volatility and liquidity. According to Nieberg and Offer [34], profits of comparable organic and conventional farms are very similar, but the economic outcomes differ in countries and in different types of farms. These authors argued that it was easier for organic farms to achieve higher prices for crop production than for livestock production.
The economic and organisational analysis carried out indicated that also in organic farming, moderate specialisation increases the efficiency of management because the farms with mixed (multidirectional) production obtained significantly worse economic results per ha UAA. On the other hand, conventional farms specialising in commodity milk production, as well as farms without livestock production, were distinguished by the best labour productivity and realisation of economic objectives. Unfortunately, excessive specialisation and concentration of production will not lead to an improvement in the environment (biodiversity). Organic farms are more effective than conventional farms in the protection of soil, environment and biodiversity and in the provision of high-quality food [28,35].
Comparisons of different indicators characterising tested organic and conventional farms were summarised in Table 6. It should be stated that organic farms performed worse according to productive indicators. Although gross farm income on conventional farms was 28% higher than on organic farms, conventional farms had higher direct costs by 332% than organic ones. There was no difference in the value of direct surplus between both groups of farms. As a result, the total economic efficiency of organic farms’ agricultural production was higher by 59% than that of conventional farms (Table 6). On the other hand, conventional farms exceed the nitrogen and potassium balances in soil and potentially may harm the environment. Activities aimed to improve the balance of elements should be taken. It should be mentioned that a small number of farms were tested in selected regions of Poland, and thus, the research should be treated as a case study.
Despite the awareness of the many advantages of organic food and the social and environmental function it fulfils, some people criticise organic farming in Poland, paying attention to the strong dependence on public support, up to 76% of the share of subsidies in the net value added of Polish organic farms, which indicates that these farms would not be able to stay on the market without subsidies [6,36]. Dependence on external support may lead to abuse in the form of obtaining subsidies at the expense of market activities. Such motivation would be evidenced by a visible upward trend in undertaking organic agricultural production in Poland in the first years after accession to the EU and then a decline resulting from disappointment with the difficulties of organic farming [36]. Since 2014, Poland has seen a decrease in the area intended for organic production as well as a drop in the number of organic farms [6,7]. This is the opposite trend to what was expected and supported by the Common Agricultural Policy. According to Miecznikowska-Jerzak [6], the difficulties in the development of organic farming in Poland are a consequence of the socio-economic condition, the state of agriculture in Poland and barriers for consumers, which may include their low purchasing power, high prices of organic food, the perception of organic food as luxury goods (the average price of organic products exceeds the acceptable price for most consumers the threshold of the price difference between organic and conventional food), consumers’ habits to conventional food or low availability of organic food. The following are perceived as opportunities stimulating the development of organic agriculture in Poland: subsidies, promotion of Polish organic food on the EU market and outside the EU, development of agritourism on organic farms, identification of organic food with health and safety and fashion for a healthy lifestyle [6,37]. To improve the efficiency of organic production and increase the number of organic products on the market, the education of farmers, efficient operating advisory centres, the use of knowledge and innovation on organic farms, and the development of groups of organic producers are of key importance. Better food distribution and greater availability create an opportunity for a stronger negotiating position of organic producers with discount chains and stores, and thus, a reduction in organic food prices for consumers [6]. Trends observed in individual countries in the development of organic agriculture indicated that this market segment has different economic importance, which may result from local and national conditions, including policy, market, social and production [10]. Despite the difficulties impeding the development of organic farming in Poland and other countries, financial tools intended for that production system under the EU Common Agricultural Policy and a new perspective of the Strategic Plan for 2023–2027 open more opportunities than before for the expansion of organic agriculture and market.

5. Conclusions

Although this study had its limitations (small number of farms tested and two-year study) and thus should be treated as a case study from eastern Poland, several conclusions about the performance of organic and conventional farms were formulated. Conventional farms generally reached higher production intensity indicators. Yields of cereals on organic farms were about one-third lower than those obtained on conventional farms. Total agricultural production in cereal units per ha UAA in conventional farms was 32% higher than in organic farms. Gross final production was significantly higher in conventional farms in comparison to organic farms (8243 PLN·ha−1 and 12,547 PLN·ha−1 respectively), but direct costs were also significantly higher in conventional farms (1019 PLN·ha−1 vs. 4399 PLN·ha−1). As a result, the total economic efficiency of agricultural production of organic farms was higher by 59% than conventional farms. In the studied set of farms, the most economically efficient were organic farms, which implemented a labour-intensive model of agricultural production intensification (milk production), as well as farms with crop production.
According to the hypothesis of the study, organic farms can achieve similar or even higher economic results than conventional farms. The main factor determining the high economic efficiency of organic farms is the lower level of inputs. Farms that conducted mixed production, both organic and conventional, were the least profitable, indicating the need to develop the political tools to support it. It also suggests that moderate specialisation can increase the efficiency of agricultural production both in organic and conventional farms.
The environmental impact of organic farms was more favourable than that of conventional ones. Balances of N and K in conventional farms indicated surpluses. On the other hand, in organic farms, slight deficiencies of P and K were noted. Moreover, organic farms specialising in crop production had a negative soil organic matter balance. It suggests that in both systems, nutrient and organic matter management should be improved and optimised.
Further research should be directed towards evaluating a wider number of farms over a longer period.

Author Contributions

Conceptualization, B.F.-S.; methodology J.K. and B.F.-S.; formal analysis J.K.; investigation, J.K. and B.F.-S.; data curation, J.K.; writing—original draft preparation, J.K. and B.F.-S.; writing—review and editing, B.F.-S.; visualisation, J.K. and B.F.-S.; supervision, J.K.; project administration, B.F.-S.; funding acquisition, B.F.-S. All authors have read and agreed to the published version of the manuscript.

Funding

This research was funded by a grant from the Polish Ministry of Agriculture and Rural Development No. DEJ.re.027.5.2022/3. Profitability of organic production compared to conventional production, using the example of selected farms.

Data Availability Statement

The data presented in this study are available on request from the corresponding author.

Conflicts of Interest

The authors declare no conflicts of interest.

References

  1. Jończyk, K.; Stalenga, J.; Kopiński, J.; Madej, A. Assessment of possible changes in land use and crop structure and the increase in the area of organic farming in the perspective of 2030, in the context of reducing nutrient losses. Stud. I Rap. IUNG-PIB 2022, 67, 113–127. (In Polish) [Google Scholar] [CrossRef]
  2. Harasim, A. Method for assessing the sustainable development of agriculture at the farm level. Stud. I Rap. IUNG-PIB 2013, 32, 25–75. (In Polish) [Google Scholar] [CrossRef]
  3. Jończyk, K.; Stalenga, J. Possibilities of development of various agricultural production systems in Poland. Stud. I Rap. IUNG-PIB 2010, 22, 87–99. Available online: https://iung.pl/wp-content/uploads/2009/10/zesz22.pdf#page=86 (accessed on 12 March 2024). (In Polish).
  4. Kopiński, J. Directions of development of various plant production systems in Poland. Stud. I Rap. IUNG-PIB 2019, 60, 103–128. (In Polish) [Google Scholar] [CrossRef]
  5. Stalenga, J.; Kopiński, J. Is it possible in specialized organic farms to maintain in soil appropriate content of nutrients and organic matter? J. Res. Appl. Agric. Eng. 2018, 63, 86–91. Available online: https://tech-rol.eu/images/Archiwum_X/2019/05/2018_3_JS.pdf (accessed on 12 March 2024).
  6. Miecznikowska-Jerzak, J. The status and prospects of organic farming in Poland—Assessment of challenges and opportunities for the implemetation of the European Green Deal for agriculture. Yearb. Eur. Integr. 2022, 16, 265–283. [Google Scholar] [CrossRef]
  7. Agricultural and Food Quality Inspection (IJHARS). Report on the State of Organic Farming in Poland in 2021–2022; Agricultural and Food Quality Inspectorates: Warszawa, Poland, 2023; pp. 1–97. Available online: https://www.gov.pl/attachment/452e67d8-88ea-49af-a397-95bc988cd835 (accessed on 12 March 2024).
  8. Regulation (EU) 2021/2115 of the European Parliament and of the Council of 2 December 2021 Establishing Rules on Support for Strategic Plans to be Drawn Up by Member States under the Common Agricultural Policy (CAP Strategic Plans) and Financed by the European Agricultural Guarantee Fund (EAGF) and by the European Agricultural Fund for Rural Development (EAFRD) and Repealing Regulations (EU) No 1305/2013 and (EU) No 1307/2013. Available online: https://eur-lex.europa.eu/legal-content/EN/TXT/HTML/?uri=CELEX:32021R2115 (accessed on 12 March 2024).
  9. Poland’s Cap Strategic Plan. European Comission 2023. Available online: https://agriculture.ec.europa.eu/cap-my-country/cap-strategic-plans/poland_en (accessed on 12 March 2024).
  10. Zieliński, M.; Wrzaszcz, W.; Sobierajewska, J.; Adamski, M. Development and Effects of Organic Farms in Poland, Taking into Account Their Location in Areas Facing Natural or Other Specific Constraints. Agriculture 2024, 14, 297. [Google Scholar] [CrossRef]
  11. Beauchet, S.; Rouault, A.; Thiollet-Scholtus, M.; Renouf, M.; Jourjon, F.; Renaud-Gentié, C. Inter-annual variability in the environmental performance of viticulture technical management routes—A case study in the middle Loire Valley (France). Int. J. Life Cycle Assess. 2019, 24, 253–265. [Google Scholar] [CrossRef]
  12. Eyhorn, F.; Muller, A.; Reganold, J.P.; Frison, E.; Herren, H.R.; Luttikholt, L.; Mueller, A.; Sanders, J.; Scialabba, N.E.H.; Seufert, V.; et al. Sustainability in global agriculture driven by organic farming. Nat. Sustain. 2019, 2, 253–255. [Google Scholar] [CrossRef]
  13. Boschiero, M.; De Laurentiis, V.; Caldeira, C.; Sala, S. Comparison of organic and conventional cropping systems: A systematic review of life cycle assessment studies. Environ. Impact Assess. Rev. 2023, 102, 107187. [Google Scholar] [CrossRef]
  14. Badgley, C.; Moghtader, J.; Quintero, E.; Zakem, E.; Chappell, J.; Avilés-Vazquez, K.; Samulon, A.; Perfecto, I. Organic agriculture and the global food supply. Renew. Agric. Food Syst. 2007, 22, 86–108. [Google Scholar] [CrossRef]
  15. Ponti, T.; Rijk, B.; van Ittersum, M.K. The crop yield gap between organic and conventional agriculture. Agric. Syst. 2012, 108, 1–9. [Google Scholar] [CrossRef]
  16. Seufert, V.; Ramankutty, N.; Foley, J.A. Comparing the yields of organic and conventional agriculture. Nature 2012, 485, 229–232. [Google Scholar] [CrossRef] [PubMed]
  17. Tuomisto, H.L.; Hodge, I.D.; Riordan, P.; Macdonald, D.W. Does organic farming reduce environmental impacts?—A meta-analysis of European research. J. Environ. Manag. 2012, 112, 309–320. [Google Scholar] [CrossRef] [PubMed]
  18. Madej, A.; Harasim, A. Assessment of farm organization in the light of the principles of good agricultural practice. Ann. Pol. Assoc. Agric. Agribussiness Econ. 2005, 7, 166–169. [Google Scholar]
  19. Abramczuk, Ł.; Augustyńska, I.; Bębenista, A.; Żekało, M. Produkcja, Koszty i Dochody z Wybranych Produktów Rolniczych w Latach 2016–2017 (Wyniki Rachunku Symulacyjnego); The Institute of Agricultural and Food Economics—National Research Institute: Warsaw, Poland, 2018; p. 85. (In Polish) [Google Scholar]
  20. Kopiński, J. Gross Nitrogen Balance—Agri-Environmental Indicator of the Impact of Agriculture on the Environment. Description of the Methodology, Discussion of the Balance Sheet Results at the Level NUTS-0, NUTS-2. Monographs and Scientific Dissertations; IUNG-PIB: Puławy, Poland, 2017; Volume 55, p. 116. [Google Scholar]
  21. Kopiński, J.; Kuś, J. Influence of organization changes in agriculture on the management of organic matter in soil. Probl. Inżynierii Rol. 2011, 2, 47–54. [Google Scholar]
  22. Fotyma, M.; Mercik, S. Agricultural Chemistry; PWN: Warsaw, Poland, 1995; p. 356. [Google Scholar]
  23. Statistical Yearbook of Agriculture 2023. Available online: https://stat.gov.pl/en/topics/statistical-yearbooks/statistical-yearbooks/statistical-yearbook-of-agriculture-2023,6,18.html (accessed on 12 March 2024).
  24. Trewavas, A. Urban myths of organic farming. Nature 2001, 410, 409–410. [Google Scholar] [CrossRef]
  25. Durham, T.C.; Mizik, T. Comparative Economics of Conventional, Organic, and Alternative Agricultural Production Systems. Economies 2021, 9, 64. [Google Scholar] [CrossRef]
  26. de la Cruz, V.Y.V.; Cheng, W.; Tawaraya, K. Yield gap between organic and conventional farming systems across climate types and sub-types: A meta-analysis. Agric. Syst. 2023, 211, 103732. [Google Scholar] [CrossRef]
  27. Klima, K.; Łabza, T. Yielding and economic efficiency of oat cultivation in pure and mixed sowing in the organic and conventional systems. Food Sci. Technol. Qual. 2010, 3, 141–147. (In Polish) [Google Scholar]
  28. Pimentel, D.; Hepperly, P.; Hanson, J.; Douds, D.; Seidel, R. Environmental, energetic, and economic comparisons of organic and conventional farming systems. Bioscience 2005, 55, 573–582. [Google Scholar] [CrossRef]
  29. Fotyma, M. Environmental and productive effects of fertilizer use in agriculture. Fragm. Agron. 2006, 2, 185–205. [Google Scholar]
  30. Rembiałkowska, E.; Ciesielska, P.; Owczarek, E.; Hallmann, E. Assessment of the ecological awareness and environmental attitudes among the organic and conventional farmers from the Mazovia Voivodeship. J. Res. Appl. Agric. Eng. 2013, 58, 135–140. [Google Scholar]
  31. Krause, J.; Machek, O. A comparative analysis of organic and conventional farmers in the Czech Republic. Agric. Econ. 2018, 64, 1–8. [Google Scholar] [CrossRef]
  32. Mader, P.; Fliessbach, A.; Dubois, D.; Gunst, L.; Fried, P.; Niggli, U. Soil fertility and biodiversity in organic farming. Science 2002, 296, 1694–1697. [Google Scholar] [CrossRef] [PubMed]
  33. Crowder, D.W.; Reganold, J.P. Financial competitiveness of organic agriculture on a global scale. Proc. Natl. Acad. Sci. USA 2015, 112, 7611–7616. [Google Scholar] [CrossRef] [PubMed]
  34. Nieberg, H.; Offermann, F. The profitability of organic farming in Europe. In Organic Agriculture: Sustainability, Markets and Policies; OECD Workshop on Organic Agriculture, CABI Publishing: Wallingford, UK, 2003; pp. 141–152. Available online: https://edepot.wur.nl/118640 (accessed on 2 April 2024).
  35. Mohamad, R.S.; Verrastro, V.; Cardone, G.; Bteich, M.R.; Favia, M.; Moretti, M.; Roma, R. Optimization of organic and conventional olive agricultural practices from a Life Cycle Assessment and Life Cycle Costing perspectives. J. Clean. Prod. 2014, 70, 78–89. [Google Scholar] [CrossRef]
  36. Sadowski, A.; Wojcieszak-Zbierska, M.; Zmyślona, J. Sytuacja ekonomiczna gospodarstw ekologicznych w Polsce na tle Unii Europejskiej. Probl. Agric. Econ. 2021, 2, 101–118. [Google Scholar] [CrossRef]
  37. Komorowska, D. Perspectives of organic farming development in Poland. Sci. J. Wars. Univ. Life Sci. Probl. Word Agric. 2006, 15, 43–48. Available online: https://sj.wne.sggw.pl/pdf/PRS_2006_T15_n_s43.pdf (accessed on 2 April 2024). (In Polish).
Figure 1. Localisation of tested organic and conventional farms in eastern Poland. Study area was marked in green (Poland location on the left and 2 voivodeships of eastern Poland (Podlaskie and Lubelskie) on the right with tested farms marked with dots).
Agronomy 14 00793 g001
Figure 2. (AC) Agri-environmental indicators of the studied groups of organic and conventional farms (average for 2020–2021).
Agronomy 14 00793 g002aAgronomy 14 00793 g002b
Table 1. Production potential of organic and conventional farms surveyed (average for 2020–2021).
NoSpecificationMixed FarmsCattle FarmsCrop Production FarmsAverage
OrganicConventionalOrganicConventionalOrganicConventionalORGCON
1Number of farms surveyed22222266
2Economic size
in ESU * per farm
16.227.035.5155.848.935.833.5 a ***72.9 b
3UAA area (ha·farm−1)15.414.112.645.428.327.118.8 a28.9 b
4Share of arable land (%)74.568.363.183.661.392.766.3 a81.5 b
5Share of permanent crops(%)0.80.00.09.02.20.11.03.0
6Share of grassland and pasture areas of permanent grassland (%)24.731.736.916.435.27.232.318.4
7Employment
(AWU·100 ha−1 UAA)
13.411.016.04.35.04.811.5 a6.7 b
7aEmployment
(FWU·100 ha−1 UAA)
13.411.015.73.53.54.810.9 a6.4 b
8Agricultural production in cereal units per ha UAA103.595.3123.3150.014.573.180.4 a106.1 a
9Mineral fertiliser consumption
(NPK kg·ha−1 UAA)
0380.10268.63.8372.31.3 a340.3 b
10- Nitrogen fertilisers
(N kg·ha−1 UAA)
0169.6098.00.1205.00.03 a157.5 b
11- Phosphorus fertilisers
(P2O5 kg·ha−1 UAA)
0102.8073.20.166.90.03 a81.0 b
12- Potassium fertilisers
(K2O kg·ha−1 UAA)
0107.8097.43.6100.41.2 a101.9 b
13Degree of specialisation in % **57.359.371.991.777.997.969.0 a83.0 b
* 1 ESU—European Size Unit, which expresses the economic strength of farms, i.e., their profitability, 1 ESU = 1200€; ** defined according to the share of individual activities (branches) in final production; *** different letters mean significant differences between organic and conventional farms parameters according to Mann–Whitney U test. Source: own elaboration.
Table 2. Share of crops (%) cultivated in organic and conventional farm groups surveyed (average for 2020–2021).
NoSpecificationMixed FarmsCattle FarmsCrop Production FarmsAverage
OrganicConventionalOrganicConventionalOrganicConventionalORGCON
1Cereals—total83.155.741.043.443.374.555.8 a *57.9 a
2    rye13.31.37.503.908.2 b0.4 a
3    wheat19.5006.522.124.513.9 a10.3 a
4    barley0004.2023.80.0 a9.3 b
5    oats24.50009.2011.2 b0.0 a
6    triticale13.016.710.13.9026.27.7 a15.6 b
7    cereal mixture12.837.823.415.42.2012.8 a17.7 a
8Potatoe1.60.74.000.201.9 b0.2 a
9Sugar beet000.30000.10
10Oily0000022.20.07.4
11Seed legumes1.2029.702.81.111.2 b0.4 a
12Fodder crops in the field12.843.624.856.301.312.5 a33.7 b
13Vegetables on arable land000.2022.407.50
14Berry plants00000.900.30
15Other crops1.3000.330.40.910.6 b0.4 a
16Intercrops on arable lands06.302.60003.0
* different letters mean significant differences between organic and conventional farm parameters according to the Mann–Whitney U test. Source: own elaboration.
Table 3. Yields [dt·ha−1] of crops of the studied groups of organic and conventional farms (average of 2020–2021).
NoSpecificationMixed FarmsCattle FarmsCrop Production FarmsAverage
OrganicConventionalOrganicConventionalOrganicConventionalORGCON
1Rye25.835.027.5-16.3-2335
2Wheat31.0--77.617.879.62478
3Barley---84.7-49.3-67
4Oats28.2---13.3-21-
5Triticale33.751.334.774.0-83.13469
6Cereal mixture31.540.140.073.316.1-2957
7Potatoes211.8186.0244.5-430.0-295186
8Sugar beet--250.0---250-
9Seed legumes4.0-38.0-7.8-17-
10Oily-----39.1-39
11Field fodder (green fodder)256.9525.8202.9410.6-75.0230337
12Vegetables on arable land--40-1.9-21-
13Berry fruits----2.0-2-
14Hay meadows45.781.973.572.742.588.45481
15Crop production in cereal units * per ha UAA30.148.634.059.014.273.126 a **60 b
* cereal unit corresponds to 100 kg of wheat grain. The value for individual agricultural products is obtained by multiplying their weight by appropriate coefficients; ** different letters mean significant differences between organic and conventional farms parameters according to Mann–Whitney U test. Source: own elaboration.
Table 4. Selected livestock production indicators of the surveyed organic and conventional farm groups (average for 2020–2021).
Lp.SpecificationMixed FarmsCattle FarmsCrop Production FarmsAverage
OrganicConventionalOrganicConventionalOrganicConventionalORGCON
1Livestock stock in LU·100 ha−1 UAA67.8177.6149.9179.80.1-72.6178.7
2Share of cattle in %54.1100.0100.099.9--77.1100.0
3Share of cows in the herd in %21.023.053.655.9--37.339.5
4Share of pigs in %7.3-----7.3-
5Others in %38.6--0.10.1-19.40.1
6Milk yield of cows (L·pcs−1 per year)2815649433218282.1--3068.07388.0
7Milk production (L·ha−1 UAA)217.12655.92667.68317.9--1442.45486.9
8Beef livestock production (kg·ha−1 UAA)114.9379.6170.6268.8--142.8324.2
9Pig livestock production
(kg·ha−1 UAA)
75.5-----75.5-
10Livestock production in cereal units per ha UAA73.546.789.391.00.3-54.4 a *68.9 a
Abbreviation: LU—Large Unit; * different letters mean significant differences between organic and conventional farms parameters according to Mann–Whitney U test. Source: own elaboration.
Table 5. Economic indicators of the studied groups of organic and conventional farms (average for 2020–2021).
NoSpecificationMixed FarmsCattle FarmsCrop Production FarmsAverage
OrganicConventionalOrganicConventionalOrganicConventionalORGCON
1Gross farm income (P) in PLN *·ha−1 UAA564510,21016,05019,6358465870810,053 a **12,851 a
2Commodity production (T)
in PLN·ha−1 UAA
28187533887116,791543168745707 a10,399 b
3Gross final production (Pkb) in PLN·ha−1 UAA5150998014,91119,431466782298243 a12,547 b
3aincluding value of subsidies (dp) in PLN·ha−1 UAA16661844226214302892134922731541
4Direct costs (K) in PLN·ha−1 UAA37538102155744452719421019 a4399 b
5Material and monetary inputs (N) in PLN·ha−1 UAA24615989459110,228228137033111 a6640 b
6Direct surplus (Pkb − K) in PLN·ha−1 UAA4775617012,75511,988644162877990 a8148 a
7Gross farm income (Drb = P − N) in PLN·ha−1 UAA3184422111,4599406618350056942 a6211 a
8Total economic efficiency of agricultural production (Eef = P/N)2.291.703.501.923.712.353.16 b1.99 a
8aEconomic efficiency of agricultural production without subsidies
(Eef = (P − dp)/N)
1.621.403.001.782.441.992.35 b1.72 a
9Share of subsidies in farm income (db/Drb·100) in %.52.343.719.715.246.827.039.6 a28.6 a
10Labour productivity (T/AWU) in thousand PLN/AWU21.068.355.6393.7109.4144.062.0 a203.2 b
* exchange rate PLN/USD 1 PLN = 0.25 USD [28 March 2024]; ** different letters mean significant differences between organic and conventional farms parameters according to the Mann–Whitney U test. Source: own elaboration.
Table 6. Main indicators characterising tested organic and conventional farms from eastern Poland (n = 12).
Main
Indicators
OrganicConventionalOrganic/
Conventional
× 100%
Organic-Conventional/
Conventional × 100%
or Conventional-Organic/
Organic × 100%
Productive indicators
Economic size
in ESU per farm
33.5 a *72.9 b49%conventional farms perform better than organic by 117%
Agricultural production in cereal units per ha UAA80.4 a106.1 a76%conventional higher than organic by 32%
Mineral fertiliser consumption
(NPK kg·ha−1 UAA)
1.3 a340.3 b0.4%conventional bigger than organic by 26,100%
Employment
(AWU·100 ha−1 UAA)
11.5 a6.7 b172%organic higher than conventional by 72%
Environmental indicators
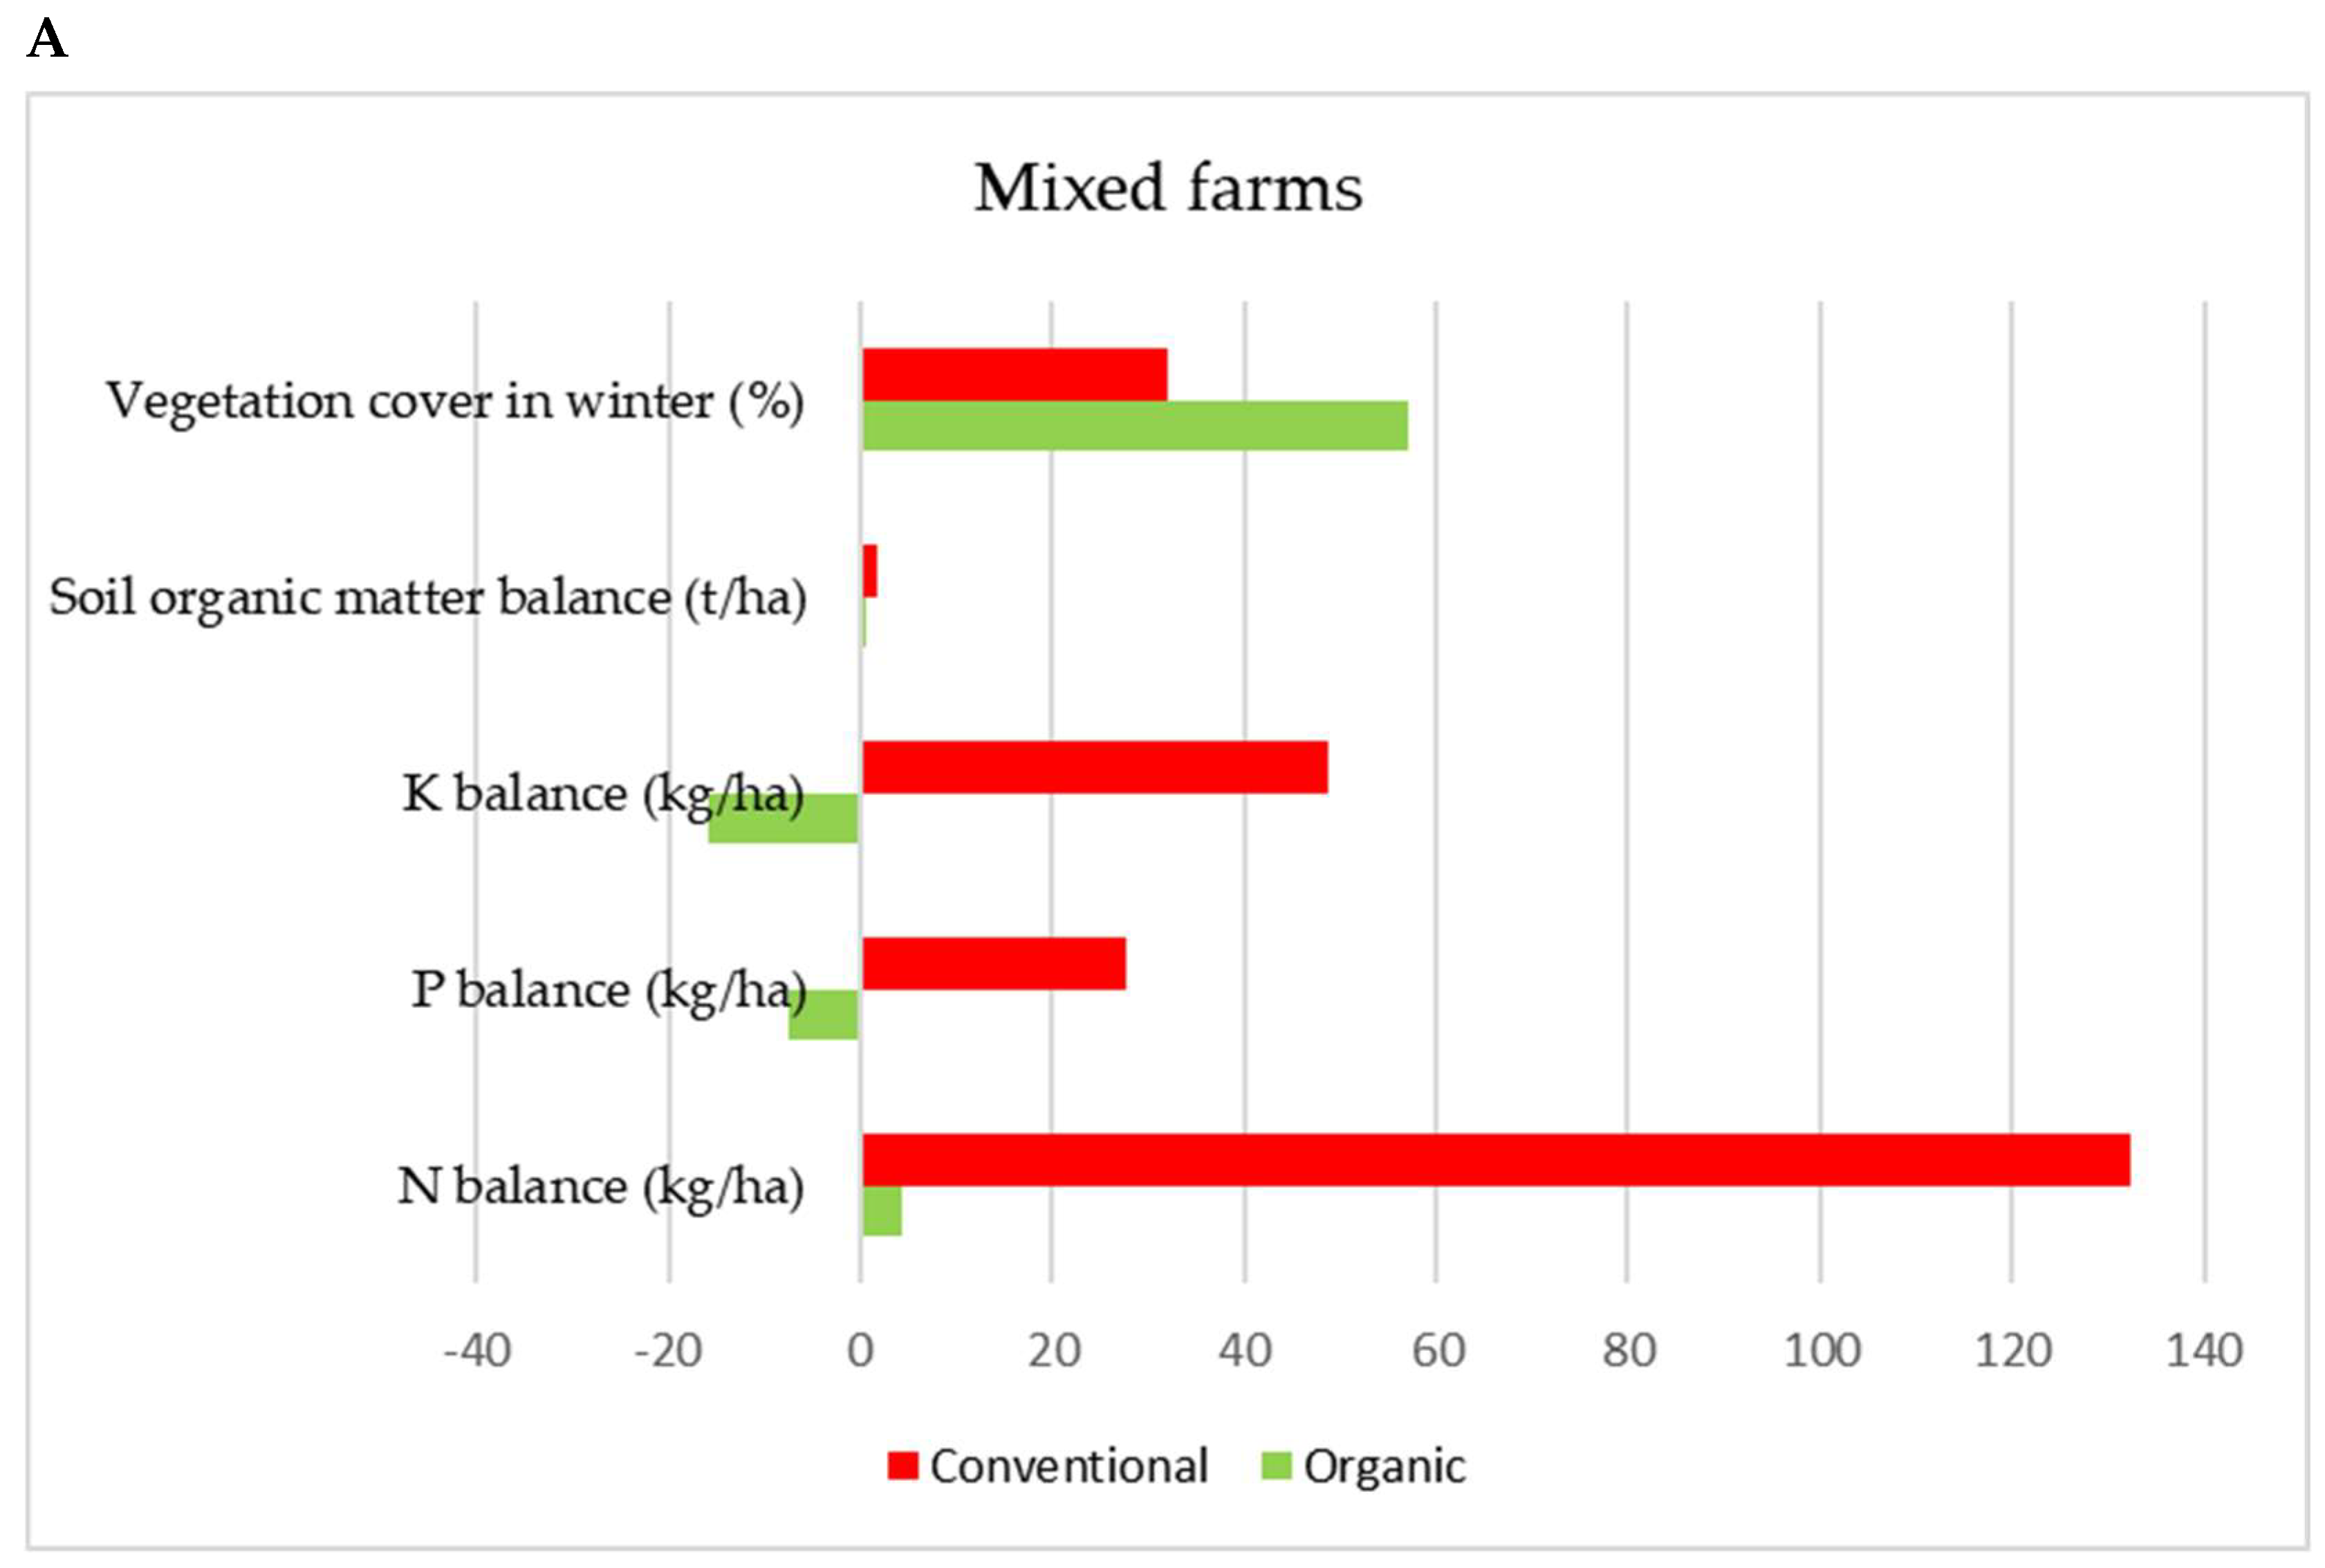
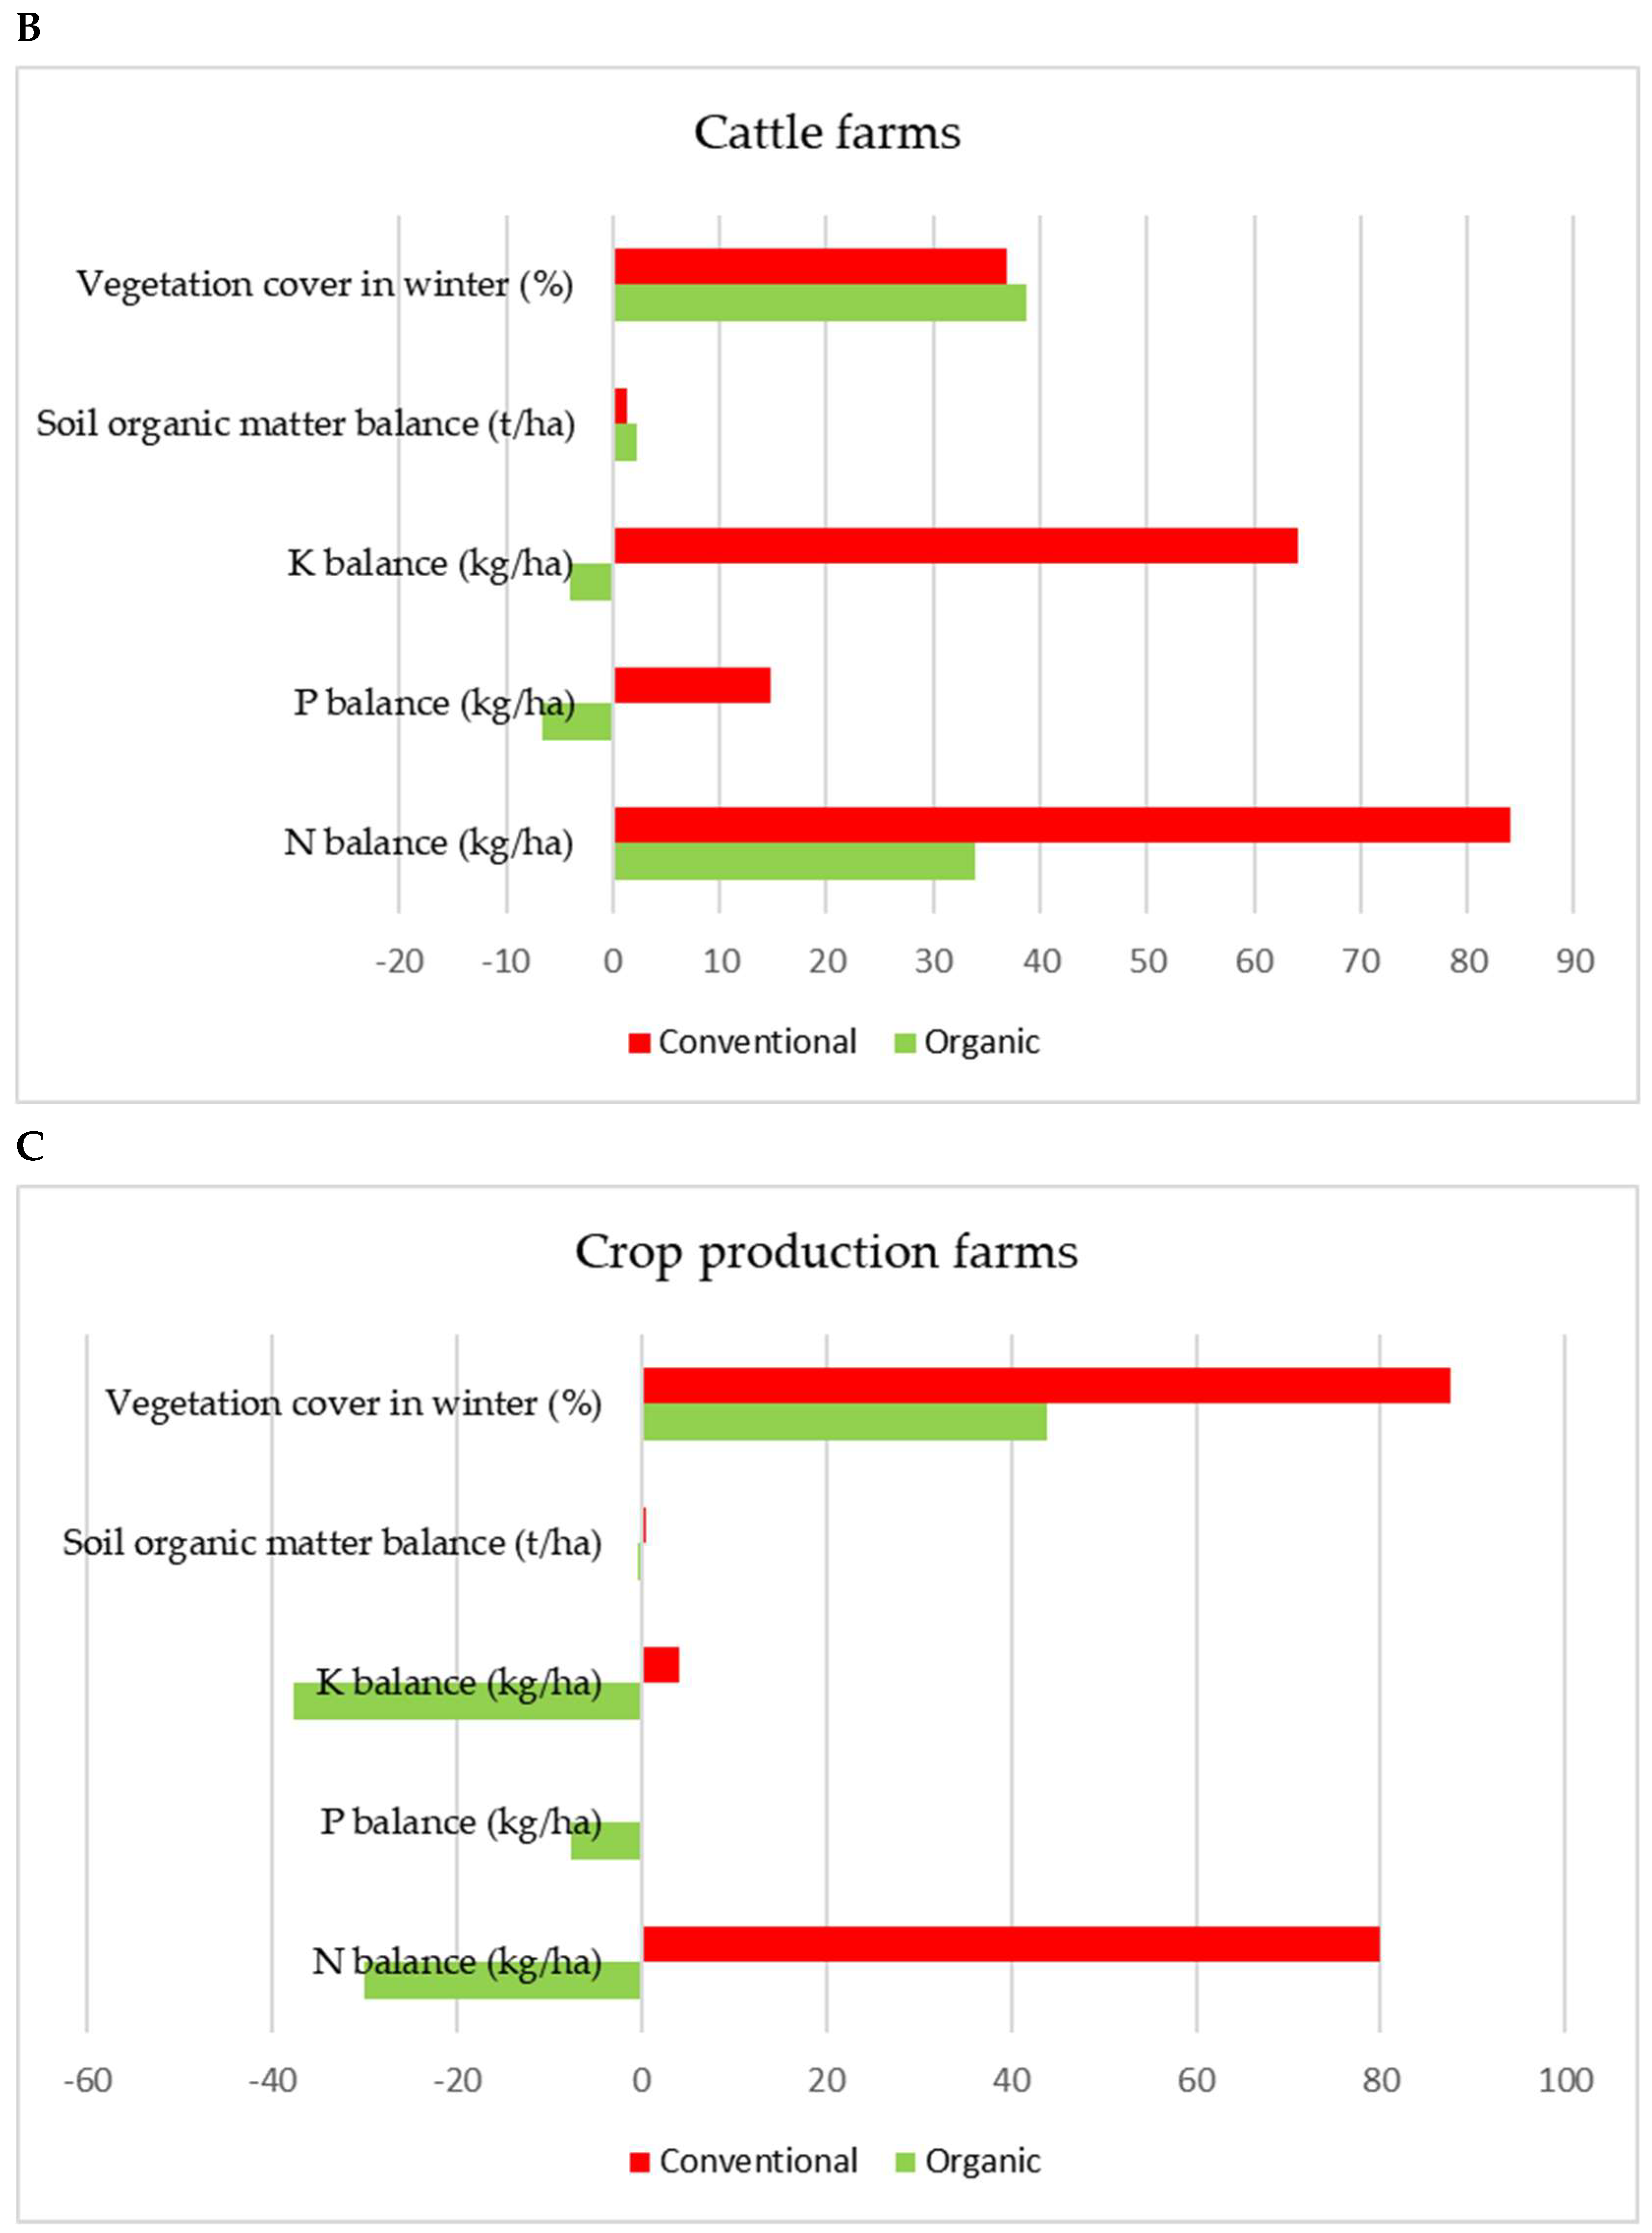
Balance of N
(kg·ha−1)
2.798.7 N surplus in conventional farms
Balance of P
(kg·ha−1)
−7.314.2 In the range of −30 to 30 kg·ha−1
Balance of K
(kg·ha−1)
−19.139.0 N surplus in conventional farms
Balance of soil organic matter
(t per ha arable land per year)
0.91.2 all farms, except the organic specialising in crop production, had a positive organic matter balance
Economic indicators
Gross farm income PLN·ha−1 UAA10,053 a12,851 a78%conventional better than organic by 28%
Commodity production
PLN·ha−1 UAA
5707 a10,399 b55%conventional better than organic by 81%
Direct costs (K) PLN·ha−1 UAA1019 a4399 b23%conventional higher than organic by 332%
Direct surplus PLN·ha−1 UAA7990 a8148 a98%conventional better than organic by 2%
Total economic efficiency of agricultural production3.16 b1.99 a158%organic better than conventional by 59%
* different letters mean significant differences between organic and conventional farms parameters according to the Mann–Whitney U test. Source: own elaboration.
Disclaimer/Publisher’s Note: The statements, opinions and data contained in all publications are solely those of the individual author(s) and contributor(s) and not of MDPI and/or the editor(s). MDPI and/or the editor(s) disclaim responsibility for any injury to people or property resulting from any ideas, methods, instructions or products referred to in the content.

