Abstract
To address the lack of effective monitoring, evaluation, and prediction methods for water stress in citrus seedlings, we conducted 10 sets of water stress gradient experiments. Based on the experimental dataset, we constructed, trained, and improved an MLP classification model for citrus seedling water stress. In addition, we developed a monitoring, evaluation, and prediction system based on this model. The experiments demonstrated that 7 days of slight water stress can induce changes in overall root wilting and growth stagnation, and the chlorophyll content in the leaves can decrease by up to 11.78%. Furthermore, the optimal VWC for seedlings was [45%, 50%], the boundary of drought was [20%, 25%], and the boundary of waterlogging was [50%, 55%]. We validated the effectiveness of the system in assessing the growth status of seedlings over the past 7 days and predicting it after 7 days through testing sets and experiments on slight water stress. We found that the system achieved non-destructive remote monitoring, evaluation, and prediction of slight water stress in citrus seedlings, thus enhancing seedling quality. These research findings provide valuable insights into water stress management in citrus seedlings and other crops.
1. Introduction
According to the U.S. Department of Agriculture, citrus fruits are among those most widely consumed globally. The quality of citrus seedling rearing significantly impacts the survival rate of seedlings and the occurrence of diseases and pests [1,2]. To minimize the occurrence of pests and diseases and enhance the overall growth quality of citrus seedlings, it is crucial to promptly address water stress throughout the extended seedling phase, which typically spans 1–2 years. Water stress encompasses two primary forms: waterlogging and drought, which can contribute to other biological and abiotic stresses, including salt stress, root rot, leaf miner infestation, and various blights [3]. Consequently, it represents a critical concern in citrus seedling cultivation.
Waterlogging significantly hampers the growth of citrus seedlings, leading to notable reductions in growth traits such as height, stem diameter, above-ground fresh weight, and root fresh weight. Wu et al. [4] demonstrated that waterlogging stress at 37 days significantly inhibited plant height, bud development, and root fresh weight in citrus seedlings. The detrimental effects of waterlogging on citrus seedlings also encompass decreased aerobic root respiration, impaired ATP (adenosine triphosphate) synthesis, metabolic disruptions, hormonal imbalances, alterations in carbohydrate distribution, inadequate nutrient absorption, premature leaf senescence, organ damage, and even plant mortality [2]. Liu et al. [5] observed that after 10 days of waterlogging, the root system exhibited significant reduction, and after 45 days, the midvein of leaves turned yellow, progressively atrophied, and eventually perished.
Drought stress poses limitations on citrus nutrient uptake and yield, resulting in reduced fruit size, compromised fruit quality, and substantial economic losses for orchards [6]. Kosola et al. [7] postulated that in arid regions, if the root system experiences dry conditions for more than 20 days, it will shed the existing root system, leading to slow growth of the subsequent root system. Simultaneously, the overall plant gradually struggles to maintain a normal state, severely impeding its development. Espeleta et al. [8] discovered that moderate 5-week drought stress did not result in widespread root death; however, individuals with thicker roots exhibited greater survival than those with finer roots. Rodriguez-Gamir et al. [2] suggested that under severe drought stress, complete withering typically occurs within approximately 15 days. Zaher-Ara et al. [9] further indicated that drought stress conditions led to significant reductions in stem root length, stem root dry weight, stem root fresh weight, tissue moisture content, and germination rate. Moreover, the root system can respond to soil drying by transmitting signals to the leaves, prompting stomatal closure to minimize water loss. The signaling molecule involved in drought-induced responses is ABA (abscisic acid), which accelerates leaf senescence [10,11]. Yellowing of leaves is commonly considered as the initial visible symptom of leaf aging [12].
Currently, water stress research primarily focuses on investigating notable alterations in internal plant substances, as well as external indicators such as roots and leaves. However, there remains a significant gap in the development of effective monitoring systems, comprehensive VWC (volume water content) data, and precise assessment and prediction methods for water stress. This lack of robust tools and techniques hinders our ability to accurately monitor and evaluate the extent of water stress experienced by plants. Meanwhile, these studies often impose long-lasting and intense water stress conditions, leading to the death of plants in the majority of cases. Such experimental conditions do not align with the water stress gradient encountered during actual seedling cultivation. It is worth noting that plants possess some inherent resistance to external variations [13]. However, this resistance tends to lag behind environmental changes, and the rapid fluctuations in soil water content often subject plants to water stress before any visible symptoms can be detected by growers [14].
Traditional soil moisture content determination methods, such as gravimetric techniques, are known to be time-consuming and destructive [15]. Jin [16] proposed the use of gravimetric methods to assess the impact of varying soil moisture content on roots and fruits. However, the results obtained through this method are limited in their applicability and offer little assistance to the plantation industry. To overcome these limitations, the utilization of electromagnetic soil moisture sensors has been proposed. These sensors measure the effective dielectric constant of the soil, enabling accurate determination of soil moisture content without causing harm to the root environment [15]. Moreover, LoRa (long-range radio) communication technology offers several advantages, including long transmission distances and low energy consumption [17].
Behavioral recognition research in biology typically involves the utilization of precise techniques to gather data, such as sensors, followed by manual labeling of observed behaviors. Subsequently, supervised machine learning (ML) techniques are employed to classify significant behaviors [18]. The MLP (multilayer perceptron) model is commonly used for multi-classification tasks [19] and water stress can be considered as such. We discuss more classification models in Section 2.3.1, while the main model adopted in this paper is MLP.
Currently, the digitization process of managing water stress in citrus seedlings contains the following gaps: the criteria for discriminating seedling water stress, electronic data related to water stress, and electronic monitoring, evaluation, and prediction methods for water stress. To address these gaps, we developed “The monitoring, evaluation, and prediction system for slight water stress in citrus seedlings based on improved MLP”. The system performs well, and this study makes the following contributions:
- (1)
- We conducted experiments on different gradients of water stress in citrus seedlings. Through these experiments, we developed a method to determine water stress in citrus seedlings and collected electronic data on water stress. We used electromagnetic sensors, LoRa technology, and a host computer to establish a sensor network, enabling non-destructive and remote data collection. Additionally, we observed changes in both aboveground and underground characteristics of seedlings after stress and formulated a set of criteria for assessment. Based on the VWC dataset obtained from experiments, we provide the delineation intervals for water stress in citrus seedlings. These intervals serve as reference points for other research endeavors.
- (2)
- We constructed a classification model for water stress. Based on the experimental dataset, we augmented the dataset through techniques such as data augmentation and class balancing, bootstrap sampling, and feature engineering. This augmentation aimed to more accurately reflect the soil moisture conditions during actual seedling cultivation processes, thereby enhancing the model’s generalization ability. After analyzing various classification models, we chose the MLP model, which exhibits similarities in computational processes to the accumulation process of water stress. We optimized the model’s performance by considering the dataset’s features and the specific performance of the loss function, achieving satisfactory results.
- (3)
- We conducted experiments on slight water stress, and the actual status of the seedlings matched the predictions of the model. Additionally, the model’s results exhibited strong confidence, demonstrating the model’s excellent performance.
The rest of the article is as follows. Section 2 describes the methodology and approach for conducting experiments on water stress in citrus seedlings and constructing machine learning models. Section 3 presents the corresponding results. Section 4 discusses the model’s performance further through experiments on slight water stress. Section 5 summarizes all the results and conclusions of this study and provides relevant suggestions for future research.
2. Materials and Methods
2.1. Total System Design
The overall technical framework of the citrus seedling water stress monitoring system is shown in Figure 1. The root experiment under water stress conditions (Figure 1a) established a set of criteria for determining water stress, which was then used as the basis for labeling the dataset. A LoRa sensor network (Figure 1b) was established to enable non-destructive, automated, and remote data acquisition. Experiments on VWC (Figure 1c) were conducted under different gradients of water stress to obtain the dataset. The experimental data were analyzed to summarize the delineation intervals for water stress and to create the dataset (Figure 1d). After screening machine learning models, we opted for MLP to build and optimize the classification model. This process comprised three stages. (Figure 1e). We evaluated the models at each stage and validated the model’s performance through experiments on slight water stress (Figure 1f).
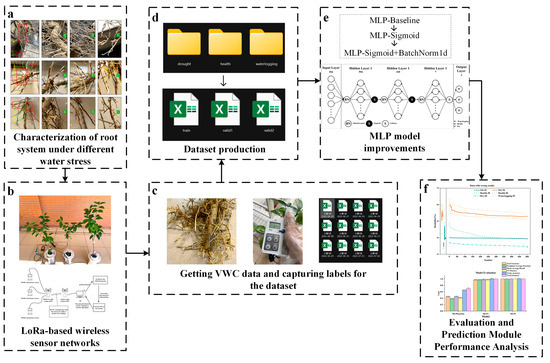
Figure 1.
Technical framework of the citrus seedling water stress monitoring system.
2.2. Data Acquisition of VWC
2.2.1. Root Experiment under Water Stress
The existing literature indicates that under long-term strong water stress, there is a significant change in root characterization and leaf characterization, while leaf characterization shows a lag compared to intrinsic material changes. The shortest time for significant changes in waterlogging experiments is 10 days, while in drought experiments, it is 15 days. To investigate the impact of water stress on seedlings within a shorter timeframe and label the dataset during the collection of VWC data, we conducted a 7-day water stress experiment, and a set of criteria was developed based on the effects of drought and waterlogging. These criteria were used for the assessment of the damage caused by water stress on the seedlings, enabling classification and assigning labels to the dataset.
In citrus seedling cultivation, it is common practice to graft desirable fruit branches and buds onto disease-free rootstocks to obtain seedlings that are more resistant to viruses [20]. The rootstock plays a crucial role in enhancing tolerance to various stresses, including water stress [2]. Among the various rootstocks available, the three-leaf orange rootstock stands out due to its exceptional adaptability to the environment and strong stress resistance across different citrus varieties. Consequently, it is widely utilized worldwide [21,22].
For this experiment, the selected rootstock was Trifolium orange, while the citrus seedlings used were 2-year-old 091 seedless fertile citrus seedlings. The overall length of the seedlings was approximately 60–80 cm, with the underground part being about 20 cm and the aboveground part about 50 cm. The depth of the soil covering the roots was greater than 5 cm. The seedlings were cultivated in seedling bags with dimensions of 120 × 120 × 300 mm. Each bag was filled with approximately 400 g of high-quality soilless substrate. The substrate height was around 250 mm, and each bag was dedicated to cultivating a single seedling. The substrate composition primarily consisted of moss peat, coconut bran, carbonized rice husk, Perlite, vermiculite, humic acid, trace elements, and biological bacteria. The pH of the substrate ranged from 5.5 to 6.5, the electrical conductivity (EC) value ranged from 0.1 to 0.5, and the organic matter content exceeded 45%. The total porosity was greater than 60%, and the total nutrient content ranged from 2% to 4%. These measures ensured that any changes observed in the seedlings could be primarily attributed to water stress rather than a lack of essential trace elements.
There were three groups in total, namely “Health”, “Waterlogging”, and “Drought”, with one citrus seedling in each group. In the “Health” group, a moderate amount of irrigation was performed daily to ensure that the soil remained adequately moist. The “Waterlog” group received multiple large irrigations to ensure that the soil’s water content exceeded its carrying capacity. The “Drought” group involved planting seedlings in relatively dry soil conditions without irrigation. The duration of the experiment was 7 days, with the overall weather maintained at around 20–25 degrees Celsius, mostly sunny.
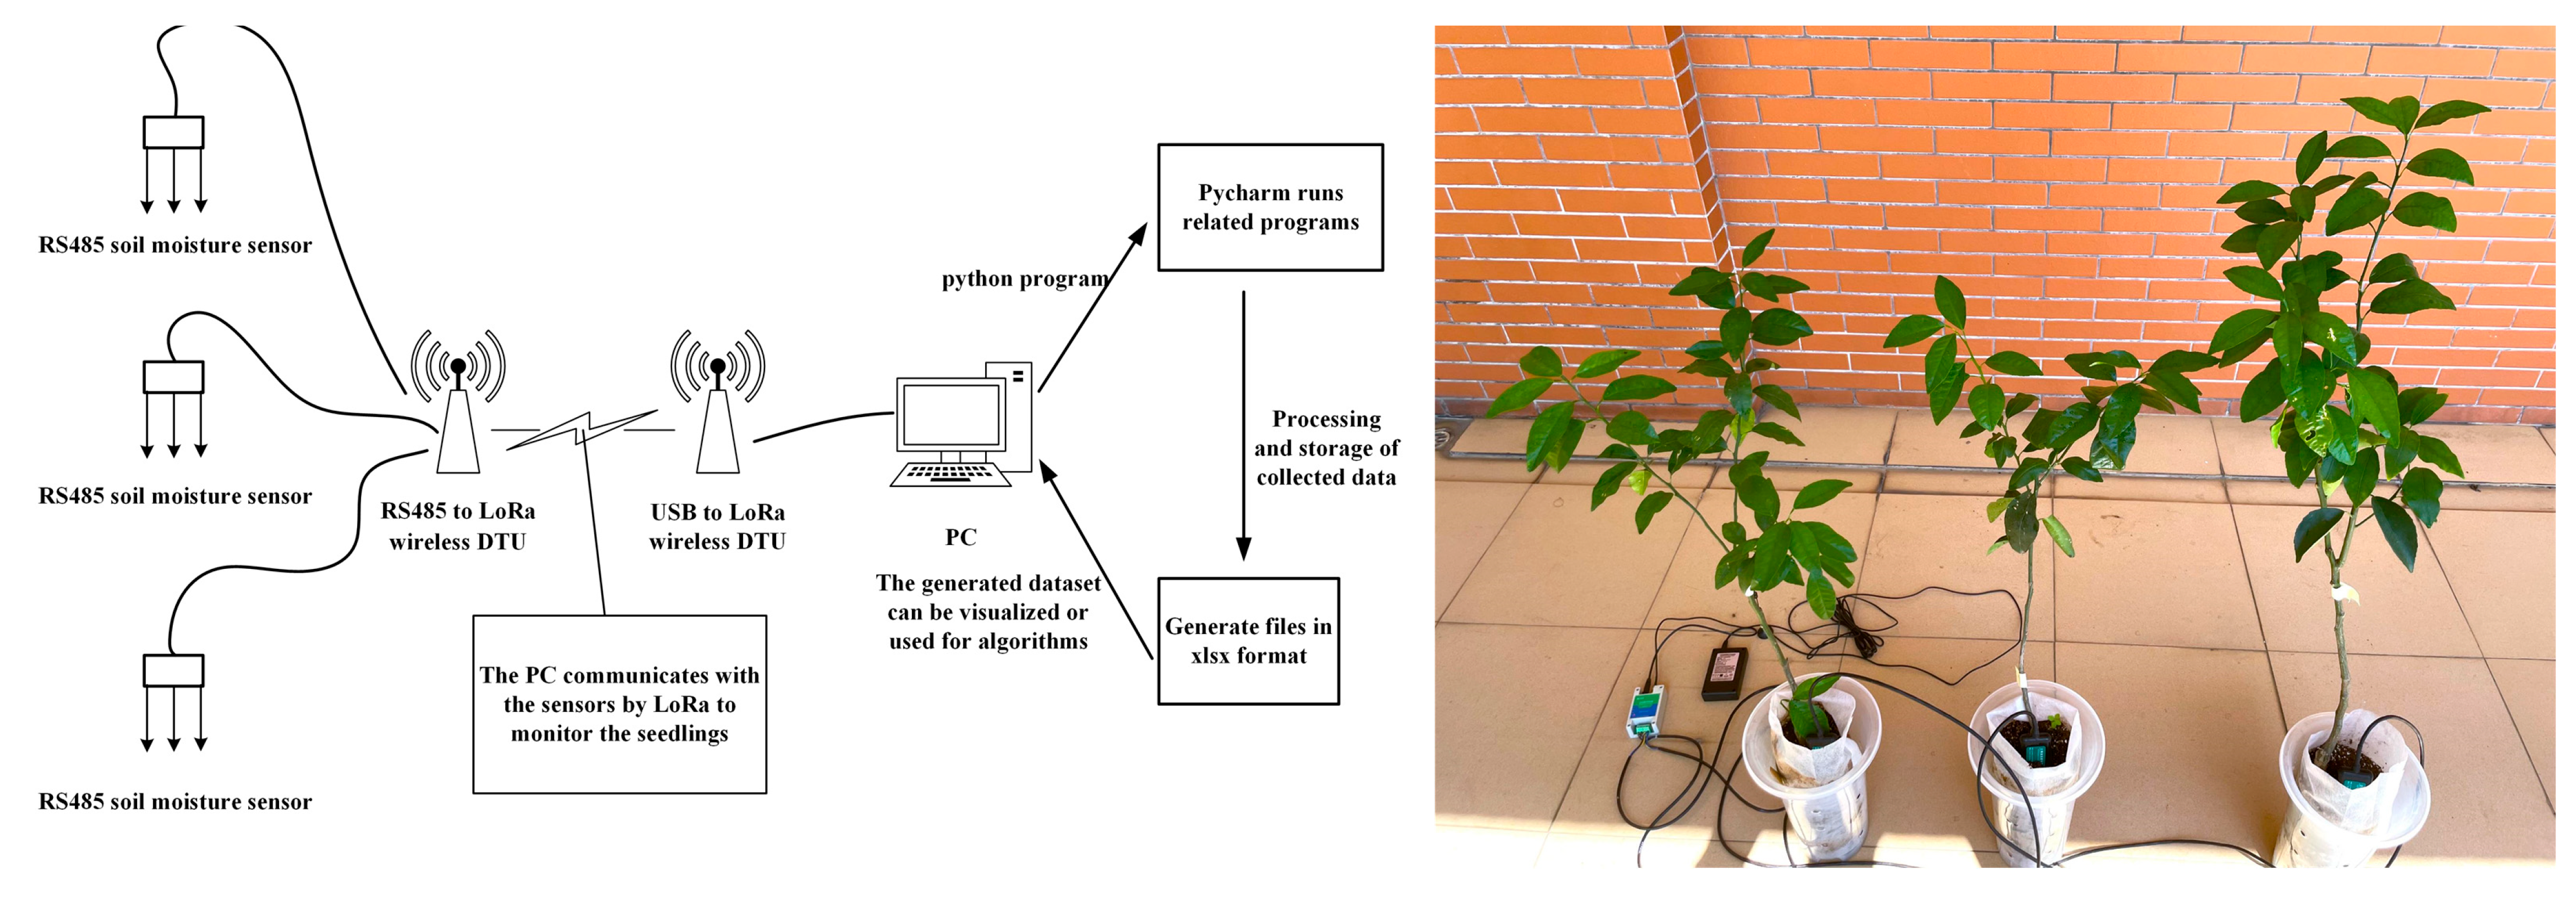
2.2.2. Wireless Sensor Network Based on LoRa
The data were collected through a self-built wireless sensor network based on LoRa. Figure 2 illustrates a schematic diagram of the overall wireless sensor network and presents a physical diagram of the wireless sensor network. The RS485 soil moisture sensor (Prsens, Jinan, Shandong Province, China) selected for this study is based on the frequency domain reflectometer (FDR) principle. This sensor can provide an estimation of the VWC in the substrate [23].
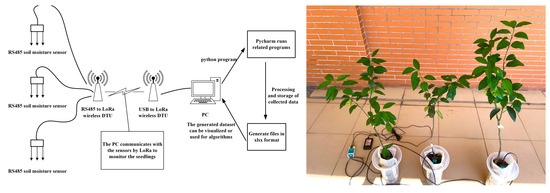
Figure 2.
Wireless sensor network.
In the network, the node sensors are connected to the RS485 LoRa DTUs (Husin, Jinan, Shandong Province, China), while the PC (personal computer) is connected to the USB LoRa DTU. The USB LoRa DTU serves as the gateway server, and the RS485 LoRa DTUs function as the node client. The inquiry frames from each sensor are sent in a broadcast format, and the received information is decoded and recorded in their respective datasets. Each node generates an XML file every 24 h to store the collected data.
When considering the water infiltration after irrigation, it is important to note that the VWC at the main depth where the root system is located (i.e., the primary area where the sensor is installed) decreases rapidly. Therefore, a collection interval of 20 min is used to avoid excessive drops in the recorded data. This interval ensures timely and accurate monitoring of the change in moisture content in the root zone.
2.2.3. VWC Experiment of Water Stress under Different Gradients
The 4 primary objectives of this experiment were as follows:
- (1)
- Collecting VWC datasets under different gradients of water stress: The experiment gathered VWC data from citrus seedlings subjected to varying degrees of water stress. These data provide insights into changes under different water stress conditions.
- (2)
- Determining the boundaries of drought, health, and waterlogging: By analyzing the collected data, this experiment identified the boundaries between drought and health or waterlogging and health. When evaluating the ideal water stress edge, we tried to find two gradual VWC lines as reference points. Any horizontal lines above or below these two lines were considered to indicate the presence of water stress. By establishing this framework, the experiment identified and quantified the occurrence of water stress based on distinct variations in VWC and established a reliable method for identifying the boundaries of water stress based on VWC.
- (3)
- Obtaining relevant information about slight water stress: This experiment captured and analyzed data related to slight water stress in citrus seedlings. By studying the changes in VWC and other relevant parameters, this experiment produced insights into the characteristics and impacts of slight water stress on plants.
- (4)
- Validating the necessity and benefits of electronic monitoring systems for slight water stress.
Overall, this experiment aimed to enhance our understanding of water stress in citrus seedlings, establish boundaries for different stress levels, and prove the efficacy and necessity of electronic monitoring systems for detecting and managing slight water stress.
The SPAD chlorophyll metric has high specificity and has been widely used as a reliable method for rapid nondestructive detection of chlorophyll. The actual measuring area of the SPAD chlorophyll metric was 2 mm × 3 mm. Taking the uneven chlorophyll distribution into account, it was necessary to measure several points on the same leaf to obtain a reliable value. This method is mainly applicable in diagnosing the chlorophyll contents of single leaves [24].
The water stress experiment was conducted at the Mechanization Research Office of the National Citrus Industry Technology System of the South China Agricultural University from May to August. The experimental site experienced an average temperature of approximately 24 °C, with predominantly sunny days and occasional cloudy or rainy days. The experimental setup and materials used were consistent with the root experiment.
Drought stress was assessed by measuring the chlorophyll contents of four leaves with four points per leaf using the Spad-502 chlorophyll analyzer (Konica Minolta, Tokyo, Japan) and observing changes in the roots. Meanwhile, waterlogging stress was determined solely by observing changes in the roots.
The process of the citrus seedling rearing experiment is outlined as follows:
- (1)
- Preparation: Before entering the seedling rearing phase, the seedlings are carefully removed from the original seedling rearing bags to ensure the root system remains healthy.
Replanting: The seedlings are then transplanted into new seedling rearing bags. Care is taken to ensure proper placement and alignment of the root system within the bag.
Sensor Probe Insertion: Sensor probes, which are part of the monitoring system, are inserted into the substrate of each seedling bag.
Monitoring System Activation: The monitoring system is activated, allowing for real-time tracking and recording of the VWC in the substrate.
Moisture Content Adjustment: Initially, VWC in the substrate may not be at the desired level. To rectify this, irrigation is carried out multiple times, gradually adjusting the moisture content.
Stability Check: The VWC of the entire substrate is monitored closely until it reaches the preset value and stabilizes.
After the seedlings have entered the nursery, the automatic monitoring system is initiated and runs continuously for 7 days.
- (2)
- To maintain the stability of the water stress gradient, small amounts of irrigation are selectively carried out twice a day, at 10 a.m. and 4 p.m. The water stress gradient is influenced by both time and VWC, and it is essential to consider both factors to improve the accuracy of the gradient assessment. To ensure reliable results, we maintain the experimental data within a predefined range of [−5%, 5%], thus avoiding multiple gradients within a single experiment.
- (3)
- Upon completion of the seedling rearing phase, the sensor probes are carefully removed from the substrate. The substrate is then poured out, and the roots of the seedlings are gently washed using a small water flow. This process helps in assessing the state of the plants and observing any visible changes or effects resulting from the water stress experiment.
- (4)
- After the experiment, the seedlings need to be re-implanted in the new seedling bag. Before the next experiment, the seedlings should be restored to a healthy state. By following these steps, the experiment ensures proper care and monitoring of the citrus seedlings during the experiment process, allowing for an accurate assessment of the effects of water stress on the plants.
Taking 80% and 40% VWCs as the first set of experiments, to found the boundary of waterlogging damage and drought damage to be between [40%, 80%] and [0%, 40%] by using the dichotomous method. Then, (1)–(4) were repeated until the boundary line of each state overlapped or the VWC differed within 5%. In this case, the seedling state might have showed uncertainty and could not provide effective information, so the experiment was ended.
2.2.4. VWC Dataset Production
The purpose of data analysis and dataset creation is to extract meaningful information from the available data and expand the dataset based on the known information (experimental dataset). The ultimate goal is to prepare the dataset to train a model that can accurately evaluate and predict water stress, assessing the health and stress levels of seedlings based on the VWC. By analyzing the data and creating an appropriate dataset, the monitoring system can be engineered to make informed decisions and provide valuable insights for seedling cultivation and management.
It is difficult to maintain a stable VWC in the actual seedling cultivation environment as we do in the experiment. As such, there are differences between the actual seedling cultivation dataset and the experimental dataset, and the main influencing factors are the irrigation time, irrigation amount, and irrigation interval, which are manifested as numerical values, slopes, and step numbers. Therefore, it is necessary to simulate the changes in VWC in actual seedling cultivation.
Data processing involved four methods in total. Among them, category balancing was combined with the other three methods for data processing. Differential weights were assigned to different categories during the dataset expansion process to balance the impacts of various categories.
- (1)
- Data Augmentation: The dataset underwent minor vertical shifting to enhance the role of original data during the training process, enabling the model to better learn data features and improving its robustness. Introducing data augmentation helps reduce the model’s excessive reliance on training data, thereby enhancing its performance on unseen data. Seven-day datasets were obtained, and overall numerical values were subtracted from 0.1 to 0.9, with the original data labels retained. Due to the relatively smooth data characteristics and small variations in this subset, it was more easily classified, thereby the quantity of this subset is relatively small.
- (2)
- Bootstrap Sampling: This is a commonly used resampling method in statistics, involving the generation of numerous sub-samples (bootstrap samples) with replacement from the original dataset. Inference is then made using confidence intervals. However, since all datasets resulting from this method will have identical labels (as they are derived from the same source), we only utilize its conceptual framework for sampling. Within each individual-day dataset for different states, a 7-day dataset is generated by randomly shuffling the data, with the corresponding state serving as the label. The generated datasets exhibit more pronounced and steeper changes compared to the original dataset, thereby increasing the gradient variation of numerical values within the same dataset. This emulates the fluctuating moisture conditions in real-world seedling environments.
- (3)
- Feature Engineering: In this study, feature construction was primarily utilized, involving the creation of new features through combinations, transformations, or derivations to enhance the expressive power and predictive performance of machine learning models. Feature construction leverages domain expertise or prior information to construct specific features relevant to the problem at hand, enabling the model to better capture the underlying structure and patterns of the data, thereby improving accuracy and generalization capability. Seven daily datasets were randomly selected and merged to generate a 7-day dataset. Based on experimental findings, we supposed that the health state could be considered healthy if it persisted for at least 5 days, whereas a state was deemed unhealthy if it persisted for at least 3 days. It is important to note that the unhealthy state labels in the mixed dataset do not necessarily represent actual unhealthy states (these unhealthy labels signify suboptimal seedling quality). For instance, a curve exhibiting 4 days of health and 3 days of an unhealthy state does not reflect an ideal seedling growth process and thus is labeled as unhealthy. Through this approach, more datasets representing mild water stress were created to enhance the differentiation between mild stress and healthy data.
2.3. Selection and Improvement of the MLP Model
2.3.1. Model Selection
In the dataset, the i-th data value collected was denoted as VWCi, with a duration of 20 min and a corresponding water stress loss, Li. We assumed the relationship between water stress loss and other parameters to be as shown in Equations (1) and (2):
In the equation:
- -
- The stress level is represented by Di, a non-negative number.
- -
- The stress correction coefficient is denoted as Ti, also a non-negative number, and Si represents the stress correction constant.
- -
- Di is positively correlated with the deviation from the ideal environment.
- -
- Ti is negatively correlated with the deviation from the average value of the 7-day dataset. A greater deviation indicates a shorter duration of VWCi’s effect, thus reducing its impact on Li. Consequently, when the deviation is significant, Si takes a negative value, causing Li to approach 0; conversely, Si is positive, increasing Li.
- -
- Overall, L is cumulatively formed by Li.
The aforementioned conjectures are derived from assumptions based on experimental results. Therefore, it is essential to employ positive and negative correlations along with mathematical operators to describe the relationships between each variable. However, demonstrating the precise relationships between variables is an intricate undertaking. Consequently, the utilization of a machine learning model becomes imperative to make full use of the concealed information within the dataset and avoid cumbersome proof.
Algorithms commonly used in classification tasks included random forest, naive Bayes, k-nearest neighbors (KNN), support vector machines (SVMs), and multilayer perceptron [25,26,27,28]. When dealing with a large number of attributes with close values, random forests face challenges in correctly classifying curves on the boundary between healthy and non-healthy states. This is because there could be a significant portion of curves with very similar values. Naive Bayes assumes attribute independence, which was not met in this dataset. Furthermore, KNN performs well with overlapping sample sets, but the computational load increases with more attributes, and its performance can be affected by the number of edge samples. SVM aims to find a hyperplane that maximizes a certain value, representing the minimum distance from the hyperplane to all training samples. However, determining the appropriate kernel function that satisfies the dataset proves to be challenging. Moreover, standard SVM is not designed for multiclassification tasks.
In the MLP model, the input of layer l is the feature vector , as shown in Equation (3):
The value in square brackets (in the superscript) indicates the network layer. We use the variable n to denote the number of nodes in a layer. As shown in Equation (4), the coefficients (weights W and biases b) defining the behavior of layer l are
The intermediary value z is shown in Equation (5):
The layer l output is obtained after the activation function , as shown in Equation (6):
The output of a hidden layer, denoted as , can effectively approximate any nonlinear result through the mapping performed by an activation function. Meanwhile, this characteristic highlights the similarity between the MLP model and the hypothetical calculation of water stress loss.
In conclusion, the MLP exhibited more favorable characteristics for water stress analysis compared to other classification algorithms.
2.3.2. MLP Model Optimization
The MLP initial model described in this article comprises three hidden layers. The first hidden layer consists of 504 neurons, which corresponds to the length of the input data. The second hidden layer consists of 168 neurons, representing 168 h. The third hidden layer consists of 7 neurons, representing 7 days. The output layer consists of three neurons, corresponding to the three labels associated with the seedlings. Since there are three tags, which are multi-category tasks, the cross-entropy loss function is selected as the Loss function, as shown in Equation (7):
where C is the number of classifications, y = 0 for correct classifications and y = 1 for incorrect classifications, p is the sample probability, and c is the sample label.
The SGD (stochastic gradient descent) is used as the optimizer, as shown in Equation (8):
The activation function, batch size, learning rate, momentum optimization, hyperparameter training times, and numbers of neurons and layers are adjusted to find the model with the most desirable performance.
3. Results
3.1. Root Experiments
Figure 3 displays the root characterization following the completion of the experiment. Zone A corresponds to the newly developed lateral roots at the top, Zone B represents the main root system, and Zone C represents the end of the lateral roots. The upper part of the figure corresponds to the drought group, the middle part represents the health group, and the lower part represents the waterlogging group. Root system analysis was conducted from both local and overall perspectives to evaluate the effects of the experimental conditions.
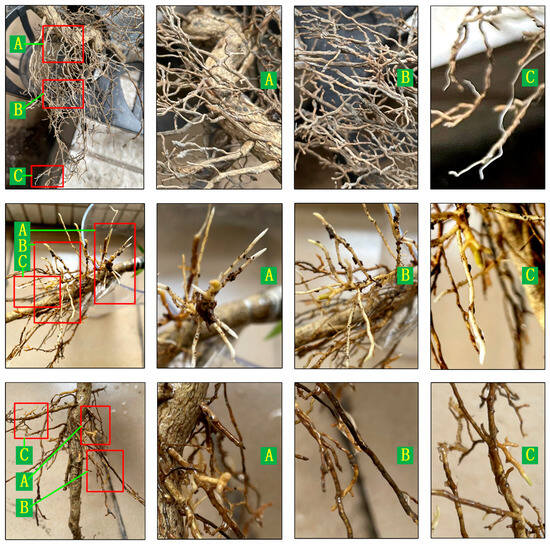
Figure 3.
Root characterization.
Based on the local root system analysis, the following conclusions can be drawn:
- (1)
- Drought group: In this group, there are minimal or no new shoots or lateral roots at the top. The main root system appears dry and pale, and the new shoots at the end of the lateral roots are slender.
- (2)
- Health group: In contrast to the other groups, the health group exhibits significant growth in the lateral roots at the top. There is an abundance of flexible and robust new shoots. The main roots appear light yellow and white, indicating healthy growth. Additionally, there is noteworthy growth in new shoots at the end of the lateral roots.
- (3)
- Waterlogging group: The growth of lateral roots at the top of this group is slow, with short and scarce new shoots. The main root system is black and sticky, indicating unfavorable conditions. The growth of new shoots at the end of the lateral roots is also sluggish.
Based on the analysis of the whole root system, the following conclusions can be drawn:
- (1)
- Drought group: After experiencing drought damage, the entire root system becomes dry and stiff. The color of the roots is predominantly white with some light yellow areas. The root crown appears slender, and there is limited extension and enlargement in the elongation zone and meristem zone.
- (2)
- Health group: The entire root system of the healthy group is predominantly white. The mature area appears light yellow, and the roots have a flexible texture. The root crown is round and full, indicating overall health. Furthermore, the elongation zone and meristem zone exhibit clear signs of extension and enlargement, indicating active growth.
- (3)
- Waterlogging group: The root system of the waterlogging-damaged group exhibits weakness and has a mucous texture. The color of the roots is dark, including black areas. The root crown appears slender and fragile. The extension and enlargement of the elongation zone and meristem zone are not significant. Additionally, the whole root system emits an unpleasant odor.
Furthermore, in the drought-damaged group, the leaves exhibited gradual wilting as a whole, and some leaves even fell off. This observation confirms that water stress triggers the production of abscisic acid in seedlings, leading to the degradation of leaf chlorophyll and eventual leaf loss. Therefore, there is no need to measure the chlorophyll content using instruments in cases of severe drought damage.
Based on the experimental results described above, it can be concluded that the water stress imposed for a duration of 7 days caused significant changes in both the root characteristics and leaf chlorophyll content of citrus seedlings. Thus, root characterization and leaf chlorophyll content changes served as essential criteria for labeling the datasets. By monitoring and analyzing changes in root characteristics and leaf chlorophyll content, we can effectively determine the impact of water stress on seedlings and assign appropriate labels to the datasets accordingly.
3.2. VWC Experiment
3.2.1. VWC and Root Changes
Through the process of dichotomization, a total of ten sets of experimental data were obtained, and the results are presented in Table 1 and Figure 4. In Table 1, the experiments are arranged in chronological order, with each experiment represented by preset VWC.

Table 1.
Experimental record table.
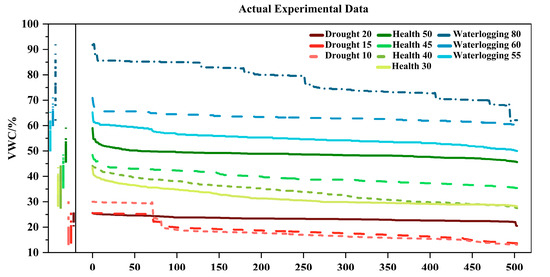
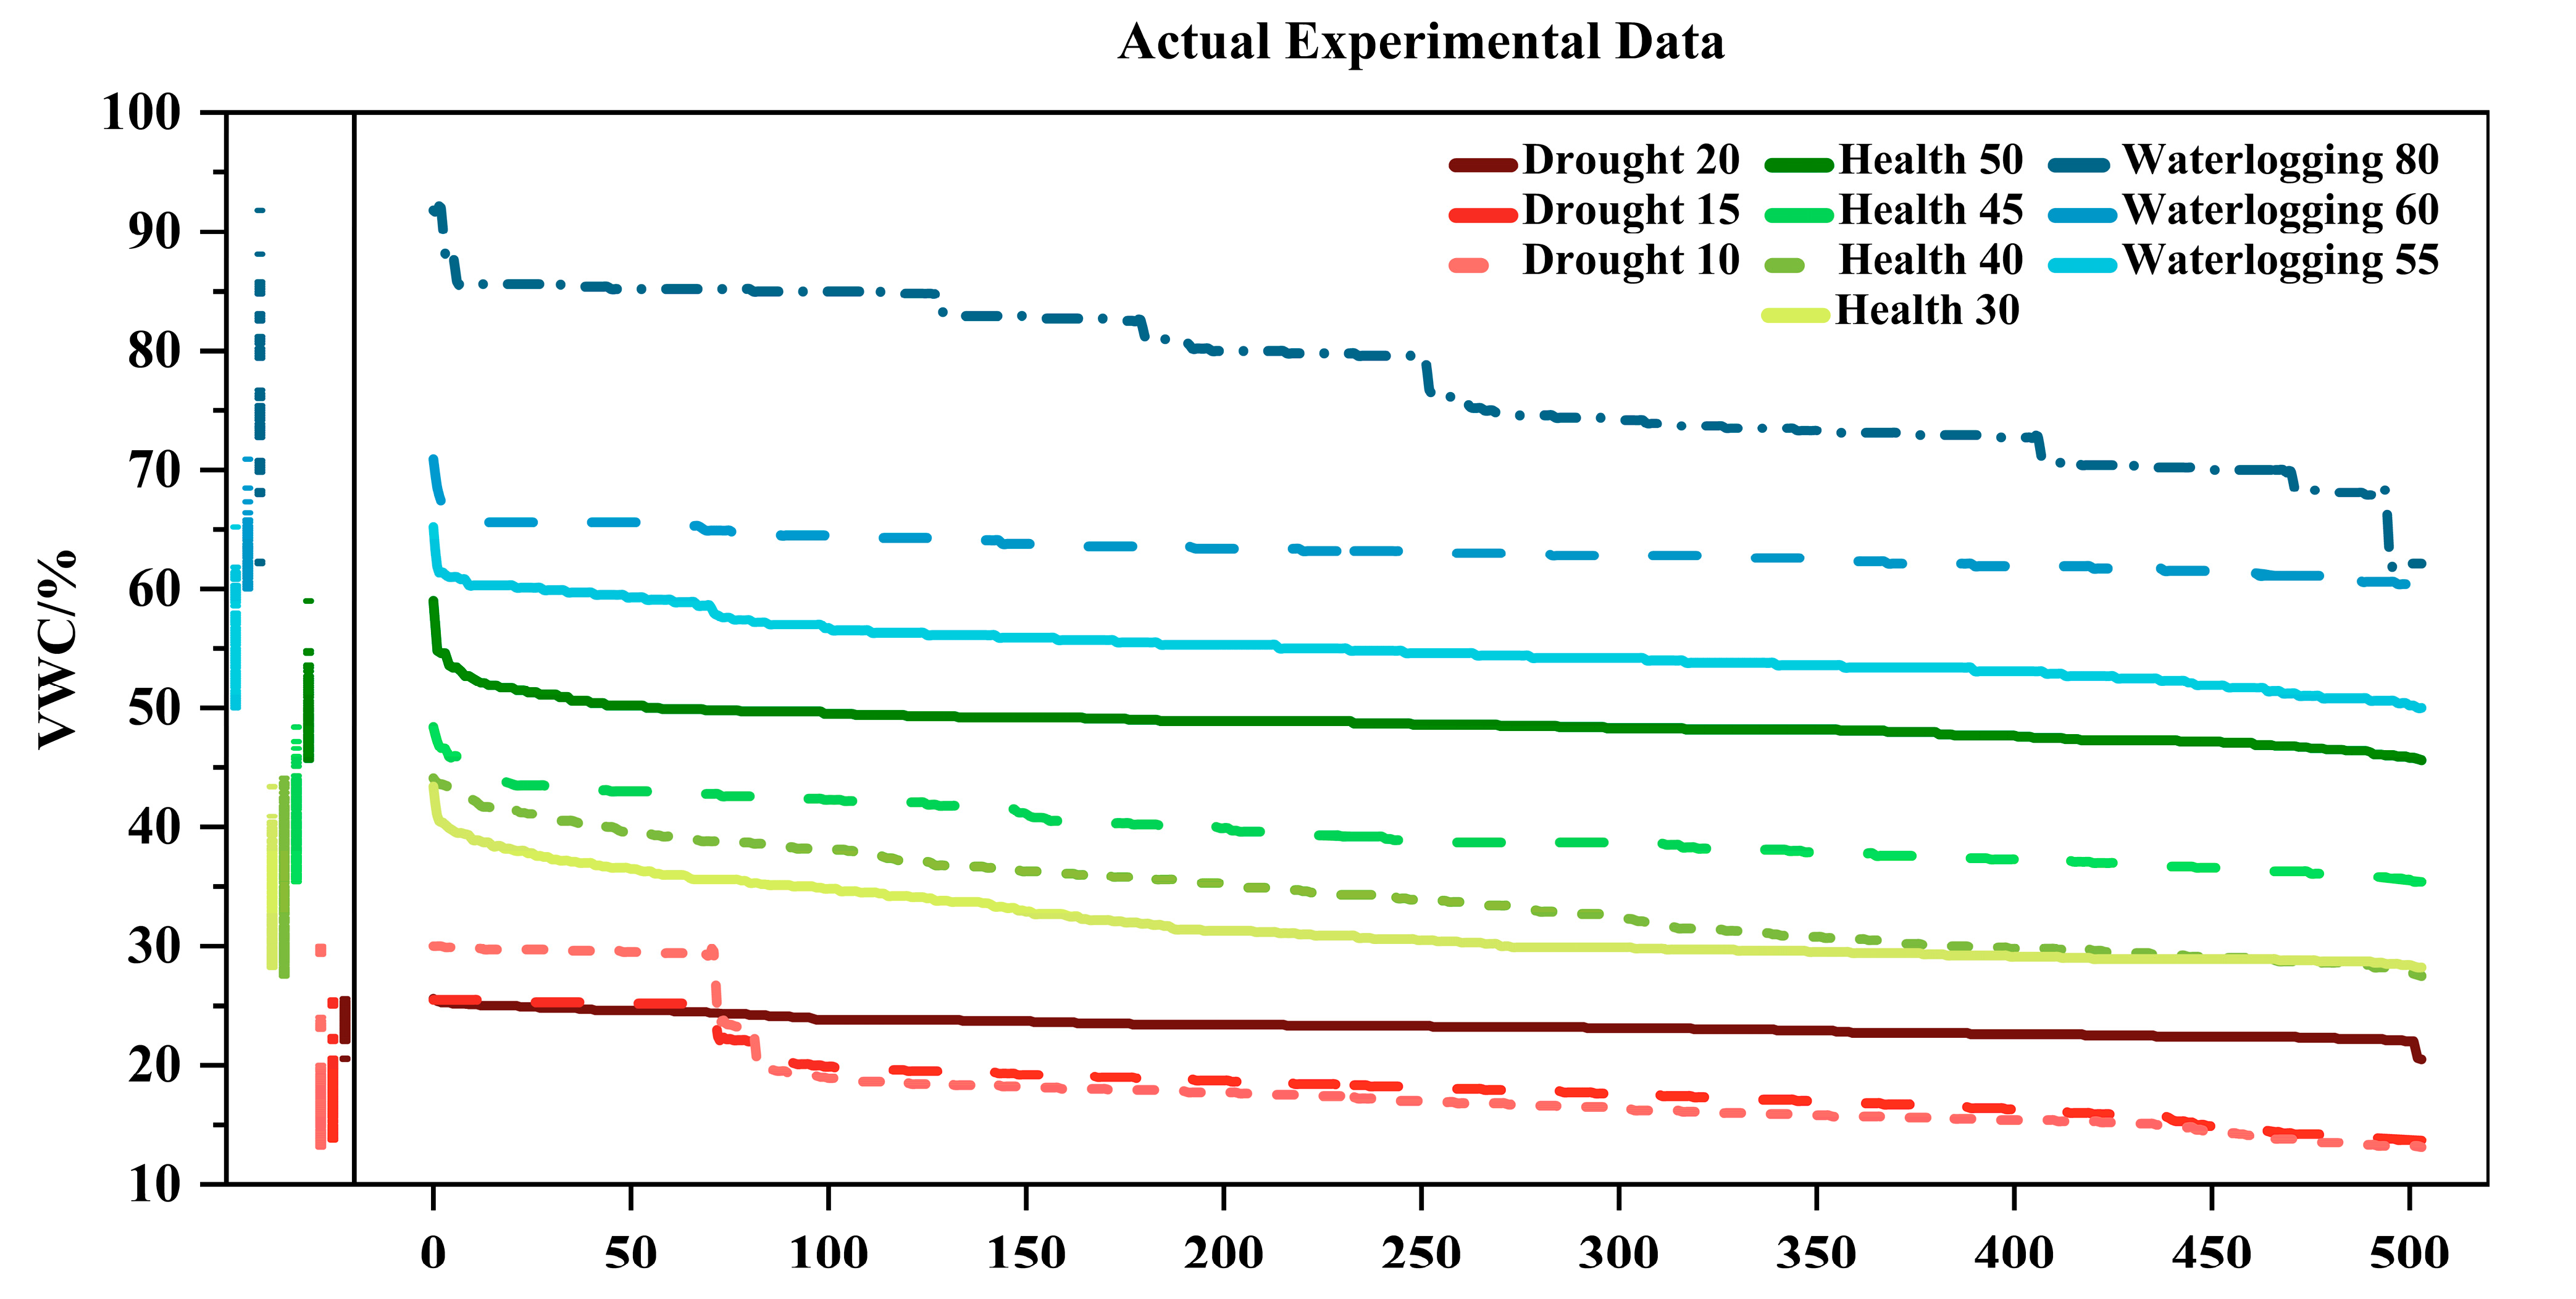
Figure 4.
Experimental line chart of water stress gradients under different preset VWCs.
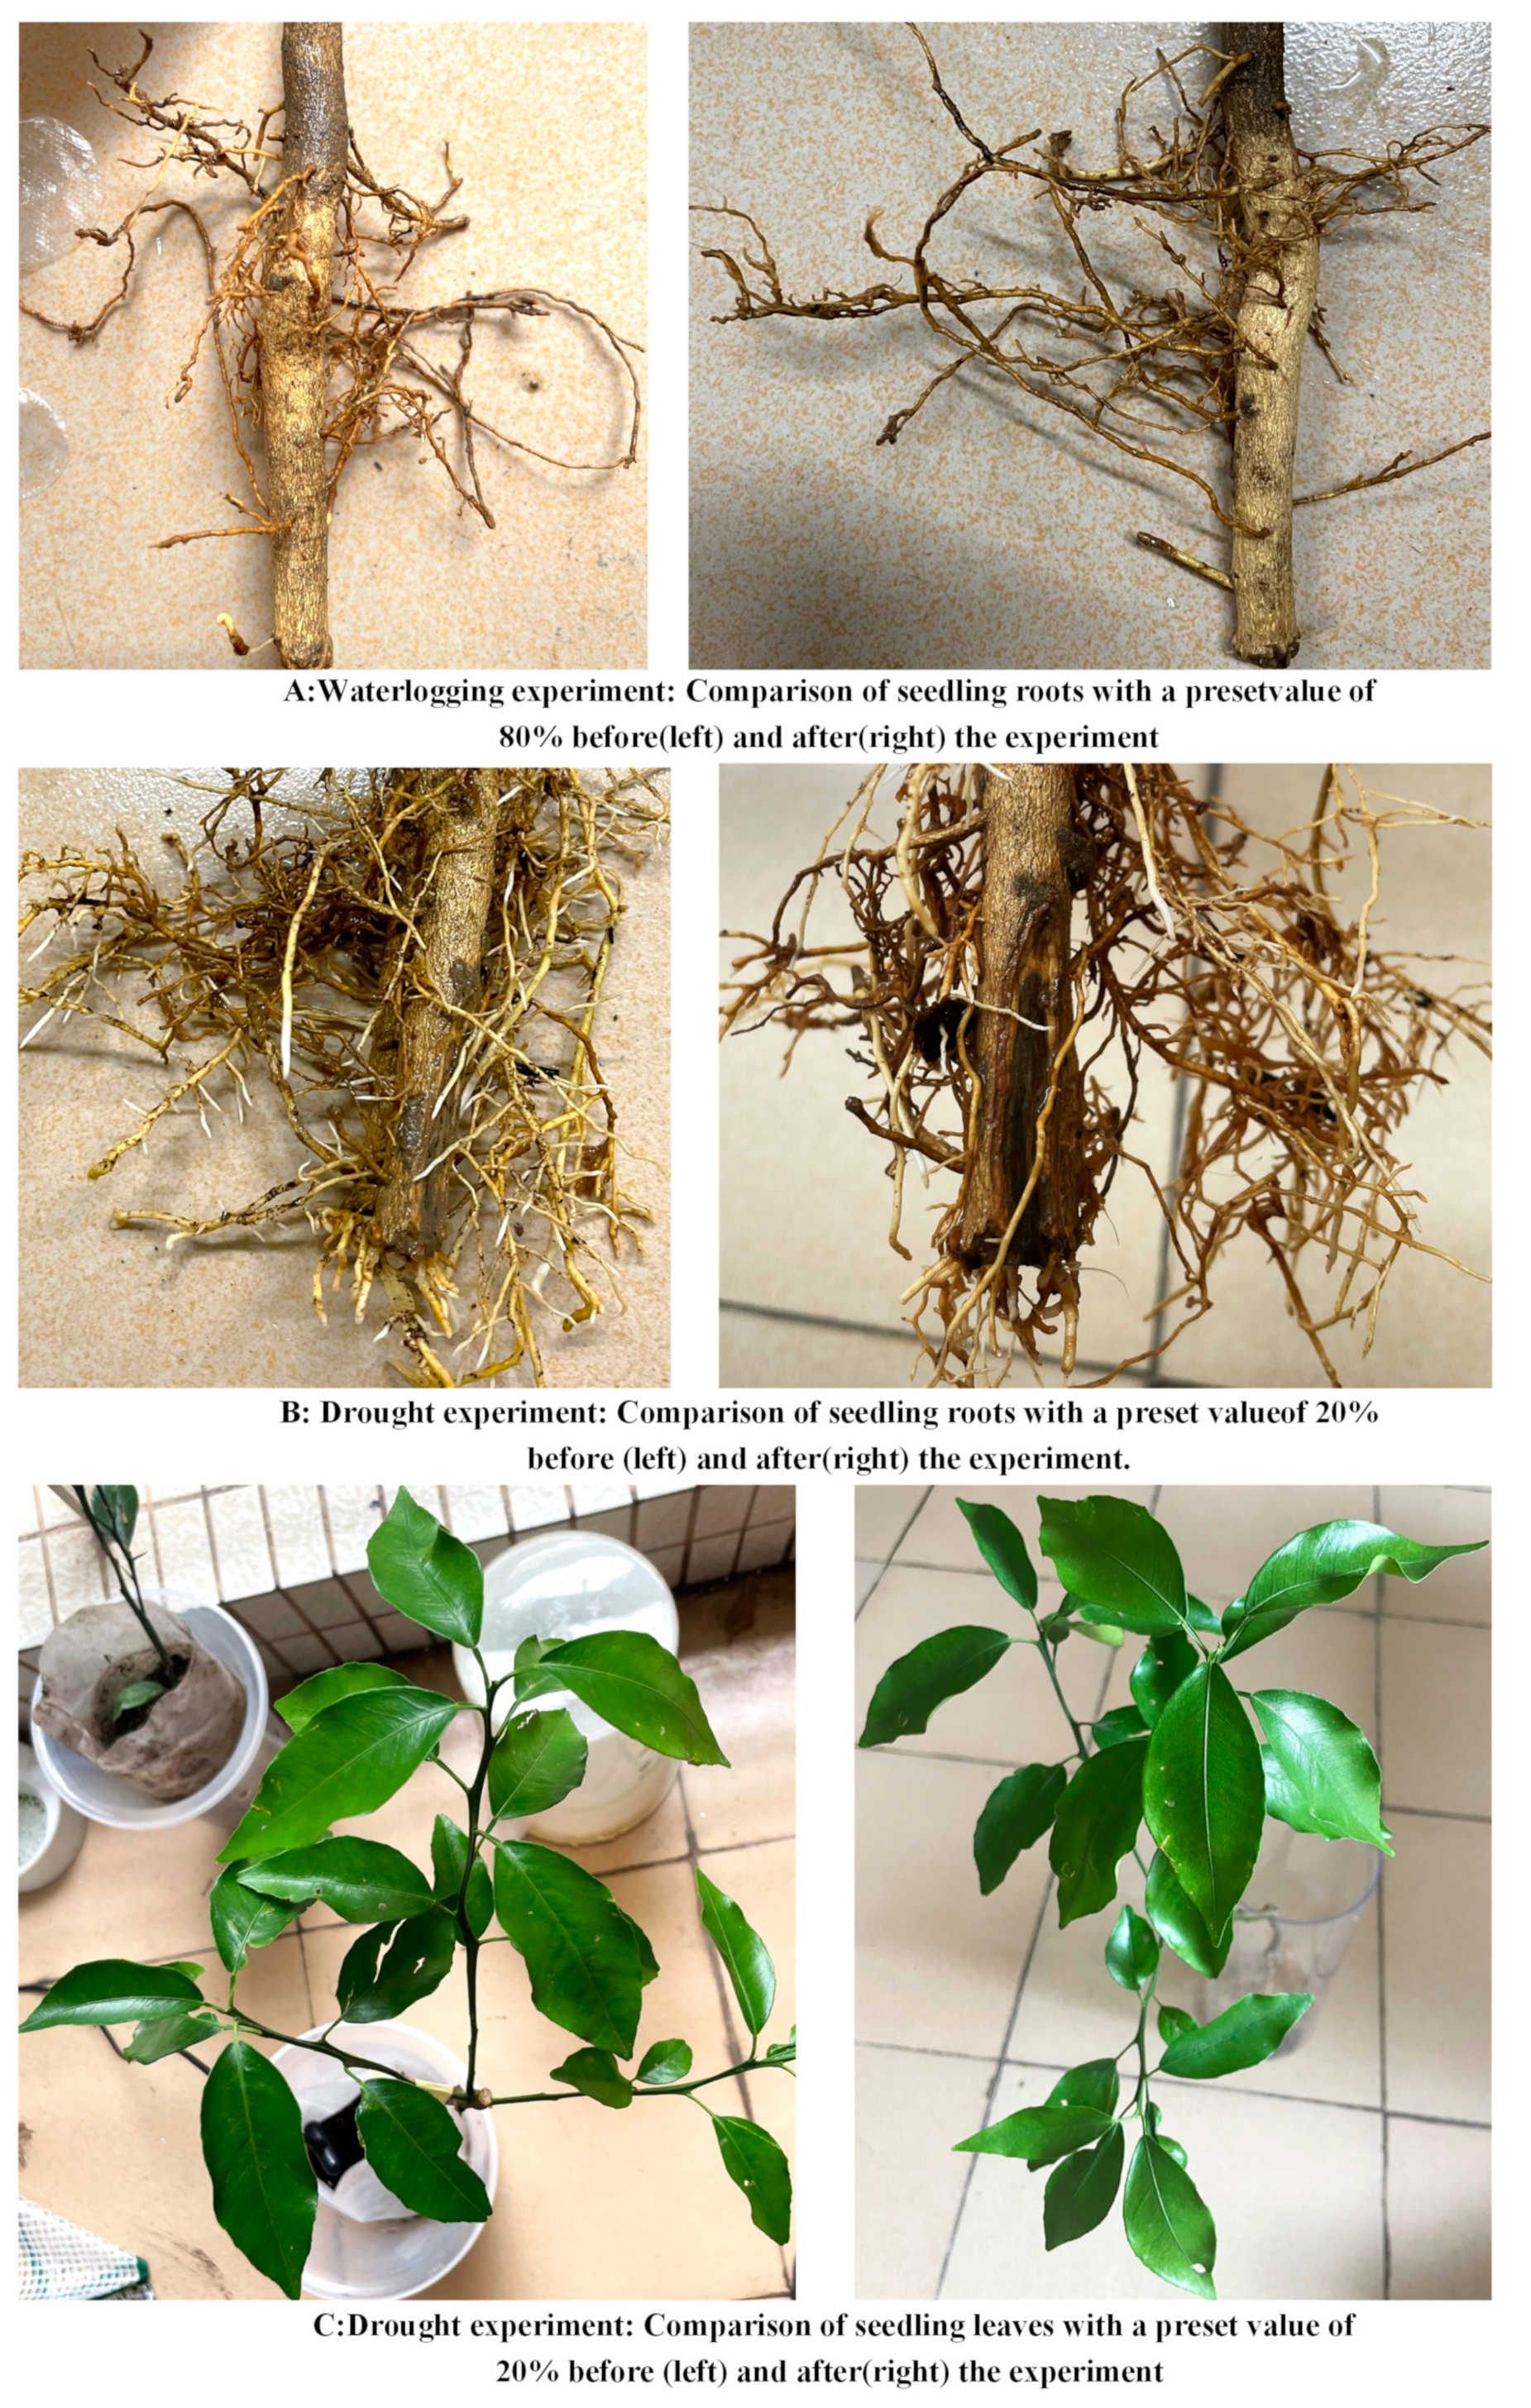
The preset VWC values in the first experiment were 80% and 40%; 80% represented severe waterlogging, and 40% indicated a healthy state. This demonstrated that the boundary between waterlogging stress and health lay within the range of [40%, 80%], while the boundary between drought stress and health was within the range of [0%, 40%]. As can be seen in Figure 5A, the root cap turned black, the overall root system darkened, without any new shoots growing, and there was a distinct odor and mucus. In the second experiment, the VWC values were set to 60% and 20% as the preset values; 60% indicated waterlogging stress, and 20% represented slight drought stress. From Figure 5B, it can be seen that after the 20% experiment, the overall root system was darker in color and less pliable than before, most of the root system had stopped growing, the root cap was thinner, and almost no new white shoots were growing. These findings confirmed that the boundary between waterlogging stress and health was within the range of [40%, 60%], and the boundary between drought stress and health lay within the range of [20%, 40%].
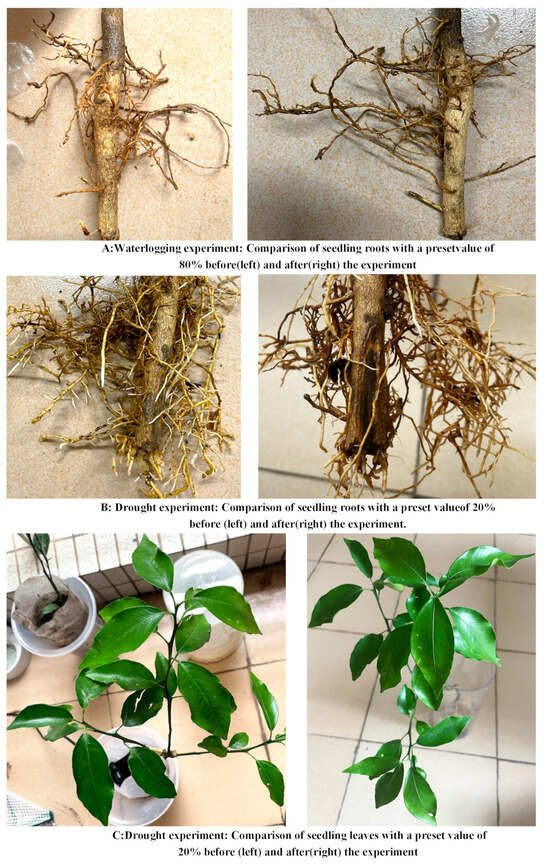
Figure 5.
Phenotypic comparison of seedlings after the experiment.
Therefore, for the third experiment, the preset VWC values were adjusted to 50% and 30%. The line of 40% was the closest approximation to the boundary of a healthy state. As a result, the third experiment introduced a preset value of 45% to expedite the exploration of the boundary. Among the values of 50%, 30%, and 45%, all represented a healthy state, with 45% being the most desirable outcome among all the experimental results. This observation further supported the notion that the boundary between waterlogging stress and health was within the range of [50%, 60%], while the boundary between drought stress and health lay within the range of [20%, 30%]. Numerically, the results obtained at 20% and 30% overlapped, indicating the discontinuation of the search for the boundary of drought stress. To enrich the dataset on drought stress and continue the investigation of the boundary for waterlogging stress, the fourth experiment incorporated preset VWC values of 15%, 10%, and 55%. Both 10% and 15% exhibited the expected changes following drought stress, and 55% represented a state of slight waterlogging stress. These findings provided evidence that the boundary should be situated closer to 50%.
Figure 4 provides a graphical representation of the experiment results. The horizontal axis represents the 504 data collections, while the vertical axis represents the VWC. The colors represent different states: blue corresponds to waterlogging, green corresponds to health, and red corresponds to drought. The different shades of color indicate different gradients.
In the study of water stress, the duration of the stress is more important than the specific time points. To emphasize the effect of the duration, the data are processed in descending order. This helps to avoid wave peaks caused by variations in irrigation time, frequency, and water quantity, which are irrelevant and may mislead the training of subsequent classification models.
The solid lines represent the boundary lines of each state. It is important to note that the left axis shows a certain degree of overlap between the values of each state. This overlapping region demonstrates that the growth state of the seedlings is determined by both the duration and VWC. This indicates that it is not possible to classify the water stress gradient based on a single value alone.
The results of the experiments led us to draw the following two conclusions:
- (1)
- The experiments identified both boundaries for drought and waterlogging. The drought edge falls between lines 20% and 30%, and the waterlogging edge lies between lines 50% and 55%. Line 45% is closest to the ideal seedling environment, and the best seedling conditions exist between lines 45% and 50%.
- (2)
- The experiments revealed that even slight water stress can have a significant impact on the normal growth of seedlings. Seedlings after the 20% drought test were subjected to the 50% experiment after a 5-day recovery period. From the overall results of the experiment, our takeaway is that the 50% VWC should have been closer to the ideal environment, but the actual seedlings still showed a significant cessation of growth, as well as a small amount of leaf abscission. This emphasizes the importance of studying slight water stress to improve seedling quality.
3.2.2. Leaf Change in Water Stress under Different Gradients
The analysis of chlorophyll content changes provides further evidence that slight water stress is challenging to visually assess during seedling cultivation. Table 2 records the SPAD differences in chlorophyll content before and after each drought experiment, measured using a chlorophyll meter. The table includes measurements from four different points on each of the four leaves. The average data result obtained from normal leaves, which is 56, serves as a benchmark for calculating the average change rate of other leaves. Columns two to five represent the mean differences in the four measurements within a single leaf, while the sixth column represents the mean difference in the four leaves.
Table 2.
Drought experimental records.
The data in the table demonstrate that the chlorophyll content shows significant numerical differences on the SPAD meter under drought conditions. The maximum overall change rate is 11.78%, and even for slight drought, the change rate is 4.96%. This confirms that the production of abscisic acid by roots during drought has an impact on the chlorophyll contents of leaves. The overall change rate is positively correlated with the intensity of drought damage, with some leaves showing a difference of 16.2 in the 10% experiment.
From a visual perspective, Figure 5C provides a comparison of the experimental group with slight drought damage. It is evident that it is difficult to directly detect short-term slight drought damage visually. Combined with the data in Table 2, it can be concluded that even slight drought stress can have adverse effects on seedling growth. It was observed that the effects of water stress on seedling characteristics were delayed, and visual detection of water stress was challenging, particularly for slight water stress, which did not exhibit obvious abnormalities or visible changes on the plant surface (such as wilting or yellowing) throughout the experiment. This further emphasizes the necessity of an electronic monitoring system for timely and accurate detection of water stress.
3.3. VWC Dataset Production
The final expanded dataset for the three ways includes 27 instances each for drought and waterlogging, and 36 instances for the health state; 140 instances each for drought and waterlogging, and 200 instances for health; and 40 instances each for drought, health, and waterlogging.
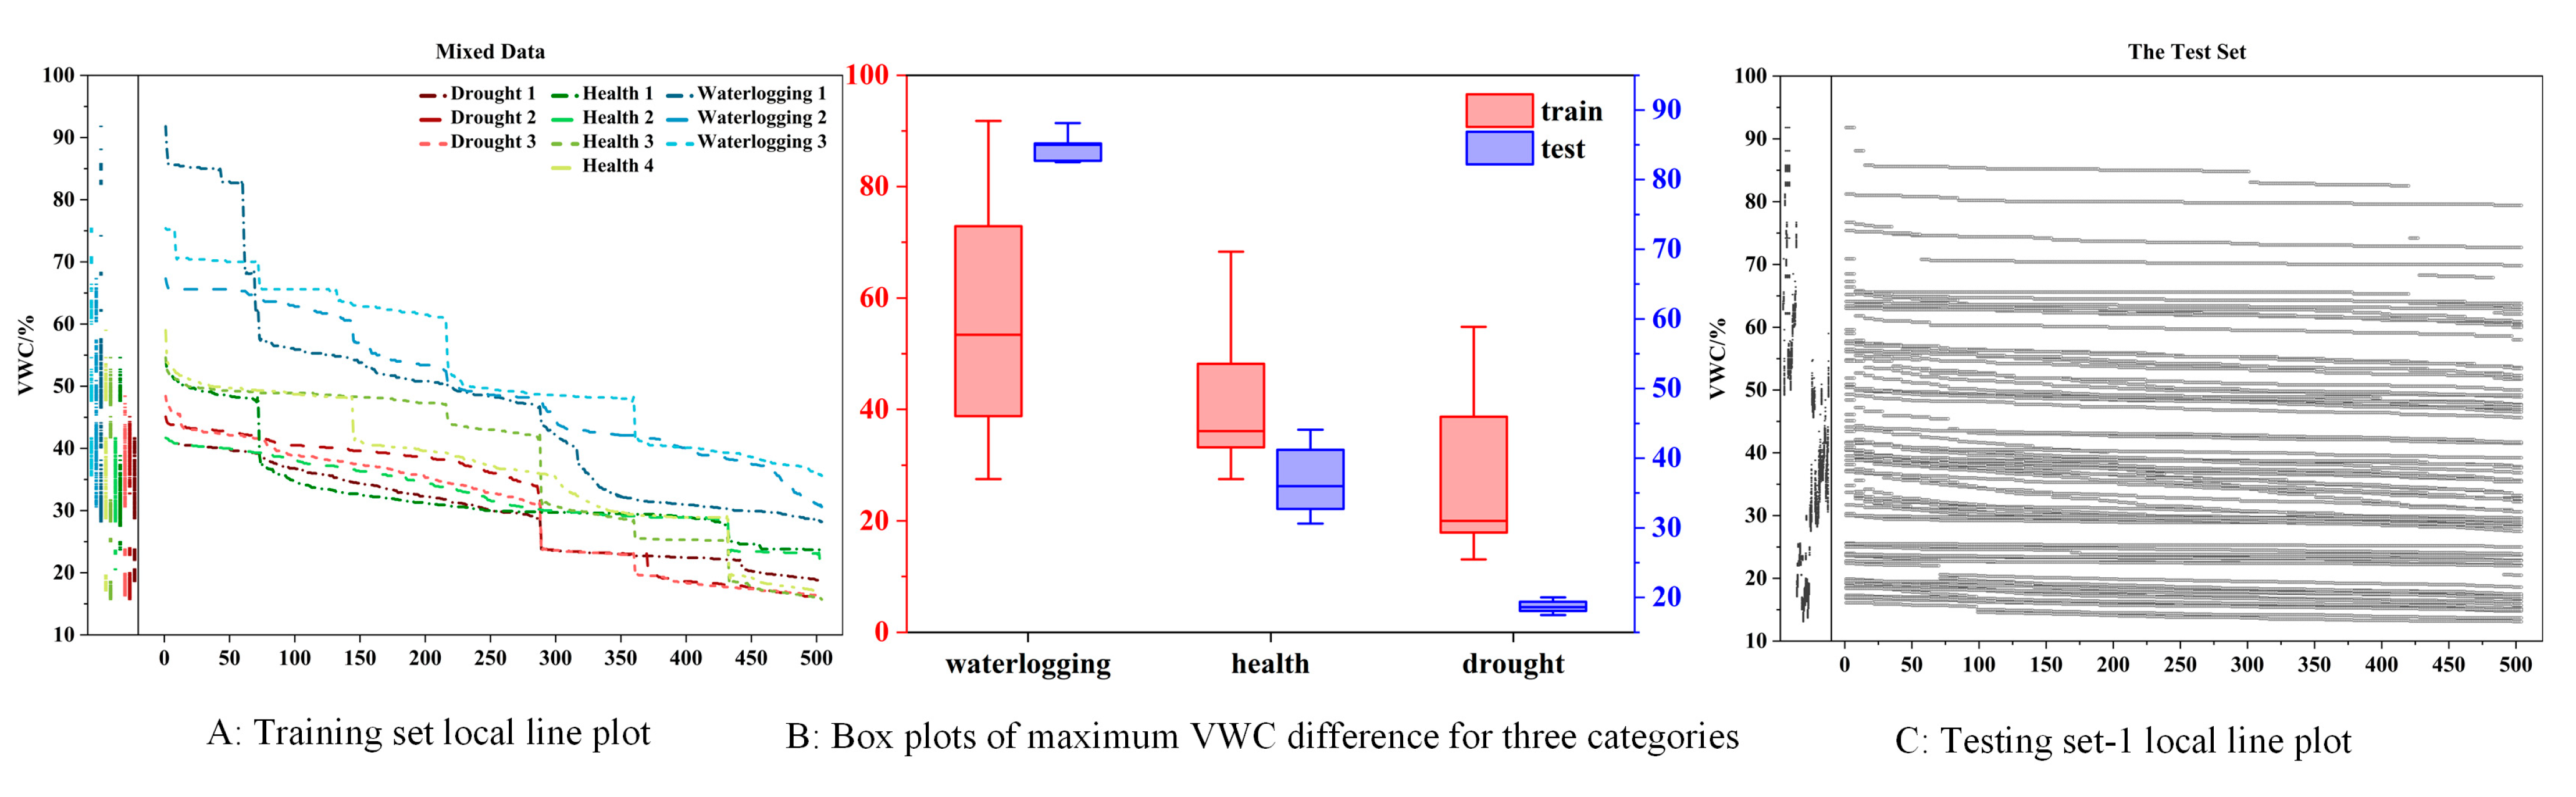
The seven-day dataset obtained from the experiment and the previously generated dataset, totaling 700 samples, were used as the training set. Figure 6A is the local plot of the training set, where the overall trend of the VWC changes significantly compared with Figure 5, which is more in line with the data distribution of the actual seedlings. Figure 6B is the box line plot of the maximum VWC difference between the training set and the test set, from which it can be seen that the training set and the test set are in the same category but also have a clear difference in the distribution of the data: the data in the training set are more dispersed, and the data in the test set are more centralized. Overall, the expanded training set with increased gradient changes will help improve the training and simulation of irregular irrigation conditions, enabling better modeling and analysis of seedling responses to different water stress levels.
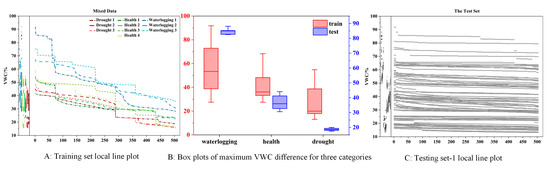
Figure 6.
Data characterization chart of the dataset.
The prediction module takes data from the previous day and replicates those seven times to simulate a dataset that remains in that state for seven consecutive days. A single-day dataset obtained from the experiment was replicated seven times, resulting in a total of 73 samples. These samples were labeled according to the corresponding experimental categories and used as testing set-1. Testing set-1 was employed to evaluate the performance of the prediction module. By comparing Figure 6A with Figure 6C, it could be observed that the scatter plot of testing set-1 exhibited less variation compared to the experimental dataset and training set, approaching a flat line and closer to slight water stress.
The evaluation module reads the dataset for the last 7 days for water stress assessment. The 7-day dataset obtained from the experiment was designated as testing set-2, utilized for testing and evaluating the module’s performance. It was required that testing set-2 achieved an accuracy of 100%.
Due to the obvious differences in data characteristics between the test set and the training set, if the model can achieve good performance in both the test set and the training set, this indicates that the model has a strong generalization ability and is able to effectively make correct water stress judgments based on the data.
3.4. MLP Model Optimization
This paper investigates three MLP models, namely MLP-Baseline, MLP-Sigmoid, and MLP-Sigmoid + BatchNorm1d. The MLP-Baseline model utilizes the ReLU (rectified linear unit) activation function, while the MLP-Sigmoid model employs the sigmoid activation function. The MLP-Sigmoid + BatchNorm1d model is an extension of the MLP-Sigmoid model, incorporating the BatchNorm1d algorithm. All three models reached convergence after 2000 training sessions. Therefore, the performance of the models after 2000 training sessions was selected for comparison in this study.
3.4.1. Selection and Analysis of ReLU
ReLU is widely regarded as the primary activation function used in neural networks, and it is the default choice for most feedforward neural networks. When compared to other activation functions, ReLU has been shown to enhance the performance of neural networks significantly. Additionally, it does not suffer from the vanishing gradient problem in the non-negative region [29]. Due to its universality and representativeness, ReLU was selected as the activation function for the MLP-Baseline.
From Figure 7A, it can be seen that there was some fluctuation in the value of the loss function during the training process, but at the same time, the whole was decreasing, indicating that the model fell into the locally optimal solution several times during the training process. The accuracy was only close to 64% after 2000 rounds of training, while the rate of loss function reduction decreased, indicating that subsequent training was more costly. The overall results indicated that the model did not fit the dataset well, and that it had the problem of falling into the locally optimal solution.
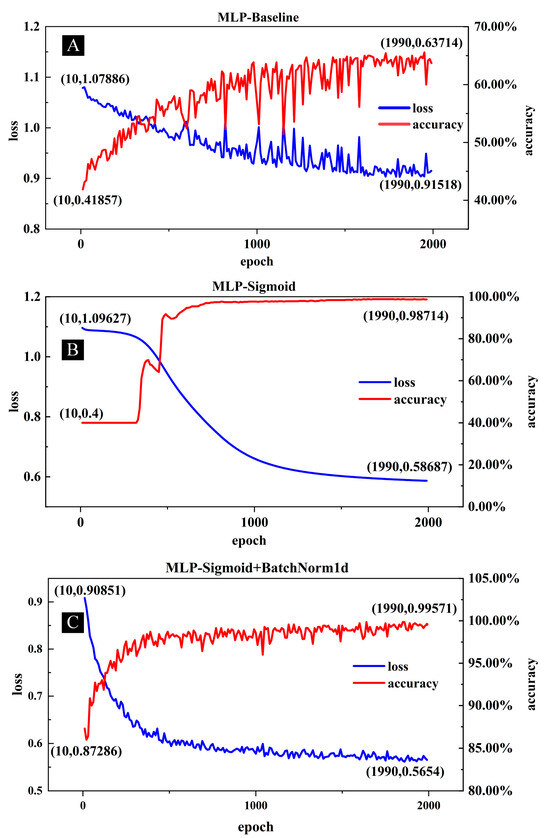
Figure 7.
Model loss function and accuracy data plots.
The experimental dataset falls within the range of [0, 100]. As such, the mapping of the ReLU activation function onto the dataset does not alter the overall characteristics of the data. In conjunction with the classification results, it becomes apparent that ReLU performs well in classifying broken lines that exhibit significant differences. However, ReLU lacks the capability to amplify data differences, thereby encountering difficulties in correctly classifying broken lines located near the edge.
3.4.2. Selection and Analysis of Sigmoid
To emphasize the significance of data differences during the calculation process, the sigmoid function was chosen as the activation function. Sigmoid is capable of performing nonlinear mapping on values of varying magnitudes. Additionally, its derivative is notably large near 0. Consequently, the value in the dataset was scaled down by a factor of 100, transforming it from the range of [0, 100] to [0, 1]. With appropriate weights and biases, the three states can be mapped to regions exhibiting significant derivative discrepancies. For the slight water stress lines, a more substantial gap can be mapped compared to the previous model, resulting in an improved classification performance.
From Figure 7B, it can be seen that the loss function was a smooth and steadily declining curve, which proved that the previous situation of falling into the locally optimal solution several times was solved. It could also be seen that the rate of the decline of the loss function was already low before the end of training, indicating that subsequent training cost more and yielded less. In addition, the 98.71% accuracy rate indicated that there was still a small portion of data for which it was difficult to obtain the desired classification. From the analysis of the activation function, we speculated that the gradient disappearance of the Sigmoid function left the loss function unable to decline after reaching a certain value.
Backpropagation with multilayer sigmoid bias on parameters:
As shown in Equation (9), for example, the backpropagation of the parameter b in the first layer needs to go through several activation function derivatives , the maximum derivative of the sigmoid is only 0.25, and the derivatives are near 0 except for the derivatives in [−5, 5], so it is prone to the gradient vanishing problem under this condition.
3.4.3. Selection and Analysis of BatchNorm1d
To address the issue of gradient vanishing associated with the sigmoid function, the MLP-Sigmoid + BatchNorm1d model was developed. BatchNorm1d works as follows:
As shown in Equation (9), E is the expected, Var is the variance, = 1, and = 0.
BatchNorm1d was added before the activation function of each layer to normalize the data, to ensure that the input variance of each layer could not grow too fast and to prevent the data distribution from gradually shifting closer to the upper or lower limits of sigmoid, thus ensuring the stability of the training [30].
From Figure 7C, it can be seen that the initial value of the loss function after adding BatchNorm1d was smaller. Meanwhile, the loss function dropped faster in the initial stage and essentially reached the limit position after the end of training. Compared to the other two models, the inclusion of BatchNorm1d results in faster training and improved performance. The accuracy rate surpasses 99.57%, indicating a substantial enhancement in classification capability.
4. Discussion
The prediction module was evaluated using testing set-1, and the evaluation module was assessed using testing set-2. The ultimate outcome indicates that all classifications were correct. There is a correlation between a single day’s data and the final results, but it does not imply causation. This becomes particularly challenging when dealing with weakly correlated data, such as a single day of light water stress, since it becomes difficult to assign labels.
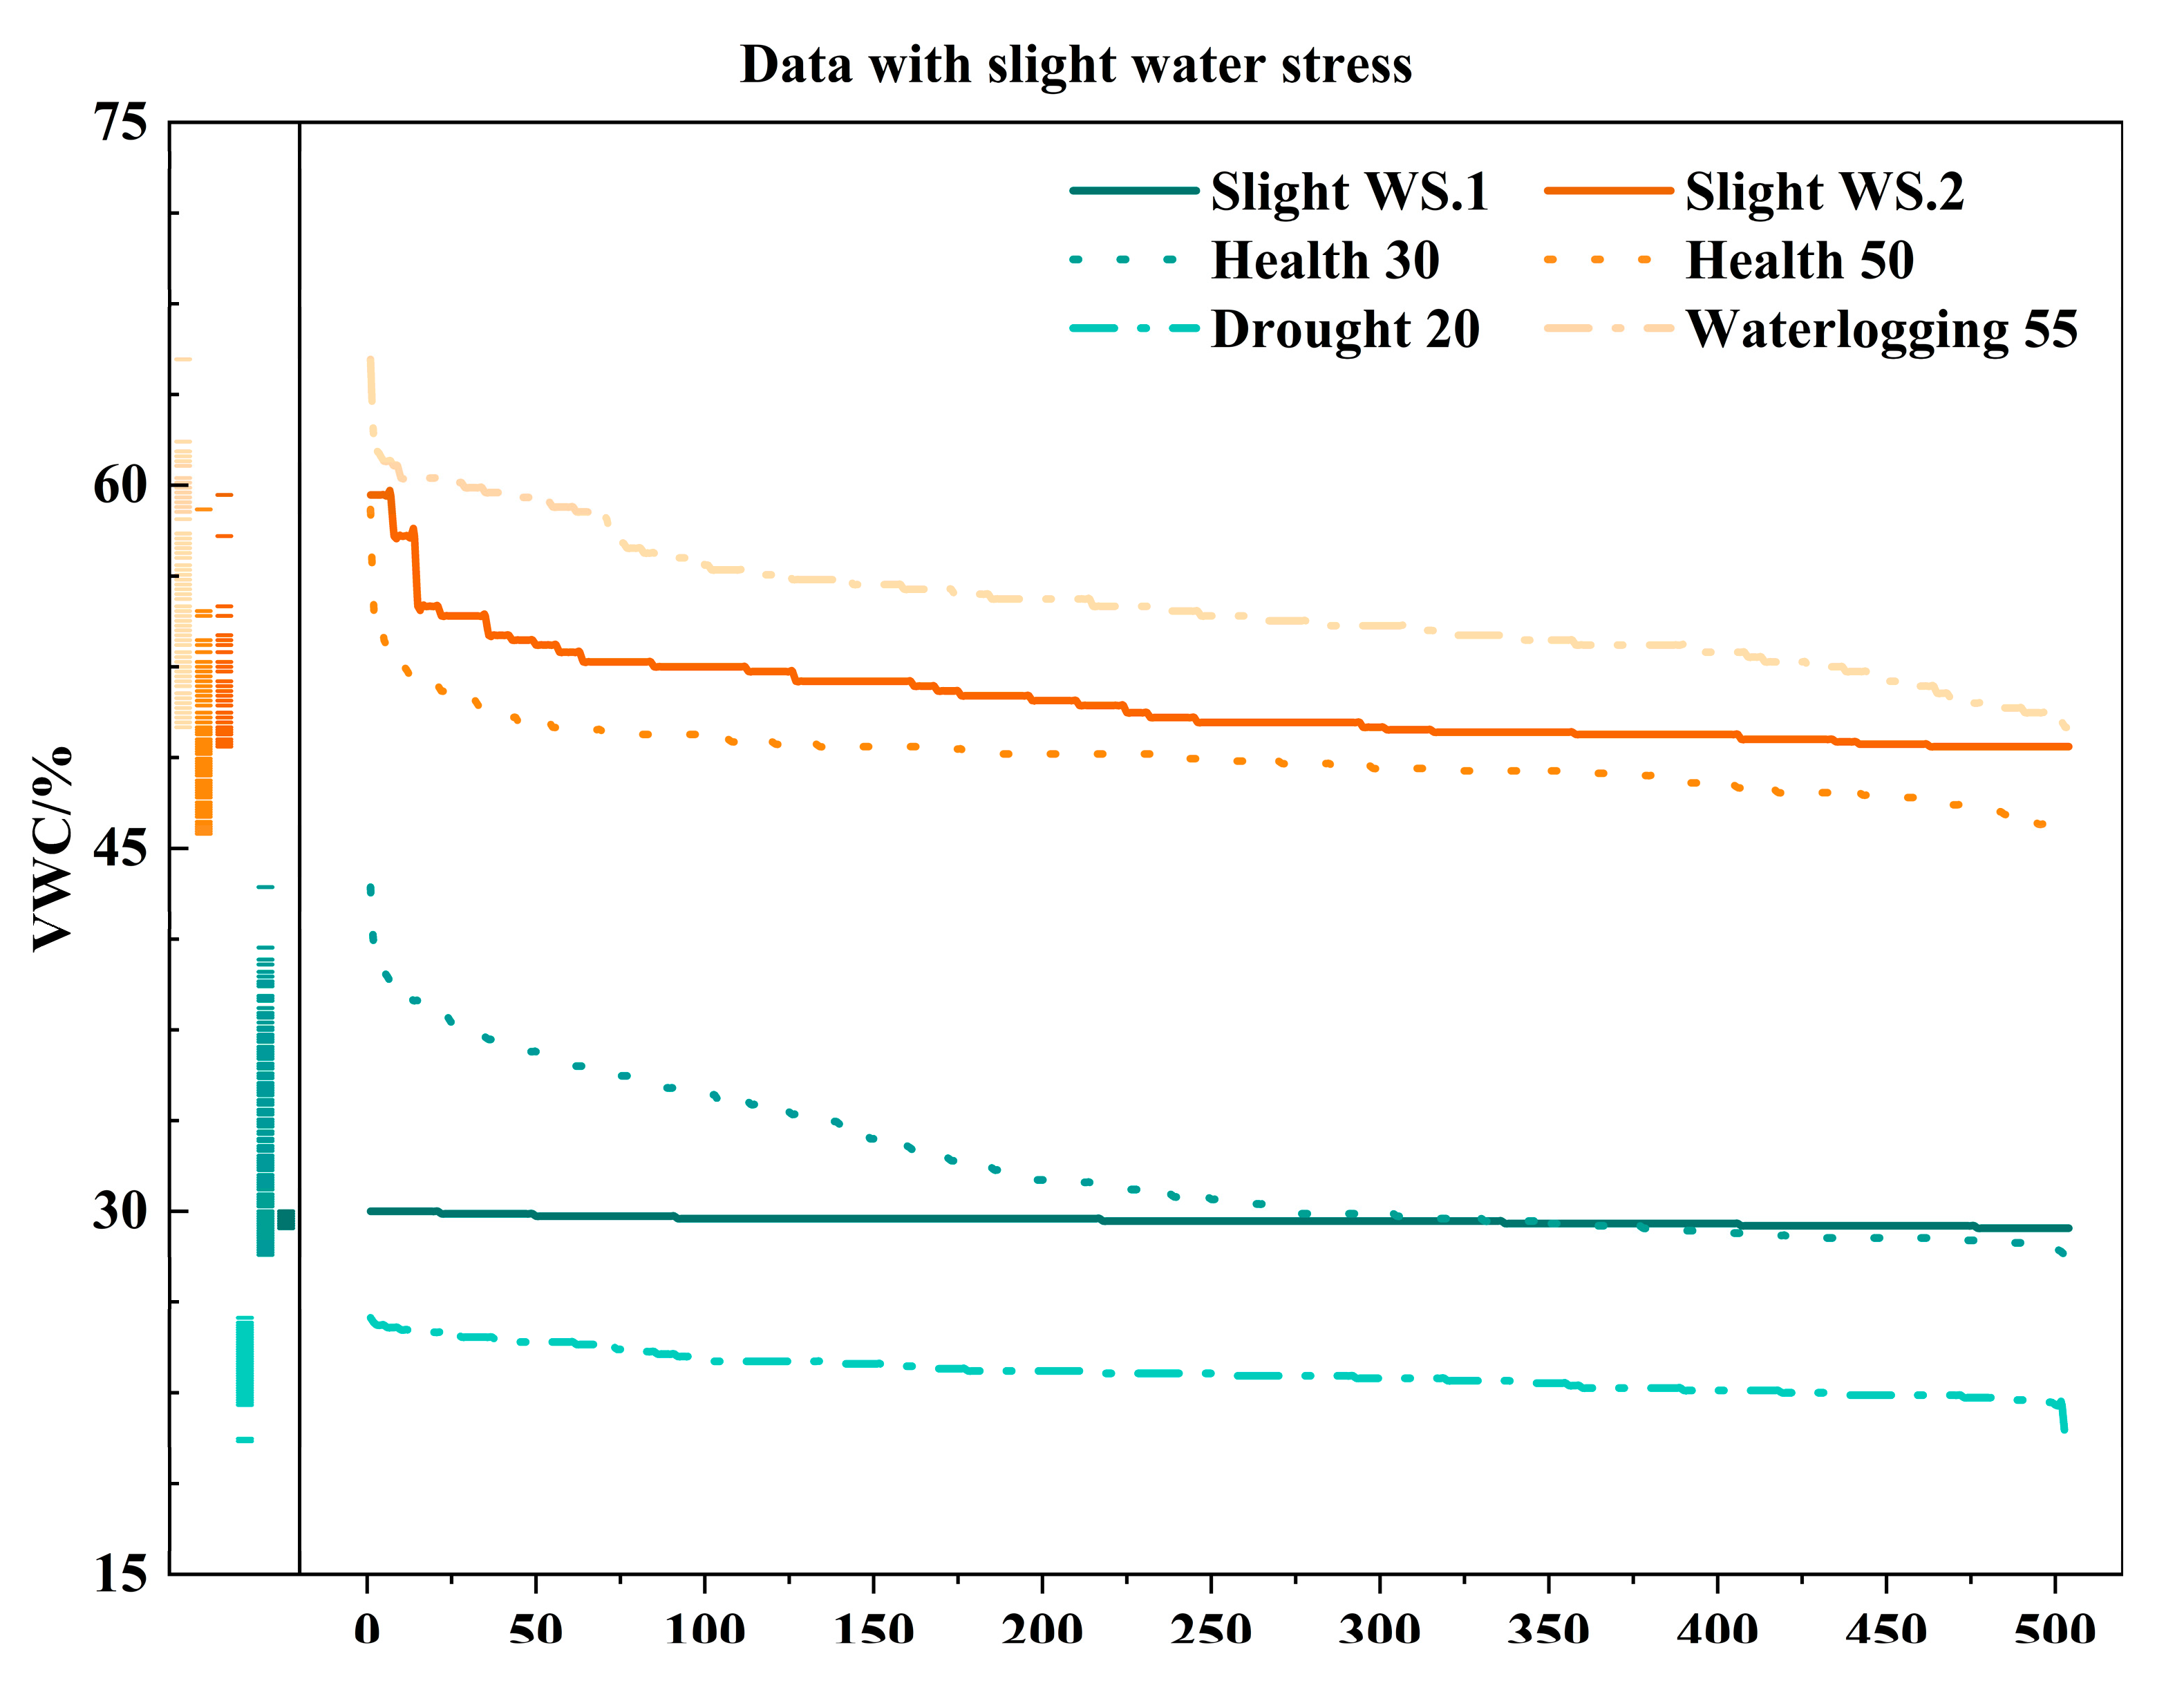
Therefore, we conducted two slight water stress experiments. Initially, we examined the two datasets with the highest and lowest health labels in the experimental dataset as references. Based on this, we set the VWC to within intervals greater than health and less than waterlogging, and greater than drought and less than health (according to the experimental results, we believed these two sets of experiments should fall within the range of mild water stress). Simultaneously, we irrigated multiple times to ensure VWC stability. After completing a day of data collection, the samples were fed into the prediction module for classification. VWC stability was maintained throughout, and after 7 days, the seedlings were retrieved to observe their actual growth status. The VWC data obtained from the experiments are depicted in Figure 8, with Slight WS.1 and Slight WS.2 representing the actual VWCs for two experiments.
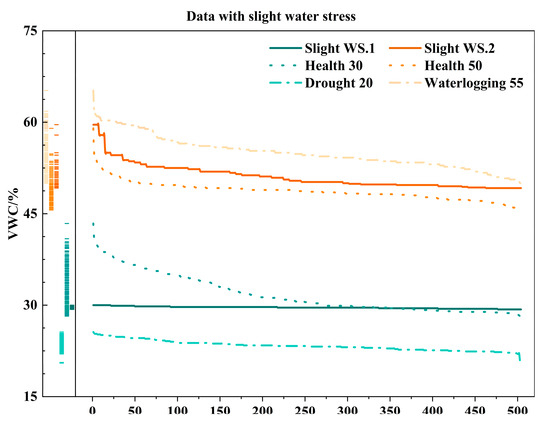
Figure 8.
VWC of slight water stress experiments.
As depicted in Figure 8, the Slight WS.1 line is situated around the middle of the boundary separating drought and health. The overall average value of this line does not exceed 30% and is closer in average value to the Drought 20 line. Similarly, the Slight WS.2 line is situated around the middle of the boundary separating waterlogging and health. The overall average value of this line exceeds 50%, but it is closer in average value to the Health 50 line.
The classification results of the slight water stress model are as follows:
For the Slight WS.1 line, the classification result is “health”, and the corresponding output probabilities are [0.9605512, 0.0377006, 0.00174821] for health, drought, and waterlogging, respectively.
For the Slight WS.1 line, the classification result is also “health”, and the corresponding output probabilities are [0.9273291, 0.00115577, 0.07151517] for health, drought, and waterlogging, respectively.
Numerically, the model exhibits high confidence in its classification results, with probabilities exceeding 90% for health. Moreover, the high confidence exhibited by the model further validates its accuracy and reliability.
Specific experimental results showed that the seedlings did not show relevant water stress symptoms, but they also clearly did not grow as well as in the optimal nursery interval. The experimental results showed that the seedling status was consistent with the model.
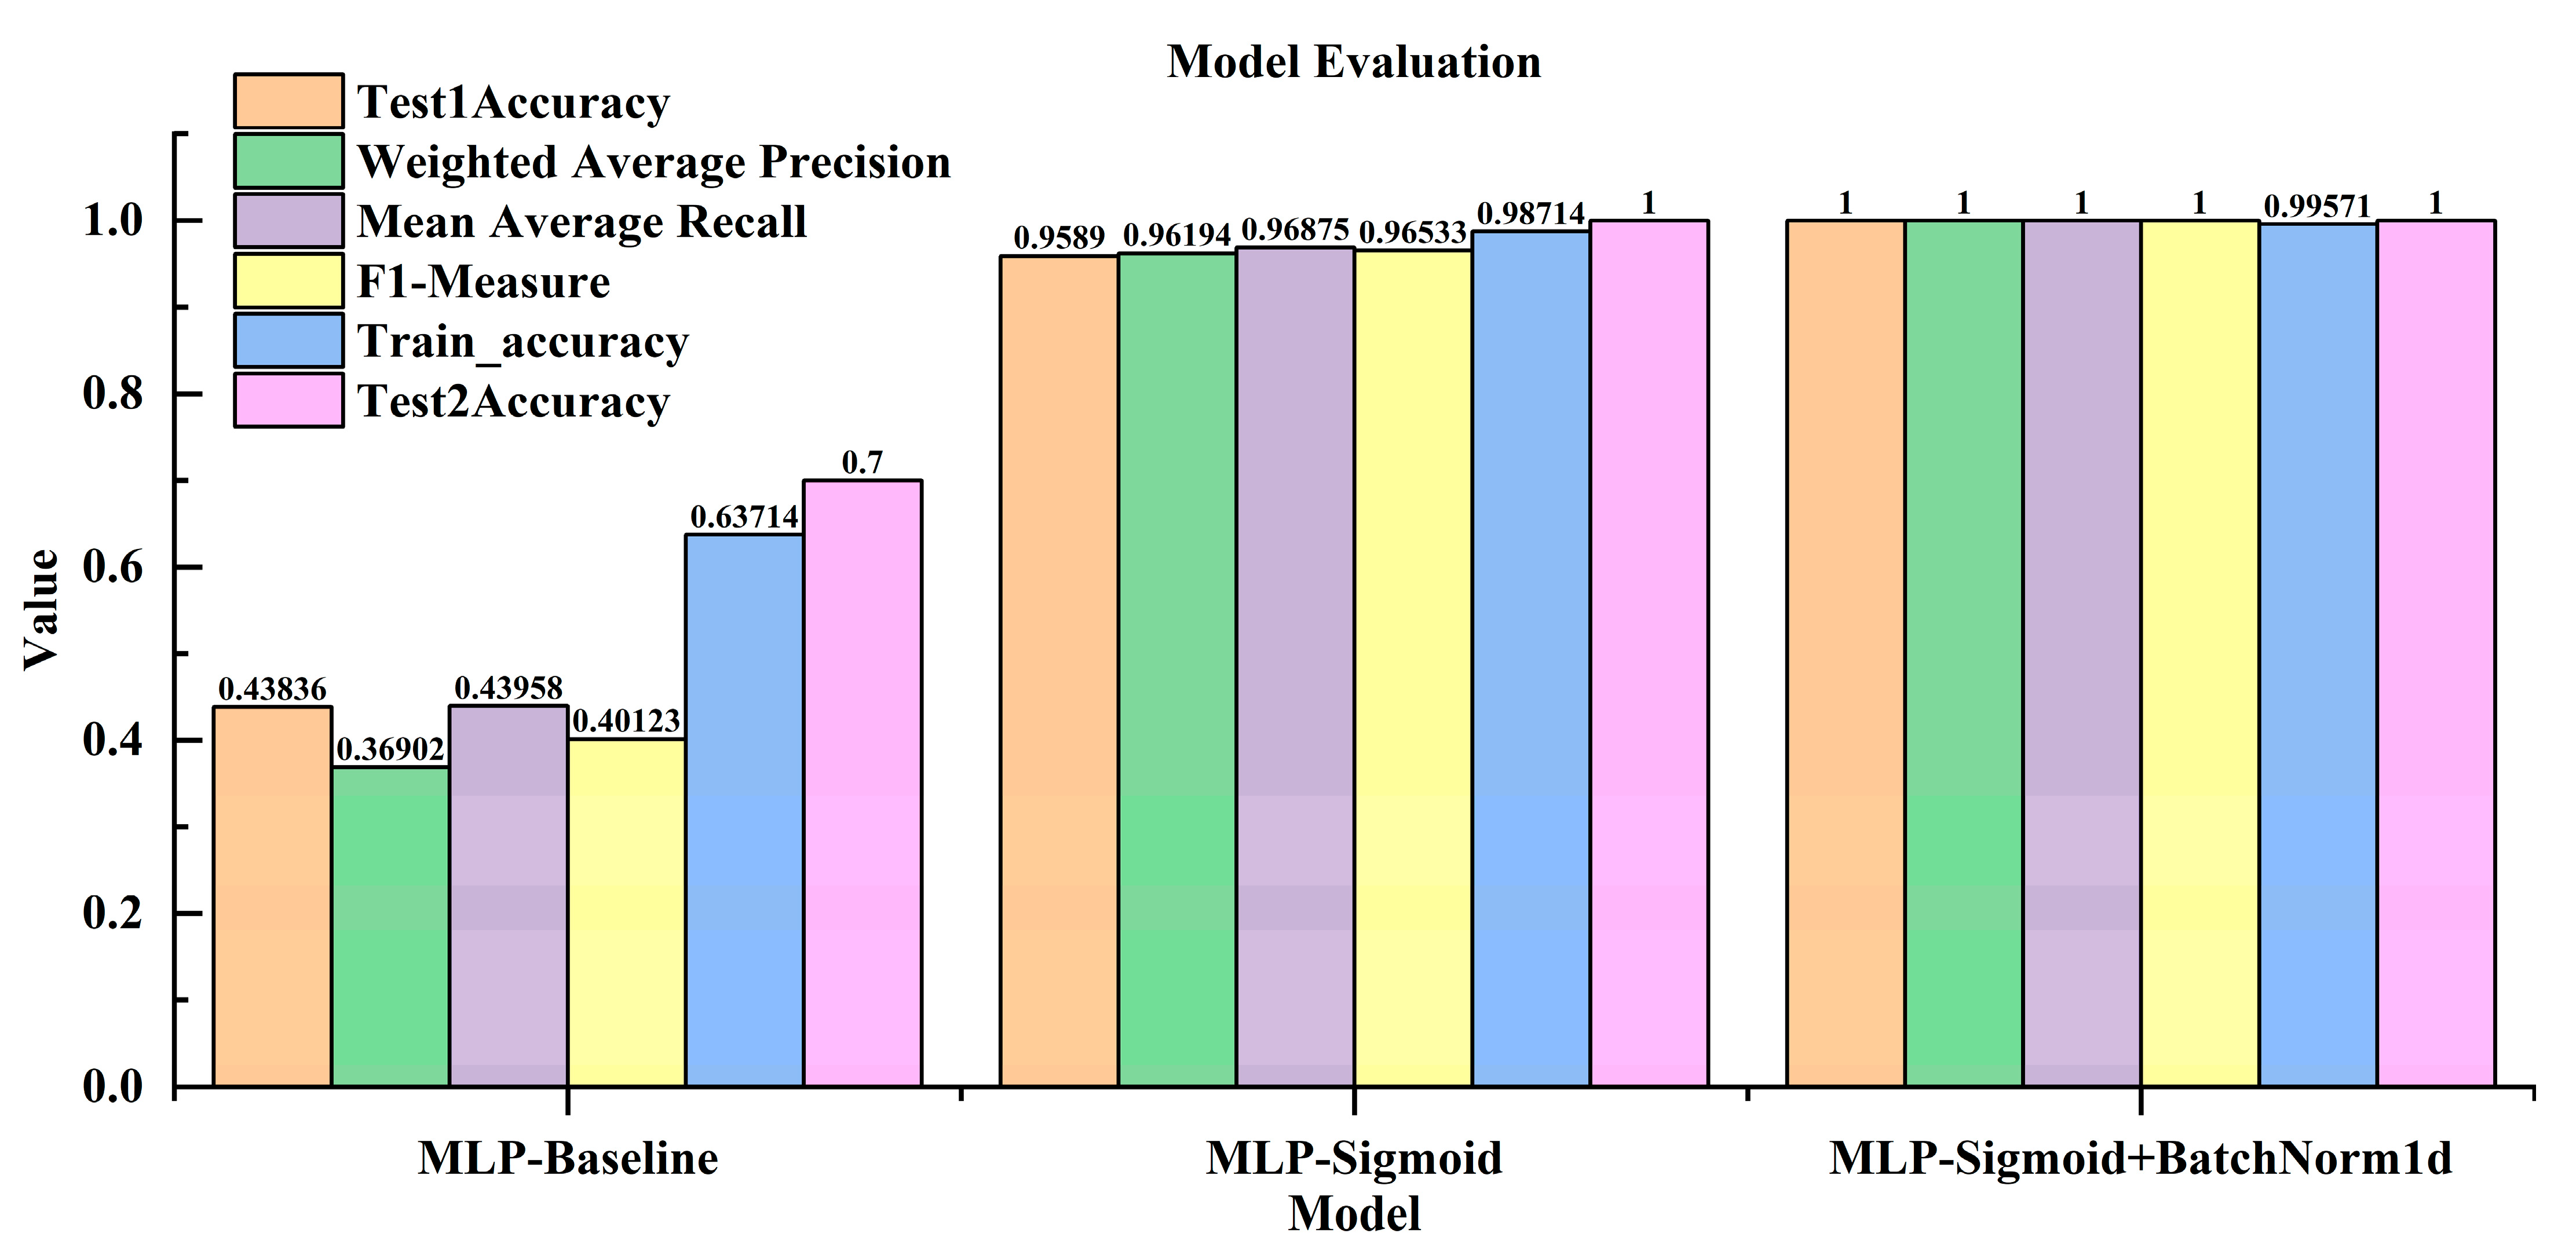
The models were evaluated based on accuracy, precision, recall, and F1 score [31]. In Figure 9, the orange and pink bars represent the accuracy of the two test sets. It can be observed that the accuracy of all the models in testing-set 2 is higher than that of testing-set 1. This indicates that the disparities in overall data features have an impact on the classification results. Furthermore, MLP-Sigmoid + BatchNorm1d shows greater improvements compared to MLP-Baseline, with improvements of over 50% and 30% in the two test sets, and significant improvements of 64%, 56%, and 59% in the weighted average accuracy, average recall rate, and F1 score. Overall, the final model achieves 100% correct classification for both test sets, validating the reliability of the evaluation and prediction module.
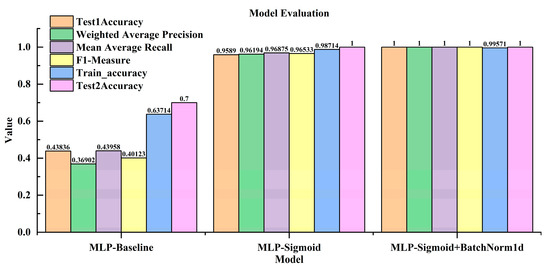
Figure 9.
Evaluation results of each model.
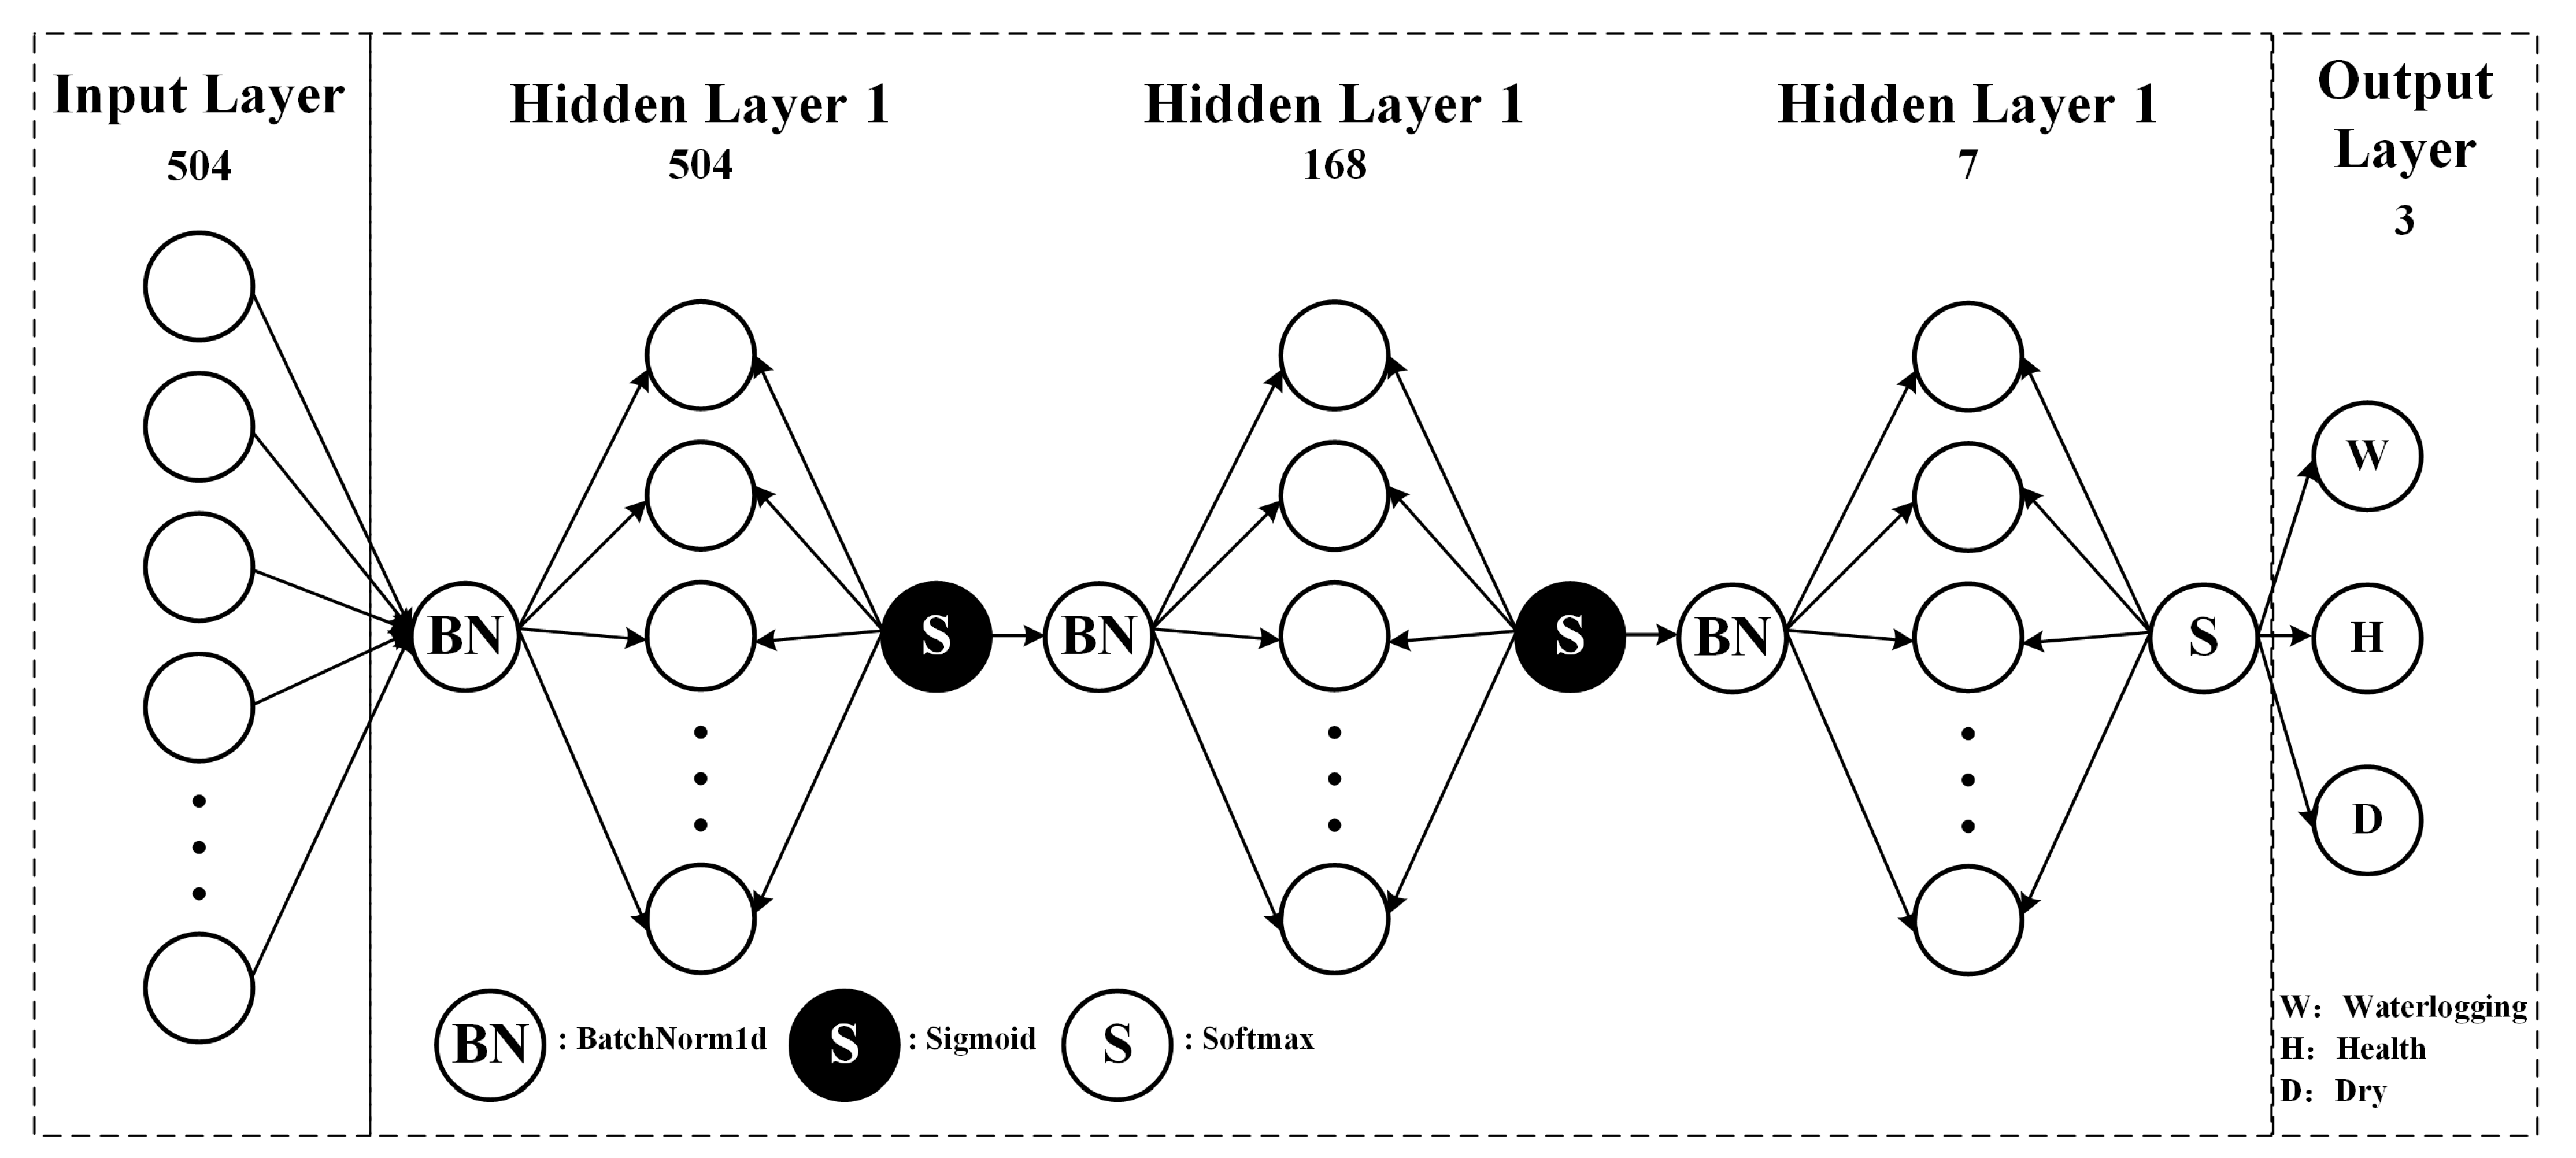
Figure 10 illustrates the architecture of the final model, which is an MLP model comprising three hidden layers. The input layer consists of 504 neurons, while each hidden layer consists of 504, 168, and 7 neurons, respectively. The activation function used in the first two hidden layers is sigmoid, while the final layer utilizes the softmax function, as required by a multi-classification model. Each layer’s activation function is preceded by a BatchNorm1d function. The final learning rate is 0.001, with a momentum of 0.9, and a batch size of 35.
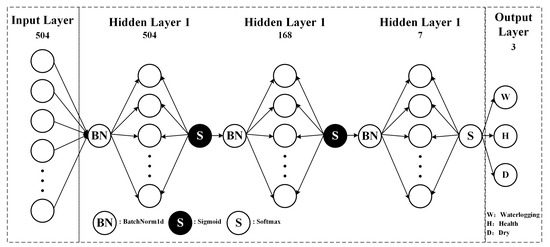
Figure 10.
MLP-Sigmoid + BatchNorm1d structural drawing.
5. Conclusions
In this study, a system comprising monitoring, evaluation, and prediction functions was designed to enhance the quality of seedling cultivation and effectively manage water stress. Through various gradient water stress experiments on citrus seedlings, we obtained 10 VWC lines and documented the corresponding changes. These observations demonstrated that short-term water stress led to alterations in the root system and chlorophyll content, emphasizing the need for an electronic monitoring system in seedling cultivation, mainly including the following:
- Healthy seedlings typically exhibited a predominantly white root system with a light yellow mature area. The roots possessed flexibility, and the root crown appeared round and full. Additionally, significant elongation and enlargement were observed in the elongation and meristem areas. In contrast, drought damage resulted in a dry and stiff root system characterized by white and light yellow coloration. The root crown became slender, with minimal extension and growth in the elongation and meristem areas. Moreover, drought-induced abscisic acid production led to the degradation of leaf chlorophyll. Waterlogging damage manifested as a flagging and mucous root system, exhibiting a black and dark color. The root crown became fragile and slender, with limited extension and enlargement in the elongation and meristem areas. The entire root system emitted an unpleasant odor.
- The optimal VWC for seedlings was [45%, 50%], while the boundary between drought and health was [20%, 25%], and the boundary between waterlogging damage and health was [50%, 55%].
This study involved conducting water stress experiments on citrus seedlings with varying gradients to explore the VWCs associated with different gradients of water stress. Furthermore, it aimed to develop a water stress monitoring, evaluation, and prediction system based on an improved MLP model. Through techniques such as data augmentation, class balancing, bootstrap sampling, and feature engineering, we expanded the training dataset, effectively enhancing the model’s generalization capability and the dataset’s effectiveness. Additionally, the model’s performance was validated through training data and experiments on slight water stress. Ultimately, the model demonstrated excellent performance in assessing the growth status of seedlings over the past 7 days and predicting their growth status 7 days ahead, achieving 100% accuracy in both cases with high confidence.
In conclusion, this study highlights the indispensability and practicality of employing electronic monitoring systems to mitigate the impact of minor water stress on citrus seedlings. Furthermore, the model demonstrates a high level of accuracy and reliability. Lastly, it is important to acknowledge the limitations of this study, which include the absence of energy consumption optimization for the overall monitoring network nodes and the failure to explore the maximum number of seedlings that can be monitored by a single node. Furthermore, we believe it is necessary to further enhance the applicability of such agricultural electronic systems. Research efforts could be directed toward utilizing distributed systems like Spark to improve hardware utilization and the system processing speed. To enhance the practicality of the electronic monitoring system, addressing these issues is crucial and should be a focus of future research.
Author Contributions
Q.D., Z.C., Z.L., S.S., X.X., S.L., Y.W. and Y.G. conceived and planned the experiments and edited the final version of the manuscript. Experimental setup, field data acquisition, and data processing were handled by Q.D. and Z.C. All authors have read and agreed to the published version of the manuscript.
Funding
This research was funded by the National Natural Science Foundation of China, grant no. 31971797. It was also partly supported by the China Agriculture Research System of the MOF and MARA, grant no. CARS-26, and the Guangdong Provincial Special Fund for Modern Agriculture Industry Technology Innovation Teams, grant no. 2023KJ108. The recipients of these three funds are Zhen Li.
Data Availability Statement
Data are contained within the article.
Conflicts of Interest
The authors declare no conflicts of interest.
References
- Chand, L.; Sharma, S.; Dalal, R.; Poonia, A.K. In vitro shoot tip grafting in citrus species-A review. Agric. Rev. 2013, 34, 279–287. [Google Scholar] [CrossRef]
- Rodríguez-Gamir, J.; Ancillo, G.; González-Mas, M.C.; Primo-Millo, E.; Iglesias, D.J.; Forner-Giner, M.A. Root signalling and modulation of stomatal closure in flooded citrus seedlings. Plant Physiol. Bioch. 2011, 49, 636–645. [Google Scholar] [CrossRef] [PubMed]
- Syvertsen, J.P.; Garcia-Sanchez, F. Multiple abiotic stresses occurring with salinity stress in citrus. Environ. Exp. Bot. 2014, 103, 128–137. [Google Scholar] [CrossRef]
- Wu, Q.; Zou, Y.; Huang, Y. The arbuscular mycorrhizal fungus Diversispora spurca ameliorates effects of waterlogging on growth, root system architecture and antioxidant enzyme activities of citrus seedlings. Fungal Ecol. 2013, 6, 37–43. [Google Scholar] [CrossRef]
- Liu, C.Y.; Zheng, M.M.; Xiong, S.J.; Zeng, Q.H.; Liu, J.; Liu, G.D. Effects of flooding stress on morphological and physiological characteristics of ‘Newhall navel orange’/trifoliate orange seedlings. J. Fruit Trees 2019, 36, 1494–1504. [Google Scholar]
- Rodríguez-Gamir, J.; Primo-Millo, E.; Forner, J.B.; Forner-Giner, M.A. Citrus rootstock responses to water stress. Sci. Hortic. 2010, 126, 95–102. [Google Scholar] [CrossRef]
- Kosola, K.R.; Eissenstat, D.M. The fate of surface roots of citrus seedlings in dry soil. J. Exp. Bot. 1994, 45, 1639–1645. [Google Scholar] [CrossRef]
- Espeleta, J.F.; Eissenstat, D.M. Responses of citrus fine roots to localized soil drying: A comparison of seedlings with adult fruiting trees. Tree Physiol. 1998, 18, 113–119. [Google Scholar] [CrossRef] [PubMed]
- Zaher-Ara, T.; Boroomand, N.; Sadat-Hosseini, M. Physiological and morphological response to drought stress in seedlings of ten citrus. Trees 2016, 30, 985–993. [Google Scholar] [CrossRef]
- Raghavendra, A.S.; Gonugunta, V.K.; Christmann, A.; Grill, E. ABA perception and signalling. Trends Plant Sci. 2010, 15, 395–401. [Google Scholar] [CrossRef]
- Iglesias, D.J.; Cercós, M.; Colmenero-Flores, J.M.; Naranjo, M.A.; Ríos, G.; Carrera, E.; Ruiz-Rivero, O.; Lliso, I.; Morillon, R.; Tadeo, F.R. Physiology of citrus fruiting. Braz. J. Plant Physiol. 2007, 19, 333–362. [Google Scholar] [CrossRef]
- Munné-Bosch, S.; Alegre, L. Die and let live: Leaf senescence contributes to plant survival under drought stress. Funct. Plant Biol. 2004, 31, 203–216. [Google Scholar] [CrossRef] [PubMed]
- Roopaei, M.; Rad, P.; Choo, K.R. Cloud of things in smart agriculture: Intelligent irrigation monitoring by thermal imaging. IEEE Cloud Comput. 2017, 4, 10–15. [Google Scholar] [CrossRef]
- Fares, A.; Alva, A.K. Evaluation of capacitance probes for optimal irrigation of citrus through soil moisture monitoring in an entisol profile. Irrig. Sci. 2000, 19, 57–64. [Google Scholar] [CrossRef]
- Rusu, C.; Krozer, A.; Johansson, C.; Ahrentorp, F.; Pettersson, T.; Jonasson, C.; Rösevall, J.; Ilver, D.; Terzaghi, M.; Chiatante, D. Miniaturized wireless water content and conductivity soil sensor system. Comput. Electron. Agr. 2019, 167, 105076. [Google Scholar] [CrossRef]
- Jin, C.H. Preliminary study on water requirement index of citrus. Southwest China J. Agric. Sci. 1988, 3, 4. Available online: https://www.cnki.com.cn/Article/CJFDTotal-XNYX198802003.htm (accessed on 10 March 2020).
- Matilla, D.M.; Murciego, A.L.; Jiménez-Bravo, D.M.; Mendes, A.S.; Leithardt, V.R. Low-cost Edge Computing devices and novel user interfaces for monitoring pivot irrigation systems based on Internet of Things and LoRaWAN technologies. Biosyst. Eng. 2022, 223, 14–29. [Google Scholar] [CrossRef]
- Williams, M.L.; James, W.P.; Rose, M.T. Variable segmentation and ensemble classifiers for predicting dairy cow behaviour. Biosyst. Eng. 2019, 178, 156–167. [Google Scholar] [CrossRef]
- Krisnawijaya, N.N.K.; Tekinerdogan, B.; Catal, C.; van der Tol, R. Data analytics platforms for agricultural systems: A systematic literature review. Comput. Electron. Agr. 2022, 195, 106813. [Google Scholar] [CrossRef]
- Melnyk, C.W.; Meyerowitz, E.M. Plant grafting. Curr. Biol. 2015, 25, R183–R188. [Google Scholar] [CrossRef] [PubMed]
- Hussain, S.; Curk, F.; Anjum, M.A.; Pailly, O.; Tison, G. Performance evaluation of common clementine on various citrus rootstocks. Sci. Hortic. 2013, 150, 278–282. [Google Scholar] [CrossRef]
- Forner-Giner, M.A.; Continella, A.; Grosser, J.W. Citrus rootstock breeding and selection. In The Citrus Genome; Springer: Cham, Switzerland, 2020; pp. 49–74. [Google Scholar]
- Kang, S.; van Iersel, M.W.; Kim, J. Plant root growth affects FDR soil moisture sensor calibration. Sci. Hortic. 2019, 252, 208–211. [Google Scholar] [CrossRef]
- Wang, K.; Li, W.; Deng, L.; Lyu, Q.; Zheng, Y.; Yi, S.; Xie, R.; Ma, Y.; He, S. Rapid detection of chlorophyll content and distribution in citrus orchards based on low-altitude remote sensing and bio-sensors. Int. J. Agric. Biol. Eng. 2018, 11, 164–169. [Google Scholar] [CrossRef]
- Savla, A.; Israni, N.; Dhawan, P.; Mandholia, A.; Bhadada, H.; Bhardwaj, S. Survey of classification algorithms for formulating yield prediction accuracy in precision agriculture. In Proceedings of the 2015 International Conference on Innovations in Information, Embedded and Communication Systems (ICIIECS), Coimbatore, India, 19–20 March 2015; IEEE: New York, NY, USA, 2015; pp. 1–7. [Google Scholar]
- Kotsiantis, S.B.; Zaharakis, I.D.; Pintelas, P.E. Machine learning: A review of classification and combining techniques. Artif. Intell. Rev. 2006, 26, 159–190. [Google Scholar] [CrossRef]
- Kotsiantis, S.B.; Zaharakis, I.; Pintelas, P. Supervised machine learning: A review of classification techniques. Emerg. Artif. Intell. Appl. Comput. Eng. 2007, 160, 3–24. [Google Scholar]
- Chauhan, V.K.; Dahiya, K.; Sharma, A. Problem formulations and solvers in linear SVM: A review. Artif. Intell. Rev. 2019, 52, 803–855. [Google Scholar] [CrossRef]
- Apicella, A.; Donnarumma, F.; Isgrò, F.; Prevete, R. A survey on modern trainable activation functions. Neural Netw. 2021, 138, 14–32. [Google Scholar] [CrossRef] [PubMed]
- Lubana, E.S.; Dick, R.; Tanaka, H. Beyond batchnorm: Towards a unified understanding of normalization in deep learning. Adv. Neural Inf. Process. Syst. 2021, 34, 4778–4791. [Google Scholar]
- Khan, H.; Haq, I.U.; Munsif, M.; Mustaqeem; Khan, S.U.; Lee, M.Y. Automated Wheat Diseases Classification Framework Using Advanced Machine Learning Technique. Agriculture 2022, 12, 1226. [Google Scholar] [CrossRef]


Disclaimer/Publisher’s Note: The statements, opinions and data contained in all publications are solely those of the individual author(s) and contributor(s) and not of MDPI and/or the editor(s). MDPI and/or the editor(s) disclaim responsibility for any injury to people or property resulting from any ideas, methods, instructions or products referred to in the content. |
© 2024 by the authors. Licensee MDPI, Basel, Switzerland. This article is an open access article distributed under the terms and conditions of the Creative Commons Attribution (CC BY) license (https://creativecommons.org/licenses/by/4.0/).