Article

Integrated Soil–Crop System Management Promotes Sustainability of Intensive Vegetable Production in Plastic Shed Systems: A Case Study in the Yangtze River Basin, China

1
Key Laboratory of Nutrient Cycling and Arable Land Conservation of Anhui Province, Soil and Fertilizer Institute, Anhui Academy of Agricultural Sciences, Hefei 230031, China
2
State Key Laboratory of Nutrient Use and Management (SKL-NUM), College of Resources and Environmental Sciences, National Academy of Agriculture Green Development, China Agricultural University, Beijing 100193, China
3
Interdisciplinary Research Center for Agriculture Green Development in Yangtze River Basin, College of Resources and Environment, Academy of Agricultural Sciences, Southwest University, Chongqing 400716, China
4
Hexian Soil Fertilizer Extension Service Station, Hexian 238201, China
5
Anhui Sierte Fertilizer Industry Co., Ltd., Ningguo 242300, China
*
Authors to whom correspondence should be addressed.
These authors contributed equally to the study.
Agronomy 2024, 14(4), 807; https://doi.org/10.3390/agronomy14040807
Submission received: 18 March 2024 / Revised: 5 April 2024 / Accepted: 8 April 2024 / Published: 12 April 2024
(This article belongs to the Special Issue Growth and Nutrient Management of Vegetables—2nd Edition)

Abstract

:
Excessive fertilizer input, low nutrient use efficiency, soil quality, and environmental degradation hinder greenhouse vegetable production. Integrated agronomic strategies of soil, crop, and nutrient management are needed to sharply improve the vegetable yield and simultaneously maintain sustainable production. A three-season field experiment was conducted from 2015 to 2018, aiming to evaluate the effect of integrated soil–crop system management (ISSM) on the agronomy, environment, and economy of greenhouse vegetable systems in the Yangtze River Basin, China. Three treatments were included in the experiment: (1) farmers’ current practice (FP), based on a local farmers’ survey; (2) soil remediation treatment (SR), the application of soil conditioner and compost fertilizer instead of chicken manure; (3) ISSM, a combination of soil conditioner, reducing plant density, and using formula fertilizer as well as increasing the fertilization times. The results indicated that ISSM (47.7 Mg ha−1) improved the pepper yield by 17% relative to farmers’ current practice (FP, 40.7 Mg ha−1). Soil remediation (SR), as a single approach, mainly made a contribution to improving the yield (by 6.9%) and nutrient use efficiency while reducing apparent nitrogen (N) losses. Higher yields were mainly attributed to increasing the fruit number per plant. On average, apparent N losses were reduced by 245 kg N ha−1 per season for ISSM compared to FP. In addition, higher net profits were obtained under SR and ISSM relative to FP. Overall, both SR and ISSM have advantages for the agronomy, environment, and economy in greenhouse vegetable production, but ISSM would be the optimal choice to achieve higher yields with lower environmental impacts.

1. Introduction

Vegetables are an important nutrition source for humans, e.g., essential vitamins, minerals, and dietary fiber [1,2]. With population growth and changes in dietary patterns, consumption of vegetables will continue to increase in the next few decades [3]. At present, China is the largest vegetable producer, accounting for 52% of the world’s vegetable production [4]. Especially, greenhouse vegetable production has been developing rapidly since the 1990s in China. By 2022, the planting area of greenhouse vegetables reached 2.6 million ha, with 33% vegetable production [5]. However, intensive greenhouse vegetable cultivation is characterized by a high fertilizer input [6,7], due to better economic benefits. In practice, in order to pursue a high yield, over-fertilization is a common practice in greenhouse systems, which causes low nutrient efficiency [8] and severe environmental impacts [9,10,11]. For example, the nitrogen (N) absorption of vegetables is less than 20% [12] and 10% [13] of the application amount in southern and northern greenhouse vegetable systems in China, respectively. In addition, soil degradation is also common in greenhouse systems, such as soil acidification, salinization [14,15], and soil C/N ratio decline [16]. So, how to improve the vegetable yield sharply and maintain sustainable production simultaneously is an urgent issue in greenhouse vegetable production.
Previously, most studies only focused on the effects of various nutrient management methods on the vegetable yields and environmental impacts. For instance, based on the N target value and soil nitrate test, the N recommendation decreased by 38% of the N2O emission following a decline of >60% in the N application rate [17]. Optimized N management could decrease the synthetic N input by 40% with a 39.6% lower N leaching loss [18]. Unfortunately, these individual methods rarely improve vegetable yields. Therefore, new technologies and management strategies are urgently needed to achieve “double-wins” in vegetable systems. For cereal crops, systematic management strategies have drawn more attention in recent years [19,20,21,22]. Integrated soil–crop system management (ISSM) based on a crop simulation model and field experiments, combined crop management (planting date, plant density, cultivar) and nutrient management (N fertilizer rate, fertilization stage), produced more crop yield and caused a lower environmental risk with less N input in cereal crop production in China [23,24]. However, the design of ISSM is based on the amount of fundamental studies, and these studies have been deficient for vegetables. Wang et al. [25] analyzed the yield gap of pepper and the main limiting factors in greenhouse production through a farmers’ survey in the Yangtze River Basin and found optimizing the crop (plant density) and nutrient management (e.g., fertilizer rate, ratio of base, and top dress) could close the yield gaps and mitigate the environmental impacts. However, the management methods based on farmers’ best practice hardly maintain sustainability, so there is still potential for further optimization.
Limited by a shallow and sparse root system [26], vegetable growth depends more on exogenous nutrient application. Following the “4R” fertilization principle (right rate, place, time, and source), optimal technologies and management practices must be designed to match the characteristics of crop nutrient demands, e.g., nutrient uptake rate and nutrient ratio at different stages under site-specific soil and climatic conditions [27]. Soil remediation could be considered to be an effective method to improve the physical and chemical properties of soil. By optimizing the rhizosphere microenvironment, soil remediation improved the vegetable yield and reduced the soil nutrient surplus [28,29]. Nevertheless, the appropriate plant density is a basis to make full use of solar radiation, water, and soil nutrients, and plays a key role in improving crop yields and nutrient use efficiency [30,31]. Meanwhile, soil quality is an important component to maintain sustainability in greenhouse vegetable systems.
Pepper (Capsicum annuum L.) is a dominant vegetable in greenhouse production in the Yangtze River Basin. Based on current studies, ISSM for vegetable was considered as a combination of soil remediation management (e.g., improving soil pH and soil organic carbon), crop management (e.g., changing plant density), and nutrient management (e.g., optimizing fertilizer rate, fertilization stage, fertilization times, ratio of nutrients) in this study. We hypothesized that ISSM could mitigate soil degradation and improve crop production (yield and nutrient use efficiency) with lower environmental impacts and promote sustainable pepper production in greenhouse systems in the Yangtze River Basin. Therefore, in this study, a three-season field experiment was conducted from 2015 to 2018 with the following objectives: (i) to examine the effects of ISSM on the pepper yield and nutrient use efficiency in greenhouse systems; (ii) to quantify the N losses in greenhouse pepper production; and (iii) to comprehensively evaluate the effects of ISSM on the agronomic, environmental, and economic impacts.

2. Materials and Methods

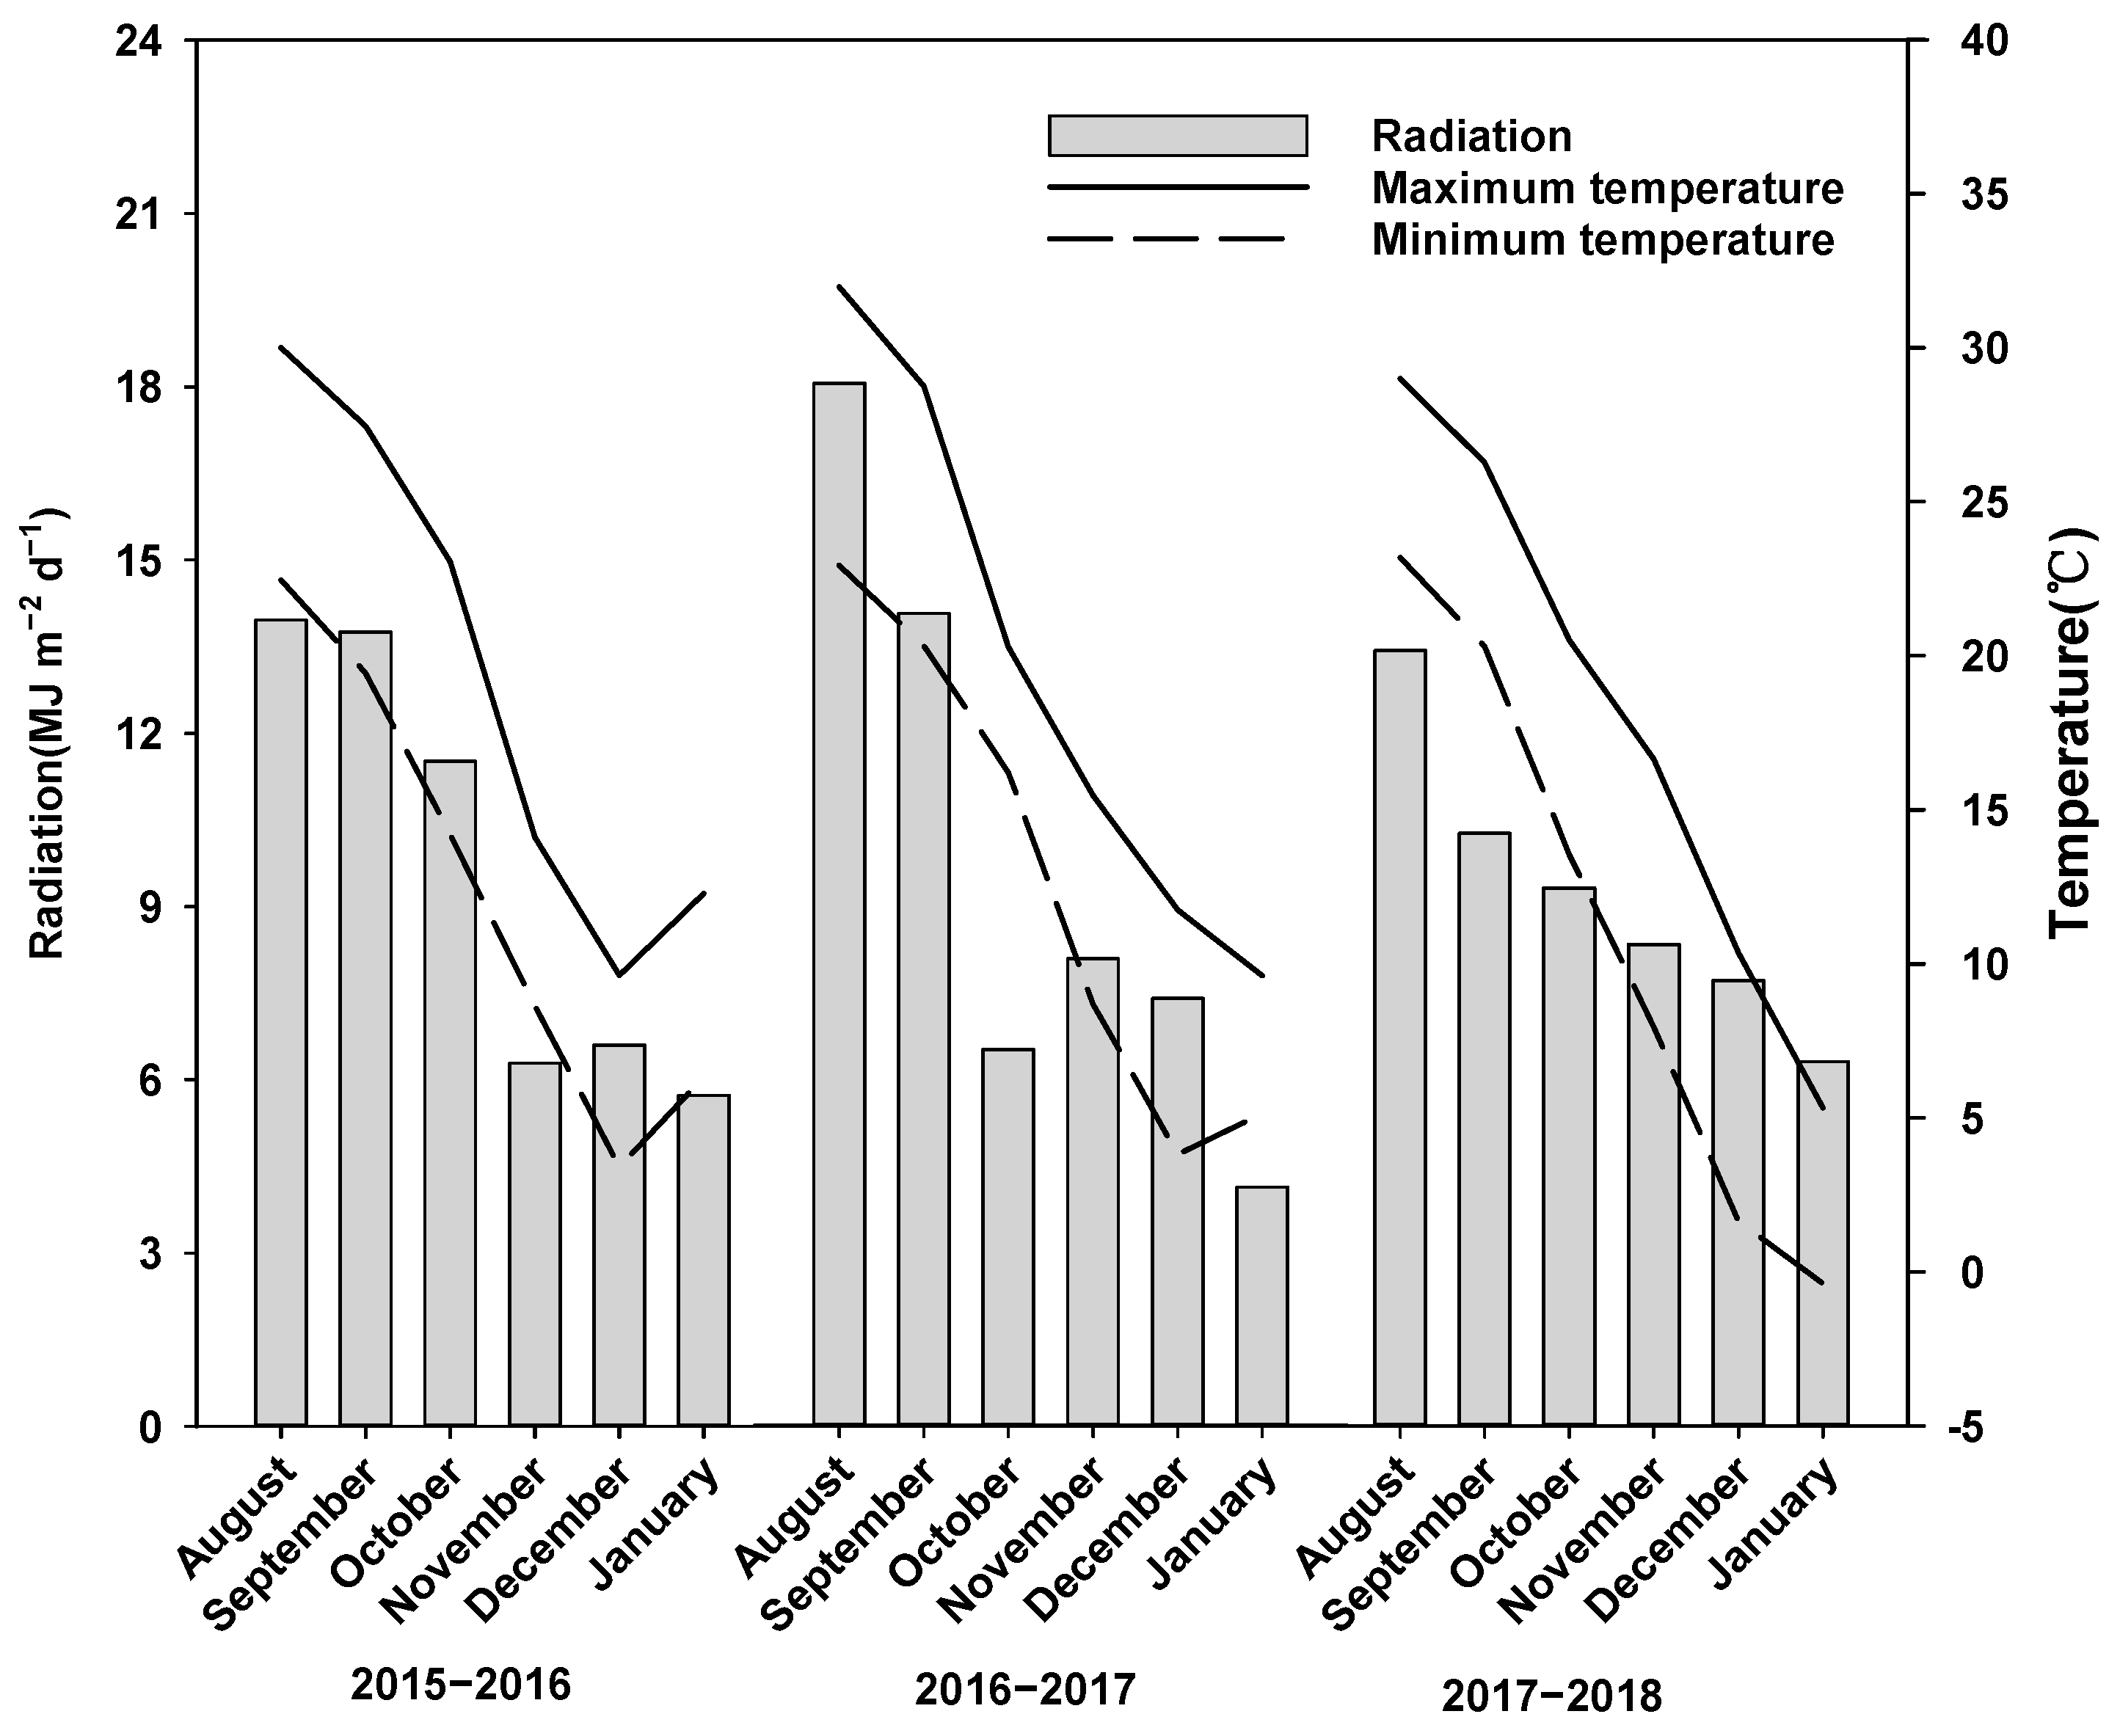
2.1. Site Description

The field experiment was conducted on a typical greenhouse vegetable field (31°46′ N, 118°22′ E, 10 m a.s.l.) in Hexian county, Anhui province, located in the lower reaches of the Yangtze River Basin, during the pepper-growing season (August to January in next year) from 2015 to 2018. The field was characterized by moisture soil (Typic fluvaquents, Etisols, U.S. classification) with 13.2% sand, 42.3% silt, and 44.5% clay, and the physicochemical properties of the topsoil (0–20 cm) before the experiment were as follows: bulk density 1.35 g cm−3, pH (1:2.5 w/v, H2O) 4.49, soil organic matter 20.8 g kg−1, total N 1.32 g kg−1, Olsen-P 257 mg kg−1, and NH4OAc-K 227 mg kg−1 (expressed on a soil air-dry weight basis). The climate of the research region belongs to subtropical monsoon, and the annual sum of precipitation and mean temperature of the region are 1276 mm and 17.7 ℃, respectively. The mean monthly solar radiation and maximum and minimum air temperature during the growing period are shown in Figure 1.

2.2. Experiment Design, Treatments, and Field Management

The field experiment was carried out in a completely randomized block design in the greenhouse, including three treatments with three replications. Each plot was 1.5 × 15 m in size with four rows, which were separated by a 0.5 m width furrow. Three treatments were as follows: (i) farmers’ current practice (FP), as a reference treatment following the same management practices with farmers, was designed following a previous survey of 160 local pepper farmers [25]; (ii) soil remediation treatment (SR), aiming at soil acidification and soil-borne disease, using calcium cyanamide as a soil disinfectant and conditioner [32]. Meanwhile, chicken manure was replaced with compost fertilizer to reduce the nutrient surplus, and the other management practices were the same as for FP; (iii) ISSM, based on the SR treatment, concerning the optimal crop and nutrient management, including decreasing the plant density by 15% [25], applying formula fertilizer, and changing the fertilization rate and times to satisfy the nutrient demands of pepper during the growth stage. In addition, slow-release N fertilizer was used to promote root growth at the seedling bed for a reduction in the basal nutrient input [33]. The detailed management methods of the different treatments are described by Wang [28] (Table 1).

2.3. Sampling and Measurements

At harvest, the pepper yield was measured continuously, with 32 plants in 4 rows at the center of each plot. At the early anthesis and harvest stage, two plants from each plot were taken for plant sample analysis (e.g., fruit number, single fresh fruit weight), and then separated into straw, leaf, and fruit. The harvest index (HI) was calculated as the ratio of the total yield to the total aboveground biomass on a dry mass basis [34].
For the analysis of the biomass and nutrient concentration, plant samples were dried in the oven at 75 °C until a constant weight. Total N concentration of the plant was measured by the Kjeldahl method [35]. An inductively coupled plasma optical emission spectroscopy (ICP-OES, OPTIMA 3300DV, Perkin-Elmer, Waltham, MA, USA) was used to measure the total P and K concentration of the plant. Before transplanting, eight seedlings were obtained for measuring the dry weight of the root, shoot, and stem diameter in the conventional nursery seedling (Covn) and controlled-release fertilizer nursery seedling (Crfn) treatment, respectively. The sound seedling index was an important index to indicate the strength of seedlings, which was calculated by the following formula [36]:
Sound seedling index = (Stem diameter/Plant length + Dry weight of roots/Dry weight of shoot) × Dry weight of whole plant
Before application of the basal fertilizer and after harvest, two random vertical soil cores (0–40 cm) were collected in each plot and were subdivided equally, namely in 0–20 cm and 20–40 cm. Mixed soil samples were put into polyethylene bags and were immediately brought back to the laboratory. Fresh composite soil samples were passed through a 2 or 5 mm sieve. Soil N H 4 + -N and N O 3 -N were extracted from subsamples with 0.01 M CaCl2 (soil: solution ratio, 1:10) for 1 h, and then the concentration was determined by a continuous flow analyzer (TRACS 2000 system, Bran and Luebbe, Norderstedt, Germany). Air-dried soil subsamples were used to determine pH (1:2.5 w/v, H2O) by a glass electrode and soil organic carbon by potassium dichromate (K2CrO2) oxidation and ferrous sulfate (FeSO4) titration [37]. Initial soil bulk densities of 0–20 cm and 20–40 cm were determined by steel cylinders of 100 cm3 volume.
Nutrient partial factor production (PFP) and nutrient production efficiency (NPE) are important indexes to indicate nutrient use efficiency. These indexes were calculated as follows [38,39]:
PFP = Yield/Nutrient input rate
NPE = Yield/Nutrient uptake rate
Apparent N losses were calculated by the following equation [40]:
Apparent N losses = (Nmin-preplant + Nchemical fertilizer + Nmanure) − (Nmin-harvest + Nuptake)
where Nmin-preplant and Nmin-harvest were soil Nmin in 0–40 cm depth before transplanting and after harvest, respectively. Nchemical fertilizer and Nmanure corresponded to the N input from the chemical fertilizer and manure, respectively. Nuptake was the N uptake in the shoot.

2.4. Analysis of Cost and Benefit

Data of the price and cost were collected from local farmers’ surveys conducted in 2015–2018. The income, cost, and net profit were calculated as follows:
Income = Mean pepper price × fresh pepper fruit yield
Cost = Direct cost + Indirect cost
Net profit = Income − Cost
In the above equation, the mean pepper price was the average value from 2015 to 2018, and the direct cost included the disbursement of seedling, fertilizer, pesticide, labor, mulch, and electric power, while the indirect cost included the depreciation of the structure of the greenhouse (plastic film, steel, and drip irrigation tape).

2.5. Data Statistical Analysis

To assess the effect of different treatments and seasons on the yield, yield component index, nursery seedling index, soil quality, and nutrient uptake, a one-way analysis of variance (ANOVA) was conducted. When the ANOVA was significant, multiple comparisons were performed using the Fisher Least Significant Difference (LSD) at p < 0.05 via the SPSS Statistics 23.0 software. Regression analysis and graphs were created by Sigmaplot 12.5 and Microsoft Excel 2016.

3. Results

3.1. Yield and Yield Components

The results indicated that the optimized treatment (SR and ISSM) significantly increased the fresh fruit yield (Table 2). Compared to FP (40.7 Mg ha−1), the mean seasonal yields in the three seasons were increased by 6.9% and 17%, respectively, for SR (43.5 Mg ha−1) and ISSM (47.7 Mg ha−1, Table 2). The variation was significant among seasons, especially in the 2016–2017 season, during which the yield was notably lower.
In the yield components, the fruit number per plant of SR was increased by 4.9% whilst ISSM increased by 30% relative to FP, on average (Table 2). The single fresh fruit weight (SFW) of SR and ISSM also showed an increasing trend, although these differences were not significant among different treatments. Meanwhile, ISSM (8.08 Mg ha−1) obtained the highest biomass, with an increase of 9.2% relative to FP (7.40 Mg ha−1), and SR (7.76 Mg ha−1) increased the biomass by 4.9% (Table 2). As shown in Table 2, there was also a significant difference in the harvest index (HI) among treatments, but it was only observed in the second season.

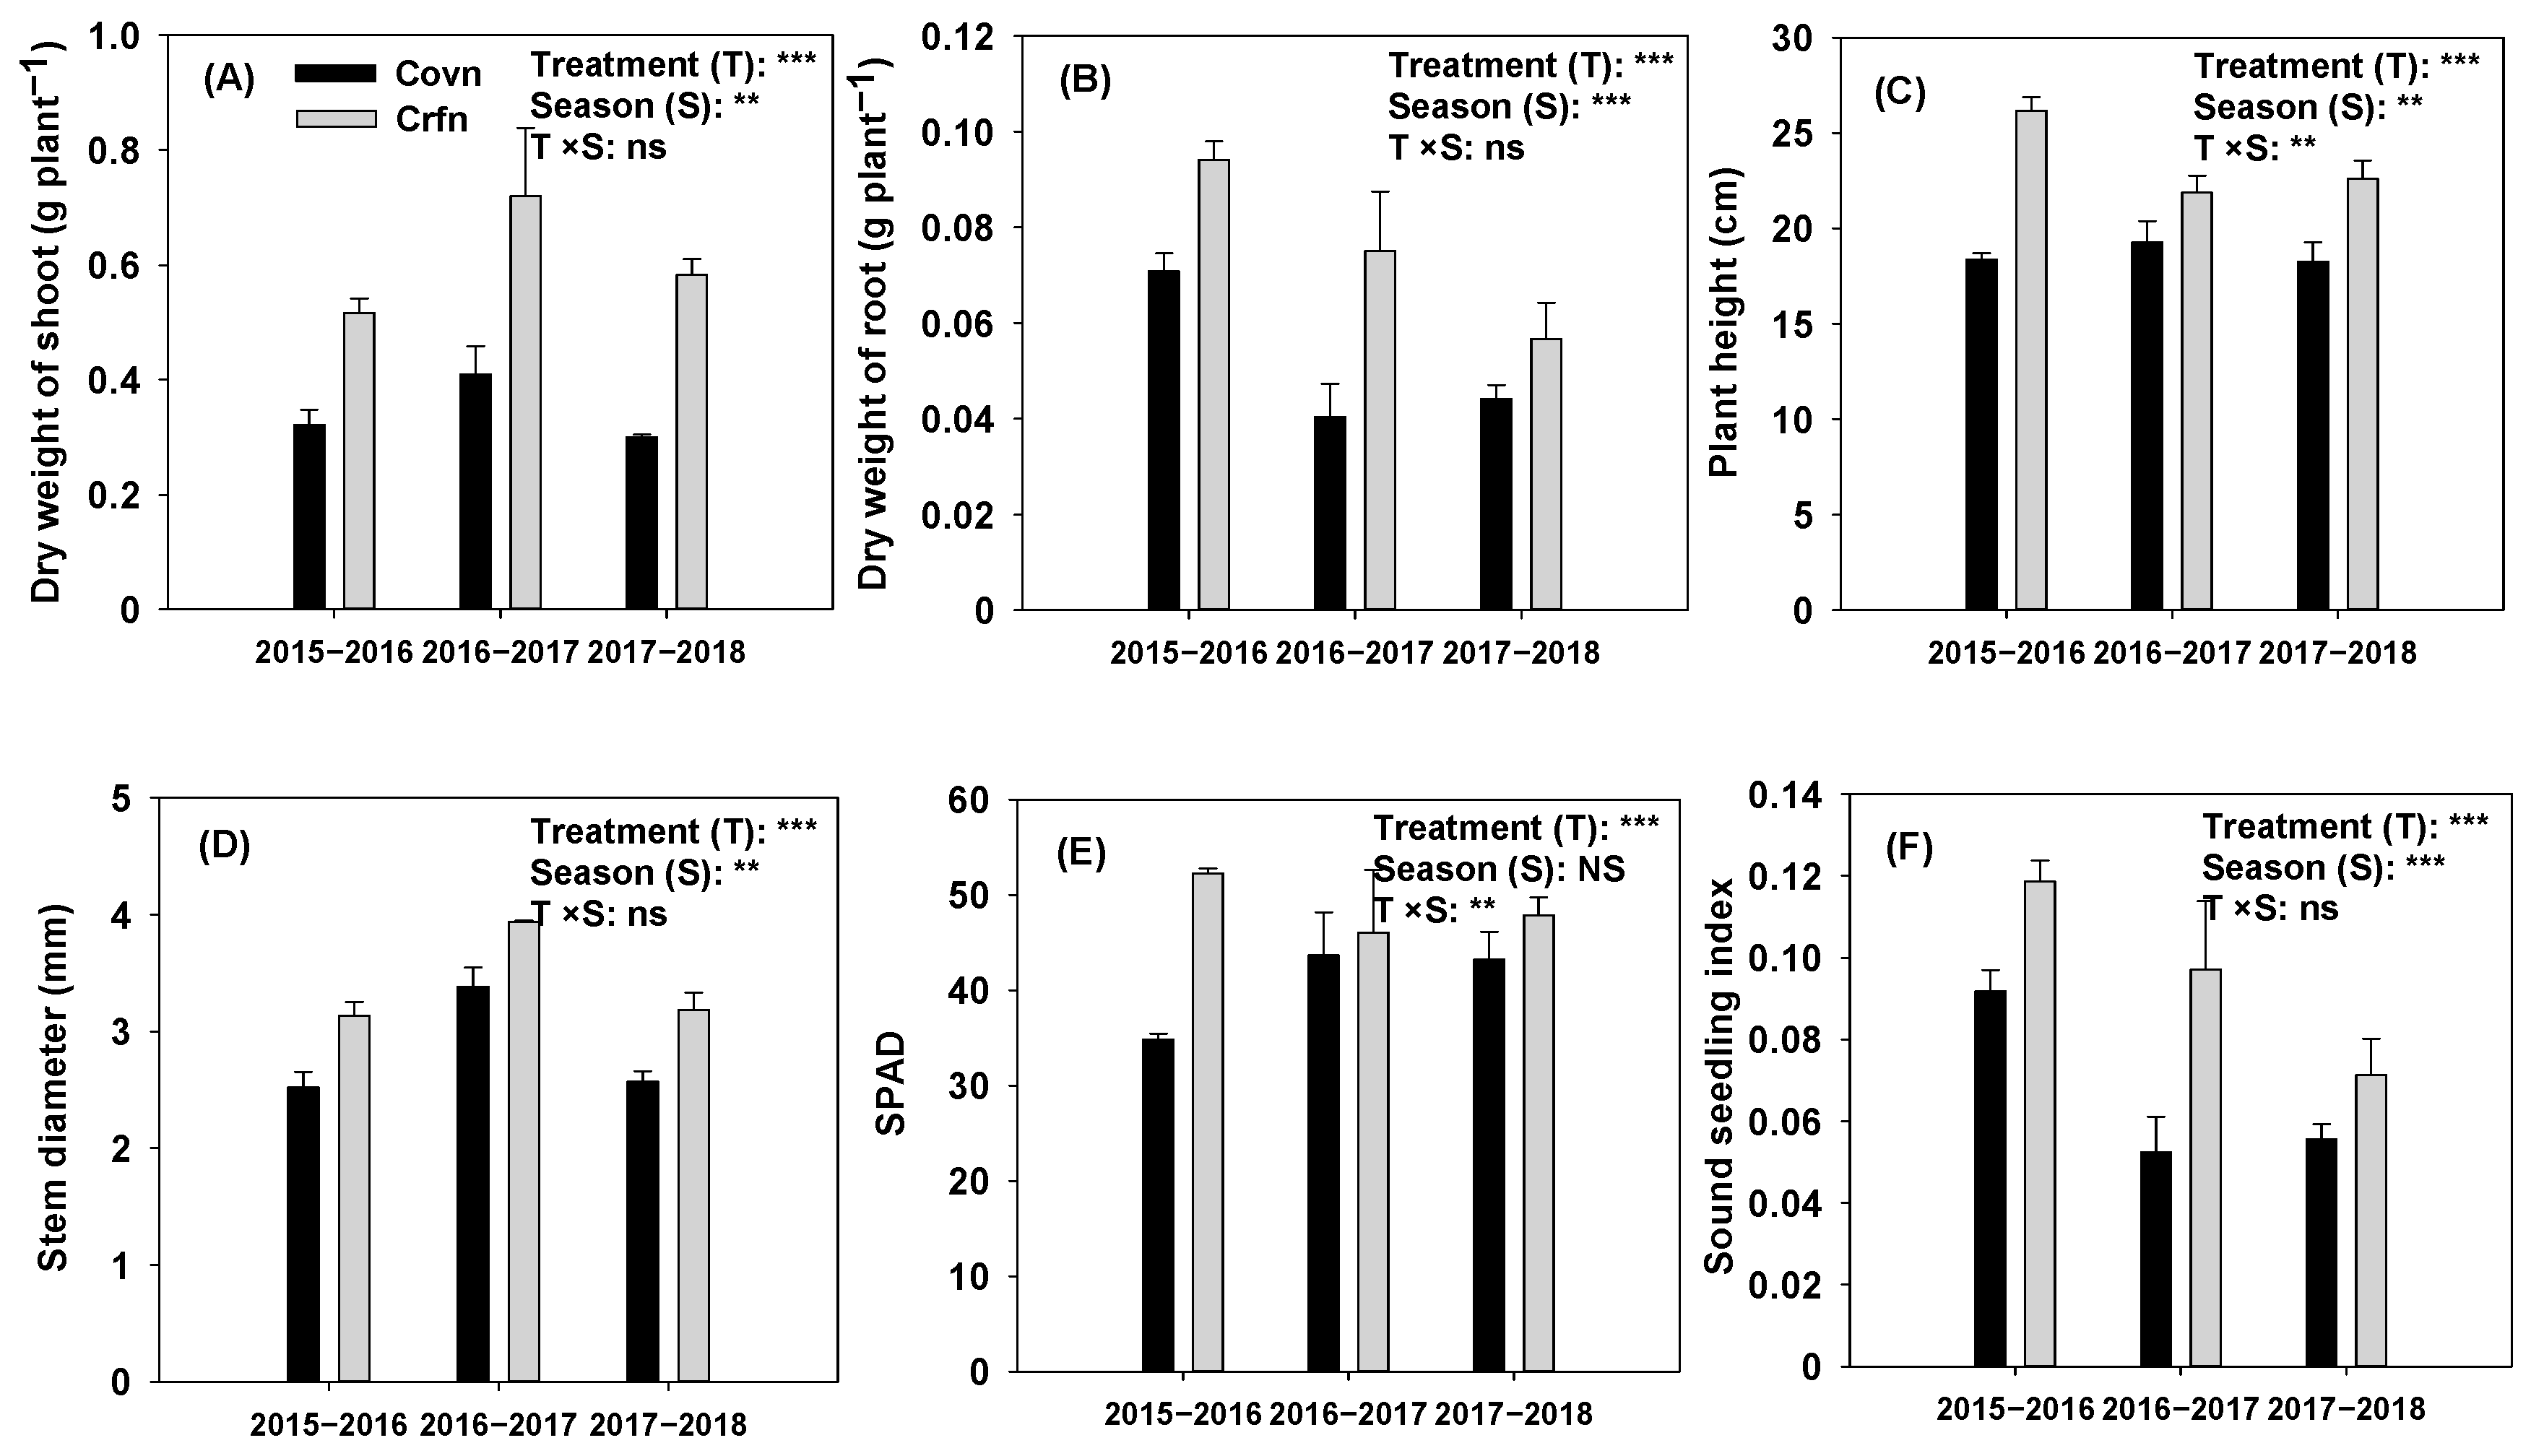
3.2. Seedling Growth and Sound Seedling Index

A better effect was obtained through the slow-release fertilizer nursery (Figure 2). Compared with the conventional nursery seedling treatment (Covn), the mean seasonal dry weight of the shoot and root were increased by 76% and 45%, respectively, following the slow-release fertilizer nursery seedling treatment (Figure 2A,B). Furthermore, the plant height, stem diameter, and SPAD of Crfn were 26%, 21%, and 20% higher than those of Covn, respectively (Figure 2C–E). The differences in these indexes reached significant levels among seasons, except for SPAD. As shown in Figure 2F, the sound seedling index of Crfn was 44% higher than that of Covn, which indicates that the seedlings of Crfn were stronger.

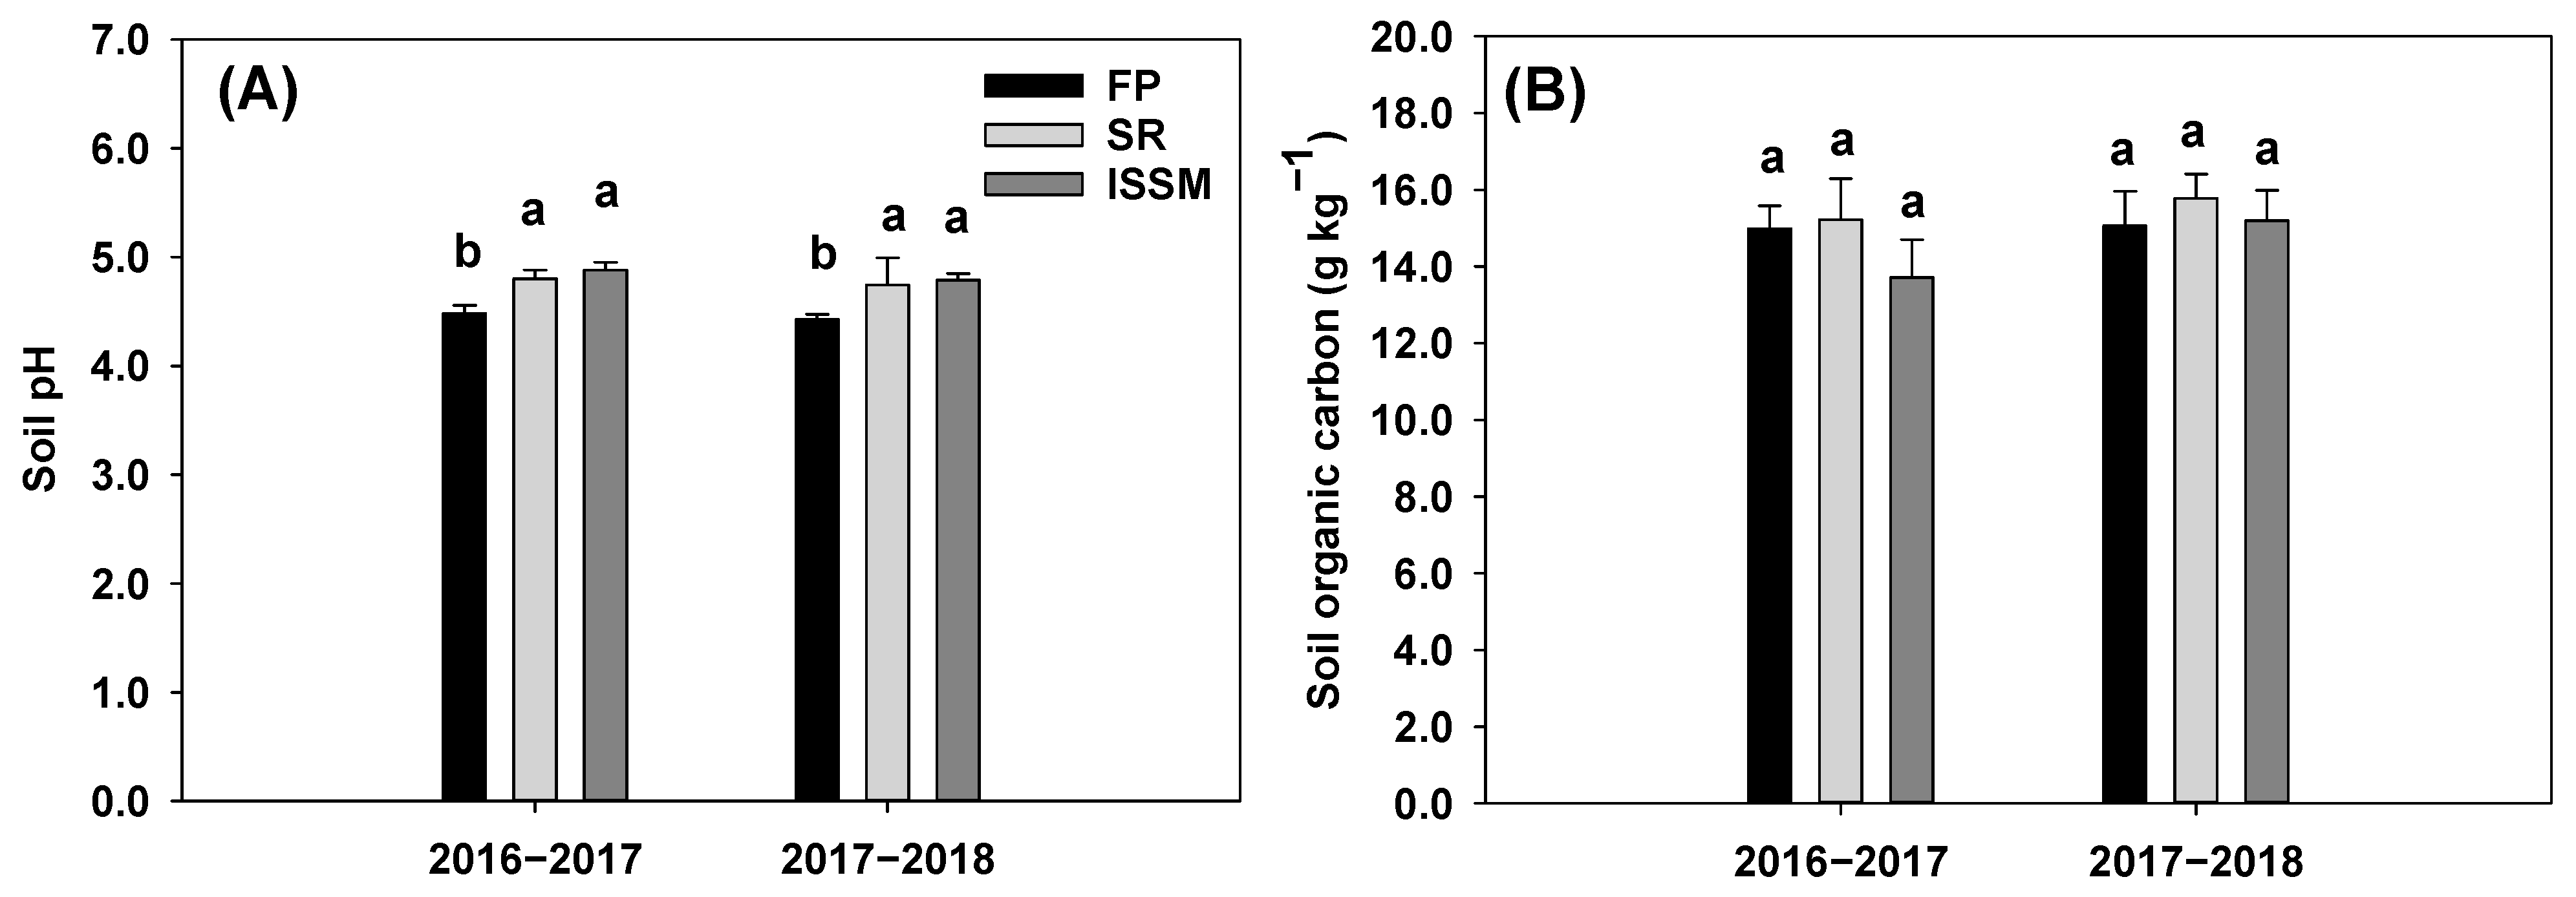
3.3. Soil pH and Soil Organic Carbon

As presented in Figure 3, applying soil remediation management (SR, ISSM) contributed to improving the soil pH. In the 2016–2017 and 2017–2018 seasons, compared to FP, the soil pH was increased by 0.31 to 0.39 units following SR and ISSM. However, the soil organic carbon rarely changed among treatments, ranging from 13.7 to 15.8 g C kg−1 air-dry soil, and a significant difference was not shown between seasons.

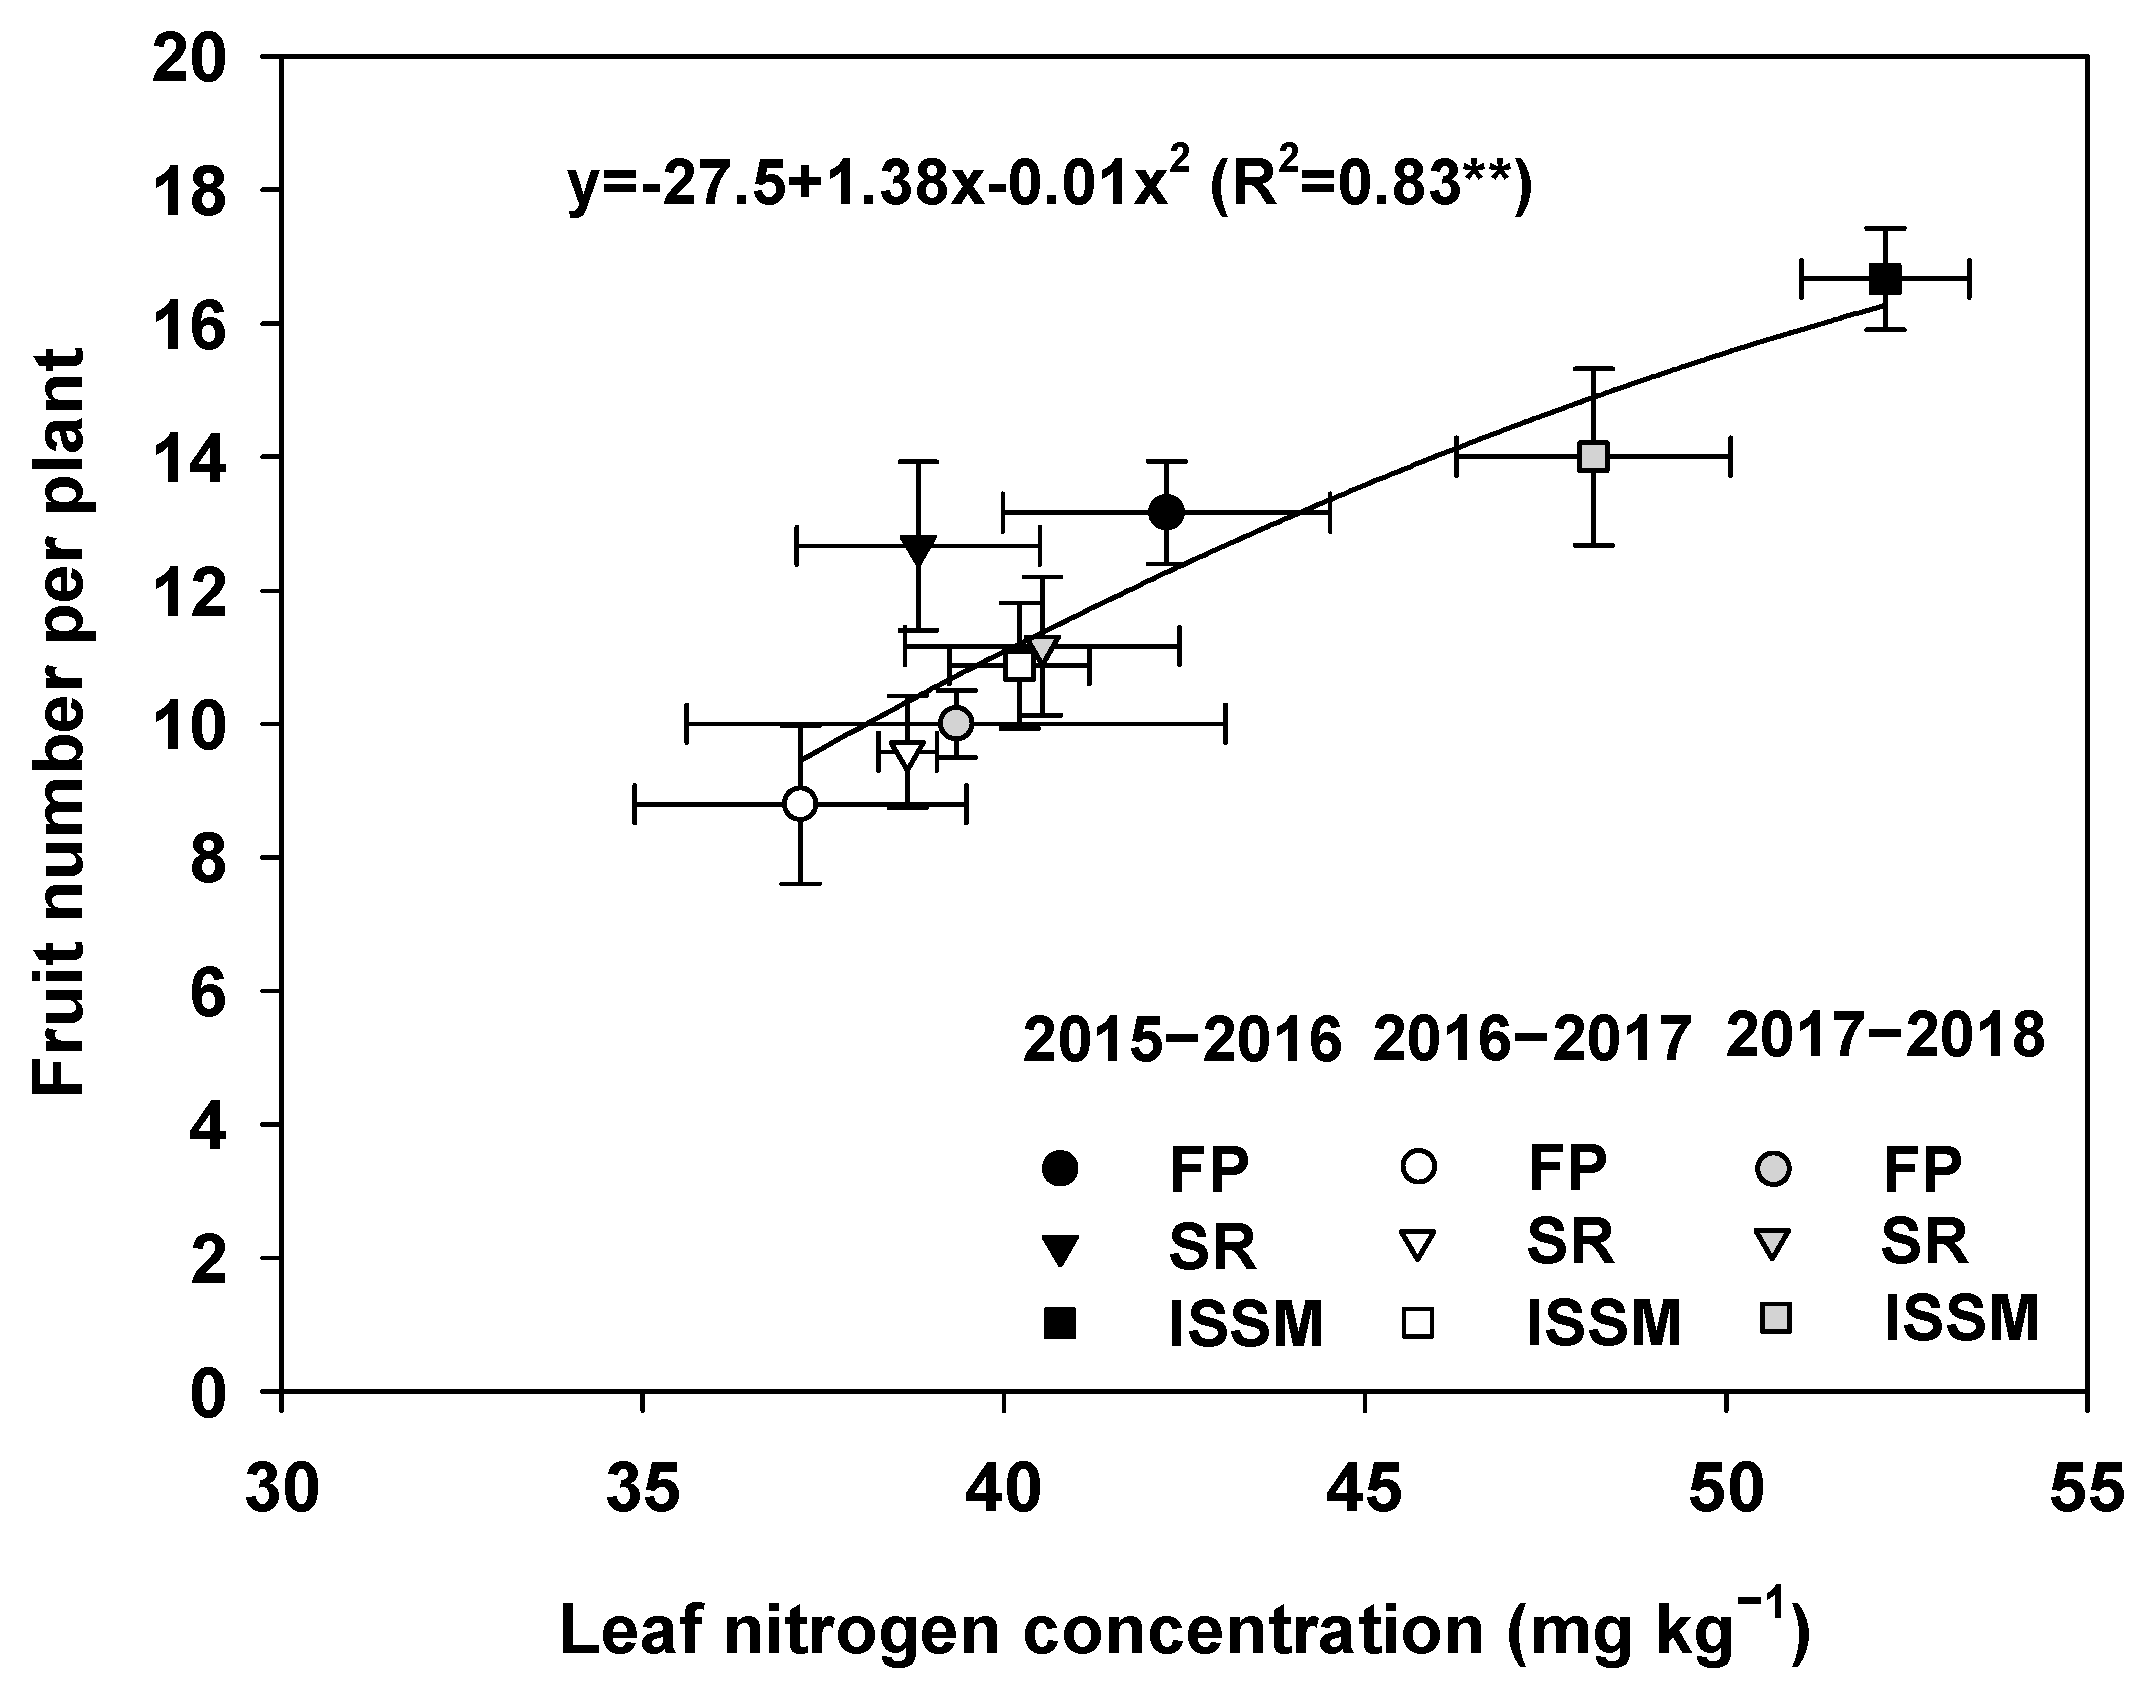
3.4. Relation between Leaf Nitrogen Concentration and Fruit Number per Plant at Early Anthesis Stage

Concerning the fruit number, there was a quadratic relation between the leaf N concentration at the early anthesis stage and fruit number per plant, which indicates that a higher leaf N concentration at the anthesis stage was beneficial to increase the fruiting rate within limits (Figure 4). In each growing season, the leaf N concentration of ISSM was higher than that of FP and SR at the early anthesis stage. That could be the reason why the ISSM treatment obtained a higher fruit number per plant.

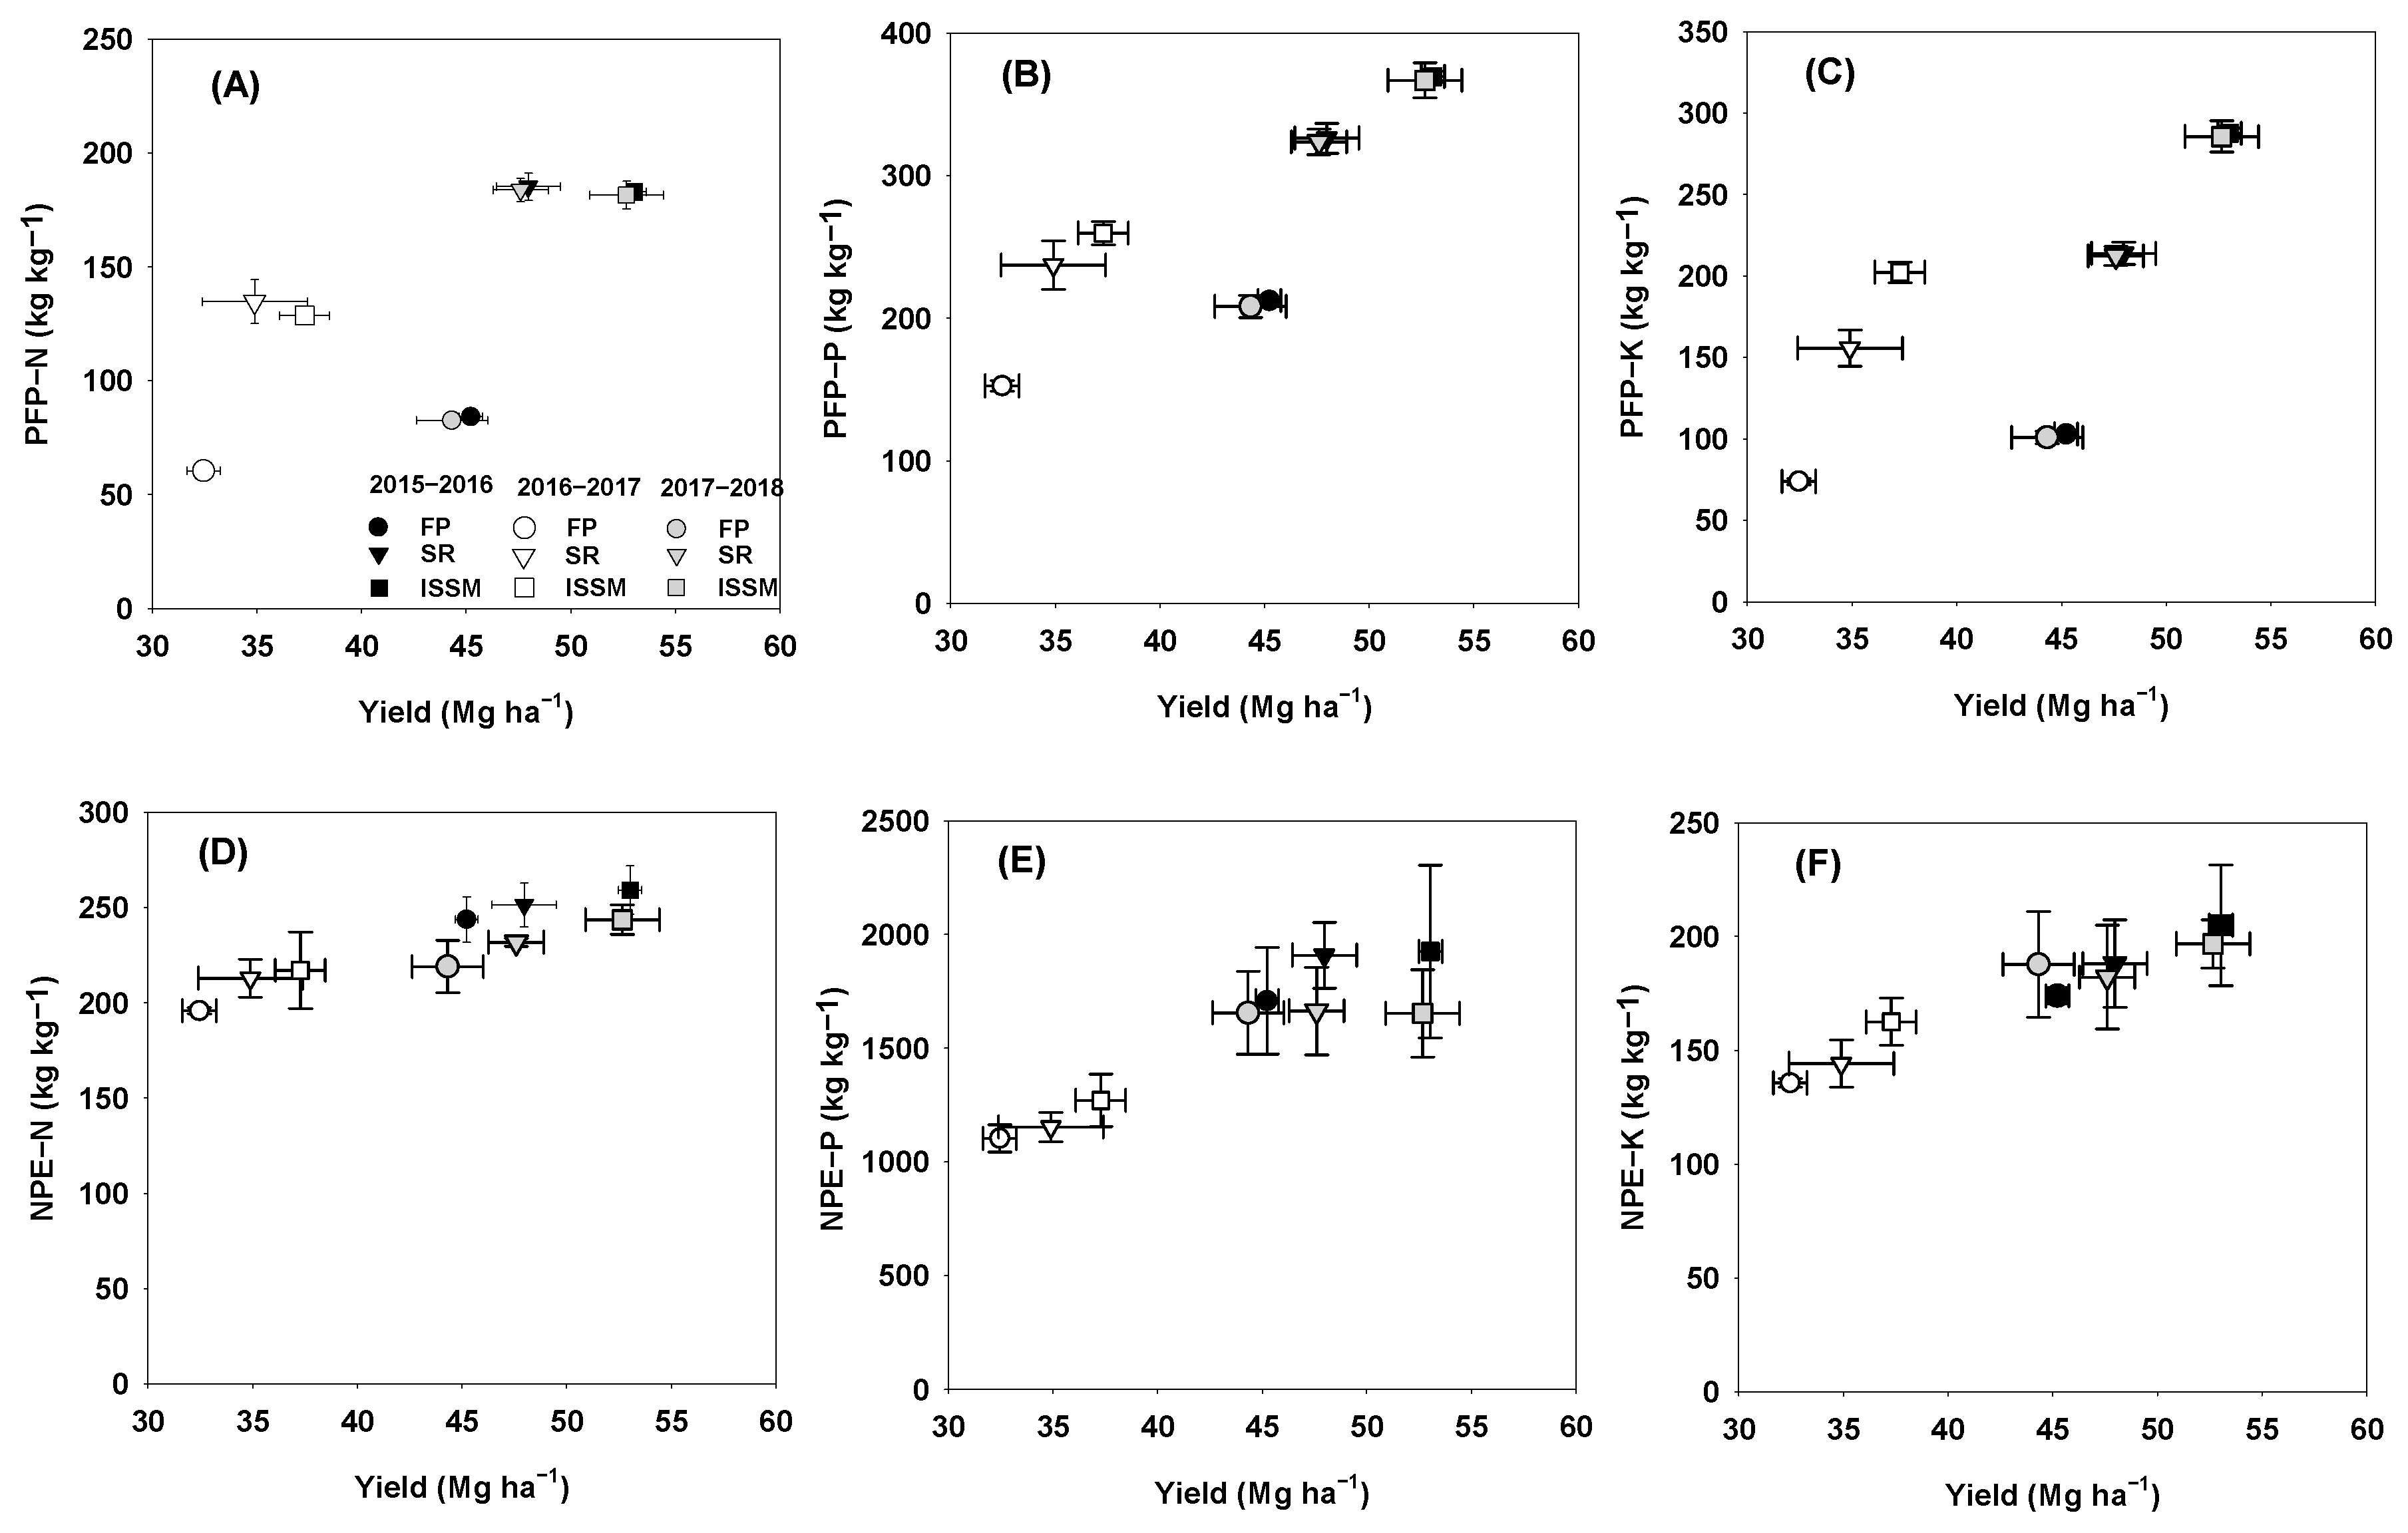
3.5. Nutrient Use Efficiency

The higher yield contributed to the higher nutrient use efficiency. Overall, both the PFPs and NPEs of the SR were significantly lower in each season. In addition, the SR treatment showed a similar impact on the PFP-N with ISSM. Compared to FP, the ISSM and SR increased the PFP-N by 122% and 117%, respectively. As for the PFP-P and PFP-K, the highest values of PFP were obtained under the ISSM treatment, being 73.5% and 179% higher than those of FP, whilst the effect of SR on the PFP-P and PFP-K was slightly lower relative to ISSM. Due to the lower yield, the PFPs in the second season were significantly lower than the other two seasons (Figure 5A–C).
There was a similar trend to the PFP in that the higher yield led to the higher NPE. Compared to FP, the SR and ISSM increased the NPE-N by 5.9% and 9.5%, NPE-K by 5.6% and 9.2%, and NPE-K2O by 3.8% and 14.1%, respectively. As well as the PFPs, the NPEs in the second season were also significantly lower (Figure 5D–F).

3.6. Apparent N Losses

Obviously, ISSM and SR significantly decreased the apparent N losses through the reduction in the exogenous N input (Table 3). Overall, the exogenous N inputs (chemical fertilizer, manure, and calcium cyanamide) were reduced by 248 and 279 kg N ha−1, with a decrease of 46% and 52% relative to FP, respectively. The seasonal N uptake of the shoot under the SR and ISSM treatment showed an increasing trend relative to the FP treatment, but no significance was observed in the 2016–2017 and 2017–2018 seasons. In addition, the soil Nmin hardly changed before planting and after harvest especially in the 2015–2016 and 2017–2018 seasons. The amounts of the seasonal mean apparent N loss in the FP, SR, and ISSM were 376, 122, and 131 kg ha−1, respectively. Compared with the FP treatment, the SR and ISSM treatments significantly decreased the apparent N loss by 67% and 65%, respectively, while the variations in the apparent N loss among different seasons were large (Table 3). Especially, the apparent N loss in the 2017–2018 season was significantly lower than that of the other two seasons, which was attributed to the higher amount of soil Nmin residue after harvest.

3.7. Cost and Benefit

The higher yield made higher incomes, and SR and ISSM obtained a larger net profit due to increases in the yield. Compared to FP, the mean seasonal incomes were increased by 1.91 thousand $ ha−1 and 2.92 thousand $ ha−1 under SR and ISSM. Although unfavorable climate conditions in the 2016–2017 season resulted in a lower yield, the income was not affected because of a higher pepper price. In comparison to FP, the costs of the SR and ISSM treatment were higher, which was caused by a greater cost of seedling, fertilizer, and labor. Because of a lower plant density, the cost of seed was reduced by $73 ha−1 under the ISSM treatment relative to the other two treatments (Table 4). It was worthwhile to note that ISSM increased the production costs, but the higher incomes offset the increase in the cost, so achieved the largest economic benefits, with net profit up to 6.07 thousand $ ha−1 to 8.17 thousand $ ha−1 per season, which is 27.7% higher than FP.

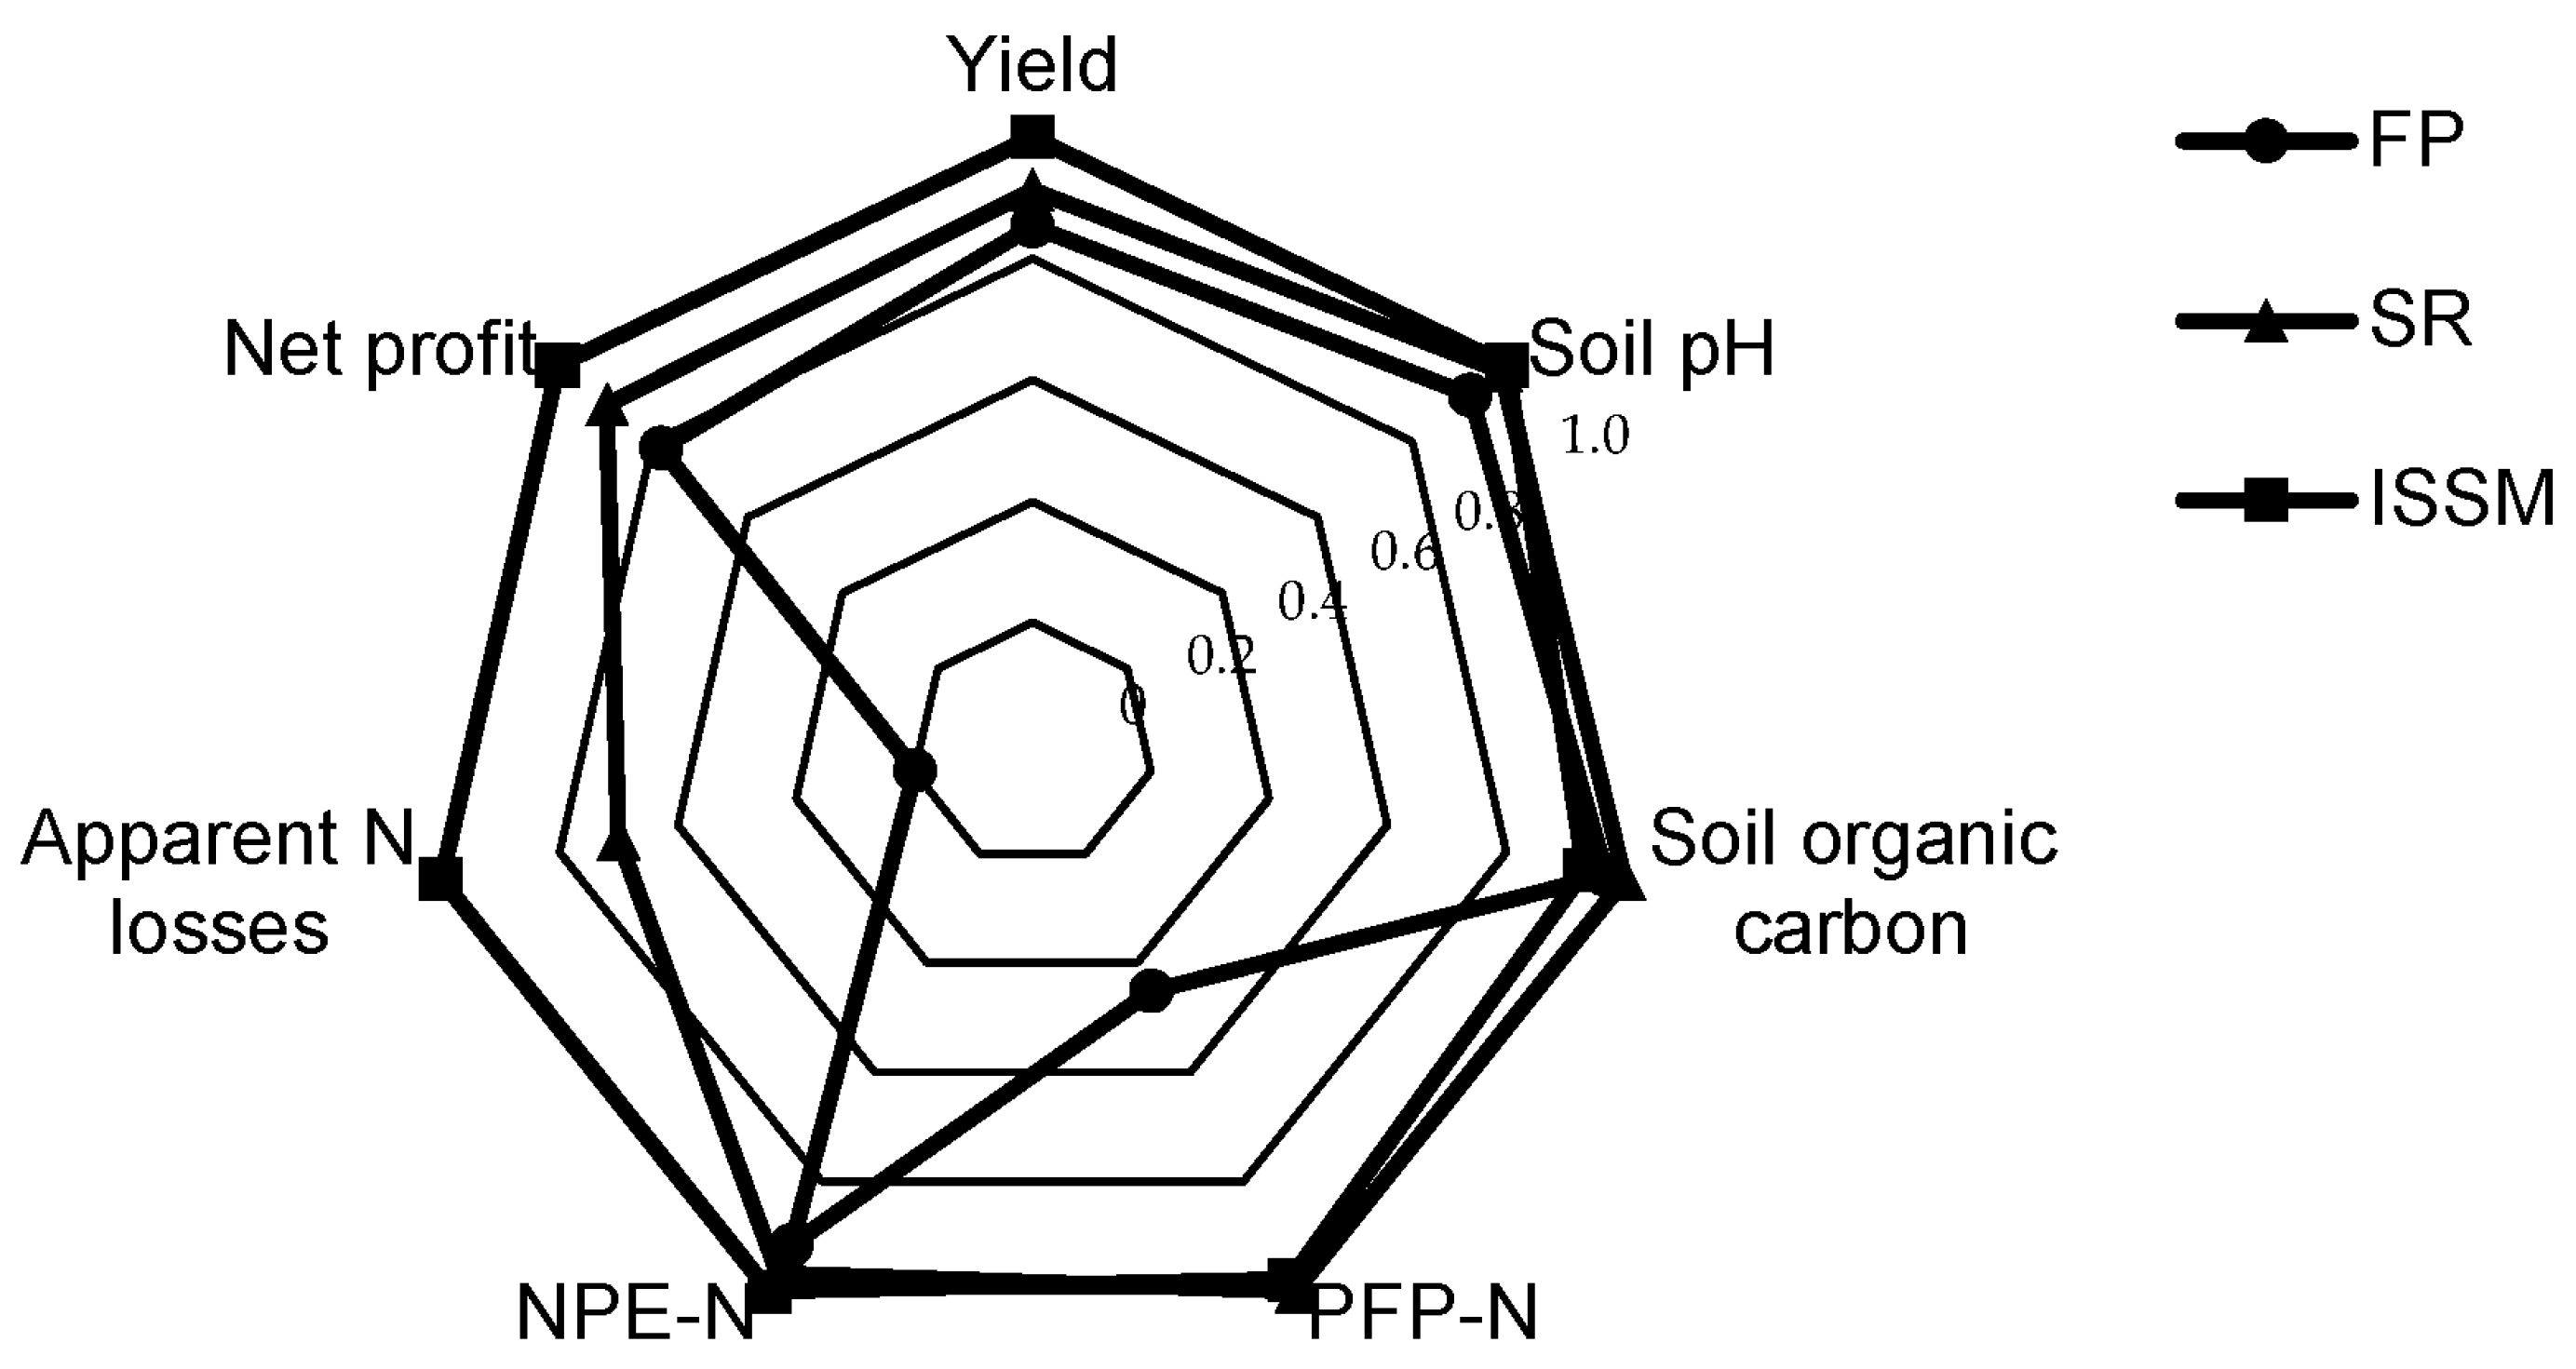
3.8. Comprehensive Evaluation

In this study, the comprehensive evaluation involved the yield, soil quality, nutrient use efficiency, apparent N loss, and economic benefit. The ISSM reached the largest area, and indicated the best results, especially for the yield, soil pH, NPE-N, apparent N losses, and net profit (Figure 6). Concerning the soil organic carbon and PFP-N, the effects of ISSM were very close to SR, which were far better than FP. In general, the SR and ISSM treatment could obtain a better result in the yield, soil quality, nutrient use efficiency, apparent N losses, and economic benefit than the FP treatment (Figure 6).

4. Discussion

Improving the vegetable yield sharply and maintaining sustainable production simultaneously remains a great challenge in China. This study clearly demonstrated that ISSM possesses a prominent advantage in boosting the vegetable yield. The results indicated that ISSM could increase the fresh fruit pepper yield by 17% relative to FP. Such an increase in yield is greater than that through individual improvement methods [18,41], but lower than former reports in cereal crops [19,23]. Firstly, a poor nutrient absorption capacity and short growth duration hinder the effect of optimizing nutrient management on the yield. Secondly, the yield potential for pepper in this region is lower than that in cereals [23,25]. Thirdly, a lack of fundamental studies limits the design of a systematic management approach, such as matching solar radiation and the heat source, which needs more studies to reveal the effect of the biophysical context on vegetable growth. So, a larger yield potential may be achieved by further optimizing systematic management strategies.
In this study, soil remediation treatment (SR), as a single optimal approach, also contributed to improving the pepper yield, with an increase of 6.9%, which indicates that soil quality decline, especially soil acidification, has become an important constraint to the yield in greenhouse vegetable production. Due to long-term excessive fertilizer application, the soil pH is <5.0 in this study, impeding the root growth and nutrient absorption, whilst amending the soil pH favors plant growing [42], through mitigating acidic toxicity, modulating microbial communities [43,44], and improving soil nutrient availability [45]. However, the addictive effects of the application of calcium cyanamide on the soil pH were not detected, i.e., variation in the soil pH within the same treatment (SR, ISSM) not being significant between seasons (Figure 3), which may be attributed to a very low initial soil pH and short experimental duration. In addition, the effect of soil conditioner on the soil pH tends to first rapidly increase, and then slowly [46]. Similarly, a relatively high soil organic carbon and shorter time cause little change in SOM. Therefore, mitigating soil degradation needs long-term synthetic management approaches, such as improving the soil structure, aggregate, soil organic matter, and acid-base buffer capacity.
The high yield was a benefit of increasing the fruit number per plant (Table 2). Although the plant density of ISSM was reduced, the fruit number unit area was still increased relative to FP. In the 2016–2017 season, the pepper yield was significantly lower (Table 2), which resulted from lacking enough solar radiation during the fruit-bearing period in October (Figure 1). Rylski and Halevy [47] reported a lower light intensity could induce more flower abscission. In addition, there was a quadratic relation between the leaf N concentration at early anthesis and fruit number per plant (Figure 4). The result demonstrated that a higher leaf N concentration within limits at early anthesis could increase the fruit number per plant, whereas the contradictory results were reported by Sui et al. [48]. The leaf N concentration of the previous reports may overstep inflexion, so more flowers and fruits drop. Moreover, optimal plant population could improve the vegetable yields of vegetables [49]. Wang et al. [25] found that there was a negative correlation between the plant density and pepper yield in a farmers’ survey in the Yangtze River Basin. A proper density is beneficial to make full use of light, heat, water, and nutrient resources [30,50], which contribute to a higher fruit number per plant and larger biomass.
Enhancing the nutrient use efficiency is helpful to mitigate the environmental impacts [51]. In this study, the increases in the PFPs and NPEs mainly resulted from higher yields and lower nutrient input following systematic approaches (Figure 5). The effects of SR indicated soil remediation is an important contributor to improving the nutrient use efficiency. Promoting nutrient uptake is an essential way to reduce apparent N losses. Firstly, the application of calcium cyanamide and raising the soil pH promotes plant root growing [52], and thus increases the N uptake even though there is a reduction in the N rate. Secondly, applying the slow-release fertilizer nursery improved the seedling quality (Figure 2), and stronger seedlings benefit from the nutrient uptake, which then alleviates the dependence on basal N fertilizer [28,33]. Due to the initial high N surplus per season, substantial N remains in the soil in greenhouses [53,54,55]. In this study, the significant difference was not shown between treatments (Table 3), which might be associated with a high N residue (Nmin at 0–40 cm up to 400~500 kg N ha−1). Far worse, such a high Nmin causes a severe risk of water contamination, so more studies are needed to further decrease Nmin to appropriate levels through innovative technologies, such as the use of inhibitors [33] and controlled-released fertilizer [56]. In addition, changing the organic fertilizer type and ratio of organic to inorganic fertilizer should be considered as an important component for further optimizing ISSM for greenhouse vegetable systems, to reduce soil phosphorus accumulation.

5. Conclusions

This study presented the finding that ISSM improved the vegetable yield and economic benefits simultaneously by reducing the environmental risk in greenhouse vegetable systems. The main conclusions are summarized as follows: (i) Compared to FP, the ISSM delivered a nearly 20% increase in the fresh fruit pepper yield with less than 300 kg N ha−1 input per season, attributed to an increase in the fruit number per plant under ISSM; (ii) the ISSM contributed to increasing the concentration of leaf N that positively correlated with the fruit number per plant; (iii) the ISSM gained a higher nutrient use efficiency, fewer apparent N losses, and better economic benefit than FP. Therefore, the ISSM is available to achieve the “double-wins” goals of higher yields with lower environment costs, which provides a promising way towards sustainable vegetable production in China.

Author Contributions

Conceptualization, X.C. and Y.S.; Methodology, G.W., B.L., L.L. and X.W.; Software, B.L., S.W. and M.Y.; Formal analysis, M.Y.; Investigation, G.W., M.Z., L.L., S.W. and J.W.; Data curation, J.W., M.Z.; Writing—original draft, B.L. and. G.W.; Writing—review & editing, G.W., Y.S. and X.W.; Supervision, X.C. and Y.S. All authors have read and agreed to the published version of the manuscript.

Funding

This work was supported by The Second Level Youth Development Fund from Anhui Academy of Agricultural Sciences (QNYC-202209), Key Research and Development Program of Anhui Province (2023n06020019).

Data Availability Statement

The original contributions presented in the study are included in the article, further inquiries can be directed to the corresponding author.

Conflicts of Interest

Author Sujun Wei was employed by the company Anhui Sierte Fertilizer Industry Co., Ltd. The remaining authors declare that the research was conducted in the absence of any commercial or financial relationships that could be construed as a potential conflict of interest.

References

  1. Kathi, S.; Laza, H.; Singh, S.; Thompson, L.; Li, W.; Simpson, C. A decade of improving nutritional quality of horticultural crops agronomically (2012–2022): A systematic literature review. Sci. Total Environ. 2023, 911, 168665. [Google Scholar] [CrossRef]
  2. Kiczorowski, P.; Kiczorowska, B.; Samolińska, W.; Szmigielski, M.; Winiarska, M.A. Effect of fermentation of chosen vegetables on the nutrient, mineral, and biocomponent profile in human and animal nutrition. Sci. Rep. 2022, 12, 13422. [Google Scholar] [CrossRef] [PubMed]
  3. van Berleere, M.; Dauchet, L. Fruits, Vegetables, and Health: Evidence from meta-analyses of prospective epidemiological studies. In Vegetarian and Plant-Based Diets in Health and Disease Prevention; Academic Press: Cambridge, MA, USA, 2017; pp. 215–248. [Google Scholar] [CrossRef]
  4. Food and Agriculture Organization of the United Nations Statistical Databases. Available online: https://www.fao.org/faostat/en/#data/QCL (accessed on 1 April 2024).
  5. Ministry of Agriculture and Rural Affair Home Page. Available online: http://www.moa.gov.cn/xw/bmdt/202208/t20220819_6407325.htm (accessed on 1 April 2024).
  6. Ju, X.T.; Kou, C.L.; Christie, P.; Dou, Z.X.; Zhang, F.S. Changes in the soil environment from excessive application of fertilizers and manures to two contrasting intensive cropping systems on the North China Plain. Environ. Pollut. 2007, 145, 497–506. [Google Scholar] [CrossRef] [PubMed]
  7. Zhang, F.; Liu, F.; Ma, X.; Guo, G.; Liu, B.; Cheng, T.; Liang, T.; Tao, W.; Chen, X.; Wang, X. Greenhouse gas emissions from vegetables production in China. J. Clean. Prod. 2021, 317, 128449. [Google Scholar] [CrossRef]
  8. Liang, H.; Chen, Q.; Liang, B.; Hu, K.L. Modeling the effects of long-term reduced N application on soil N losses and yield in a greenhouse tomato production system. Agric. Syst. 2020, 185, 102951. [Google Scholar] [CrossRef]
  9. Kashyap, D.; de Vries, M.; Pronk, A.; Adiyoga, W. Environmental impact assessment of vegetable production in West Java, Indonesia. Sci. Total Environ. 2022, 864, 160999. [Google Scholar] [CrossRef]
  10. Wang, X.; Zou, C.; Gao, X.; Guan, X.; Zhang, Y.; Shi, X.; Chen, X. Nitrate leaching from open-field and greenhouse vegetable systems in China: A meta-analysis. Environ. Sci. Pollut. Res. 2018, 25, 31007–31016. [Google Scholar] [CrossRef] [PubMed]
  11. Kalkhajeh, Y.; Huang, B.; Sorensen, H.; Holm, P.E.; Hansen, H.C.B. Phosphorus accumulation and leaching risk of greenhouse vegetable soils in Southeast China. Pedosphere 2021, 31, 683–693. [Google Scholar] [CrossRef]
  12. Min, J.; Zhao, X.; Shi, W.-M.; Xing, G.-X.; Zhu, Z.-L. Nitrogen Balance and Loss in a Greenhouse Vegetable System in Southeastern China. Pedosphere 2011, 21, 464–472. [Google Scholar] [CrossRef]
  13. Liang, L.; Ridoutt, B.G.; Lal, R.; Wang, D.; Wu, W.; Peng, P.; Hang, S.; Wang, L.; Zhao, G. Nitrogen footprint and nitrogen use efficiency of greenhouse tomato production in North China. J. Clean. Prod. 2019, 208, 285–296. [Google Scholar] [CrossRef]
  14. Fan, Y.; Zhang, Y.X.; Hess, F.B.; Huang, B.; Chen, Z.K. Nutrient balance and soil changes in plastic greenhouse vegetable production. Nutr. Cycl. Agroecosyst. 2020, 117, 77–92. [Google Scholar] [CrossRef]
  15. Awadelkareem, W.; Haroun, M.; Wang, J.J.; Qian, X.Q. Nitrogen Interactions Cause Soil Degradation in Greenhouses: Their Relationship to Soil Preservation in China. Horticulturae 2023, 9, 340. [Google Scholar] [CrossRef]
  16. Li, J.G.; Wan, X.; Liu, X.X.; Chen, Y.; Slaughter, L.C.; Weindorf, D.C.; Dong, Y.H. Changes in soil physical and chemical characteristics in intensively cultivated greenhouse vegetable fields in North China. Soil Tillage Res. 2019, 195, 104366. [Google Scholar] [CrossRef]
  17. He, F.; Chen, Q.; Jiang, R.; Chen, X.; Zhang, F. Yield and nitrogen balance of greenhouse tomato (Lycopersicum esculentum Mill.) with conventional and site-specific nitrogen management in northern China. Nutr. Cycl. Agroecosyst. 2007, 77, 1–14. [Google Scholar] [CrossRef]
  18. Min, J.; Zhang, H.; Shi, W. Optimizing nitrogen input to reduce nitrate leaching loss in greenhouse vegetable production. Agric. Water Manag. 2012, 111, 53–59. [Google Scholar] [CrossRef]
  19. Bhardwaj, A.K.; Rajwar, D.; Yadav, R.K.; Chaudhari, S.K.; Sharma, D.K. Nitrogen Availability and Use Efficiency in Wheat Crop as Influenced by the Organic-Input Quality Under Major Integrated Nutrient Management Systems. Front. Plant Sci. 2021, 12, 634448. [Google Scholar] [CrossRef]
  20. Mohanty, S.; Nayak, A.K.; Swain, C.K.; Dhal, B.R.; Kumar, A.; Kumar, U.; Tripathi, R.; Shahid, M.; Behera, K.K. Impact of integrated nutrient management options on GHG emission, N loss and N use efficiency of low land rice. Soil Tillage Res. 2020, 200, 104616. [Google Scholar] [CrossRef]
  21. Yang, W.J.; Li, Y.L.; Liu, W.J.; Wang, S.W.; Yin, L.N.; Deng, X.P. Sustainable high yields can be achieved in drylands on the Loess Plateau by changing water use patterns through integrated agronomic management. Agric. For. Meteorol. 2021, 296, 108210. [Google Scholar] [CrossRef]
  22. Dhaliwal, S.S.; Sharma, S.; Sharma, V.; Shukla, A.K.; Walia, S.S.; Alhomrani, M.; Gaber, A.; Toor, A.S.; Verma, V.; Randhawa, M.K.; et al. Long-Term Integrated Nutrient Management in the Maize–Wheat Cropping System in Alluvial Soils of North-Western India: Influence on Soil Organic Carbon, Microbial Activity and Nutrient Status. Agronomy 2021, 11, 2258. [Google Scholar] [CrossRef]
  23. Chen, X.P.; Cui, Z.L.; Vitousek, P.M.; Cassman, K.G.; Matson, P.A.; Bai, J.S.; Meng, Q.F.; Hou, P.; Yue, S.C.; Romheld, V.; et al. Integrated soil-crop system management for food security. Proc. Natl. Acad. Sci. USA 2011, 108, 6399–6404. [Google Scholar] [CrossRef]
  24. Chen, X.; Cui, Z.; Fan, M.; Vitousek, P.; Zhao, M.; Ma, W.; Wang, Z.; Zhang, W.; Yan, X.; Yang, J.; et al. Producing more grain with lower environmental costs. Nature 2014, 514, 486–489. [Google Scholar] [CrossRef]
  25. Wang, X.; Liu, B.; Wu, G.; Sun, Y.; Guo, X.; Jin, Z.; Xu, W.; Zhao, Y.; Zhang, F.; Zou, C.; et al. Environmental costs and mitigation potential in plastic-greenhouse pepper production system in China: A life cycle assessment. Agric. Syst. 2018, 167, 186–194. [Google Scholar] [CrossRef]
  26. Brumm, I.; Schenk, M. Influence of nitrogen supply on the occurrence of calcium deficiency in field grown lettuce. Acta Hortic. 1992, 339, 125–136. [Google Scholar] [CrossRef]
  27. Li, T.; Zhang, X.; Gao, H.; Li, B.; Wang, H.; Yan, Q.; Ollenburger, M.; Zhang, W. Exploring optimal nitrogen management practices within site-specific ecological and socioeconomic conditions. J. Clean. Prod. 2019, 241, 118295. [Google Scholar] [CrossRef]
  28. Wang, X.Z.; Zhao, M.J.; Liu, B.; Zou, C.Q.; Sun, Y.X.; Wu, G.; Zhang, Q.A.; Jin, G.Q.; Jin, Z.H.; Chadwick, D.; et al. Integrated systematic approach increase greenhouse tomato yield and reduce environmental losses. J. Environ. Manag. 2020, 266, 110569. [Google Scholar] [CrossRef]
  29. Ji, C.Y.; Ye, R.Z.; Yin, Y.F.; Sun, X.F.; Ma, H.L.; Gao, R. Reductive soil disinfestation with biochar amendment modified microbial community composition in soils under plastic greenhouse vegetable production. Soil Tillage Res. 2022, 218, 105323. [Google Scholar] [CrossRef]
  30. Yan, P.; Zhang, Q.; Shuai, X.F.; Pan, J.X.; Zhang, W.J.; Shi, J.F.; Wang, M.; Chen, X.P.; Cui, Z.L. Interaction between plant density and nitrogen management strategy in improving maize grain yield and nitrogen use efficiency on the North China Plain. J. Agric. Sci. 2015, 154, 978–988. [Google Scholar] [CrossRef]
  31. Ding, X.T.; Nie, W.F.; Qian, T.T.; He, L.Z.; Zhang, H.M.; Jin, H.J.; Cui, J.W.; Wang, H.; Zhou, Q.; Yu, J.Z. Low Plant Density Improves Fruit Quality without Affecting Yield of Cucumber in Different Cultivation Periods in Greenhouse. Agronomy 2022, 12, 1441. [Google Scholar] [CrossRef]
  32. Dixon, G.R. Calcium Cyanamide—A Synoptic Review of an Environmentally Benign Fertiliser Which Enhances Soil Health. Acta Hortic. 2012, 938, 211–218. [Google Scholar] [CrossRef]
  33. Zhang, B.; Li, Q.; Cao, J.; Zhang, C.; Song, Z.; Zhang, F.; Chen, X. Reducing nitrogen leaching in a subtropical vegetable system. Agric. Ecosyst. Environ. 2017, 241, 133–141. [Google Scholar] [CrossRef]
  34. Fernández, M.D.; Gallardo, M.; Bonachela, S.; Orgaz, F.; Thompson, R.B.; Fereres, E. Water use and production of a greenhouse pepper crop under optimum and limited water supply. J. Hortic. Sci. Biotechnol. 2005, 80, 87–96. [Google Scholar] [CrossRef]
  35. Nelson, D.W.; Sommers, L.E. Determination of total nitrogen in plant material. Agron. J. 1973, 65, 423–425. [Google Scholar] [CrossRef]
  36. Chen, X.L.; Guo, P.J.; Wang, Z.Y.; Liang, J.Y.; Li, G.H.; He, W.W.; Zhen, A. Grafting improves growth and nitrogen-use efficiency by enhancing NO3 uptake, photosynthesis, and gene expression of nitrate transporters and nitrogen metabolizing enzymes in watermelon under reduced nitrogen application. Plant Soil 2022, 480, 305–327. [Google Scholar] [CrossRef]
  37. Walkley, A.; Black, I.A. An examination of the Degtjareff method for determining soil organic matter, and a proposed modification of the chromic acid titration method. Soil Sci. 1934, 37, 29–38. [Google Scholar] [CrossRef]
  38. Jin, L.; Cui, H.; Li, B.; Zhang, J.; Dong, S.; Liu, P. Effects of integrated agronomic management practices on yield and nitrogen efficiency of summer maize in North China. Field Crops Res. 2012, 134, 30–35. [Google Scholar] [CrossRef]
  39. Wang, H.D.; Li, J.; Cheng, M.H.; Zhang, F.C.; Wang, X.K.; Fan, J.L.; Wu, L.F.; Fang, D.P.; Zou, H.Y.; Xiang, Y.Z. Optimal drip fertigation management improves yield, quality, water and nitrogen use efficiency of greenhouse cucumber. Sci. Hortic. 2019, 243, 357–366. [Google Scholar] [CrossRef]
  40. Zhao, R.; Chen, X.; Zhang, F.; Zhang, H.; Schroder, J.; Römheld, V. Fertilization and Nitrogen Balance in a Wheat–Maize Rotation System in North China. Agron. J. 2006, 98, 938–945. [Google Scholar] [CrossRef]
  41. Zhang, Z.; Wang, X.; Li, C.; Huang, S.; Gao, W.; Tang, J.; Jin, J. Effects of straw addition on increased greenhouse vegetable yield and reduced antibiotic residue in fluvo-aquic soil. J. Integr. Agric. 2015, 14, 1423–1433. [Google Scholar] [CrossRef]
  42. Valdez-Perez, M.A.; Fernandez-Luqueno, F.; Franco-Hernandez, O.; Flores Cotera, L.B.; Dendooven, L. Cultivation of beans (Phaseolus vulgaris L.) in limed or unlimed wastewater sludge, vermicompost or inorganic amended soil. Sci. Hortic. 2011, 128, 380–387. [Google Scholar] [CrossRef]
  43. Kennedy, N.; Brodie, E.; Connolly, J.; Clipson, N. Impact of lime, nitrogen and plant species on bacterial community structure in grassland microcosms. Environ. Microbiol. 2004, 6, 1070–1080. [Google Scholar] [CrossRef]
  44. Pang, Z.; Tayyab, M.; Kong, C.; Hu, C.; Zhu, Z.; Wei, X.; Yuan, Z. Liming Positively Modulates Microbial Community Composition and Function of Sugarcane Fields. Agronomy 2019, 9, 808. [Google Scholar] [CrossRef]
  45. Neina, D. The Role of Soil pH in Plant Nutrition and Soil Remediation. Appl. Environ. Soil Sci. 2019, 5794869. [Google Scholar] [CrossRef]
  46. Lukin, V.; Epplin, F. Optimal frequency and quantity of agricultural lime applications. Agric. Syst. 2003, 76, 949–967. [Google Scholar] [CrossRef]
  47. Rylski, I.; Halevy, A.H. Optimal environment for set and development of sweet pepper fruit. Acta Hortic. 1974, 42, 55–62. [Google Scholar] [CrossRef]
  48. Sui, F.G.; Lu, Y.-Y.; Inanaga, S.J. Effect of the nitrogen nutrition on fruit growth and development of sweet pepper. Plant Nutr. Fertil. Sci. 2004, 10, 499–503. [Google Scholar] [CrossRef]
  49. Huat, J.; Doré, T.; Aubry, C. Limiting factors for yields of field tomatoes grown by smallholders in tropical regions. Crop Prot. 2013, 44, 120–127. [Google Scholar] [CrossRef]
  50. Antonietta, M.; Fanello, D.D.; Acciaresi, H.A.; Guiamet, J.J. Senescence and yield responses to plant density in stay green and earlier-senescing maize hybrids from Argentina. Field Crops Res. 2014, 155, 111–119. [Google Scholar] [CrossRef]
  51. Cui, Z.; Wang, G.; Yue, S.; Wu, L.; Zhang, W.; Zhang, F.; Chen, X. Closing the N-use efficiency gap to achieve food and environmental security. Environ. Sci. Technol. 2014, 48, 5780–5787. [Google Scholar] [CrossRef] [PubMed]
  52. Zu, C.; Li, Z.; Yang, J.; Yu, H.; Sun, Y.; Tang, H.; Yost, R.; Wu, H. Acid Soil Is Associated with Reduced Yield, Root Growth and Nutrient Uptake in Black Pepper (Piper nigrum L.). Agric. Sci. 2014, 5, 466–473. [Google Scholar] [CrossRef]
  53. Chen, Q.; Zhang, X.; Zhang, H.; Christie, P.; Li, X.; Horlacher, D.; Liebig, H.-P. Evaluation of current fertilizer practice and soil fertility in vegetable production in the Beijing region. Nutr. Cycl. Agroecosyst. 2004, 69, 51–58. [Google Scholar] [CrossRef]
  54. Gao, J.J.; Bai, X.L.; Zhou, B.; Zhou, J.B.; Chen, Z.J. Soil nutrient content and nutrient balances in newly-built solar greenhouses in northern China. Nutr. Cycl. Agroecosyst. 2012, 94, 63–72. [Google Scholar] [CrossRef]
  55. Shi, W.M.; Yao, J.; Yan, F. Vegetable cultivation under greenhouse conditions leads to rapid accumulation of nutrients, acidification and salinity of soils and groundwater contamination in South-Eastern China. Nutr. Cycl. Agroecosyst. 2008, 83, 73–84. [Google Scholar] [CrossRef]
  56. Zhang, W.; Liang, Z.; He, X.; Wang, X.; Shi, X.; Zou, C.; Chen, X. The effects of controlled release urea on maize productivity and reactive nitrogen losses: A meta-analysis. Environ. Pollut. 2019, 246, 559–565. [Google Scholar] [CrossRef]
Figure 1. Mean monthly solar radiation (bars) and maximum (full line) and minimum (dot line) air temperature of experimental site at growing period from 2015 to 2018. The first season was from 15 August 2015 to 6 January 2016; the second season was from 21 August 2016 to 12 January 2017; the third season was from 26 August 2017 to 30 January 2018.
Agronomy 14 00807 g001
Figure 2. Dry weight of shoot (A), dry weight of root (B), plant height (C), stem diameter (D), SPAD (E), and sound seedling index (F) of different nursery seedling treatments in three seasons from 2015 to 2018. Covn and Crfn are conventional nursery seedling and controlled-release fertilizer nursery seedling, respectively. Vertical bars represent S.D. of means for three replications. *** Significant at p < 0.001; ** significant at p < 0.01; ns, not significant.
Agronomy 14 00807 g002
Figure 3. Soil pH (A) and soil organic carbon (B) of different nursery seedling treatments in three seasons from 2016 to 2018. FP, SR, and ISSM are farmers’ current practice, soil remediation treatment, and integrated soil–crop system management, respectively. Vertical bars represent S.D. of means for three replications.. Within the same season, different lowercase letters indicate significance at p < 0.05 by LSD.
Agronomy 14 00807 g003
Figure 4. Relation between leaf N concentration and fruit number per plant at early anthesis stage in three seasons from 2015 to 2018. FP, SR, and ISSM are farmers’ current practice, soil remediation treatment, and integrated soil–crop system management, respectively. Each point represents seasonal mean value of three replications, and error bars are given as S.D. ** Significant at p < 0.01.
Agronomy 14 00807 g004
Figure 5. Relation of nutrient efficiencies and yield in three seasons from 2015 to 2018. (AC) are PFP of N, P, and K, respectively, (DF) are NPE of N, P, and K, respectively. FP, SR, and ISSM are farmers’ current practice, soil remediation treatment, and integrated soil–crop system management, respectively. Each point represents seasonal mean value of three replications, and error bars are given as S.D.
Agronomy 14 00807 g005
Figure 6. Relations among yield, soil quality, nutrient use efficiency, and economic benefit of different treatments. Soil quality included pH and soil organic carbon; nutrient use efficiency was PFP-N; economic benefit referred to net profit. FP, SR, and ISSM are farmers’ current practice, soil remediation treatment, and integrated soil–crop system management, respectively.
Agronomy 14 00807 g006
Table 1. Cultivation and fertilization management for different treatments. FP, SR, and ISSM are farmers’ current practice, soil remediation treatment, and integrated soil–crop system management, respectively.
TreatmentCrop Management
Plant Density (Thousand Plant ha−1)
Soil ManagementFertilization ManagementTotal Input (N-P2O5-K2O, kg ha−1)
Nursery SeedlingBasal FertilizerTop-Dressing
FP54.6No soil conditioner
Manure type: chicken manure
Rate: 17.4 Mg ha−1 (N-P2O5-K2O, kg ha−1: 407-371-338)
Conventional nursery seedling (Covn)Products: compound fertilizer
Formula (N-P2O5-K2O): 15-15-15
Rate (N-P2O5-K2O, kg ha−1):
101-101-101
Products: soluble fertilizer
Formula (N-P2O5-K2O): 13-7-40
Rate (N-P2O5-K2O, kg ha−1): 29.3-15.8-90 Times: 3.
537-488-529
SR54.6Soil conditioner: calcium cyanamide (45 kg N ha−1)
Manure type: compost fertilizer
Rate: (N-P2O5-K2O, kg ha−1): 83.3-221-79.2.
Same as FPSame as FPSame as FP259-337-270
ISSM51.8Same as SRSlow-release fertilizer nursery seedling (Crfn)Products: formula fertilizer
Formula (N-P2O5-K2O): 20-20-9
Rate (N-P2O5-K2O, kg ha−1):
60-60-27
Products: soluble fertilizer
Formula (N-P2O5-K2O): 21-10-24
Rate (N-P2O5-K2O, kg ha−1): 101-48-115
Times: 5
290-329-222
Table 2. Fresh fruit yield, fruit number per plant, single fresh fruit weight (SFW), biomass, and harvest index (HI) in three seasons from 2015 to 2018. FP, SR, and ISSM are farmers’ current practice, soil remediation treatment, and integrated soil–crop system management, respectively.
SeasonTreatmentFresh Fruit Yield
(Mg ha−1)
Fruit Number per PlantSFW
(g)
Biomass
(Mg ha−1)
HI
2015–2016FP45.2 c13.2 b74.9 b8.15 b0.70 a
SR48.0 b12.7 b84.1 a8.20 b0.70 a
ISSM53.0 a16.7 a82.9 a8.66 a0.71 a
2016–2017FP32.5 b8.8 b72.0 a7.98 a0.55 b
SR34.9 ab9.6 ab68.2 a8.04 a0.61 a
ISSM37.3 a10.9 a77.9 a8.19 a0.62 a
2017–2018FP44.3 b10.0 b75.9 a7.40 b0.68 a
SR47.6 b11.2 b74.7 a7.76 ab0.69 a
ISSM52.7 a14.0 a76.4 a8.08 a0.68 a
Source of variation
Treatment (T) ******ns**
Season (S) ************
T × S nsnsnsns*
*** Significant at p < 0.001, ** significant at p < 0.01, * significant at p < 0.05, ns, not significant. Values represent the mean of three replications. Within the same season, different lowercase letters indicate significance at p < 0.05 by LSD.
Table 3. Seasonal N input, output, and apparent N losses during the period in three seasons from 2015 to 2018. FP, SR, and ISSM are farmers’ current practice, soil remediation treatment, and integrated soil–crop system management, respectively.
SeasonItem Treatment
FPSRISSM
2015–2016Input (kg N ha−1)Chemical fertilizer130130161
Manure40783.383.3
Calcium cyanamide04545
0–40 cm soil Nmin-preplant453 a453 a453 a
Output (kg N ha−1)Shoot uptakez186 b191ab205 a
0–40 cm soil Nmin-harvest411 a400 a459 a
Apparent N loss (kg N ha−1) 394 a121 b78 b
2016–2017Input (kg N ha−1)Chemical fertilizer130130161
Manure40783.383.3
Calcium cyanamide04545
0–40 cm soil Nmin-preplant517 a538 a491 a
Output (kg N ha−1)Shoot uptakez140 a169 a173 a
0–40 cm soil Nmin-harvest419 a422 a387 a
Apparent N lossz (kg N ha−1) 470 a210 b221 b
2017–2018Input (kg N ha−1)Chemical fertilizer130130161
Manure40783.383.3
Calcium cyanamide04545
0–40 cm soil Nmin-preplant415 a430 a431 a
Output (kg N ha−1)Shoot uptakez202 a205 a216 a
0–40 cm soil Nmin-harvest487 a447 a410 a
Apparent N loss z (kg N ha−1) 263 a36 b94 b
z Within the same season, different lowercase letters indicate significance at p < 0.05 by LSD.
Table 4. Income, cost, and net profit of different treatments in three seasons from 2015 to 2018. FP, SR, and ISSM are farmers’ current practice, soil remediation treatment, and integrated soil–crop system management, respectively.
SeasonTreatmentIncome
(Thousand $ ha−1)
Cost (Thousand $ ha−1)Net Profit
($ ha−1)
SeedlingFertilizerPesticideLaborOther z
2015–2016FP12.85 c1.321.731.271.902.464.16 c
SR14.10 b1.322.161.272.552.464.33 b
ISSM16.10 a1.262.321.272.722.466.07 a
2016–2017FP15.29 b1.321.731.271.902.466.60 b
SR16.68 ab1.322.161.272.552.466.91 ab
ISSM17.64 a1.262.321.272.722.467.62 a
2017–2018FP15.04 b1.321.731.271.902.466.35 b
SR18.14 a1.322.161.272.552.468.37 a
ISSM18.20 a1.262.321.272.722.468.17 a
z Other included cost of mulch, electric power, and depreciation of structure of greenhouse (plastic film, steel, and drip irrigation tape). Within the same season, different lowercase letters indicate significance at p < 0.05 by LSD.
Disclaimer/Publisher’s Note: The statements, opinions and data contained in all publications are solely those of the individual author(s) and contributor(s) and not of MDPI and/or the editor(s). MDPI and/or the editor(s) disclaim responsibility for any injury to people or property resulting from any ideas, methods, instructions or products referred to in the content.

