Article

Widely Targeted Metabolomics Analysis Reveals the Effect of Cultivation Altitude on Tea Metabolites

1
Key Laboratory of Biology, Genetics and Breeding of Special Economic Animals and Plants, Ministry of Agriculture and Rural Affairs, Tea Research Institute of the Chinese Academy of Agricultural Sciences, Hangzhou 310008, China
2
Tea Research Institute, Fujian Academy of Agricultural Sciences, Fuzhou 350012, China
3
Research Institute of Climate Change and Agriculture, National Institute of Horticultural and Herbal Science, Jeju 690-150, Republic of Korea
*
Authors to whom correspondence should be addressed.
These authors contributed equally to this work.
Agronomy 2024, 14(4), 812; https://doi.org/10.3390/agronomy14040812
Submission received: 23 March 2024 / Revised: 6 April 2024 / Accepted: 10 April 2024 / Published: 13 April 2024
(This article belongs to the Special Issue Beverage Crops Breeding: For Wine, Tea, Juices, Cocoa and Coffee)

Abstract

:
Cultivation altitude is a comprehensive environmental factor that significantly affects tea quality. To gain a deeper understanding of the effect of cultivation altitude on tea metabolites, a widely targeted metabolomic method based on ultra-performance liquid chromatography–tandem mass spectrometry (UPLC-MS/MS) was used to analyze tea samples derived from three altitudes (86 m, 256 m, and 880 m) of two cultivars, ‘Mingke 1’ (MK) and ‘Fuyun 6’ (FY). The results showed that distinct groups of tea samples from different altitudes and cultivars were observed based on PCA. A total of 64 and 56 altitude-related differential metabolites were identified in MK and FY, respectively. Among them, 16 compounds were consistent in both cultivars and were clustered in the metabolic pathways for flavonoid (11 compounds), amino acid (3), and fatty acid (2). The content of all flavonoids and one amino acid (L-aspartic acid) gradually decreased with increasing altitude; on the contrary, the others showed an opposite trend. Furthermore, we identified 57 differential metabolites between two cultivars. Two specific compounds (8-C-hexosyl chrysoeriol O-hexoside and pelargonidin 3-O-β-D-glucoside) were exclusively found in MK, while one compound (4-hydroxybenzoic acid) was present only in FY. These findings offer insight into the metabolic responses of tea plants to different altitudes, providing further understanding on the influence of the environment on tea plants.

1. Introduction

Tea is one of the most widely consumed non-alcoholic beverages; its quality is influenced by various factors such as tea plant cultivar, planting environment, and processing technology [1,2,3,4]. The cultivation environment plays a vital role in both yield and tea quality. For example, an investigation comparing the quality of green tea from four distinct regions in China revealed significant variations in chemical components [5]. Similarly, another study on oolong tea observed that phytochemical components in different cultivation regions widely varied [6]. Among them, the cultivation altitude of the tea plant is a particularly important factor in the cultivation environment, and previous findings have shown that higher altitudes can greatly enhance tea quality. Tea produced in high-altitude regions generally has better freshness and sweetness, as well as lower bitterness and astringency [7,8]. In addition, a higher cultivation altitude contributes to a better aroma of tea, which may be attributed to lower environmental temperatures compared to lower altitude areas [9].
The quality of tea flavor is influenced by various metabolites, such as flavonoids, caffeine, and volatile compounds [10,11]. Previous studies have shown that different cultivation altitudes can significantly affect the metabolites in tea leaves. At higher altitudes, the catechin content is inversely related to the cultivation altitude, which is thought to be partly responsible for the decreased bitterness and astringency of high mountain tea [12]. With the increase in cultivation altitude, the higher levels of ethylamine and glutamate and the hydrolysis of chloroplast proteins result in increased levels of L-theanine and amino acids [9]. The classes of aroma compounds in tea from different altitudes vary little, but the contents and proportions are different, and these differences, as well as the threshold values for each aroma compound, influence the final aroma profile at different altitudes [13]. Although the effects of cultivation altitudes on the main metabolites of tea plants have been studied, the impacts on many important metabolites of tea plants, such as flavonoid glycosides, proanthocyanidins, and fatty acids, remain unknown.
With the rapid development of metabolomic approaches, a high-throughput and accurate detection of metabolites in tea samples has become achievable. Non-targeted metabolomics provide a comprehensive view of metabolic changes across various tea samples, offering an unbiased profiling of diverse metabolites, but it may face challenges related to specificity and data complexity [14,15]. Conversely, targeted metabolomics offer a precise method for identifying and quantifying specific metabolites, which is valuable for assessing the quality and functional characteristics of tea, although it may overlook novel metabolites and require prior knowledge for method development [16]. Compared with untargeted and targeted metabolomics, the widely targeted metabolomic method enabling a balance between coverage and specificity is a versatile method for measuring a predefined but broader set of metabolites [17]. In recent years, the investigation of tea metabolites using widely targeted metabolomic techniques has emerged as a focal point in tea research. For example, Shi et al. elucidated the differences in the metabolic profiles of different types of green tea derived from the ‘Longjing 43’ cultivar using a widely targeted metabolomics approach [18]. Wang et al. utilized a similar analysis strategy to investigate the dynamic changes in green tea metabolites during processing [19].
In the current study, to gain a deeper understanding of the impact of cultivation altitude on metabolites in tea plants, we collected tea samples from two representative tea plant cultivars grown at three different cultivation altitudes in Fujian Province, China. One of the cultivars is ‘Mingke 1’ (MK), which is a national excellent cultivar with high fragrance and suitable for producing oolong and green tea, developed through the hybridization of ‘Tieguanyin’ (maternal parent) and ‘Huangdan’ (paternal parent). The other cultivar ‘Fuyun 6’ (FY) is a natural hybrid descendant of ‘Fuding Dabaicha’ and ‘Yunnan Dayecha’. It is appropriate for producing green, black, and white tea, and is a widely cultivated national superior cultivar in Fujian Province. Subsequently, a widely targeted metabolomic method using UPLC-MS/MS was used to investigate the characterization of metabolites. In addition, multivariate statistical analyses were performed to reveal the effects of altitude and cultivar. This study will deepen our understanding of the impact of the cultivation environment on the metabolites and quality of tea.

2. Materials and Methods

2.1. Tea Sample Preparation and Extraction

Tender shoots consisting of one bud and two adjacent leaves were harvested on April 14th from ten-year-old tea plants of cultivars MK and FY. These plants were grown under uniform cultivation conditions at three different altitudes: 86 m (low altitude), 256 m (medium altitude), and 880 m (high altitude). The fresh tender shoots were processed to produce tea samples using a hot-air drying method. Briefly, the fresh leaves were initially dried at 120 °C for 10 min, followed by drying at 80 °C for 30 min. Three biological replicate samples of each sample group from different altitudes and cultivars were collected for metabolic analysis. The details of the tea samples are shown in Table S1. The dried tea samples were ground into powder. Subsequently, 0.1 g of tea powder was extracted using 1.0 mL of 70% methanol, and the mixture was incubated overnight at 4 °C. After centrifugation at 10,000× g for 10 min, the supernatant was collected and subsequently passed through 0.22 μm pore size filters (ANPEL, Shanghai, China).

2.2. Metabolite Detection and Identification

UPLC-MS/MS analyses were performed using the Shim-pack UFLC SHIMADZU CBM30A system coupled to an Applied Biosystems 6500 QTRAP. The UPLC and mass spectrometry were conducted according to the method detailed by Chen et al. [17]. In brief, chromatographic separation was achieved using an ACQUITY HSS T3 UPLC column (1.8 µm, 2.1 mm × 100 mm). An aqueous 0.04% acetic acid solution and acetonitrile served as mobile phases A and B, respectively, with a constant flow rate maintained at 0.4 mL/min. The gradient elution procedure comprised the following steps: an initial linear increase of solvent B from 5% to 95% over the first 11.0 min, followed by a steady state at 95% B until minute 12.0, then a swift decrease to 5% B at 12.1 min, and finally an equilibration phase at 5% B lasting until 15.0 min. The injection volume was 2 μL, while the column oven temperature was maintained at 40 °C. The mass spectrometer parameters were set as follows: the source temperature was 500 °C; the ion spray voltage (IS) was 5.5 kV; the ion source gas I (GSI), gas II (GSII), and curtain gas (CUR) were adjusted to 55, 60, and 25.0 psi, respectively; and the collision gas (CAD) was configured to high. Metabolites were identified through the Metware database (MWDB), developed by MetWare Biotechnology Co., Ltd. (Wuhan, China), utilizing secondary spectrum information. The quantification of metabolites was achieved via MRM analysis employing triple quadrupole (QQQ) mass spectrometry.

2.3. Multivariate statistical Analysis

Principal component analysis (PCA), partial least squares discriminant analysis (PLS-DA), and orthogonal partial least squares discriminant analysis (OPLS-DA) were conducted using SIMCA 14.1 software (Umetrics AB, Umeå, Sweden). The significance of metabolite differences among tea samples was determined using a one-way ANOVA test, Duncan’s multiple range test, and independent t-test within SPSS v26.0 software (SPSS, Chicago, IL, USA). Differential metabolites for discriminating between different tea samples were evaluated and selected based on their VIP (variable importance in projection) value, p-value, and fold change. A heat map was generated using MeV 4.9.0 software (J. Craig Venter Institute, La Jolla, CA, USA) to illustrate the metabolic patterns of tea samples from various cultivation altitudes and tea plant cultivars.

3. Results

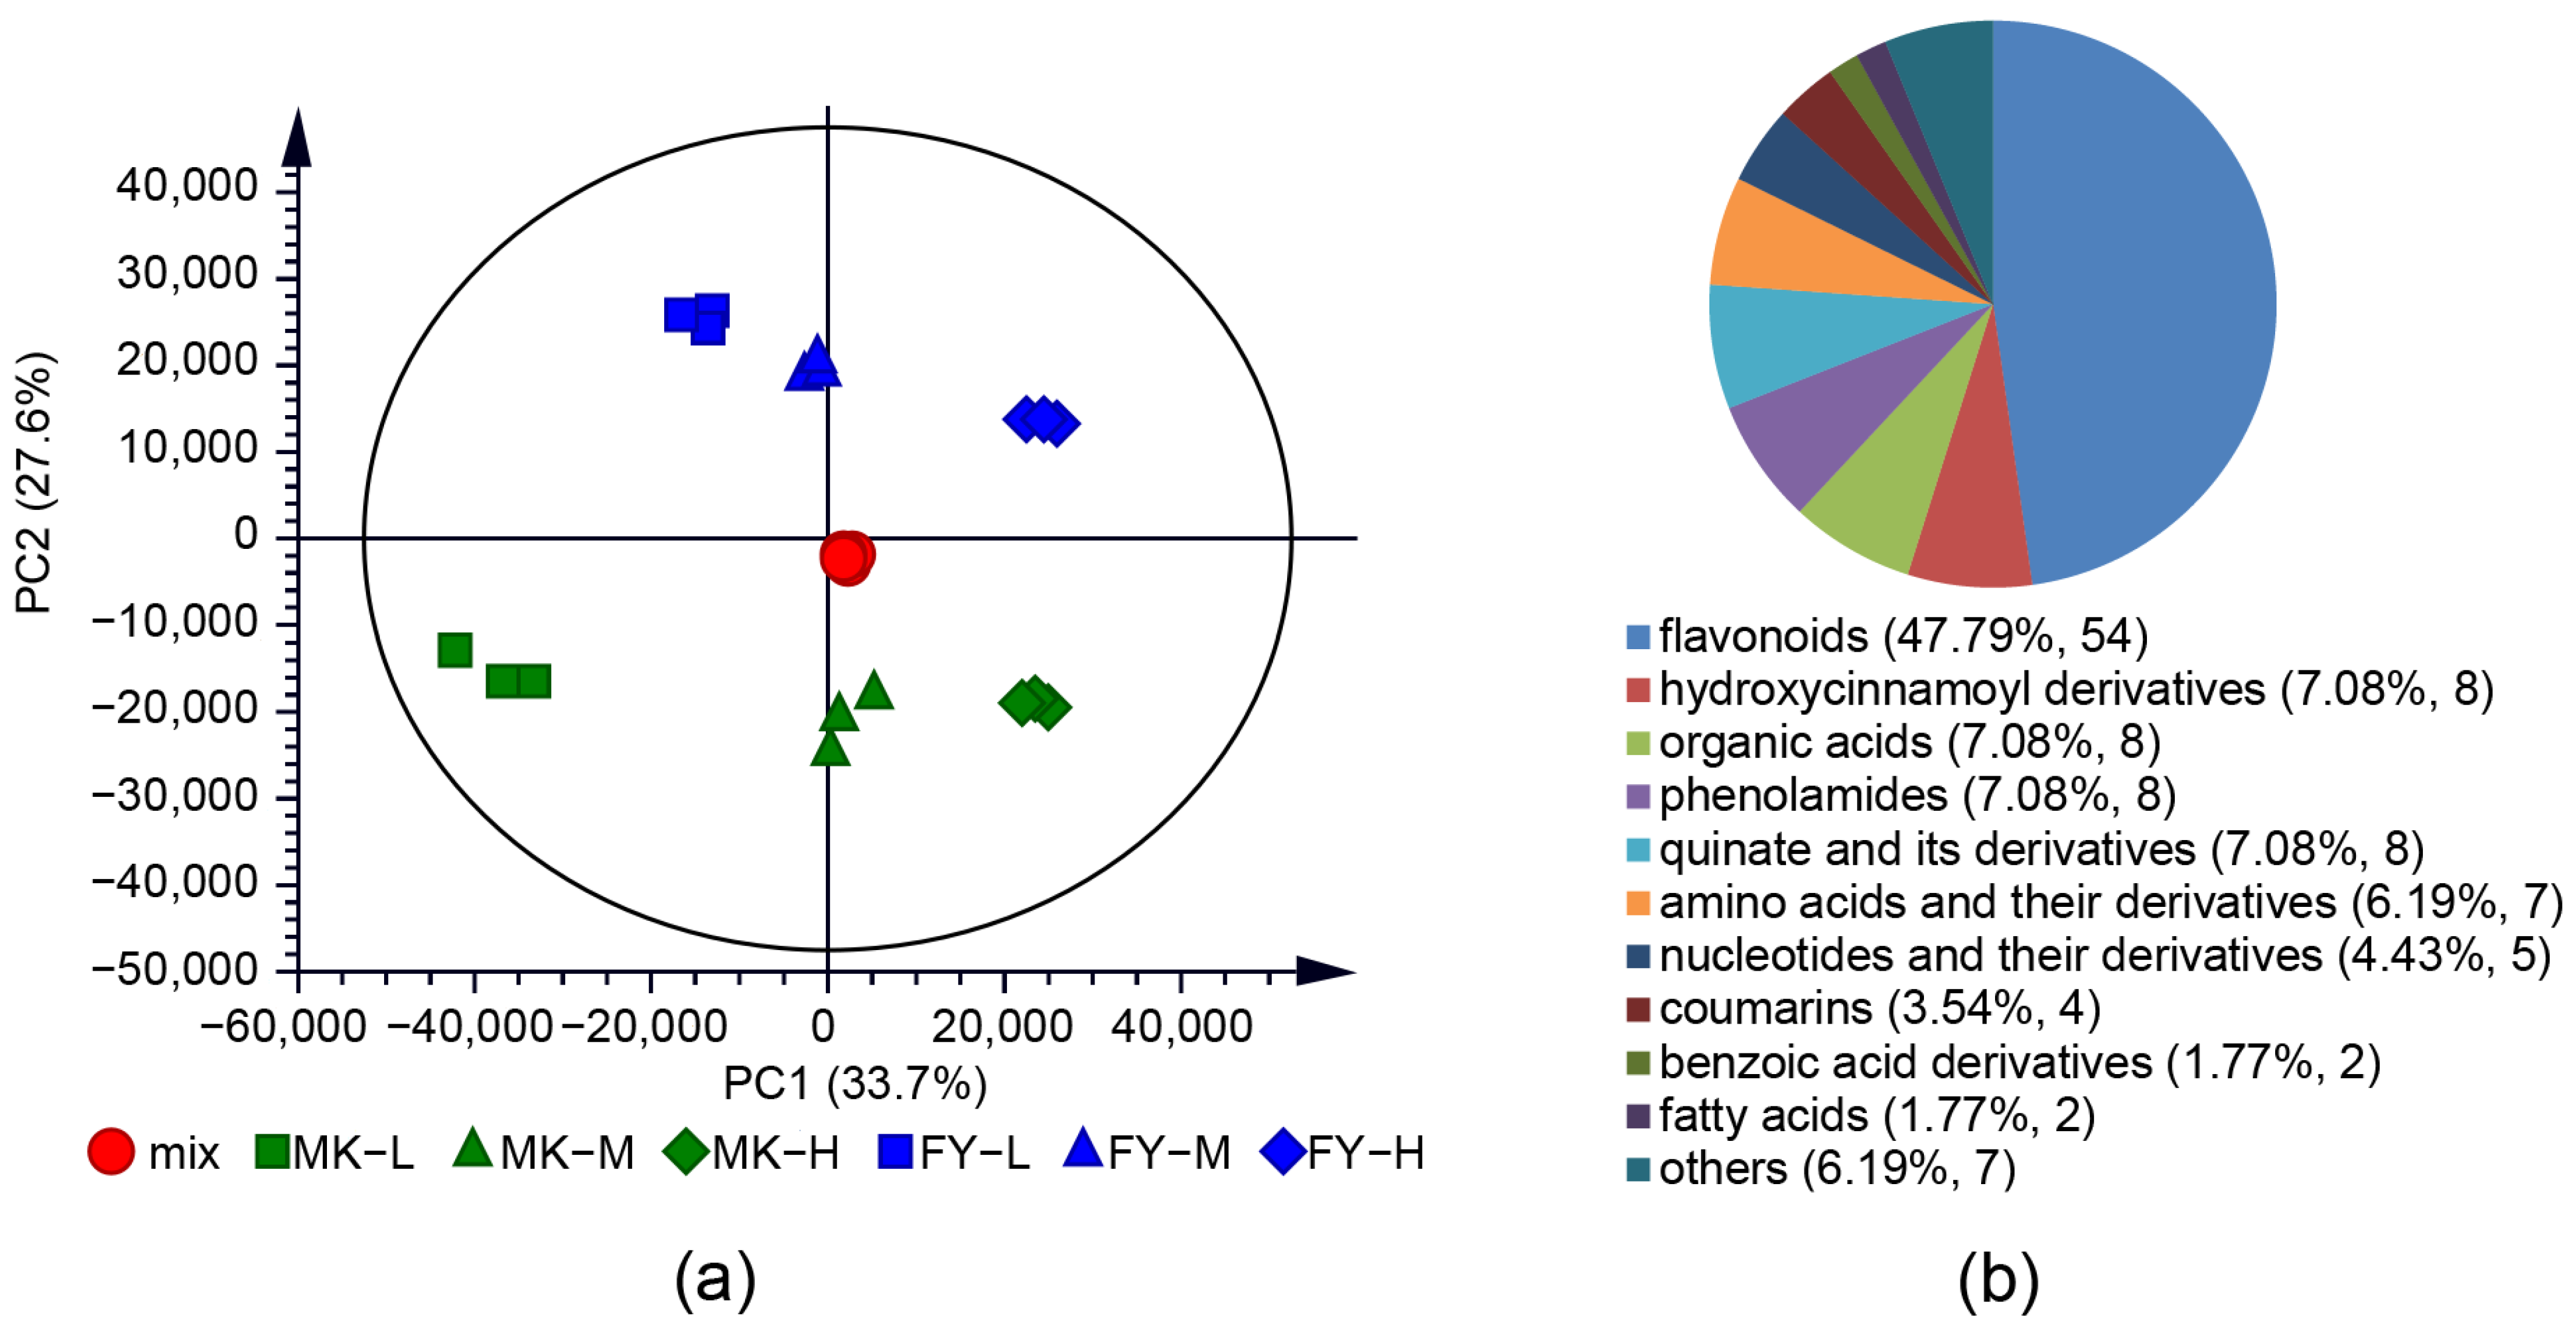
3.1. Metabolite Profiles of Tea Samples from Different Cultivation Altitudes and Cultivars

The metabolites of tea samples derived from three cultivation altitudes of two cultivars were determined using the UPLC-MS/MS assay platform. After preprocessing the metabolite data, we applied an unsupervised PCA method to visualize the variations in metabolites among all tea samples. The results show a separation of sample groups, indicating significant differences in metabolite profiles (Figure 1a). The three replicates in each group formed tight clusters, as did the combination of quality control samples. This indicates that the experimental conditions are stable and reproducible. The first and second principal components explained 61.30% of the total variance, with PC1 and PC2 accounting for 33.70% and 27.60%, respectively. Furthermore, tea sample groups could be clearly separated from each other, indicating the substantial impact of both cultivation altitude and cultivar on the tea metabolites. In addition, tea samples from different cultivars were slightly more distinguishable than those from various cultivation altitudes.
A PLS-DA model was constructed for identified metabolites from all tea samples to obtain VIP values, and one-way ANOVA was performed to assess the significance of difference. Metabolites with VIP values exceeding 1 and p-values below 0.05 were considered differential metabolites. Finally, a set of 113 metabolites were screened out and classified into 11 categories (Table S2). Among them, flavonoids accounted for nearly half (47.79%) of all differential metabolites, containing 54 compounds. These were followed by hydroxycinnamoyl derivatives (8), organic acids (8), phenolamides (8), quinate and its derivatives (8), amino acids and their derivatives (7), nucleotides and their derivates (5), coumarins (4), benzoic acid derivatives (2), fatty acids (2) and other compounds (7), with proportions ranging from 1.77% to 7.08% (Figure 1b).

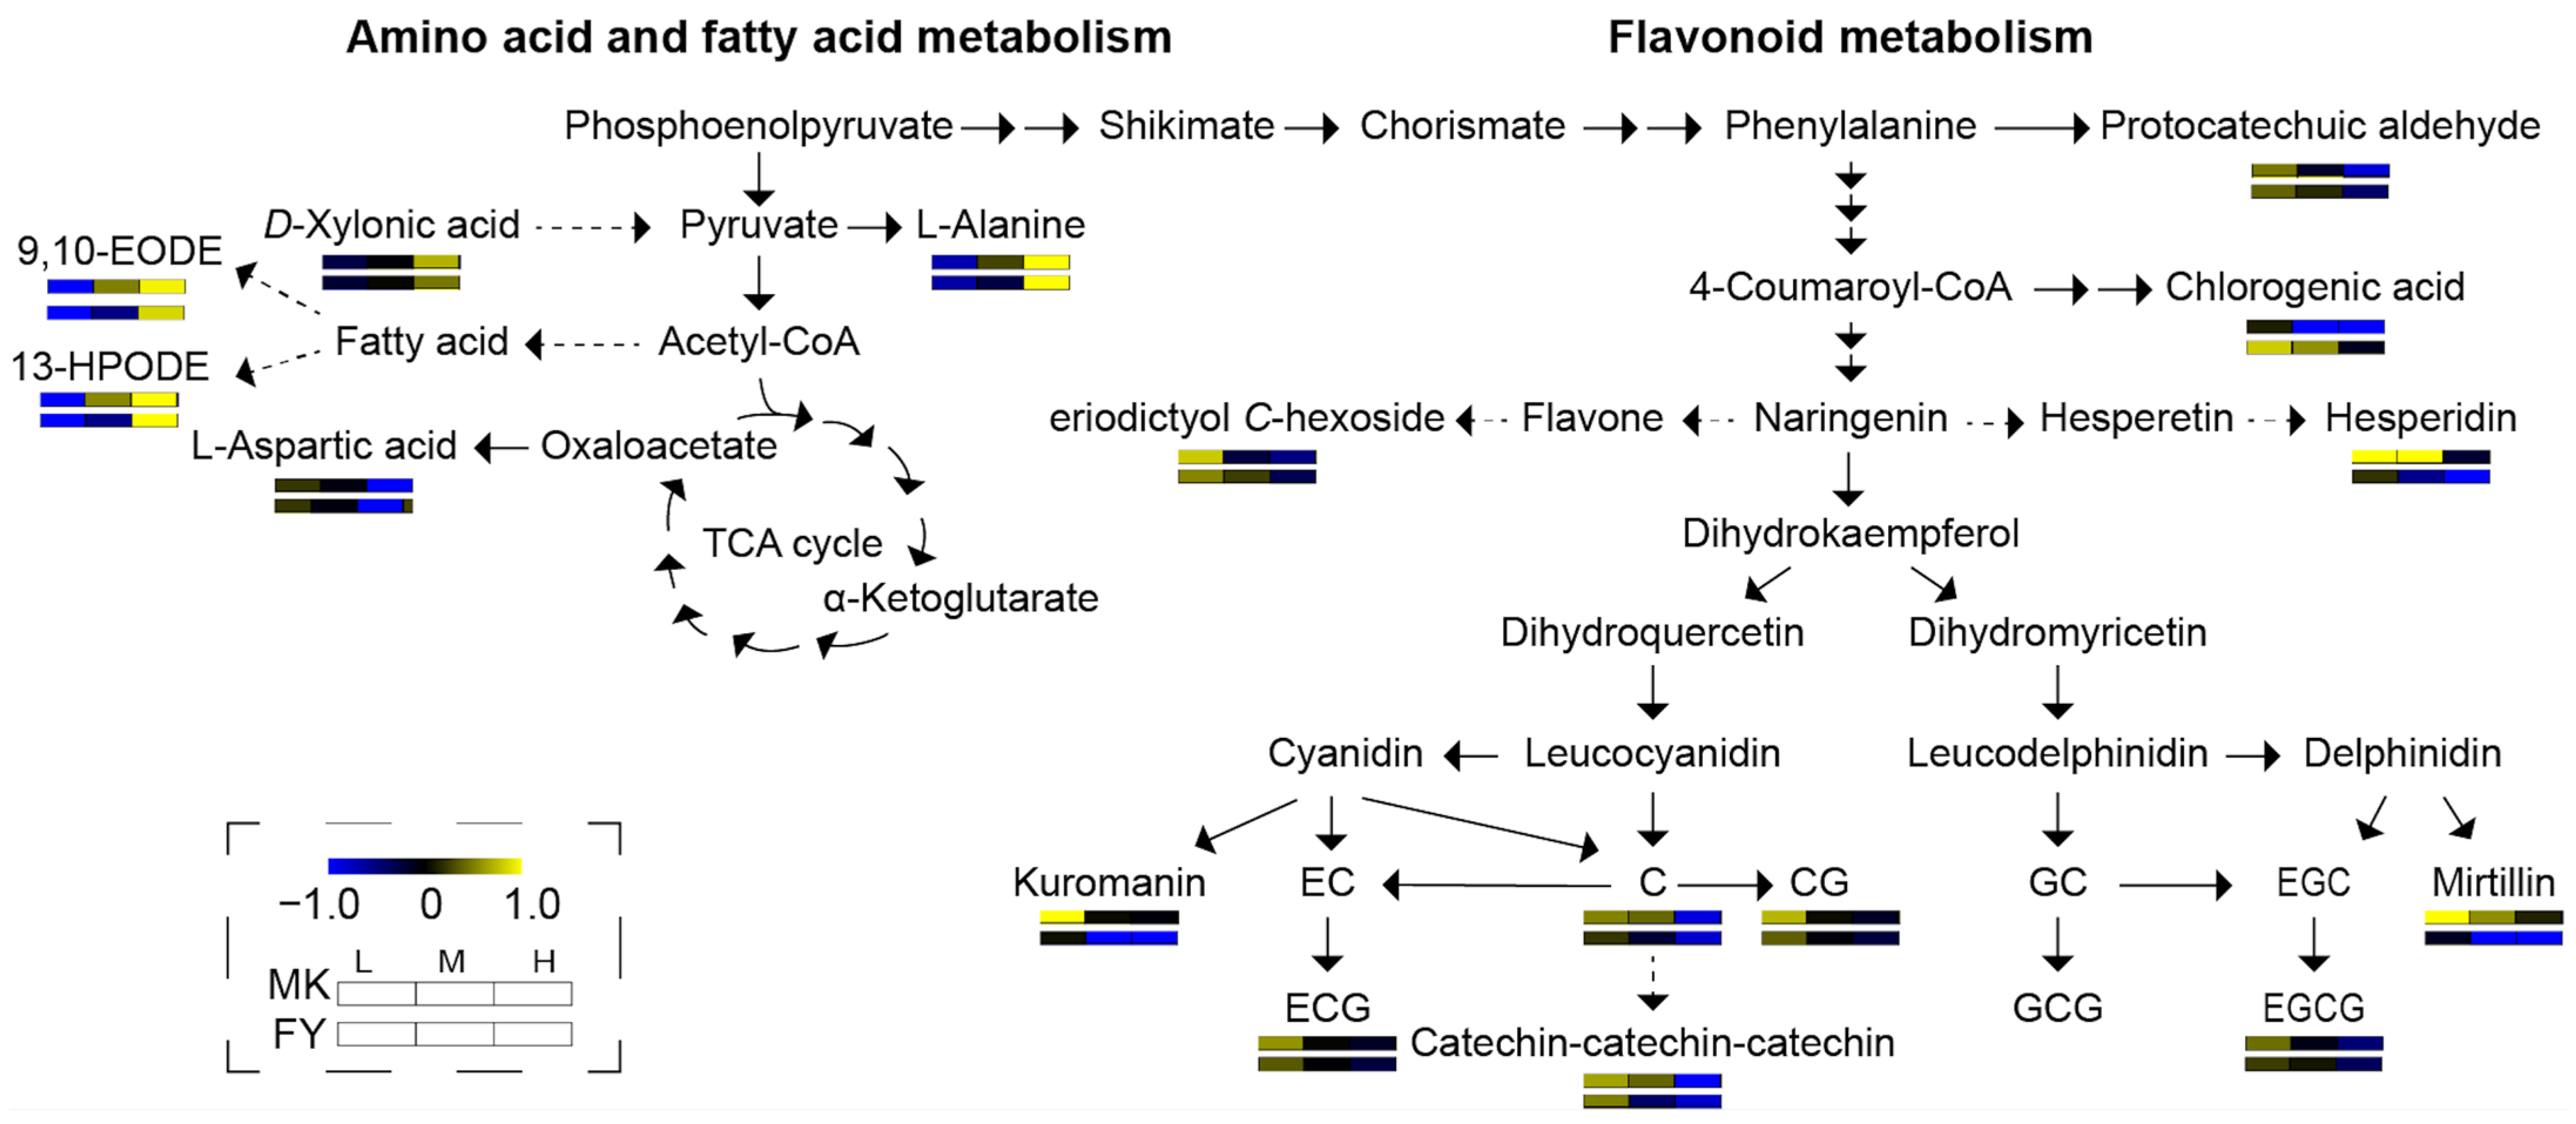
3.2. Effect of Cultivation Altitude on Tea Metabolites
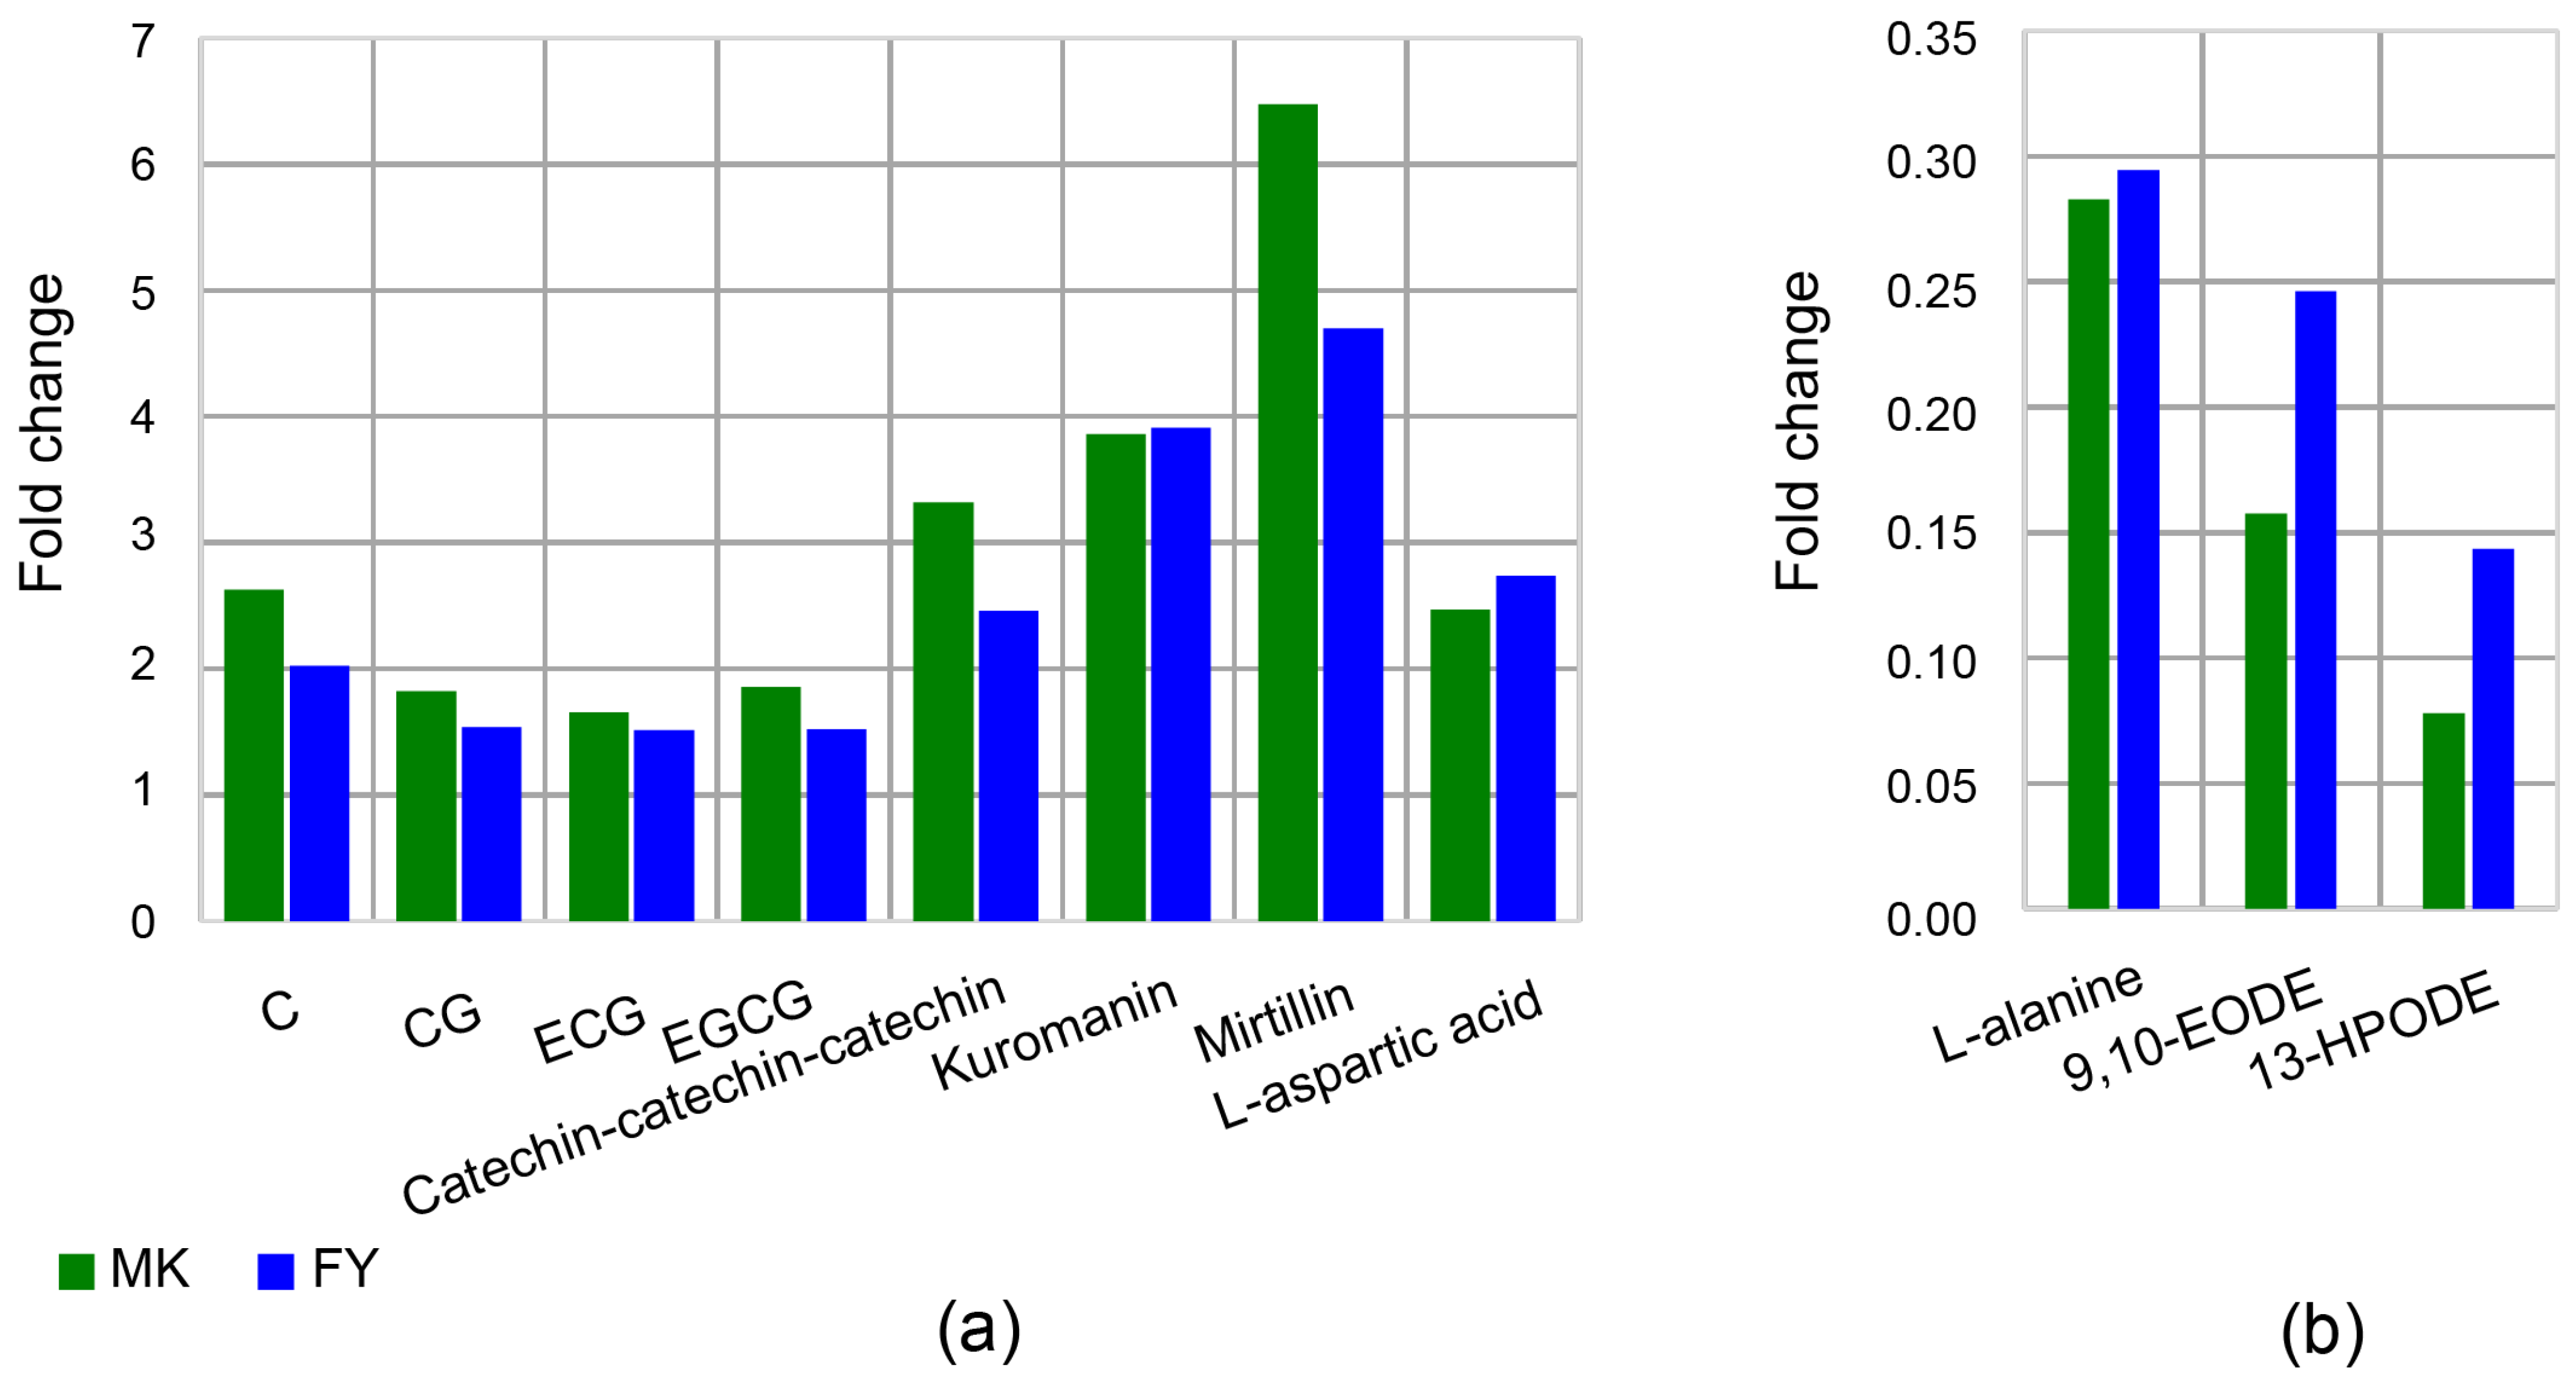
The effect of cultivation altitude on tea metabolites was investigated using a supervised PLS-DA model and the one-way ANOVA method. The results reveal diverse patterns of metabolite accumulation in tea plants at different cultivation altitudes. As shown in Figure 2, tea samples from both cultivars at low, medium, and high altitudes were obviously differentiated based on PC1 and PC2. The evaluation parameters for constructing the model included R2X, R2Y, and Q2, where Q2 represents the predictive capability of the model. A Q2 value exceeding 0.5 could be considered indicative of a valid model, while a Q2 value surpassing 0.9 signifies an excellent model. The PLS-DA score plots for MK and FY reveal Q2 values of 0.988 and 0.989, respectively, which strongly indicate the excellence of both constructed PLS-DA models. The 100-permutation cross-validation analyses yielded R2 and Q2 intercepts of 0.291 and −0.257 for MK tea samples, and 0.290 and −0.288 for FY tea samples, respectively. The cross-validation results for both PLS-DA models show that R2 values exceeded Q2, and the Q2 regression line’s intercept with the Y-axis falls below zero (Figure 2c,d). These results confirm the absence of overfitting in the PLS-DA models, emphasizing their robustness in categorizing the samples precisely.
Differential metabolites between tea samples from various altitudes in the respective cultivars were identified based on the threshold (VIP > 1 and p-value < 0.05). There were 64 altitude-related differential metabolites in MK, while it was 56 in FY (Table S2). Furthermore, a total of 28 differential metabolites in both cultivars exhibited a trend of gradually increasing or decreasing content with the change in altitude (Table S2). For the MK tea samples, the following compounds were detected: flavone and its C-glycosides (8), catechins and their derivatives (6), flavonol (4), amino acids (2), anthocyanins (2), fatty acids (2), quinate and its derivatives (2), flavanone (1), and organic acids (1). In comparison, the FY tea samples contained a variety of compounds, including catechins and their derivatives (6), amino acids and their derivatives (5), anthocyanins (3), fatty acids (2), flavone C-glycosides (2), hydroxycinnamoyl derivatives (2), flavanone (1), flavonol (1), nucleotides and their derivatives (1), organic acids (1), quinate and its derivatives (1), and other compounds (3). Among them, 16 compounds were consistent in both cultivars, and they were primarily distributed in the metabolic pathways of flavonoid (11 compounds), amino acid (3), and fatty acid (2). In general, the content of flavonoids decreased with increasing altitude, while the majority of amino acids and fatty acids showed the opposite trend (Figure 3).

3.2.1. Catechins

Catechins and their derivatives are the primary astringent compounds in tea infusions [20,21]. In this study, we found that five catechins and their derivatives, including C (catechin), CG (catechin gallate), ECG (epicatechin gallate), EGCG (epigallocatechin gallate), and catechin-catechin-catechin, were affected by altitude. The content of these compounds gradually decreases with increasing cultivation altitude (Figure 3). In MK, the relative content of catechin in low-altitude tea samples was 2.63 times that of high-altitude tea samples, CG was 1.82 times, ECG was 1.66 times, EGCG was 1.85 times, and catechin-catechin-catechin was 3.32 times, whereas in FY, the relative contents of catechin, CG, ECG, EGCG, and catechin-catechin-catechin in low-altitude tea samples were 2.02, 1.54, 1.52, 1.52, and 2.46 times those of the high-altitude tea samples, respectively (Figure 4a).

3.2.2. Anthocyanins

Anthocyanins are water-soluble pigments generated as one of the final products of the flavonoid pathway [22]. The level of anthocyanins in tea leaves is typically low, but this substance significantly impacts the quality of the tea [23]. In this study, we observed a decreasing trend in the levels of kuromanin (3-glucoside of cyanidin) and mirtillin (3-glucoside of delphinidin) as the altitude increased (Figure 3). The relative contents of kuromanin and mirtillin in low-altitude tea samples were 3.86 and 6.48 times and 3.91 and 4.70 times higher than those in the high-altitude tea samples in MK and FY, respectively (Figure 4a).

3.2.3. Amino Acids

Most amino acids are associated with umami and sweet flavors, rendering them valuable for mitigating the bitter taste induced by an excess of polyphenols in tea infusions [24]. In the present study, the concentration of L-alanine displayed an upward trend with the increase in altitude (Figure 3). The relative content of L-alanine in low-altitude tea samples was 0.28 times that in high-altitude tea samples in MK, while it was 0.29 times in FY (Figure 4b). Interestingly, we found that the L-aspartic acid content shows a negative correlation with altitude (Figure 3). The relative content of L-aspartic acid in low-altitude tea samples was 2.47 and 2.74 times higher than that in high-altitude tea samples in MK and FY, respectively (Figure 4a).

3.2.4. Fatty Acids

Fatty acids are closely associated with the formation of tea aroma [25,26]. The content levels of 9,10-EODE and 13-HPODE identified in this study increased with increasing altitude (Figure 3). The relative contents of 9,10-EODE and 13-HPODE in low-altitude tea samples were 0.16 and 0.08 times and 0.25 and 0.14 times lower than those in high-altitude tea samples in MK and FY, respectively (Figure 4b).

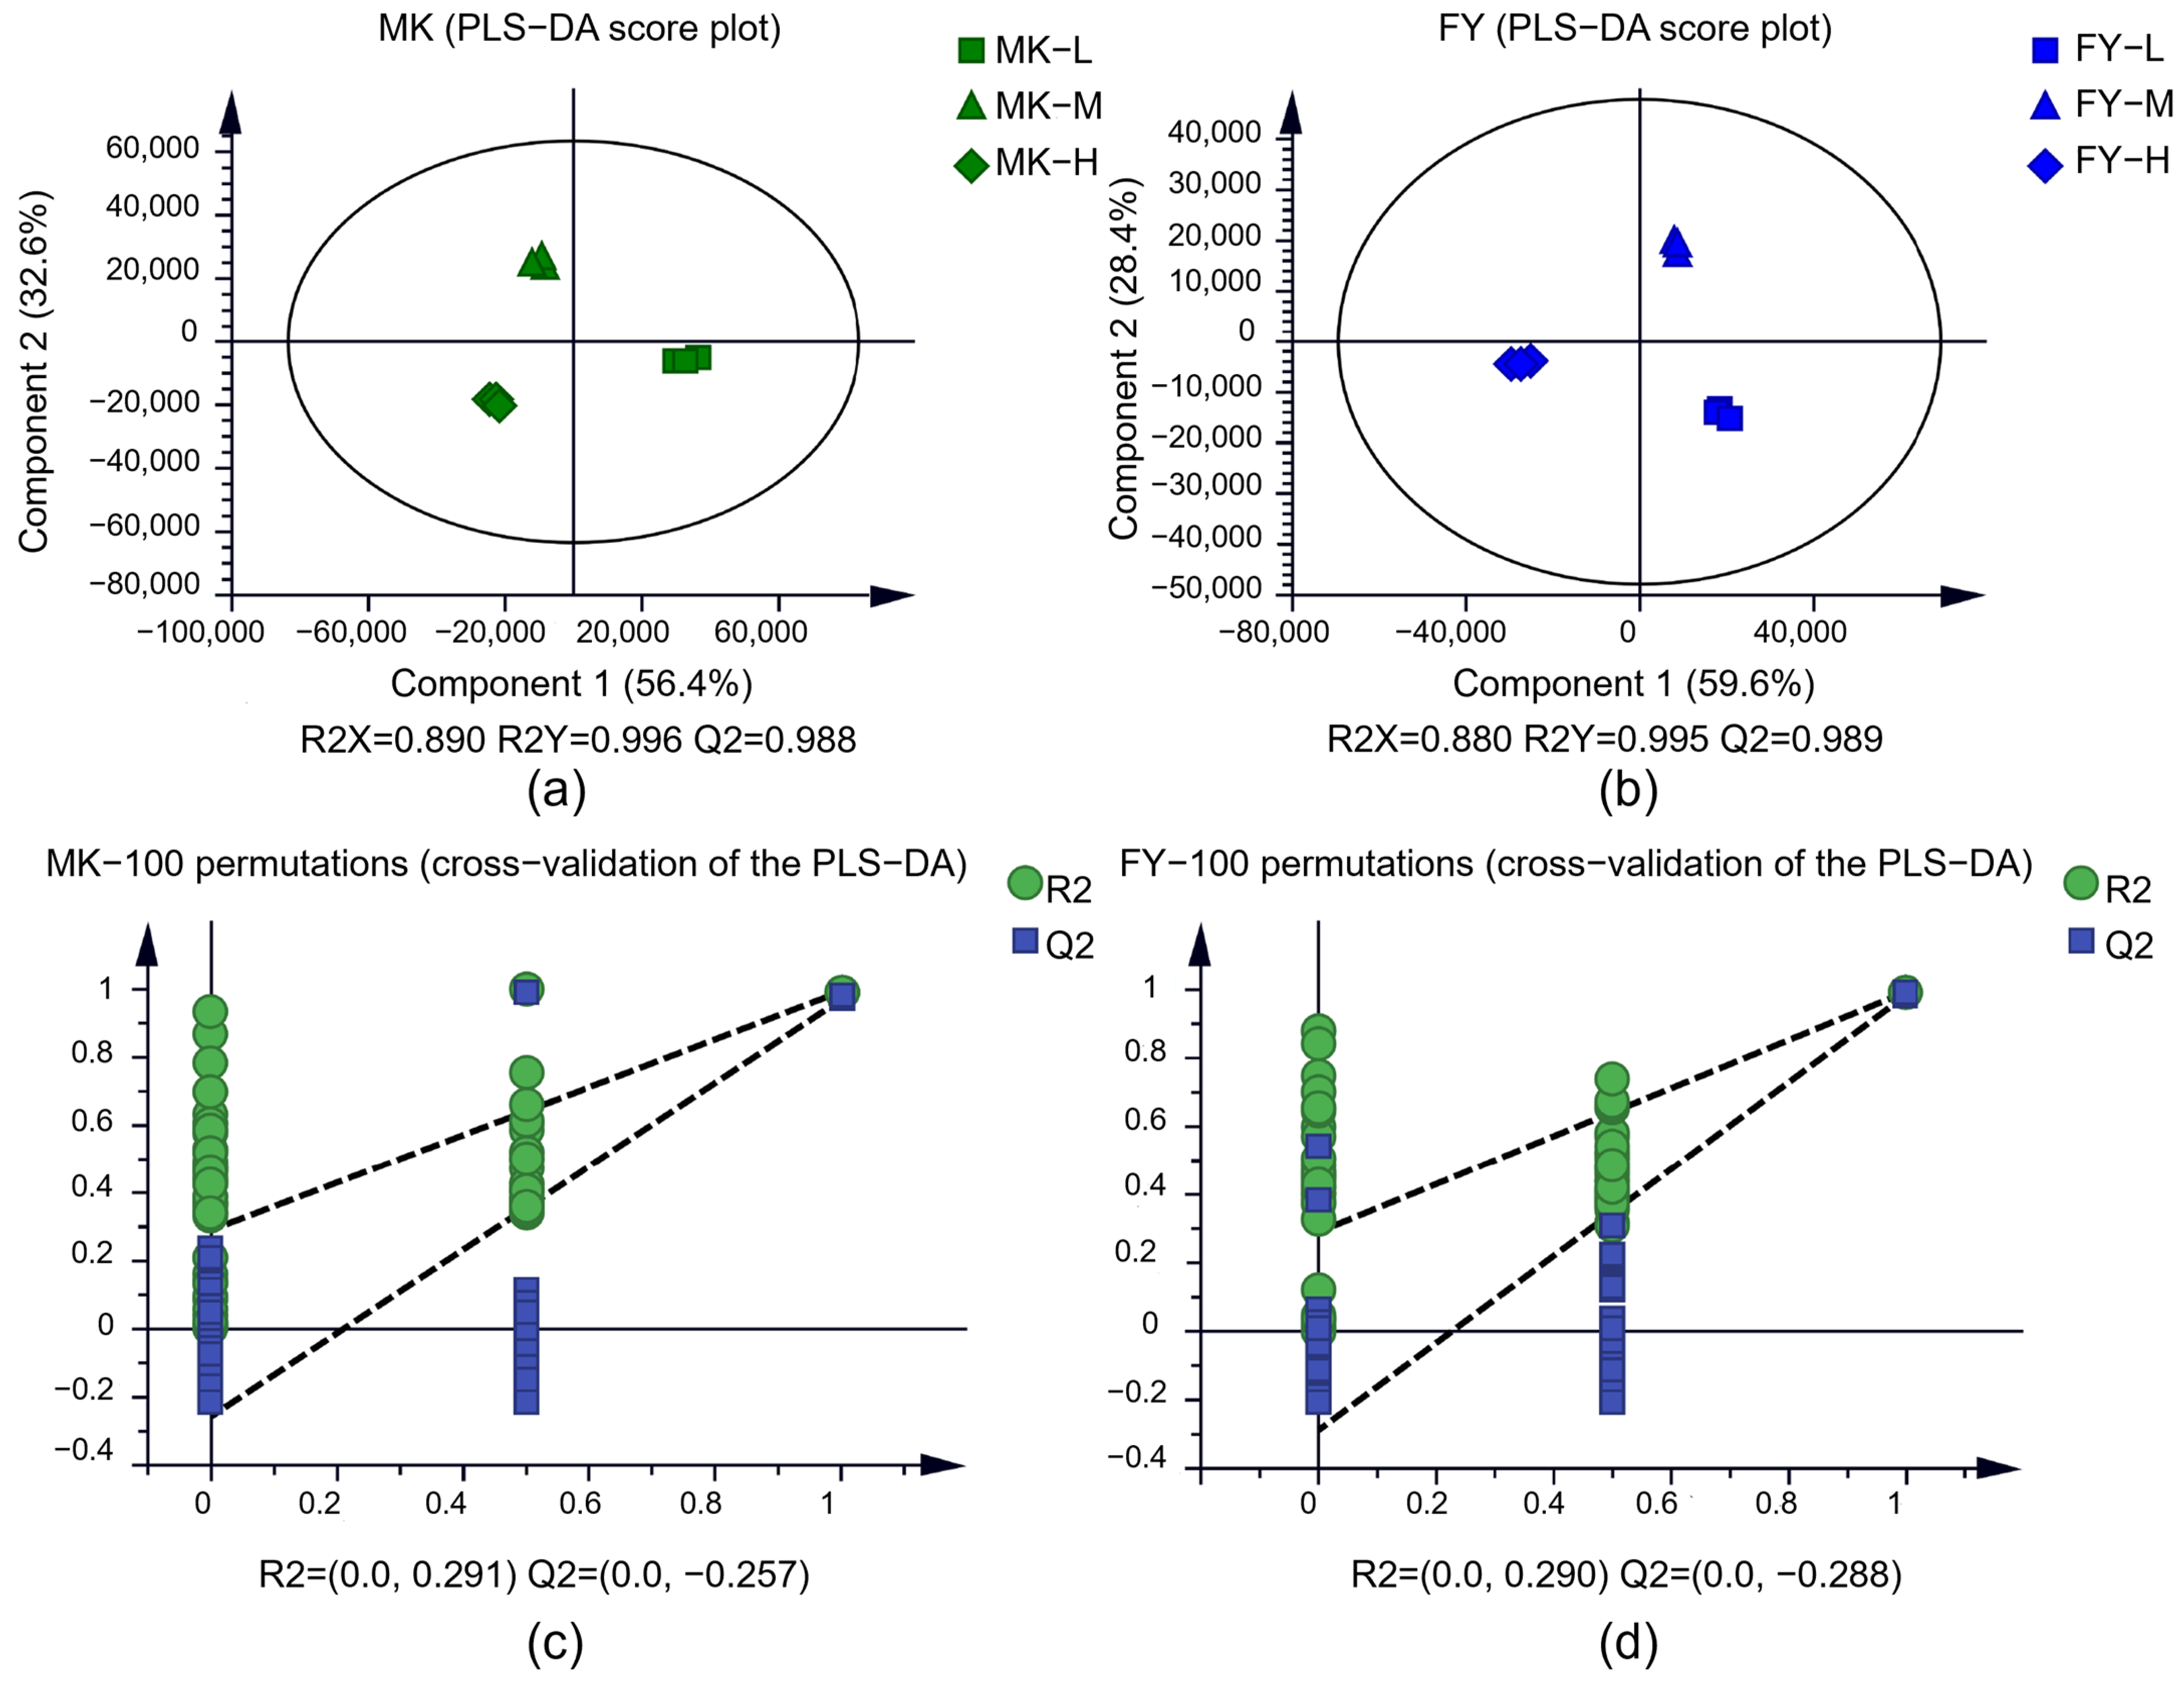
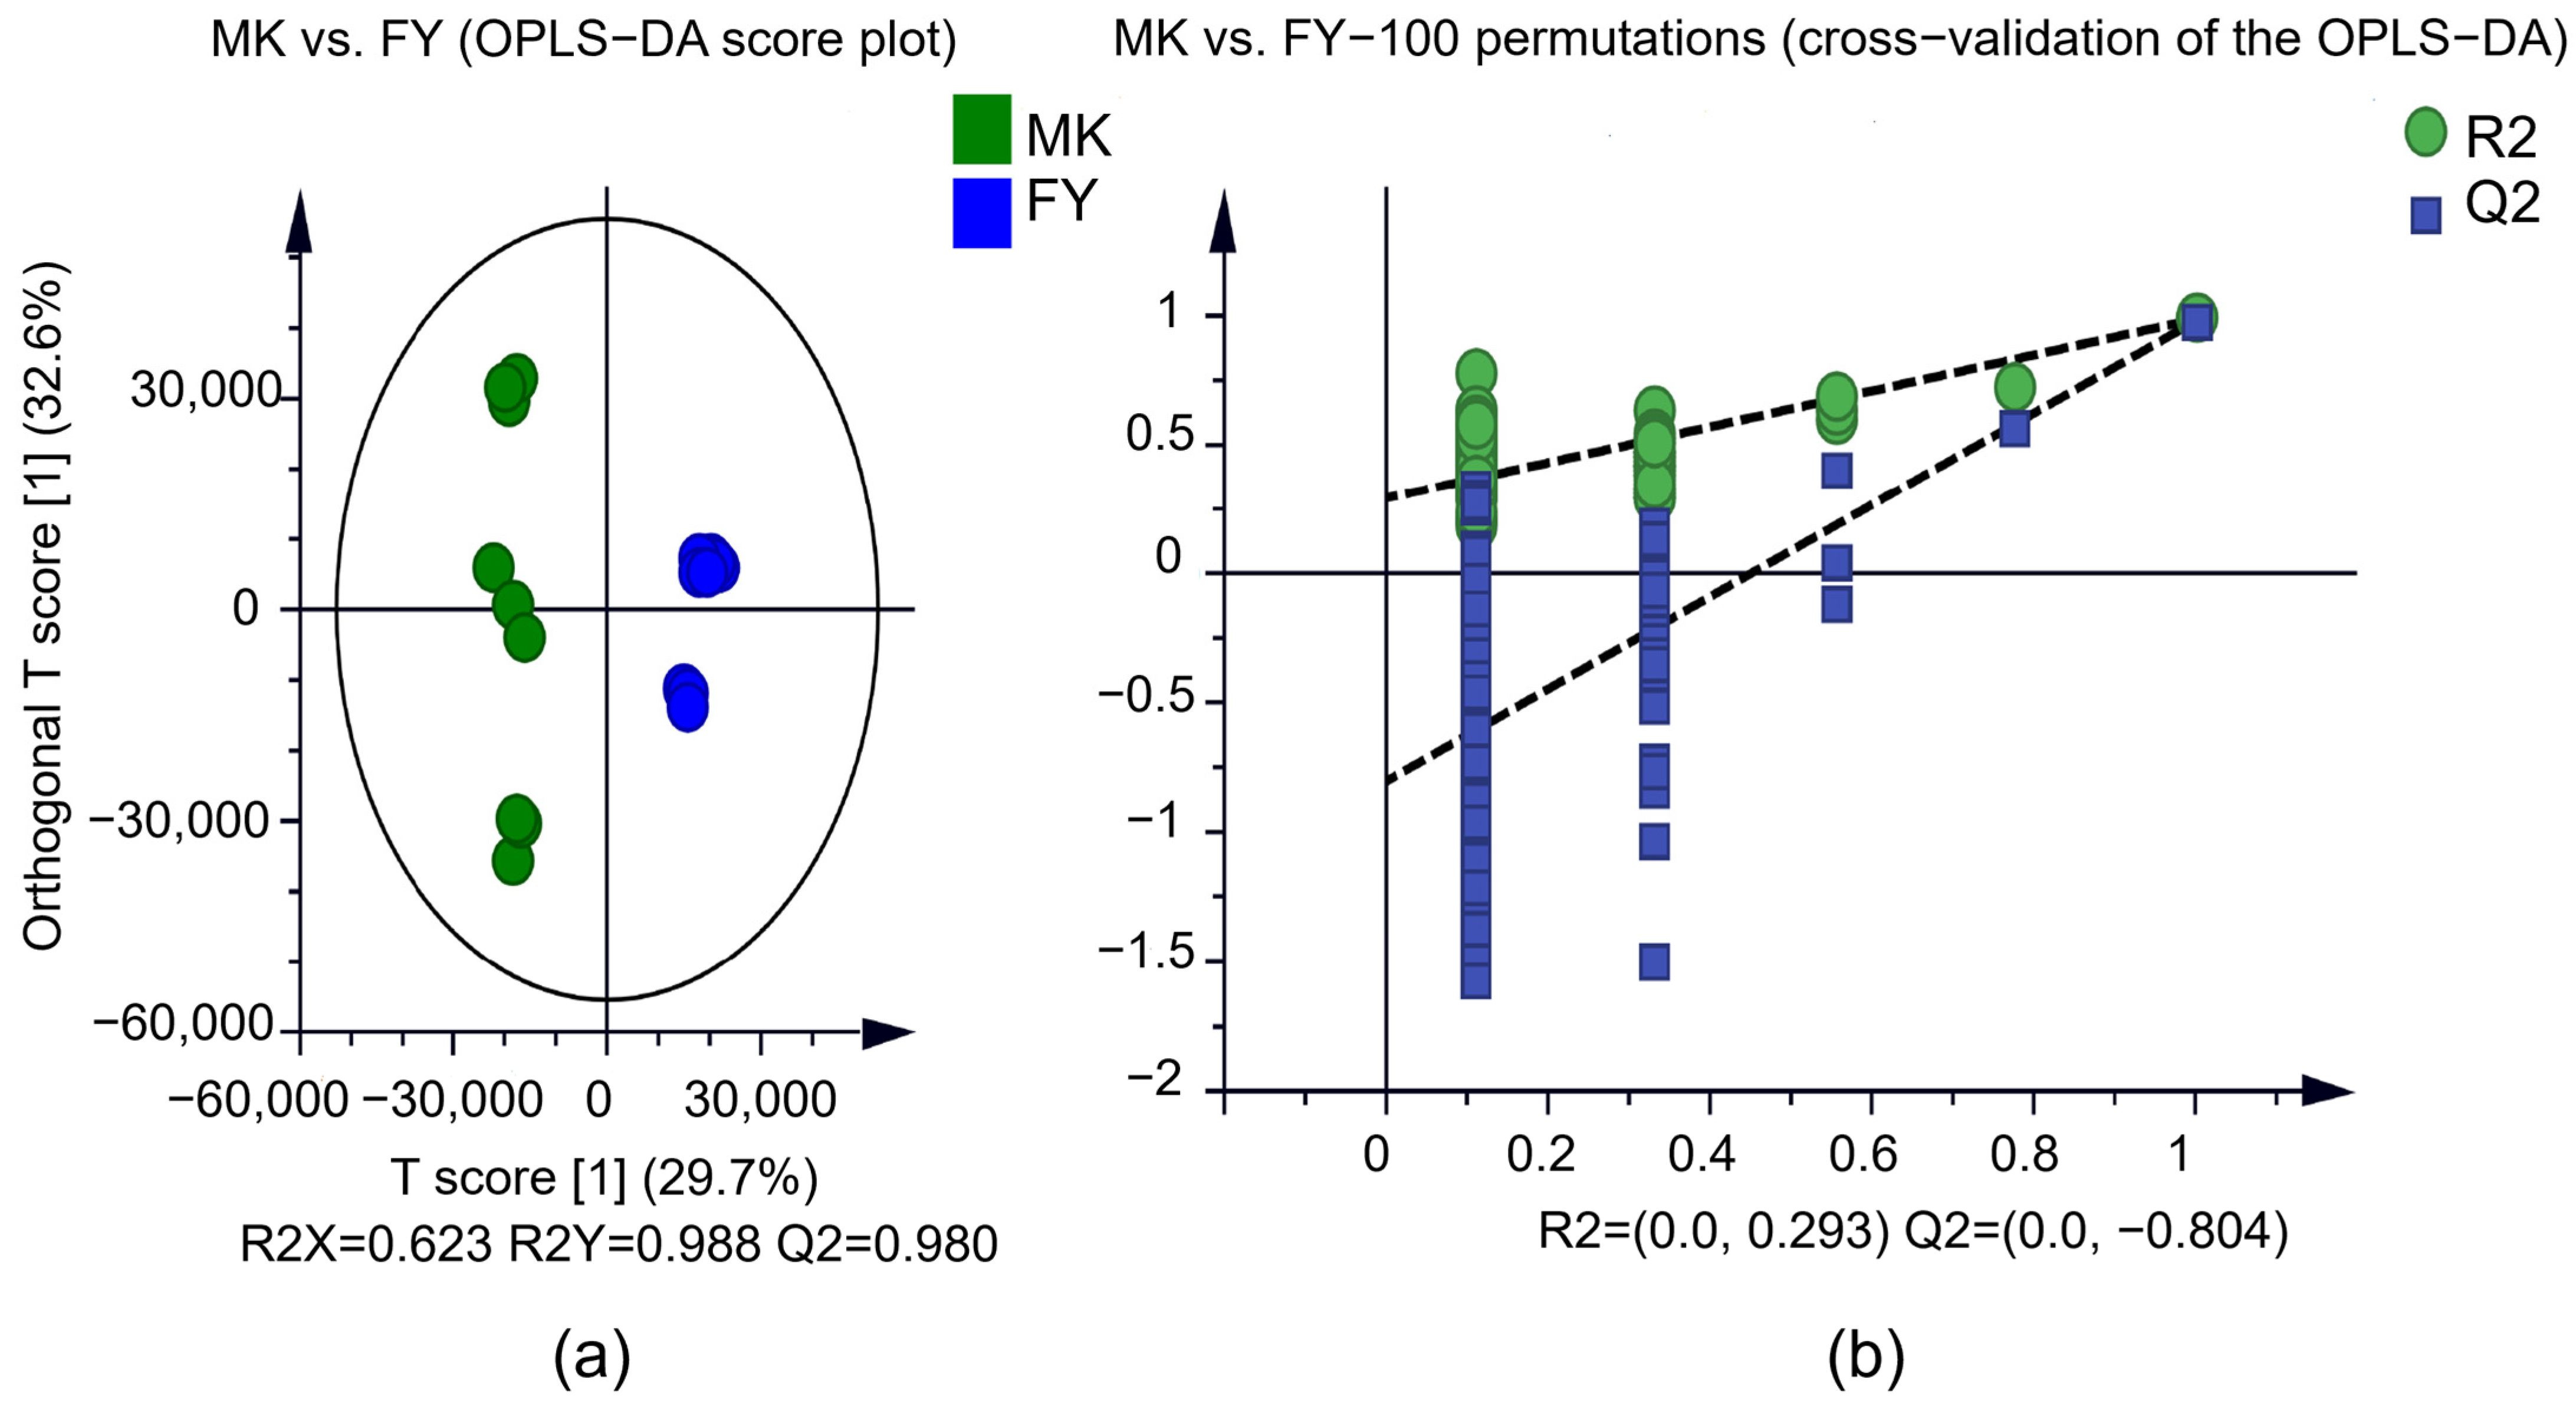
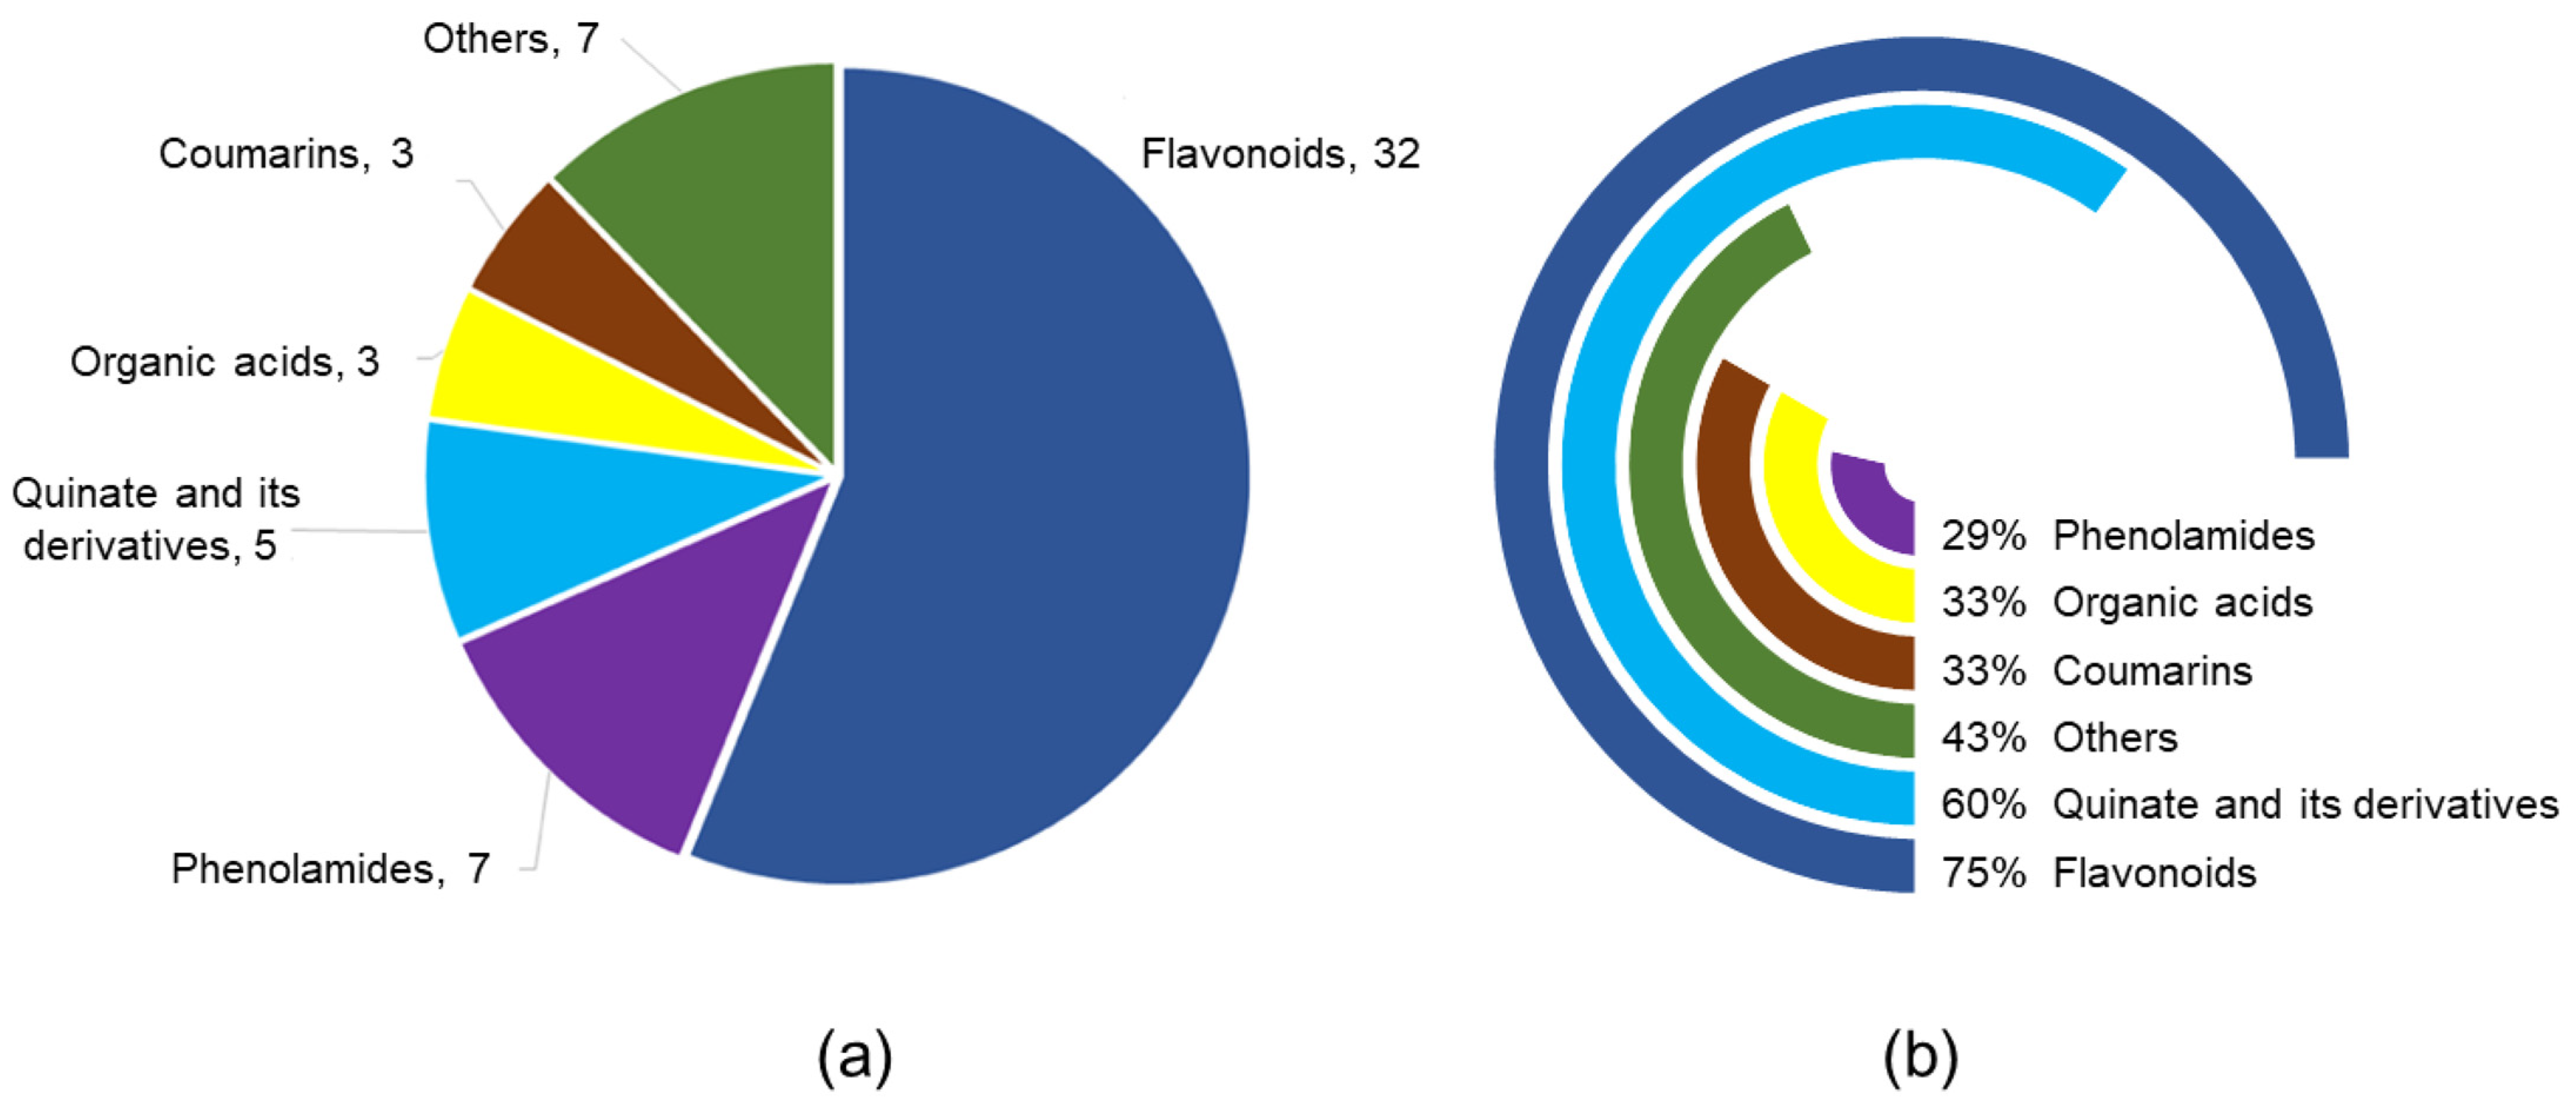
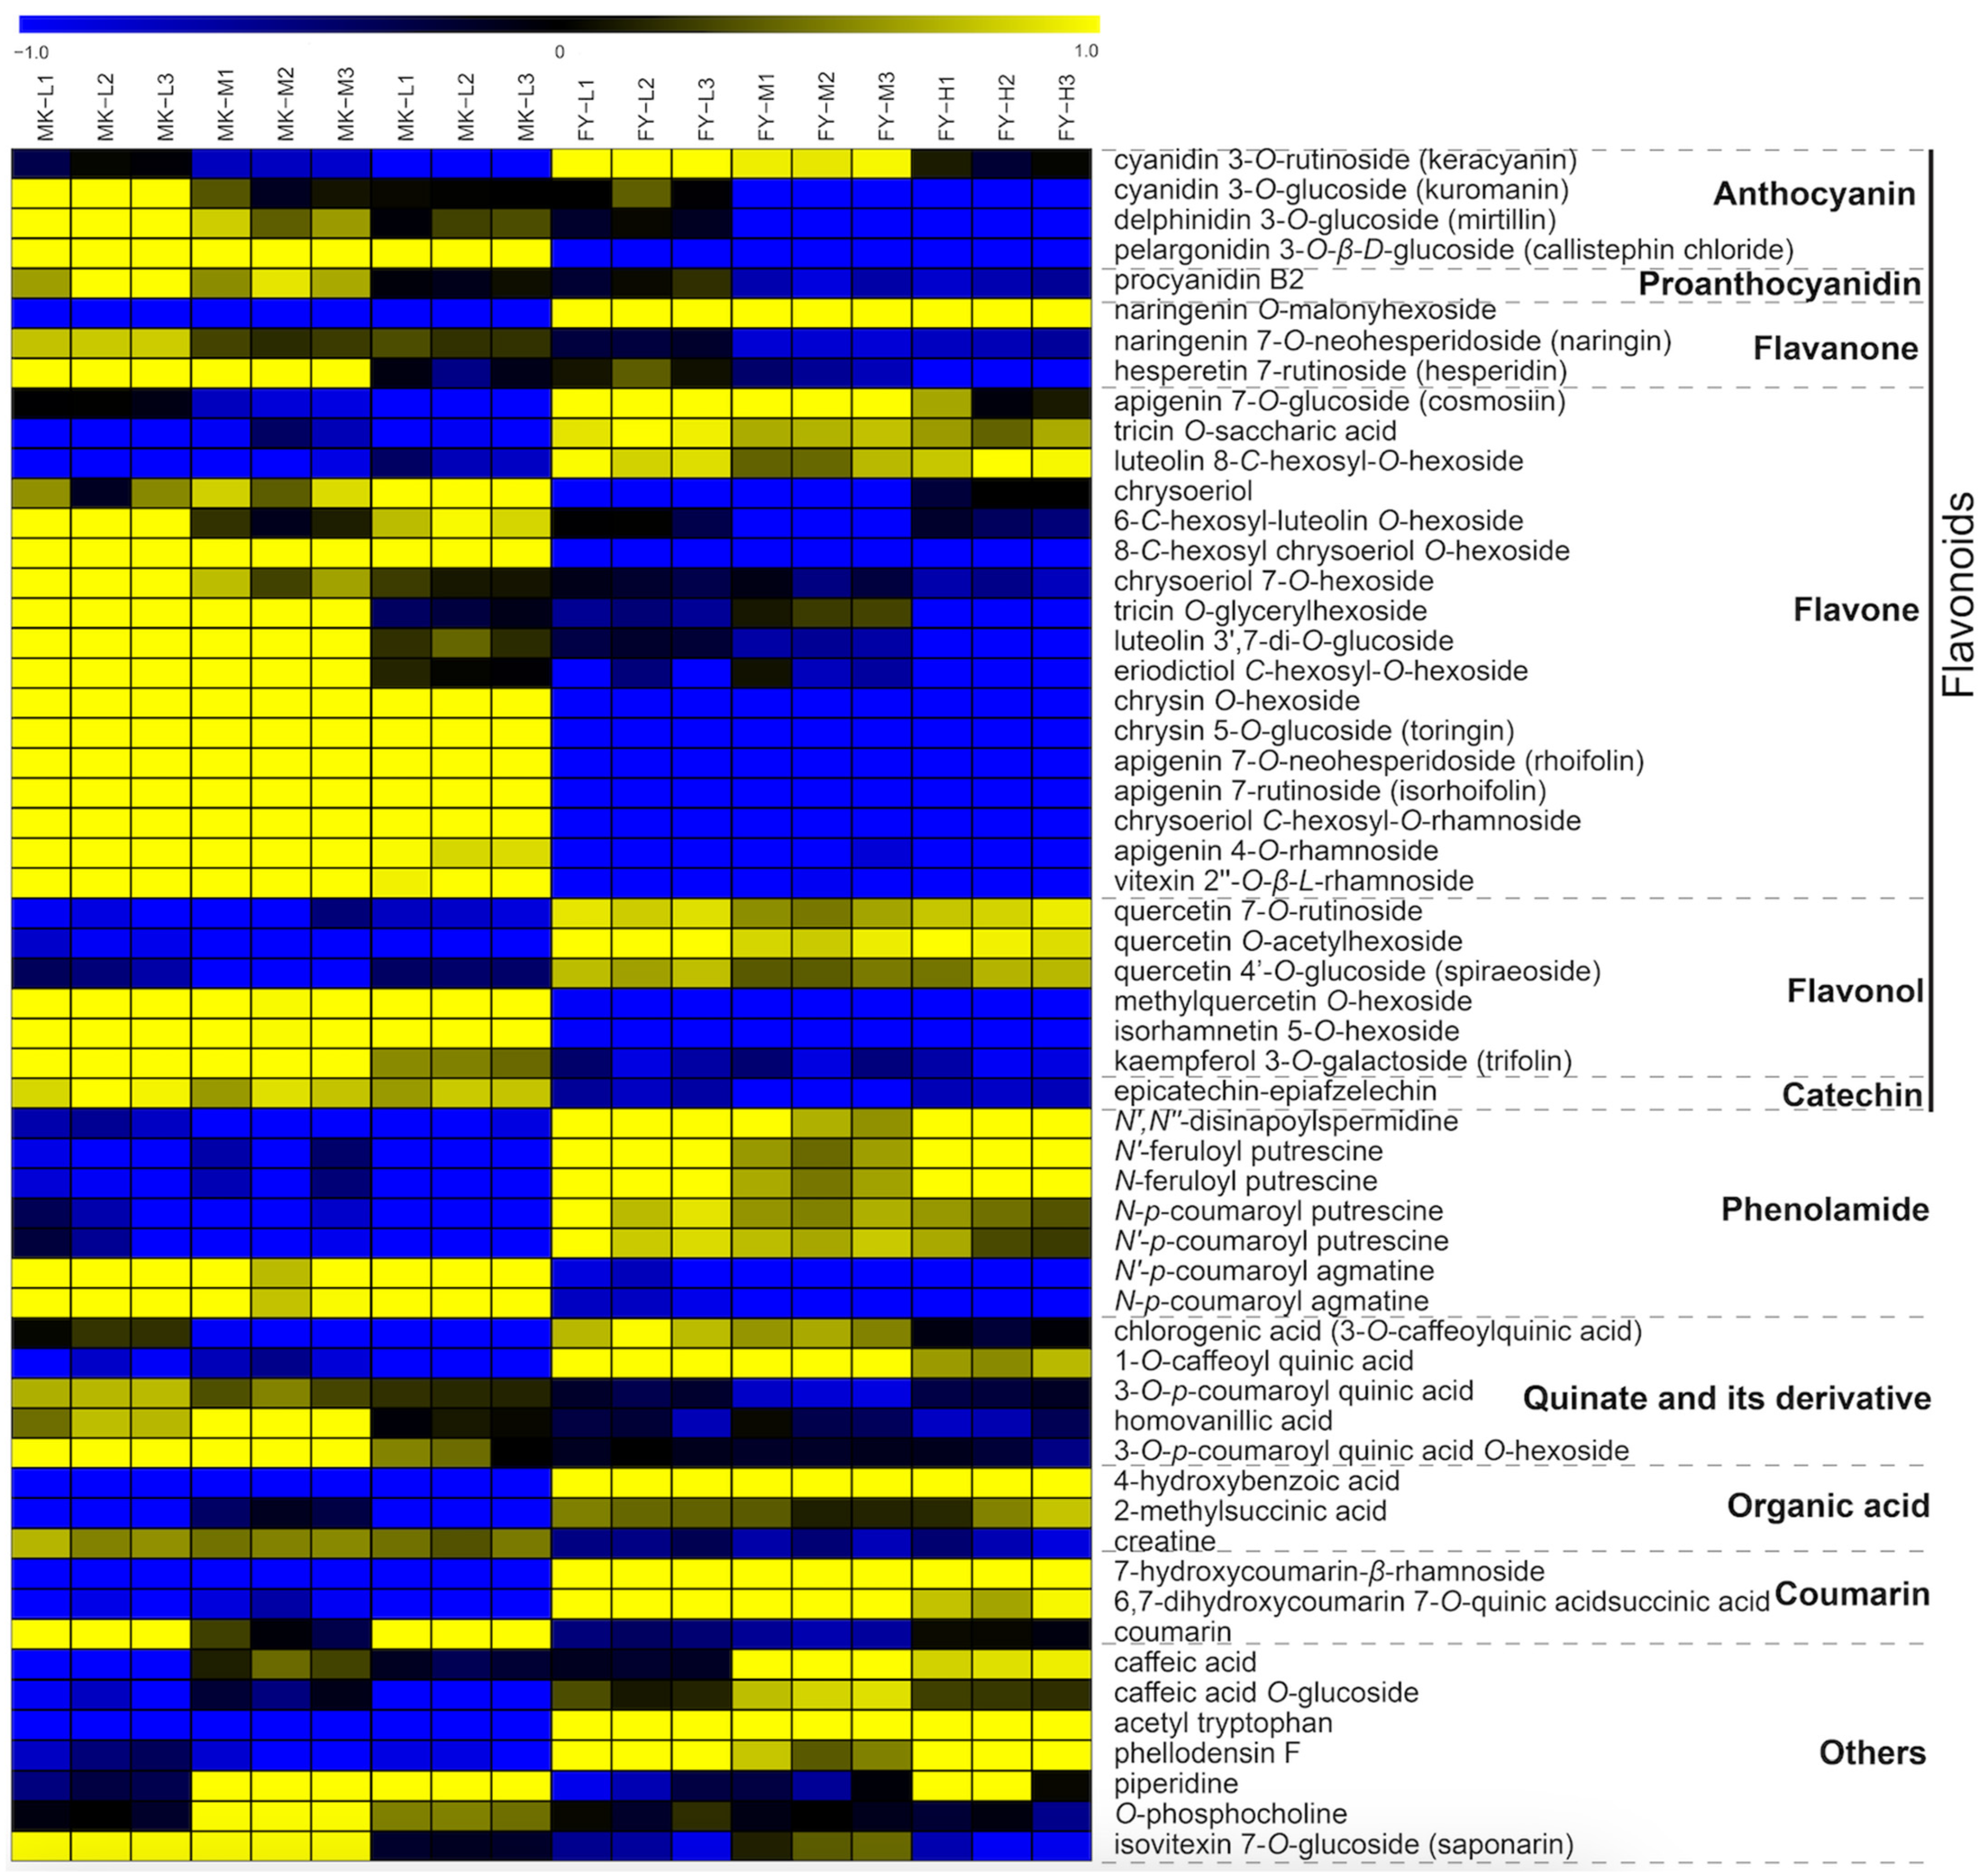
3.3. Metabolic Variation in the MK and FY Cultivar

An OPLS-DA model was created to calculate VIP values for tea samples from the MK and FY cultivars. P-values were obtained by conducting an independent sample t-test. Metabolites with a VIP value exceeding 1, a p-value less than 0.05, and a fold change greater than 2 or less than 0.5 were considered differential metabolites. According to Figure 5a, the OPLS-DA model successfully separated the two groups, indicating significant differences in metabolite patterns in tea samples from two cultivars. The OPLS-DA score plot of MK vs. FY revealed a Q2 value of 0.980, well surpassing the threshold of 0.9, indicating the excellence of the constructed model (Figure 5a). Furthermore, a permutation test, conducted 100 times, was performed to assess the potential overfitting of the OPLS-DA model. As depicted in Figure 5b, with an R2 of 0.293 and a Q2 of −0.804, where R2 exceeded Q2 and the intercept of the Q2 regression line with the Y-axis was below zero, it was confirmed that the PLS-DA model was not overfitted.
Between MK and FY tea samples, 57 differential metabolites were identified (Table S2). Of these differential metabolites, flavonoids were predominant with a number of 32, followed by 7 phenolamides, 5 quinates and its derivatives, 3 organic acids, 3 coumarins, and 7 other compounds (Figure 6a). Furthermore, we found that the proportions of various compounds with higher content in MK ranged from 29% (phenolamides) to 75% (flavonoids), totaling 60% (34 of 57) (Figure 6b). In addition, three specific metabolites were detected in the MK and FY cultivars. Among them, 8-C-hexosyl chrysoeriol O-hexoside and pelargonidin 3-O-β-D-glucoside were exclusively found in MK, while 4-hydroxybenzoic acid was present only in FY. These three compounds could serve as metabolic signatures for distinguishing the two cultivars. A total heatmap of the differential metabolites in MK and FY is shown in Figure 7. As expected, we found that most anthocyanin compounds in the MK cultivar showed relatively higher content than in the FY cultivar, except for cyanidin 3-O-rutinoside (keracyanin). This is consistent with the phenotype, as the tender leaves of MK are purplish green, while those of FY are yellowish green.

4. Discussion

The tea plant, an economically important beverage crop, produces a myriad of functional metabolites that are the important foundation of the tea’s quality and flavor formation.
Widely targeted metabolomic analysis is a powerful approach, amalgamating the strengths of both non-targeted and targeted metabolomics, which allows for the simultaneous quantification of a thousand metabolites. This method has been applied to decipher the dynamic changes of metabolites in tea processing [17,18,19,27]. In this study, we employed widely targeted metabolomic technology to analyze tea samples from two cultivars planted at three altitudes. As a result, a total of 113 differential metabolites belonging to 11 metabolite classes were detected across all tea samples. Additionally, 64 altitude-related differential metabolites were identified in cultivar MK, while FY exhibited 56. These compounds bear some resemblance to those documented in previous studies [28]. These results indicate that widely targeted metabolomics is a specialized tool for metabolic analysis, for revealing possible effects of environmental factors on tea metabolites.
The distinctive characteristics of high-mountain tea are lower bitterness and astringency, better freshness and sweetness, and better aroma. Green tea catechins can bind to the human taste receptor hTAS2R39, which is responsible for bitter taste perception [29,30,31]. Our results show that the content of catechins decreased with increasing altitude, which aligns with the expected lower bitterness of high-mountain tea. Changes in altitude would lead to significant differences in environmental factors such as temperature, light intensity and quality, and air humidity. The temperature decreases by approximately 0.6 degrees Celsius for every 100 m of altitude increase. Higher temperatures would significantly induce the expressions of CsDFR, CsANS, and CsANR, resulting in increased catechin levels [9,32]. Furthermore, Hayashi et al. revealed that elevated levels of galloylated catechins contribute to a robust astringent taste in tea infusions [33]. In this study, we observed a negative correlation between the levels of galloylated catechins (CG, ECG, and EGCG) and altitude, which is consistent with previous research findings [12]. This may explain the lower astringency observed in high-mountain tea. In addition, we observed that anthocyanins content was higher in samples from lower altitudes. Generally, the content of anthocyanins is negatively correlated with the quality of green tea, as these compounds can lead to a darker color and a more bitter taste in tea infusions. Environmental factors such as light intensity and temperature can influence the metabolism of anthocyanins in tea plants [34,35]. Higher temperatures at lower altitudes may result in an increased level of anthocyanins in tea plants [36].
Amino acids contribute to diverse flavors, and 26 L-type amino acids have been identified in tea plants. Light intensity could affect amino acid metabolism by regulating chloroplast formation. Wang et al. found that the expression levels of CsClpP3 and CsDegP2 increased in simulated high-altitude environments [9]. CsClpP3 and CsDegP2 were present in chloroplasts, and the soluble chloroplast protein Rubisco underwent hydrolysis to produce free amino acids under their mediation [37]. L-theanine is a unique compound found in tea plants, making up most of the total free amino acids [38]. It also contributes to the formation of a fresh and sweet taste in green tea. L-alanine with a sweet flavor is a precursor to L-theanine [39]. Our data show that the content of L-alanine tends to increase with altitude. This could partly explain the relatively higher levels of L-theanine observed in high-altitude tea samples, aligning with findings from previous studies [9,40]. Additionally, we found that the content of L-aspartic acid tends to decrease with altitude. L-aspartic acid has a slight sour taste, which can harmonize tea flavor. However, with an increase in concentration, the acidity gradually intensifies, resulting in a decrease in the freshness of tea infusions [41]. Therefore, it is speculated that the decrease in the content of aspartic acid is beneficial for enhancing the flavor of high-altitude tea leaves.
The formation of tea aromas is closely related to fatty acid metabolism. 9,10-EODE and 13-HPODE, classified as polyunsaturated fatty acids, are important precursors for the synthesis of green-note aroma compounds. In our study, it was found that the content of these two substances showed an increasing trend with increasing altitude. A similar result was also observed in other plants, such as Dendrobium nobile [42]. This finding is consistent with previous research conducted on tea plants under simulated high-altitude conditions, wherein aroma compound contents increased due to upregulated expressions of key structural genes [9].
There were considerable variations in the metabolite profiles of tea samples from different cultivars. Flavonoids play a crucial role in shaping the flavor of tea, influencing its color, taste, and aroma [43]. In the present study, flavonoids accounted for the majority of the total differential metabolites between MK and FY. This is similar to the previous findings in that cultivar is an important factor affecting the differences in flavonoid content [44,45]. Furthermore, we found that most of the anthocyanin-like differential metabolites detected had higher accumulation in MK. This is consistent with the phenotype, as the tender leaves of MK are purplish green, while those of FY are yellowish green. Moreover, phenolamides represent a diverse category of secondary metabolites widely present in plants, contributing significantly to plant development and defense mechanisms against biotic and abiotic stress [46]. A metabolic analysis by Wang et al. revealed that the phenolamides that accumulated in tea plants were predominantly protonated aliphatic phenolamides [47]. Our results show that all seven differential phenolamide compounds identified belonged to protonated aliphatic phenolamides, and five of them were higher in FY than in MK. It is worthy of further investigation to determine whether these compounds could lead to differences in resistance between cultivars.
Investigating the influence of cultivation altitude and cultivar on tea metabolites is of great significance, as understanding these environmental and genetic factors can assist farmers in determining the most effective planting strategies. Furthermore, it can aid breeders in selecting tea plant cultivars that are of high quality and possess greater adaptability. Additionally, comprehending the variations in metabolite levels among different cultivars at various cultivation altitudes can provide customized guidance for post-harvest processing and tea manufacturing, such as adjusting fermentation parameters for black tea processing based on specific metabolite levels. This study provides a preliminary analysis of the effects of cultivation altitude and cultivar on tea metabolites. However, the relatively narrow range of altitudes and tea plant cultivars chosen herein may somewhat limit the broad applicability of the findings. Therefore, further investigations could expand the altitude range and include a broader array of tea plant cultivars. This expansion, along with increased sample size and diversity, would lead to a more thorough understanding of how altitude and cultivar affect tea metabolites, consequently offering stronger scientific evidence to improve tea quality and cultivation strategies.

5. Conclusions

The metabolic variation in tea samples from three cultivation altitudes of the MK and FY cultivars was analyzed using widely targeted metabolomics using UPLC-MS/MS. Consequently, tea samples could be clearly separated by altitude and cultivar in the PCA model. A total of 64 and 56 altitude-related differential metabolites exhibiting an increasing or decreasing content with the change in altitude were identified in MK and FY, respectively. Among them, 16 compounds were consistent in both cultivars and were mainly clustered in the metabolic pathways for flavonoid (11 compounds), amino acid (3), and fatty acid (2). Overall, flavonoid content gradually decreased with increasing altitude, while amino acids and fatty acids showed an opposite trend. Furthermore, we identified 57 differential metabolites between two cultivars. Two specific compounds (8-C-hexosyl chrysoeriol O-hexoside and pelargonidin 3-O-β-D-glucoside) were exclusively found in MK, while one compound (4-hydroxybenzoic acid) was present only in FY. These findings offer insight into the metabolic responses of tea plants to different altitudes, providing further understanding of the influence of environment on tea plants.

Supplementary Materials

The following supporting information can be downloaded at https://www.mdpi.com/article/10.3390/agronomy14040812/s1: Table S1: Information of tea samples used for widely targeted metabolomic analysis; Table S2: Differential metabolites detected in all tea samples.

Author Contributions

Conceptualization, J.M., L.C. and D.M.; methodology, X.T., S.C., Q.Z., J.W., J.C. and J.M.; formal analysis, X.T., S.C. and J.M.; writing—original draft preparation, X.T., S.C. and J.M.; writing—review and editing, J.M., L.C. and D.M.; project administration, J.M.; funding acquisition, J.M., D.M. and L.C. All authors have read and agreed to the published version of the manuscript.

Funding

This research was funded by the Key R&D Program of Shandong Province, China, grant number 2023LZGCQY015; Major Project of Agricultural Science and Technology in Breeding of Tea Plant Variety in Zhejiang Province, grant number 2021C02067; Chinese Academy of Agricultural Sciences through the Agricultural Science and Technology Innovation Program, grant number CAASASTIP-2021-TRICAAS; Earmarked Fund for China Agriculture Research System of MOF and MARA, grant number CARS-19; and China Postdoctoral Science Foundation, grant number 2021M703546.

Data Availability Statement

The data that support the findings of this study can be found within the manuscript and its Supplementary Information.

Conflicts of Interest

The authors declare no conflicts of interest.

References

  1. Gao, T.; Shao, S.; Hou, B.; Hong, Y.; Ren, W.; Jin, S.; Gao, S.; Wang, P.; Ye, N. Characteristic volatile components and transcriptional regulation of seven major tea cultivars (Camellia sinensis) in China. Bev. Plant Res. 2023, 3, 17. [Google Scholar] [CrossRef]
  2. Astill, C.; Birch, M.R.; Dacombe, C.; Humphrey, P.G.; Martin, P.T. Factors Affecting the Caffeine and Polyphenol Contents of Black and Green Tea Infusions. J. Agric. Food Chem. 2001, 49, 5340–5347. [Google Scholar] [CrossRef] [PubMed]
  3. Ahmed, S.; Griffin, T.S.; Kraner, D.; Schaffner, M.K.; Sharma, D.; Hazel, M.; Leitch, A.R.; Orians, C.M.; Han, W.; Stepp, J.R.; et al. Environmental Factors Variably Impact Tea Secondary Metabolites in the Context of Climate Change. Front. Plant Sci. 2019, 10, 939. [Google Scholar] [CrossRef] [PubMed]
  4. Aaqil, M.; Peng, C.; Kamal, A.; Nawaz, T.; Zhang, F.; Gong, J. Tea Harvesting and Processing Techniques and Its Effect on Phytochemical Profile and Final Quality of Black Tea: A Review. Foods 2023, 12, 4467. [Google Scholar] [CrossRef]
  5. Chowaniak, M.; Niemiec, M.; Zhu, Z.; Rashidov, N.; Gródek-Szostak, Z.; Szeląg-Sikora, A.; Sikora, J.; Kuboń, M.; Fayzullo, S.A.; Mahmadyorzoda, U.M.; et al. Quality Assessment of Wild and Cultivated Green Tea from Different Regions of China. Molecules 2021, 26, 3620. [Google Scholar] [CrossRef] [PubMed]
  6. Wang, Z.; Gan, S.; Sun, W.; Chen, Z. Quality Characteristics of Oolong Tea Products in Different Regions and the Contribution of Thirteen Phytochemical Components to Its Taste. Horticulturae 2022, 8, 278. [Google Scholar] [CrossRef]
  7. Wang, C.-M.; Du, X.; Nie, C.-N.; Zhang, X.; Tan, X.-Q.; Li, Q. Evaluation of sensory and safety quality characteristics of “high mountain tea”. Food Sci. Nutr. 2022, 10, 3338–3354. [Google Scholar] [CrossRef] [PubMed]
  8. Kfoury, N.; Morimoto, J.; Kern, A.; Scott, E.R.; Orians, C.M.; Ahmed, S.; Griffin, T.; Cash, S.B.; Stepp, J.R.; Xue, D.; et al. Striking changes in tea metabolites due to elevational effects. Food Chem. 2018, 264, 334–341. [Google Scholar] [CrossRef]
  9. Wang, M.; Yang, J.; Li, J.; Zhou, X.; Xiao, Y.; Liao, Y.; Tang, J.; Dong, F.; Zeng, L. Effects of temperature and light on quality-related metabolites in tea [Camellia sinensis (L.) Kuntze] leaves. Food Res. Int. 2022, 161, 111882. [Google Scholar] [CrossRef]
  10. Zeng, L.; Zhou, X.; Liao, Y.; Yang, Z. Roles of specialized metabolites in biological function and environmental adaptability of tea plant (Camellia sinensis) as a metabolite studying model. J. Adv. Res. 2021, 34, 159–171. [Google Scholar] [CrossRef]
  11. Wei, C.; Yang, H.; Wang, S.; Zhao, J.; Liu, C.; Gao, L.; Xia, E.; Lu, Y.; Tai, Y.; She, G.; et al. Draft genome sequence of Camellia sinensis var. sinensis provides insights into the evolution of the tea genome and tea quality. Proc. Natl. Acad. Sci. USA 2018, 115, E4151–E4158. [Google Scholar] [CrossRef] [PubMed]
  12. Chen, G.-H.; Yang, C.-Y.; Lee, S.-J.; Wu, C.-C.; Tzen, J.T.C. Catechin content and the degree of its galloylation in oolong tea are inversely correlated with cultivation altitude. J. Food Drug Anal. 2014, 22, 303–309. [Google Scholar] [CrossRef] [PubMed]
  13. Jiang, Y.; Boorboori, M.R.; Xu, Y.; Lin, W. The appearance of volatile aromas in Tieguanyin tea with different elevations. J. Food Sci. 2021, 86, 4405–4416. [Google Scholar] [CrossRef] [PubMed]
  14. Yang, S.; Pathak, S.; Tang, H.; Zhang, D.; Chen, Y.; Ntezimana, B.; Ni, D.; Yu, Z. Non-targeted metabolomics reveals the effects of different rolling methods on black tea quality. Foods 2024, 13, 325. [Google Scholar] [CrossRef]
  15. Yu, X.; Xiao, J.; Chen, S.; Yu, Y.; Ma, J.; Lin, Y.; Li, R.; Lin, J.; Fu, Z.; Zhou, Q.; et al. Metabolite signatures of diverse Camellia sinensis tea populations. Nat. Commun. 2021, 12, 1829. [Google Scholar] [CrossRef] [PubMed]
  16. Yang, C.; Chen, W.; Tang, D.; Tan, X.; Tan, L.; Tang, Q. Metabolomic and transcriptomic insights into anthocyanin biosynthesis in ‘Ziyan’ tea plants under varied photoperiod and temperature conditions. Agronomy 2024, 14, 56. [Google Scholar] [CrossRef]
  17. Chen, W.; Gong, L.; Guo, Z.; Wang, W.; Zhang, H.; Liu, X.; Yu, S.; Xiong, L.; Luo, J. A Novel Integrated Method for Large-scale Detection, Identification, and Quantification of Widely Targeted Metabolites: Application in the Study of Rice Metabolomics. Mol. Plant 2013, 6, 1769–1780. [Google Scholar] [CrossRef] [PubMed]
  18. Shi, Y.; Zhu, Y.; Ma, W.; Shi, J.; Peng, Q.; Lin, Z.; Lv, H. Comprehensive investigation on non-volatile and volatile metabolites in four types of green teas obtained from the same tea cultivar of Longjing 43 (Camellia sinensis var. sinensis) using the widely targeted metabolomics. Food Chem. 2022, 394, 133501. [Google Scholar] [CrossRef]
  19. Wang, H.; Hua, J.; Yu, Q.; Li, J.; Wang, J.; Deng, Y.; Yuan, H.; Jiang, Y. Widely targeted metabolomic analysis reveals dynamic changes in non-volatile and volatile metabolites during green tea processing. Food Chem. 2021, 363, 130131. [Google Scholar] [CrossRef]
  20. Zhang, L.; Cao, Q.-Q.; Granato, D.; Xu, Y.-Q.; Ho, C.-T. Association between chemistry and taste of tea: A review. Trends Food Sci. Technol. 2020, 101, 139–149. [Google Scholar] [CrossRef]
  21. Yu, P.; Yeo, A.S.-L.; Low, M.-Y.; Zhou, W. Identifying key non-volatile compounds in ready-to-drink green tea and their impact on taste profile. Food Chem. 2014, 155, 9–16. [Google Scholar] [CrossRef] [PubMed]
  22. Wang, X.; Liu, B.-Y.; Zhao, Q.; Sun, X.; Li, Y.; Duan, Z.; Miao, X.; Luo, S.; Li, J. Genomic Variance and Transcriptional Comparisons Reveal the Mechanisms of Leaf Color Affecting Palatability and Stressed Defense in Tea Plant. Genes 2019, 10, 929. [Google Scholar] [CrossRef]
  23. Zhao, T.; Li, C.; Wang, S.; Song, X. Green Tea (Camellia sinensis): A Review of Its Phytochemistry, Pharmacology, and Toxicology. Molecules 2022, 27, 3909. [Google Scholar] [CrossRef]
  24. Scharbert, S.; Hofmann, T. Molecular Definition of Black Tea Taste by Means of Quantitative Studies, Taste Reconstitution, and Omission Experiments. J. Agric. Food Chem. 2005, 53, 5377–5384. [Google Scholar] [CrossRef] [PubMed]
  25. Zeng, L.; Watanabe, N.; Yang, Z. Understanding the biosyntheses and stress response mechanisms of aroma compounds in tea (Camellia sinensis) to safely and effectively improve tea aroma. Crit. Rev. Food Sci. Nutr. 2019, 59, 2321–2334. [Google Scholar] [CrossRef] [PubMed]
  26. Chen, S.; Liu, H.; Zhao, X.; Li, X.; Shan, W.; Wang, X.; Wang, S.; Yu, W.; Yang, Z.; Yu, X. Non-targeted metabolomics analysis reveals dynamic changes of volatile and non-volatile metabolites during oolong tea manufacture. Food Res. Int. 2020, 128, 108778. [Google Scholar] [CrossRef]
  27. Zhou, J.; Fang, T.; Li, W.; Jiang, Z.; Zhou, T.; Zhang, L.; Yu, Y. Widely targeted metabolomics using UPLC-QTRAP-MS/MS reveals chemical changes during the processing of black tea from the cultivar Camellia sinensis (L.) O. Kuntze cv. Huangjinya. Food Res. Int. 2022, 162, 112169. [Google Scholar] [CrossRef]
  28. Zou, D.; Yin, X.-L.; Gu, H.-W.; Peng, Z.-X.; Ding, B.; Li, Z.; Hu, X.-C.; Long, W.; Fu, H.; She, Y. Insight into the effect of cultivar and altitude on the identification of EnshiYulu tea grade in untargeted metabolomics analysis. Food Chem. 2024, 436, 137768. [Google Scholar] [CrossRef]
  29. Pronin, A.N.; Xu, H.; Tang, H.; Zhang, L.; Li, Q.; Li, X. Specific Alleles of Bitter Receptor Genes Influence Human Sensitivity to the Bitterness of Aloin and Saccharin. Curr. Biol. 2007, 17, 1403–1408. [Google Scholar] [CrossRef]
  30. Chaudhari, N.; Roper, S.D. The cell biology of taste. J. Cell Biol. 2010, 191, 429. [Google Scholar] [CrossRef]
  31. Narukawa, M.; Noga, C.; Ueno, Y.; Sato, T.; Misaka, T.; Watanabe, T. Evaluation of the bitterness of green tea catechins by a cell-based assay with the human bitter taste receptor hTAS2R39. Biochem. Biophys. Res. Commun. 2011, 405, 620–625. [Google Scholar] [CrossRef] [PubMed]
  32. Xiang, P.; Wilson, I.W.; Huang, J.; Zhu, Q.; Tan, M.; Lu, J.; Liu, J.; Gao, S.; Zheng, S.; Lin, D.; et al. Co-regulation of catechins biosynthesis responses to temperature changes by shoot growth and catechin related gene expression in tea plants (Camellia sinensis L.). J. Hortic. Sci. Biotechnol. 2021, 96, 228–238. [Google Scholar] [CrossRef]
  33. Hayashi, N.; Chen, R.; Hiraoka, M.; Ujihara, T.; Ikezaki, H. β-Cyclodextrin/Surface Plasmon Resonance Detection System for Sensing Bitter-Astringent Taste Intensity of Green Tea Catechins. J. Agric. Food Chem. 2010, 58, 8351–8356. [Google Scholar] [CrossRef] [PubMed]
  34. Zhao, X.; Li, P.; Zuo, H.; Peng, A.; Lin, J.; Li, P.; Wang, K.; Tang, Q.; Tadege, M.; Liu, Z.; et al. CsMYBL2 homologs modulate the light and temperature stress-regulated anthocyanin and catechins biosynthesis in tea plants (Camellia sinensis). Plant J. 2023, 115, 1051–1070. [Google Scholar] [CrossRef] [PubMed]
  35. Maritim, T.K.; Masand, M.; Seth, R.; Sharma, R.K. Transcriptional analysis reveals key insights into seasonal induced anthocyanin degradation and leaf color transition in purple tea (Camellia sinensis (L.) O. Kuntze). Sci. Rep. 2021, 11, 1244. [Google Scholar] [CrossRef] [PubMed]
  36. Zhang, Q.; Hu, J.; Liu, M.; Shi, Y.; De Vos, R.C.H.; Ruan, J. Stimulated biosynthesis of delphinidin-related anthocyanins in tea shoots reducing the quality of green tea in summer. J. Sci. Food Agric. 2020, 100, 1505–1514. [Google Scholar] [CrossRef] [PubMed]
  37. Chen, Y.; Fu, X.; Mei, X.; Zhou, Y.; Cheng, S.; Zeng, L.; Dong, F.; Yang, Z. Proteolysis of chloroplast proteins is responsible for accumulation of free amino acids in dark-treated tea (Camellia sinensis) leaves. J. Proteom. 2017, 157, 10–17. [Google Scholar] [CrossRef] [PubMed]
  38. Bai, P.; Wei, K.; Wang, L.; Zhang, F.; Ruan, L.; Li, H.; Wu, L.; Cheng, H. Identification of a Novel Gene Encoding the Specialized Alanine Decarboxylase in Tea (Camellia sinensis) Plants. Molecules 2019, 24, 540. [Google Scholar] [CrossRef]
  39. Cheng, S.; Fu, X.; Wang, X.; Liao, Y.; Zeng, L.; Dong, F.; Yang, Z. Studies on the Biochemical Formation Pathway of the Amino Acid L-Theanine in Tea (Camellia sinensis) and Other Plants. J. Agric. Food Chem. 2017, 65, 7210–7216. [Google Scholar] [CrossRef]
  40. Ohno, A.; Oka, K.; Sakuma, C.; Okuda, H.; Fukuhara, K. Characterization of Tea Cultivated at Four Different Altitudes Using 1H NMR Analysis Coupled with Multivariate Statistics. J. Agric. Food Chem. 2011, 59, 5181–5187. [Google Scholar] [CrossRef]
  41. Liu, Z.; Ran, Q.; Pan, K.; Li, Q.; Yang, T.; Dai, Y.; Fang, S.; Zheng, W. Flavor Characteristics of Three Amino Acid Monomers Based on Electronic Tongue. Food Sci. Technol. 2022, 47, 296–302. [Google Scholar] [CrossRef]
  42. Zhao, Y.; Qin, L.; Tan, D.; Wu, D.; Wu, X.; Fan, Q.; Bai, C.; Yang, J.; Xie, J.; He, Y. Fatty acid metabolites of Dendrobium nobile were positively correlated with representative endophytic fungi at altitude. Front. Microbiol. 2023, 14, 1128956. [Google Scholar] [CrossRef] [PubMed]
  43. Shi, J.; Yang, G.; You, Q.; Sun, S.; Chen, R.; Lin, Z.; Simal-Gandara, J.; Lv, H. Updates on the chemistry, processing characteristics, and utilization of tea flavonoids in last two decades (2001–2021). Crit. Rev. Food Sci. Nutr. 2023, 63, 4757–4784. [Google Scholar] [CrossRef] [PubMed]
  44. Liu, Z.-W.; Shi, X.-Y.; Duan, S.-M.; Nian, B.; Chen, L.-J.; Zhang, G.-H.; Lv, C.-Y.; Ma, Y.; Zhao, M. Multiomics analysis of the mechanisms behind flavonoid differences between purple and green tender shoots of Camellia sinensis var. assamica. G3-Genes Genom. Genet. 2023, 13, jkac297. [Google Scholar] [CrossRef] [PubMed]
  45. Guo, Y.; Zhu, C.; Zhao, S.; Zhang, S.; Wang, W.; Fu, H.; Li, X.; Zhou, C.; Chen, L.; Lin, Y.; et al. De novo transcriptome and phytochemical analyses reveal differentially expressed genes and characteristic secondary metabolites in the original oolong tea (Camellia sinensis) cultivar ‘Tieguanyin’ compared with cultivar ‘Benshan’. BMC Genom. 2019, 20, 265. [Google Scholar] [CrossRef] [PubMed]
  46. Fang, H.; Zhang, F.; Zhang, C.; Wang, D.; Shen, S.; He, F.; Tao, H.; Wang, R.; Wang, M.; Wang, D.; et al. Function of hydroxycinnamoyl transferases for the biosynthesis of phenolamides in rice resistance to Magnaporthe oryzae. J. Genet. Genom. 2022, 49, 776–786. [Google Scholar] [CrossRef]
  47. Wang, W.; Xie, X.; Lv, Y.; Guan, H.; Liu, L.; Huang, Q.; Bao, Y.; Zhou, J.; Bao, L.; Gong, C.; et al. Identification and profile of phenolamides with anthracnose resistance potential in tea (Camellia sinensis). Hort. Res. 2023, 10, uhad154. [Google Scholar] [CrossRef]
Figure 1. Overview of metabolites of tea samples from three cultivation altitudes of two cultivars. (a) Principal component analysis (PCA) of metabolic profiles. Mix refers to quality control samples derived from mixing all samples. MK-L, MK-M, MK-H, FY-L, FY-M, and FY-H refer to tea samples from ‘Mingke 1’ (MK) and ‘Fuyun 6’ (FY) cultivars planted at low (L), medium (M), and high (H) altitudes, respectively; (b) Detailed classification and proportions of 113 differential metabolites identified in all tea samples.
Agronomy 14 00812 g001
Figure 2. Multivariate statistical analysis of metabolites in tea samples from different cultivation altitudes. PLS-DA score plots of (a) MK and (b) FY tea samples; cross-validation plot of the PLS-DA model with 100 permutation tests for (c) MK and (d) FY tea samples.
Agronomy 14 00812 g002
Figure 3. Schematic representation of common altitude-related metabolites and related pathway in the MK and FY cultivar. Heatmaps represent the relative content of differential metabolites for three altitudes, and the data are expressed as normalized values of the log2 mean of three replicates.
Agronomy 14 00812 g003
Figure 4. Fold changes in the relative content of differential metabolites between tea samples from low- and high-altitudes. Metabolites were found to be downregulated (a) and upregulated (b) in the high-altitude tea samples.
Agronomy 14 00812 g004
Figure 5. Multivariate statistical analysis of metabolites in tea samples from the MK and FY cultivars. OPLS-DA score plot of MK vs. FY tea samples (a) and its cross-validation with 100 permutation tests for this model (b).
Agronomy 14 00812 g005
Figure 6. Differential metabolites between the MK and FY cultivar: (a) the type and quantity of identified metabolites; (b) the proportions of metabolites with higher content in MK.
Agronomy 14 00812 g006
Figure 7. Comparison of metabolite levels between MK and FY. Heatmaps represent the relative content of differential metabolites with three replicates for three altitudes, and the data are expressed as normalized values of the log2 value of each replicate.
Agronomy 14 00812 g007
Disclaimer/Publisher’s Note: The statements, opinions and data contained in all publications are solely those of the individual author(s) and contributor(s) and not of MDPI and/or the editor(s). MDPI and/or the editor(s) disclaim responsibility for any injury to people or property resulting from any ideas, methods, instructions or products referred to in the content.

