Article

Quantitative Analysis of Atrazine Impact on UAV-Derived Multispectral Indices and Correlated Plant Pigment Alterations: A Heatmap Approach

by
Thirasant Boonupara
1,
Patchimaporn Udomkun
1,2 and
Puangrat Kajitvichyanukul
1,*
1
Department of Environmental Engineering, Faculty of Engineering, Chiang Mai University, Chiang Mai 50200, Thailand
2
Office of Research Administration, Chiang Mai University, Chiang Mai 50200, Thailand
*
Author to whom correspondence should be addressed.
Agronomy 2024, 14(4), 814; https://doi.org/10.3390/agronomy14040814
Submission received: 5 March 2024 / Revised: 29 March 2024 / Accepted: 11 April 2024 / Published: 14 April 2024
(This article belongs to the Section Precision and Digital Agriculture)

Abstract

:
Utilizing Unmanned Aerial Vehicle (UAV) multispectral technology offers a non-destructive and efficient approach to monitoring plant health and stress responses by analyzing reflectance data across various wavelengths. This study integrates UAV-based multispectral imagery with ground-measured sample data to evaluate the impact of atrazine (ATR) on chlorophyll a, chlorophyll b, carotenoids, and anthocyanins in Red Cos lettuce. The results indicate a significant increase (p < 0.05) in ATR concentration in lettuce with soil application, leading to notable reductions in pigment concentrations. Heatmap analysis reveals that EVI shows the strongest negative correlations with pigment classes (coefficients ranging between −0.75 to −0.85), while NDVI, GNDVI, and BNDVI exhibit the strongest positive correlations with pigments (coefficients > 0.75). These findings highlight the potential of this innovative technique in predicting pigment concentrations and emphasize its importance in monitoring pesticide effects for sustainable agriculture.

1. Introduction

Atrazine (ATR), chemically known as 2-chloro-4-ethylamino-6-isopropylamino-1,3,5-triazine, is a synthetic selective systemic triazine herbicide used to control annual gramineous and broadleaf weeds, as well as certain perennial weeds in crops such as corn, sugarcane, and grains, etc. [1,2,3]. It has become the second most widely used pesticide globally, with annual consumption estimated between 7000 and 9000 tons [4,5]. Despite its economic benefits, the extensive use of ATR raises concerns about its potential impacts on public health and the environment [6]. Exposure to ATR has been associated with adverse effects on human health, including decreased testosterone production, reduced sperm motility, and increased sperm abnormality [7,8]. After entering the environment, ATR can persist and accumulate over time, with a soil half-life ranging from 41 to 231 days [9]. Its toxicity (level III) and persistence have led to concerns. Despite ATR’s widespread use in the US and the Asia-Pacific region, the European Union has banned its use [6,9]. However, ATR is still widely used in agricultural production in other countries, including Thailand, where approximately 1900 tons were imported in 2022 [10]. Although numerous studies have investigated the direct effects of ATR in soil and water, as well as its uptake and metabolism in plants [11,12,13,14], none have explored how ATR uptake in plants indirectly affects their nutritional value. Gaining a better understanding of this relationship is crucial for elucidating the potential effects of ATR on the nutritional quality of crops. Further research is needed to address this gap in knowledge. While chemical analysis can provide valuable insights into the nutritional content of crops, it is often costly and time-consuming. Therefore, exploring alternative, cost-effective methods for assessing the nutritional value of crops exposed to ATR is essential. This knowledge will not only guide effective agricultural practices but also improve planting benefits and ensure food safety and security.
Remote sensing is a rapid, non-destructive, and cost-effective method for acquiring and evaluating surface properties from various distances. Spectral imaging techniques enable the collection of spectral data from satellites, airplanes/UAVs, or land-based systems. In recent years, Unmanned Aerial Vehicles (UAVs) have gained popularity as remote sensing platforms, offering higher spatial and temporal resolution images compared to traditional satellites [15]. Due to their flexibility, ease of use, and ability to operate at low altitudes, UAVs are increasingly recognized as a powerful tool for crop monitoring, providing convenient operation, high spatial and temporal resolution, and reasonable spatial coverage. They have been used for crop plot detection [16], monitoring crop growth status [17,18], predicting crop yield [19,20], and assessing plant water status [21]. These UAV systems can provide data that, when processed, enable the formulation of vegetation indices (VIs).
VIs are calculations that use two or more spectral bands to assess vegetation properties at leaf or canopy levels. A wide range of VIs has been developed to estimate leaf pigment contents, each tailored to different types of vegetation. These indices are valuable tools in remote sensing, providing insights into plant health, stress, and growth [22,23,24]. They are valued for their simplicity, intuitiveness, and effectiveness in modeling ground cover reflectance [25]. Many VIs are widely proposed in pigment monitoring. For example, Wu et al. [26] discovered that comprehensive indices like the Transformed Chlorophyll Absorption Reflectance Index (TCARI), Modified Chlorophyll Absorption in Reflectance Index (MCARI), and Optimized Soil-adjusted Vegetation Index (OSAVI) performed better in estimating chlorophyll content compared to NDVI and Modified Simple Ratio (MSR), taking into account various interference factors such as shadow and soil background. Furthermore, Yu et al. [27] monitored barley chlorophyll content across multiple growth stages using MCARI/OSAVI, TCARI/OSAVI, and other comprehensive vegetation indices, and noted that differences in canopy structure influenced the monitoring results. Additionally, He et al. [24] compared the performance of the Modified Soil Adjusted Vegetation Index (MSAVI), NDVI, Chlorophyll Index with Green (CIgreen), and Enhanced Vegetation Index (EVI) in detecting maize chlorophyll content. They observed that both MSAVI and NDVI saturated when chlorophyll content reached 40 mg m2, whereas the model based on CIgreen demonstrated the highest accuracy. Kopačková-Strnadová et al. [28] demonstrated that the two vegetation indices tested in this study, NDVI and NDVI red edge, have the potential to semi-quantitatively assess photosynthetic pigments in Norway spruce forests. However, the choice of VIs can significantly impact results, as VIs can vary depending on indices, sensors, quality control measures, compositing algorithms, and atmospheric and sun-target-sensor geometry corrections [15,29,30,31]. To overcome these limitations and identify suitable VIs, a combination of approaches can be used. These include using multiple indices to provide a more comprehensive assessment, integrating VI data with other remote sensing data sources, calibrating and normalizing VI data, employing machine learning algorithms to identify suitable VIs, and validating results with ground truth data. Additionally, new methods are needed to integrate VIs effectively, capturing spatial and temporal variations in vegetation dynamics [31].
Despite the progress in remote sensing technology, there is a need to continue enriching the knowledge base on the use of UAV-based multispectral image data for monitoring the impact of herbicide concentrations in plants and on crop quality. This gap in knowledge not only limits our understanding of herbicide effects. It also restricts our ability to provide crucial data support and practical guidance for site-specific management decisions and the advancement of smart crop farming. To address this gap, our study aims to leverage UAV-based multispectral imagery in conjunction with ground-measured sample data. Specifically, we seek to explore the feasibility of using UAV-derived spectral parameters to predict pigment concentrations in Red Cos lettuce resulting from ATR application. To achieve this, we utilized a heatmap analysis to identify the most effective vegetation indices for evaluating pigment responses. This innovative approach not only enhances our understanding of ATR’s effects on crop quality but also provides a valuable framework for future research and agricultural practices.

2. Materials and Methods

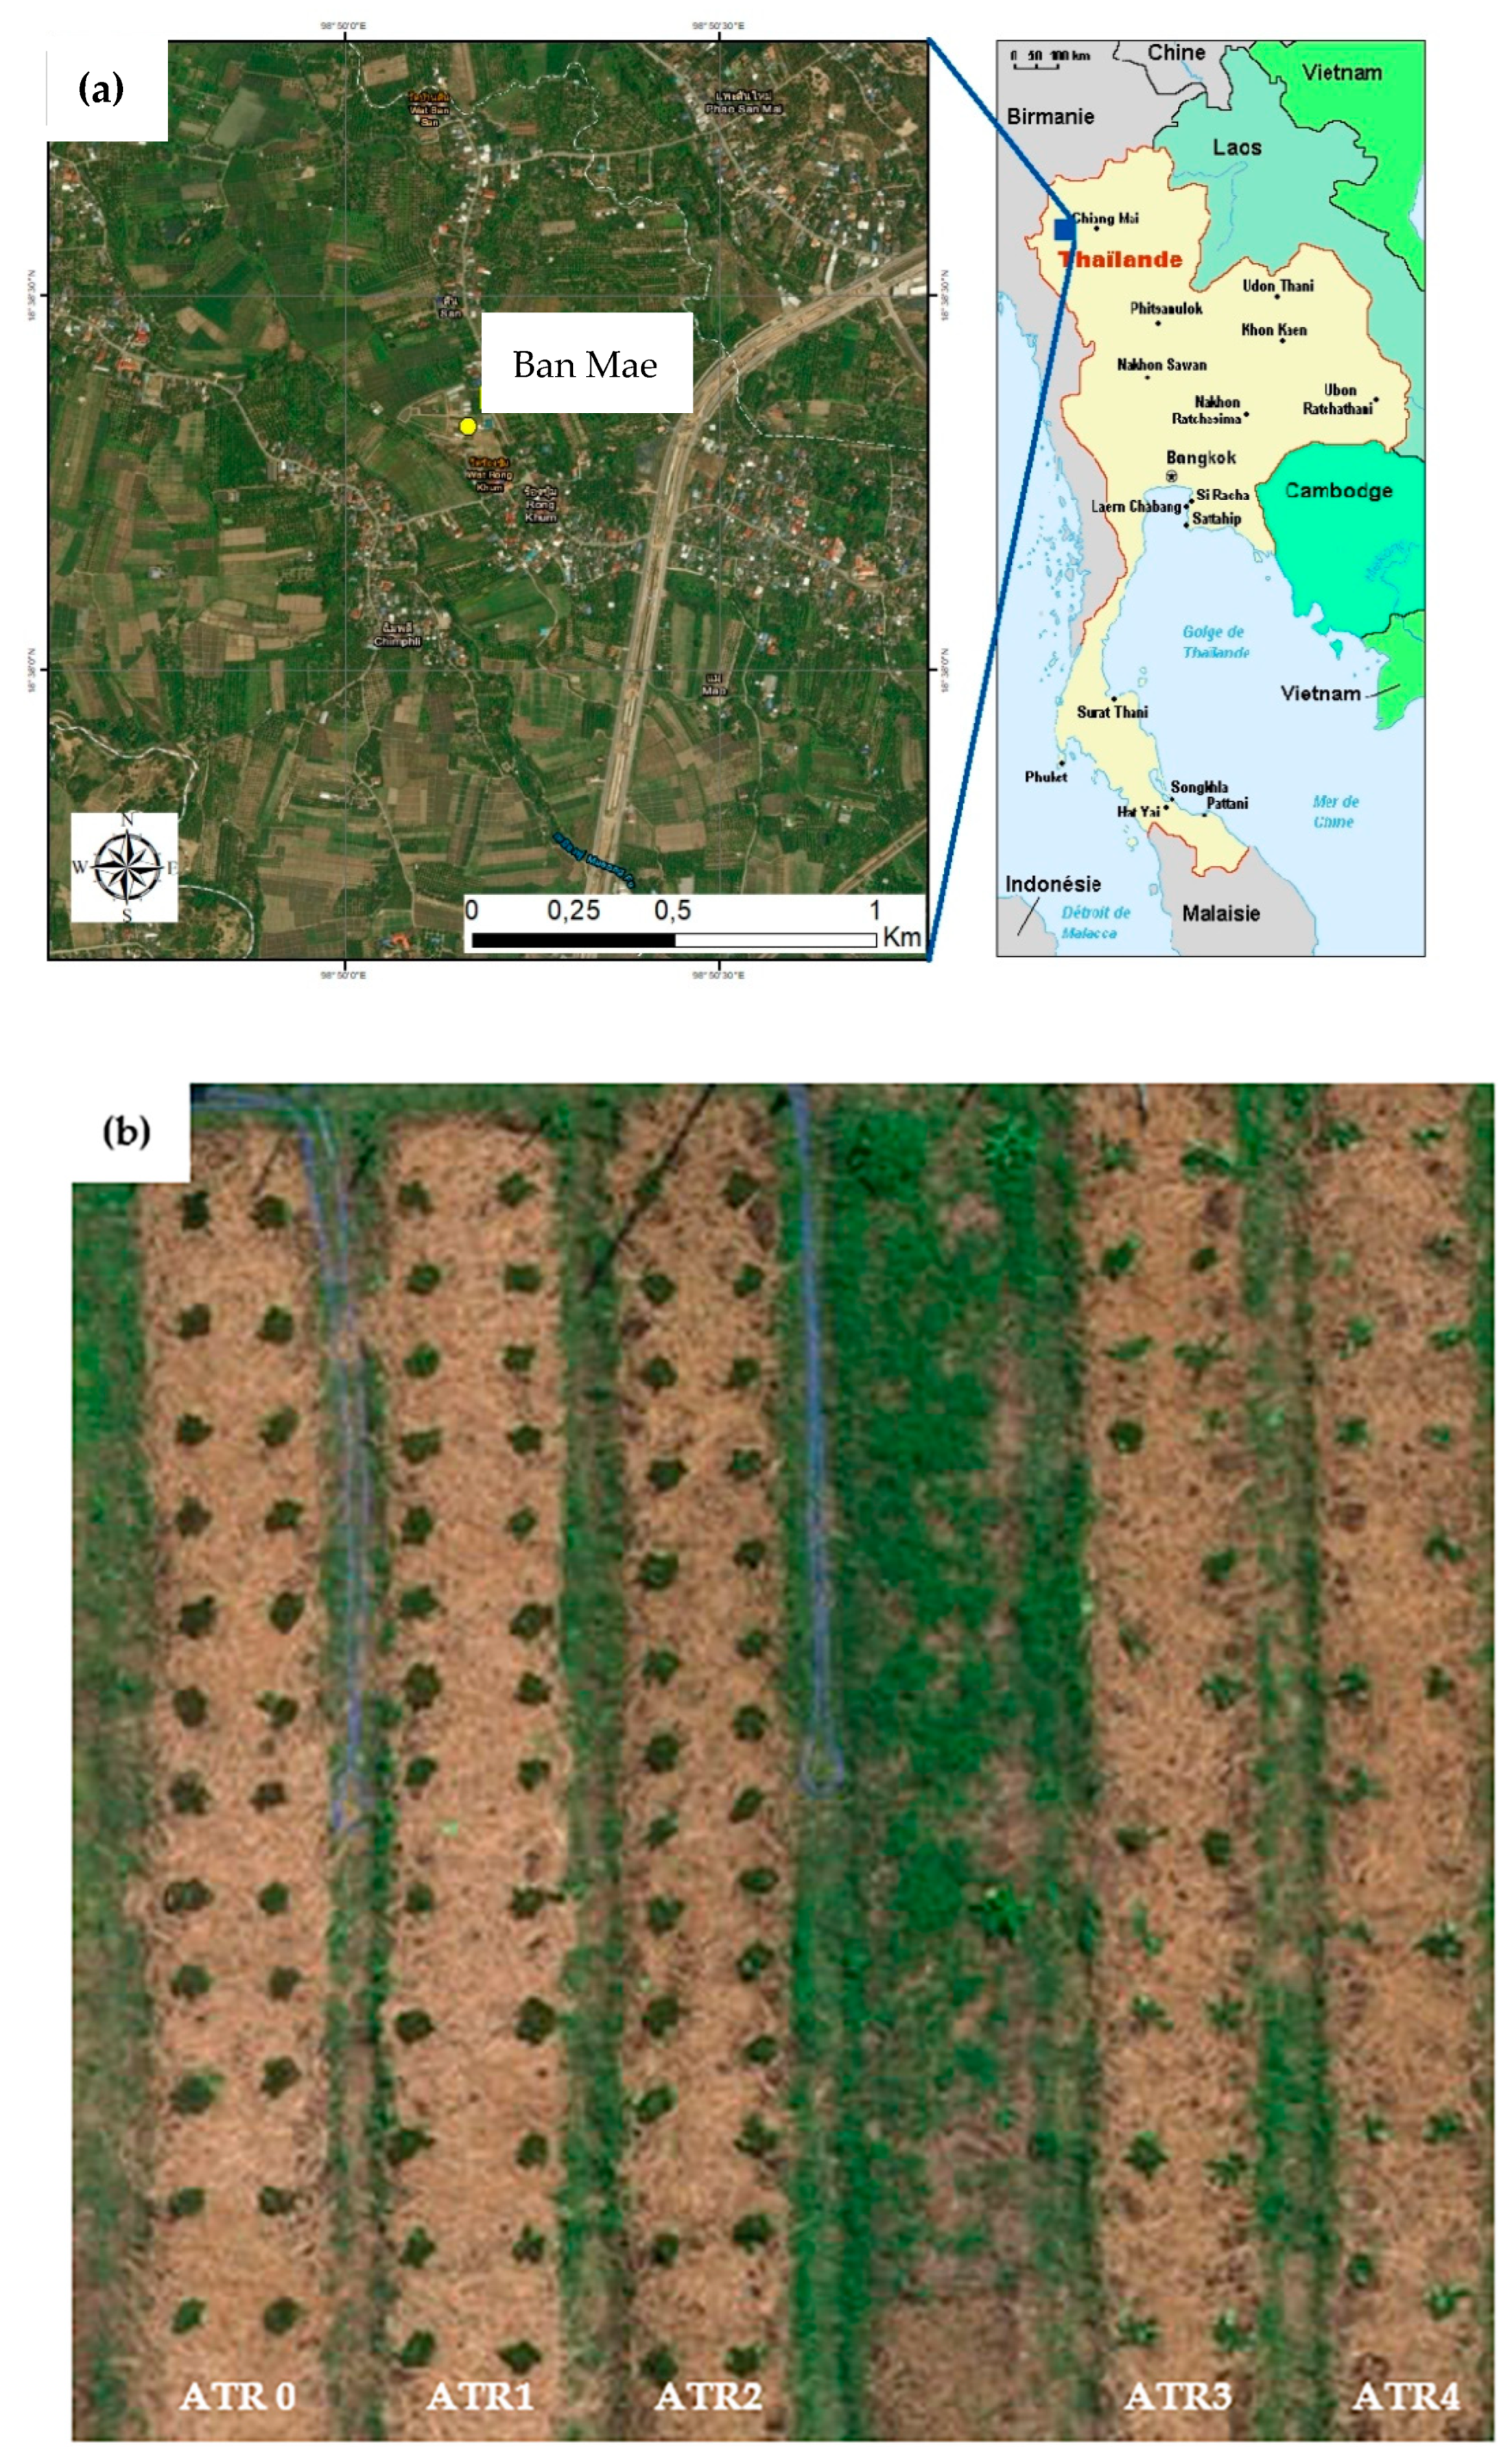
2.1. Field Study Area and Soil Characteristics

To maintain research integrity and prevent potential cross-contamination of ATR to neighboring experiments, the decision was made to reduce the size of the experimental plot. This plot-scale experiment was conducted in a 300 m2 agricultural field located at 18°38′19.49″ N, 98°50′9.88″ E, with an elevation of 486.46 m, in Ban Mae, San Pa Tong District, Chiang Mai, Thailand, from 20 March 2023 to 25 April 2023. The field, as shown in Figure 1, was chosen for its suitability for cultivating Red Romaine lettuce or Red Cos lettuce (Lactuca sativa L.). The total precipitation and mean temperature during the study were 13.33 mm and 32.36 °C, respectively. The soil used in the plot is classified as clay loam, and the topsoil (0–20 cm) has the following properties: pH (soil/water = 1:1) 7.2, nitrate nitrogen 35.28 mg kg−1, available phosphorus 12.38 mg kg−1, and organic matter 10.69 g kg−1.

2.2. Field Experiment and Sample Collection

The study area was divided into 5 plots, each measuring 1 m in width and 8 m in length, with a minimum separation of 0.5 m between plots. To mitigate the potential border effect resulting from the narrow width, topsoil from the 0–20 cm layer was collected, air-dried, and homogenized before the application of ATR. A solution of ATR (ICP Ladda Co., Ltd., Bangkok, Thailand) at varying concentrations was prepared and sprayed onto the soil. Plot ATR0 received no ATR, while plots ATR1, ATR2, ATR3, and ATR4 received 1.87 g L−1, 3.75 g L−1, 5.63 g L−1, and 7.50 g L−1, respectively. Afterward, soil contaminated with ATR was added to each plot. To ensure optimal plant establishment and growth, the soil prepared for each plot remained undisturbed for 45 days after spraying. Soil samples, approximately 100 g each, were then collected, sealed in re-closable zip-lock bags, and accurately labeled for identification. These samples were promptly transported to the laboratory and stored at room temperature for less than seven days before undergoing subsequent analytical procedures. Prior to conducting the experiment, the soil in each plot contained different concentrations of ATR: ATR1 (75 mg kg−1), ATR2 (150 mg kg−1), ATR3 (225 mg kg−1), and ATR4 (300 mg kg−1).
Seeds of the Red Cos lettuce cultivar Lactuca sativa var. longifolia ‘Red Romaine’ was obtained from a local market in Mueang district, Chiang Mai, Thailand. To ensure sterility, the seeds underwent surface sterilization using a 2% (v v−1) sodium hypochlorite solution, followed by thorough washing and soaking in deionized water at room temperature for 1 h. The germination process took place in seed-starter trays, and only healthy, germinated seeds were selected for transplantation into the plots, with each plot accommodating 30 seedlings. During planting, lettuce samples were strategically positioned within the experimental area, and statistical analyses were conducted to address any potential residual border effects. Daily watering was carefully administered to maintain soil moisture levels at 60–70% (w w−1). No additional nutrients were introduced to the plot throughout the experiment. Following 45 days post-transplantation, spectral data images were captured, and Red Cos lettuce samples were randomly harvested from each plot. The samples were promptly transported on ice in a cool box to the laboratory for pigment analyses.

2.3. Quantification of Atrazine Uptake

2.3.1. Soil and Plant Extraction

Upon arrival, all lettuce samples were individually washed with water to remove dirt and contaminants, and rinsed with deionized water. The edible portion of each set was prepared and separately homogenized in a dark room at 25 °C. The extraction was performed using the QuEChERS method. The QuEChERS Extraction Kit, containing magnesium sulfate, sodium chloride, sodium citrate, and disodium citrate sesquihydrate, along with 2 mL of QuEChERS dispersive solid-phase extraction (SPE) with primary-secondary amine (PSA), octadecylsilane end-capped, and magnesium sulfate, was procured from Agilent (Santa Clara, CA, USA). For the extraction of ATR, approximately 1 g of homogenized leaf sample or 10 g of soil was accurately weighed and placed in a 50-mL centrifuge tube. Subsequently, 10 mL of water was added to the tube, and the mixture was allowed to stand for 30 min at room temperature. Afterward, 10 mL of acetonitrile was added to the tube. The tube was sealed, vigorously shaken by hand for 1 min, and a buffer–salt mixture was introduced to facilitate phase separation and pesticide partitioning. This buffer–salt mixture consisted of 4 g of magnesium sulfate anhydrous (MgSO4), 1 g of sodium chloride, and 0.5 g of disodium hydrogen citrate sesquihydrate. The tube was resealed, shaken vigorously by hand for an additional minute, and then centrifuged at 4000 rpm for 5 min using a Multi Centrifuge (VARISPIN 4, NOVAPRO Co., Ltd., Seoul, Republic of Korea). After centrifugation, 1 mL of the acetonitrile phase was transferred into a separate centrifuge tube containing 150 mg of MgSO4 and 25 mg of primary-secondary amine (PSA) to remove polar organic acids, some sugars, and lipids. The tube was sealed, shaken vigorously by hand for 30 s, and centrifuged at 4000 rpm for 5 min using a Microliter and Hematocrit Centrifuge (NF 480, NÜVE SANAYİ MALZEMELERİ İMALAT VE TİCARET A.Ş, Ankara, Turkey). The residue was reconstituted with 0.5 mL of acetonitrile. Each final extract was then filtered through a 0.2 µm membrane filter into a 2 mL amber glass vial. These vials were stored at −20 °C until LC-MS/MS analysis.

2.3.2. LC-MS/MS Analysis

The LC–MS/MS system consisted of a 1290 vialsampler (G7129B, Agilent, Santa Clara, CA, USA), a 1290 high-speed pump (G7129A, Agilent, Santa Clara, CA, USA), and a 1290 MCT detector (G7166B, Agilent, Santa Clara, CA, USA). Separation was carried out using a Phenomenex Luna C18(2) column (150 mm × 2.00 mm ID, particle size 5 µm). The eluents were water containing 0.1% formic acid and 5 mM ammonium acetate (CH3CO2NH4) (A) and methanol containing 0.1% formic acid and 5 mM CH3CO2NH4 (B). The flow rate was set at 0.3 mL min−1. The autosampler and column temperatures were maintained at 4 and 40 °C, respectively, with a 2 µL injection volume. Detection was carried out using Agilent Jet Stream electrospray ionization (ESI) in positive mode. The capillary voltage ranged from 3200 to 3800 V, nebulizer pressure was set at 45 psi, sheath gas temperature at 400 °C with a sheath gas flow of 12 L min−1, and gas temperature at 300 °C with a gas flow of 3 L min−1. Collision gas pressure and tube lens offset voltages were optimized using the automated optimization procedure. The mass spectrometry scanning method used dynamic Multiple Reaction Monitoring (MRM), and the analysis was performed in triplicate. Standard ATR for LC-MS/MS analysis (with a purity > 99%) was acquired from CPAchem Ltd. (Bogomilovo, Bulgaria).

2.4. Quantification of Pigments

The washed leaf samples were dried in a shaded, well-ventilated room at a temperature of 22–24 °C before conducting the pigment analysis.

2.4.1. Chlorophyll and Carotenoids

Chlorophyll content was measured calorimetrically according to Pérez-Patricio et al. [32] and Song et al. [33] with slight modifications. Lettuce leaves were randomly selected, and 0.5 g of fresh sample was ground under low light conditions before being homogenized with 10 mL of acetone for 1 min. The suspension was then incubated in the dark in a refrigerator (7 ± 1 °C) for 30 min. After 30 min, the samples were filtered using Whatman paper No. 4 under vacuum in a Büchner funnel (Glassco Laboratory Equipments Pvt. Ltd., Haryana, India). Absorbance readings were taken at wavelengths of 663 nm (A663), 645 nm (A645), and 440 nm (A440) using a Cary 60 UV-Vis spectrophotometer (Agilent Technologies, Santa Clara, CA, USA). The measurement was performed in triplicate and the values obtained were used in Equations (1)–(4) to estimate photosynthetic pigments.
C h l o r o p h y l l   a   m g   g 1 = ( 12.7 × A 663 2.69 × A 645 × V ) / W
C h l o r o p h y l l   b   m g   g 1 = ( ( 22.9 × A 645 4.86 × A 663 ) × V ) / W
T o t a l   c h l o r o p h y l l   m g   g 1 = ( ( 8.0 × A 663 + 20.20 × A 645 ) × V ) / W
C a r o t e n o i d s   m g   g 1 = ( ( 4.70 × A 440 0.27 × T o t a l   c h l o r o p h y l l ) × V ) / W
where V is the volume of extract solution (mL) and W is weight of sample (g).

2.4.2. Anthocyanin

The total anthocyanin content was determined following the method outlined by Islam et al. [34] with slight modifications. Approximately 1 g of fresh sample was ground under low light conditions and then extracted for 24 h at 4 °C in the dark. Two solvents were used for extraction: a solution of 95% ethanol with 1.5 mol·L−1 HCl (85:15, v v−1) and 95% ethanol alone. The suspension was left to stand in the dark at a refrigeration temperature of 7 ± 1 °C for 24 h. After this period, the samples were filtered using Whatman paper No. 4 under vacuum in a Buchner funnel (Glassco Laboratory Equipments Pvt. Ltd., Haryana, India). Absorbance readings were taken at 530 nm (A530) using a Cary 60 UV-Vis spectrophotometer. The anthocyanin content was calculated using the following Equation (5):
A n t h o c y n a i n   m g   g 1 = A 530 × V / ( W × 98.2 )
where V is the volume of extract solution (mL), W is weight of sample (g), and 98.2 is the factor of molar absorption value for the acid-ethanol solvent.

2.5. Acquision of Spectral Data in the Field Using UAVs and Image Processing

The aerial survey for this research utilized a DJI Inspire 2 UAV (SZ DJI Technology, Shenzhen, China) with a Micasense Altum multispectral sensor (AgEagle Aerial Systems Inc., Wichita, KS, USA), specifically designed for capturing detailed vegetative indices across a range of wavelengths. The sensor includes channels for blue (475 nm), green (560 nm), red (668 nm), red edge (717 nm), and NIR (840 nm), along with an integrated Downwelling Light Sensor (DLS 2) for real-time light calibration. The sensor was securely mounted on the UAV to ensure accurate compensation for ambient light variations and to minimize environmental noise in the captured imagery. To standardize lighting conditions and maximize data consistency, data collection was meticulously scheduled around solar noon (±1 h). Flight missions were automated and managed using Pix4DCapture software Version 4.11.0 (Pix4D, Prilly, Switzerland), ensuring a controlled and repeatable flight path from takeoff to landing. The specified flight parameters included a camera angle of 90°, forward and side image overlaps of 90% [35], and an operational altitude of 20 m, resulting in a Ground Sample Distance (GSD) of 0.41 cm pixel−1. This high resolution is crucial for detailed analysis and ortho-mosaic mapping of the surveyed area. Following the flight, the collected image dataset underwent processing using Agisoft Metashape Version 2.1.1 (Agisoft LLC, St. Petersburg, Russia). This processing step converted the raw spectral data into high-fidelity ortho-mosaics, forming the foundation for subsequent VI calculations. Details of VIs used for remote assessment and monitoring of pigment changes in Red Cos lettuce due to ATR are given in Table 1. In this study, the flight took place during a day with approximately 12 h and 40 min of daylight, providing a significant window for natural light. However, varying shadows and lighting intensities were expected due to the sun’s position. Weather conditions were characterized by variability, with the region experiencing a wide temperature range during the month (ranging from a high of 40.6 °C to a low of 22.8 °C). On the specific day of the flight, clear skies were observed.

2.6. Data Analysis

Statistical analysis was performed using the General Linear Model Program (GLM). To discern significant differences among treatment means at a 5% probability level, Fisher’s least significant difference (LSD) was applied through the SAS program (version 9.4, SAS, 2002). The dataset, sourced from an Excel file, underwent preliminary preprocessing to rectify any missing values and validate the suitability of data types for subsequent statistical examination. Pearson correlation coefficient analysis was complemented by descriptive statistical analysis, including the calculation of mean, median, and standard deviation, using Minitab 18 software (Minitab LLC, State College, PA, USA). These descriptive statistics provided a robust overview of the dataset’s central tendency and variability. They served as foundational metrics to understand the distribution and spread of the multispectral indices and associated environmental and biological variables collected via UAV-based spectral imaging. The integration of these statistical analyses was critical for preprocessing the data, ensuring accurate interpretation of the correlation coefficients.
The study utilized OpenAI’s ChatGPT-4 to visualize the correlation matrix, generating informative heatmaps. Python, along with Pandas, NumPy, and Seaborn, was employed for data manipulation and visualization. Preprocessing of the dataset ensured handling of missing values and correct data types for correlation analysis. Pearson correlation coefficients were computed to quantify linear associations between variables. Details of the heatmap generation procedure are provided in Appendix A. While OpenAI did not directly generate the heatmap, its capabilities were leveraged to enhance the analysis by providing natural language descriptions, highlighting key correlations, and facilitating further dataset exploration, including outlier identification. Each axis of the heatmap corresponded to a different variable, including UVA-derived spectral indices and classes of pigments. The color of each cell indicated the strength and direction of the correlation, with red shades indicating positive correlations and blue shades indicating negative correlations. Light-colored cells represented correlations close to zero, indicating little to no linear relationship. The numerical values in each cell, ranging from −1 to +1, quantified the strength of the correlation, with values closer to +1 or −1 indicating stronger positive or negative correlations, respectively. The diagonal line from the top left to the bottom right of the heatmap represented perfect positive correlation (a coefficient of 1), where each variable perfectly correlated with itself.

3. Results

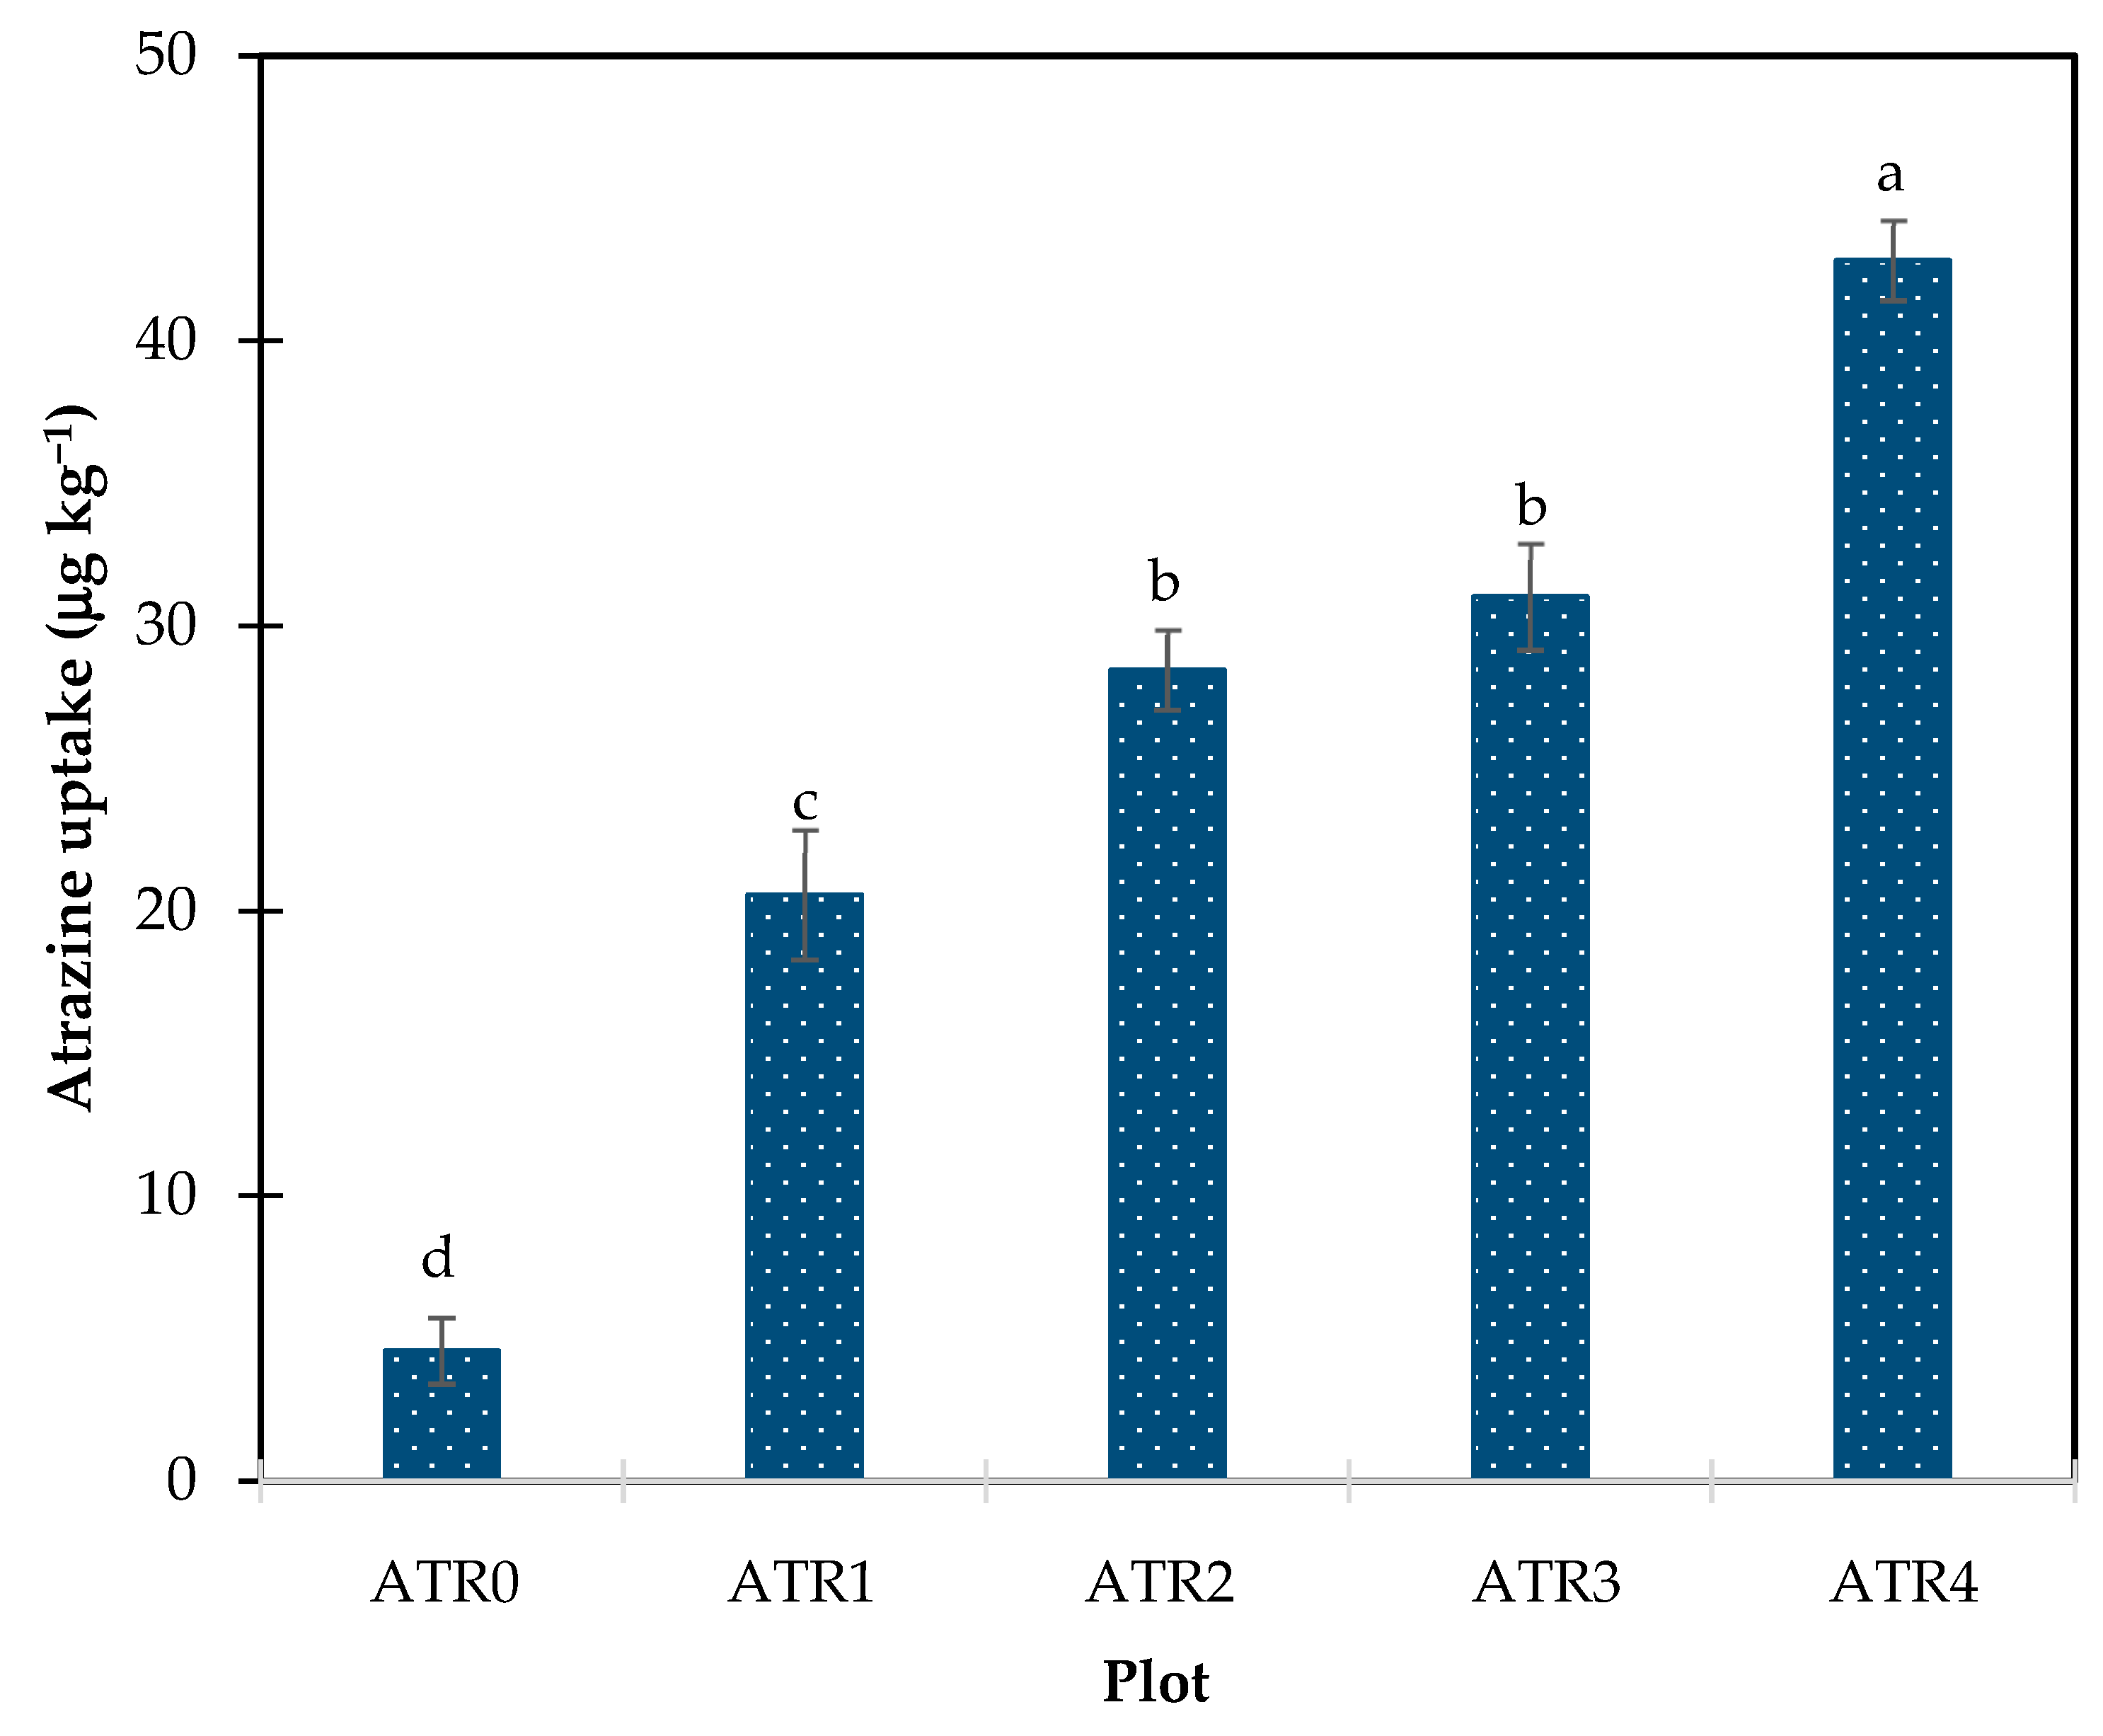
3.1. Atrazine Uptake in Red Cos Lettuce

During the 45-day period, the concentration of ATR in lettuce leaves correspondingly increased with the initial ATR concentration applied to the soil before planting (Figure 2). Plot ATR4 showed a significantly higher (p < 0.05) level of ATR uptake compared to other plots, while the uptake levels between ATR2 and ATR3 were not significantly different. Specifically, the ATR concentration in plot ATR4 surged by an impressive 9.38 times compared to plot ATR0. Similarly, plot ATR3 experienced a significant 6.80-fold increase, followed by plot ATR2 with a 6.24-fold increase, and plot ATR1 with a 4.51-fold increase over plot ATR0.

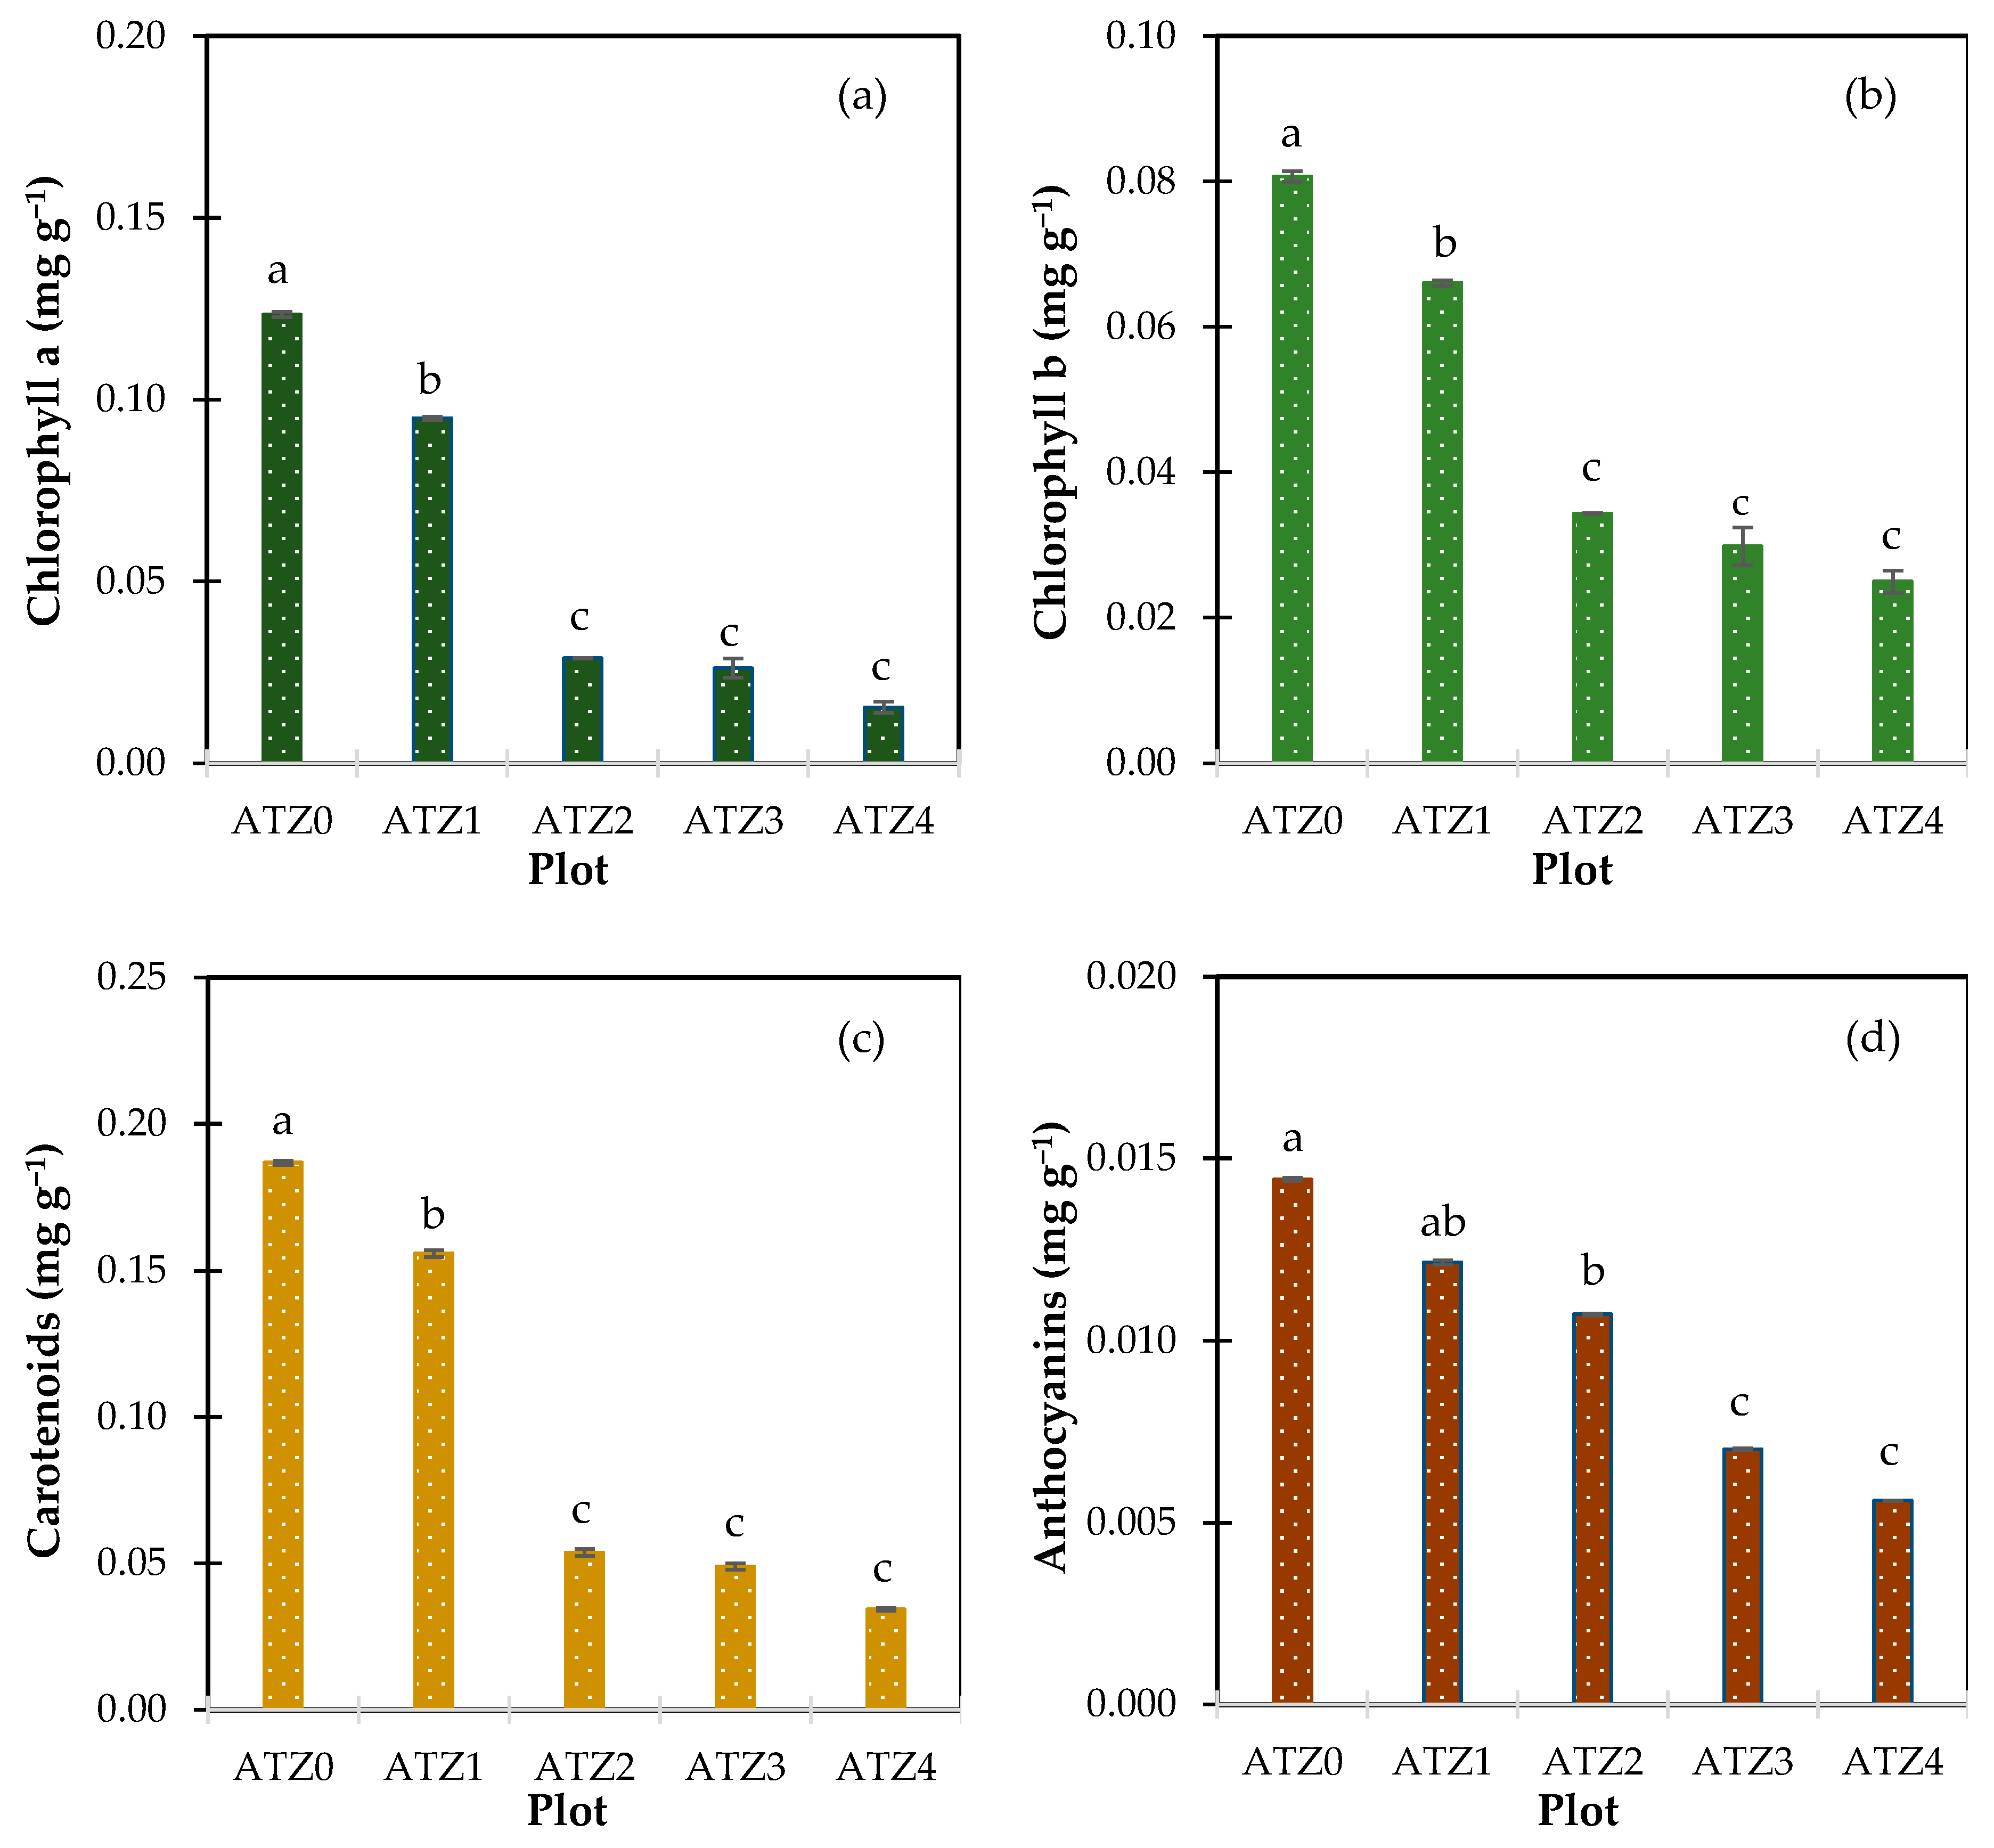
3.2. Atrazine’s Impact on Leaf Pigment Levels

The impact of ATR application on the leaf pigments of Red Cos lettuce is depicted in Figure 3a–d. It is evident that the pigment levels decreased significantly (p < 0.05) with increasing ATR concentrations in the soils. Specifically, the chlorophyll a level in plot ATR4 decreased significantly (p < 0.05) by 87.5% compared to plot ATR0 (Figure 3a). A similar trend was observed for chlorophyll b (Figure 3b), carotenoids (Figure 3c), and anthocyanins (Figure 3d) with reductions of 69.0%, 81.6%, and 61.1%, respectively. The levels of chlorophyll a, chlorophyll b, and carotenoids in lettuce leaves in plot ATR4 were not significantly different from those in plot ATR2 and plot ATR3, while no significant difference was found between plot ATR3 and ATR4 for anthocyanin content. Regarding the correlation between pigment levels in lettuce and ATR uptake, as displayed in Figure 4 and Table 2, a linear correlation was observed with coefficients of determination (R2) > 0.84. This suggests that ATR uptake by plants can directly influence pigment levels.

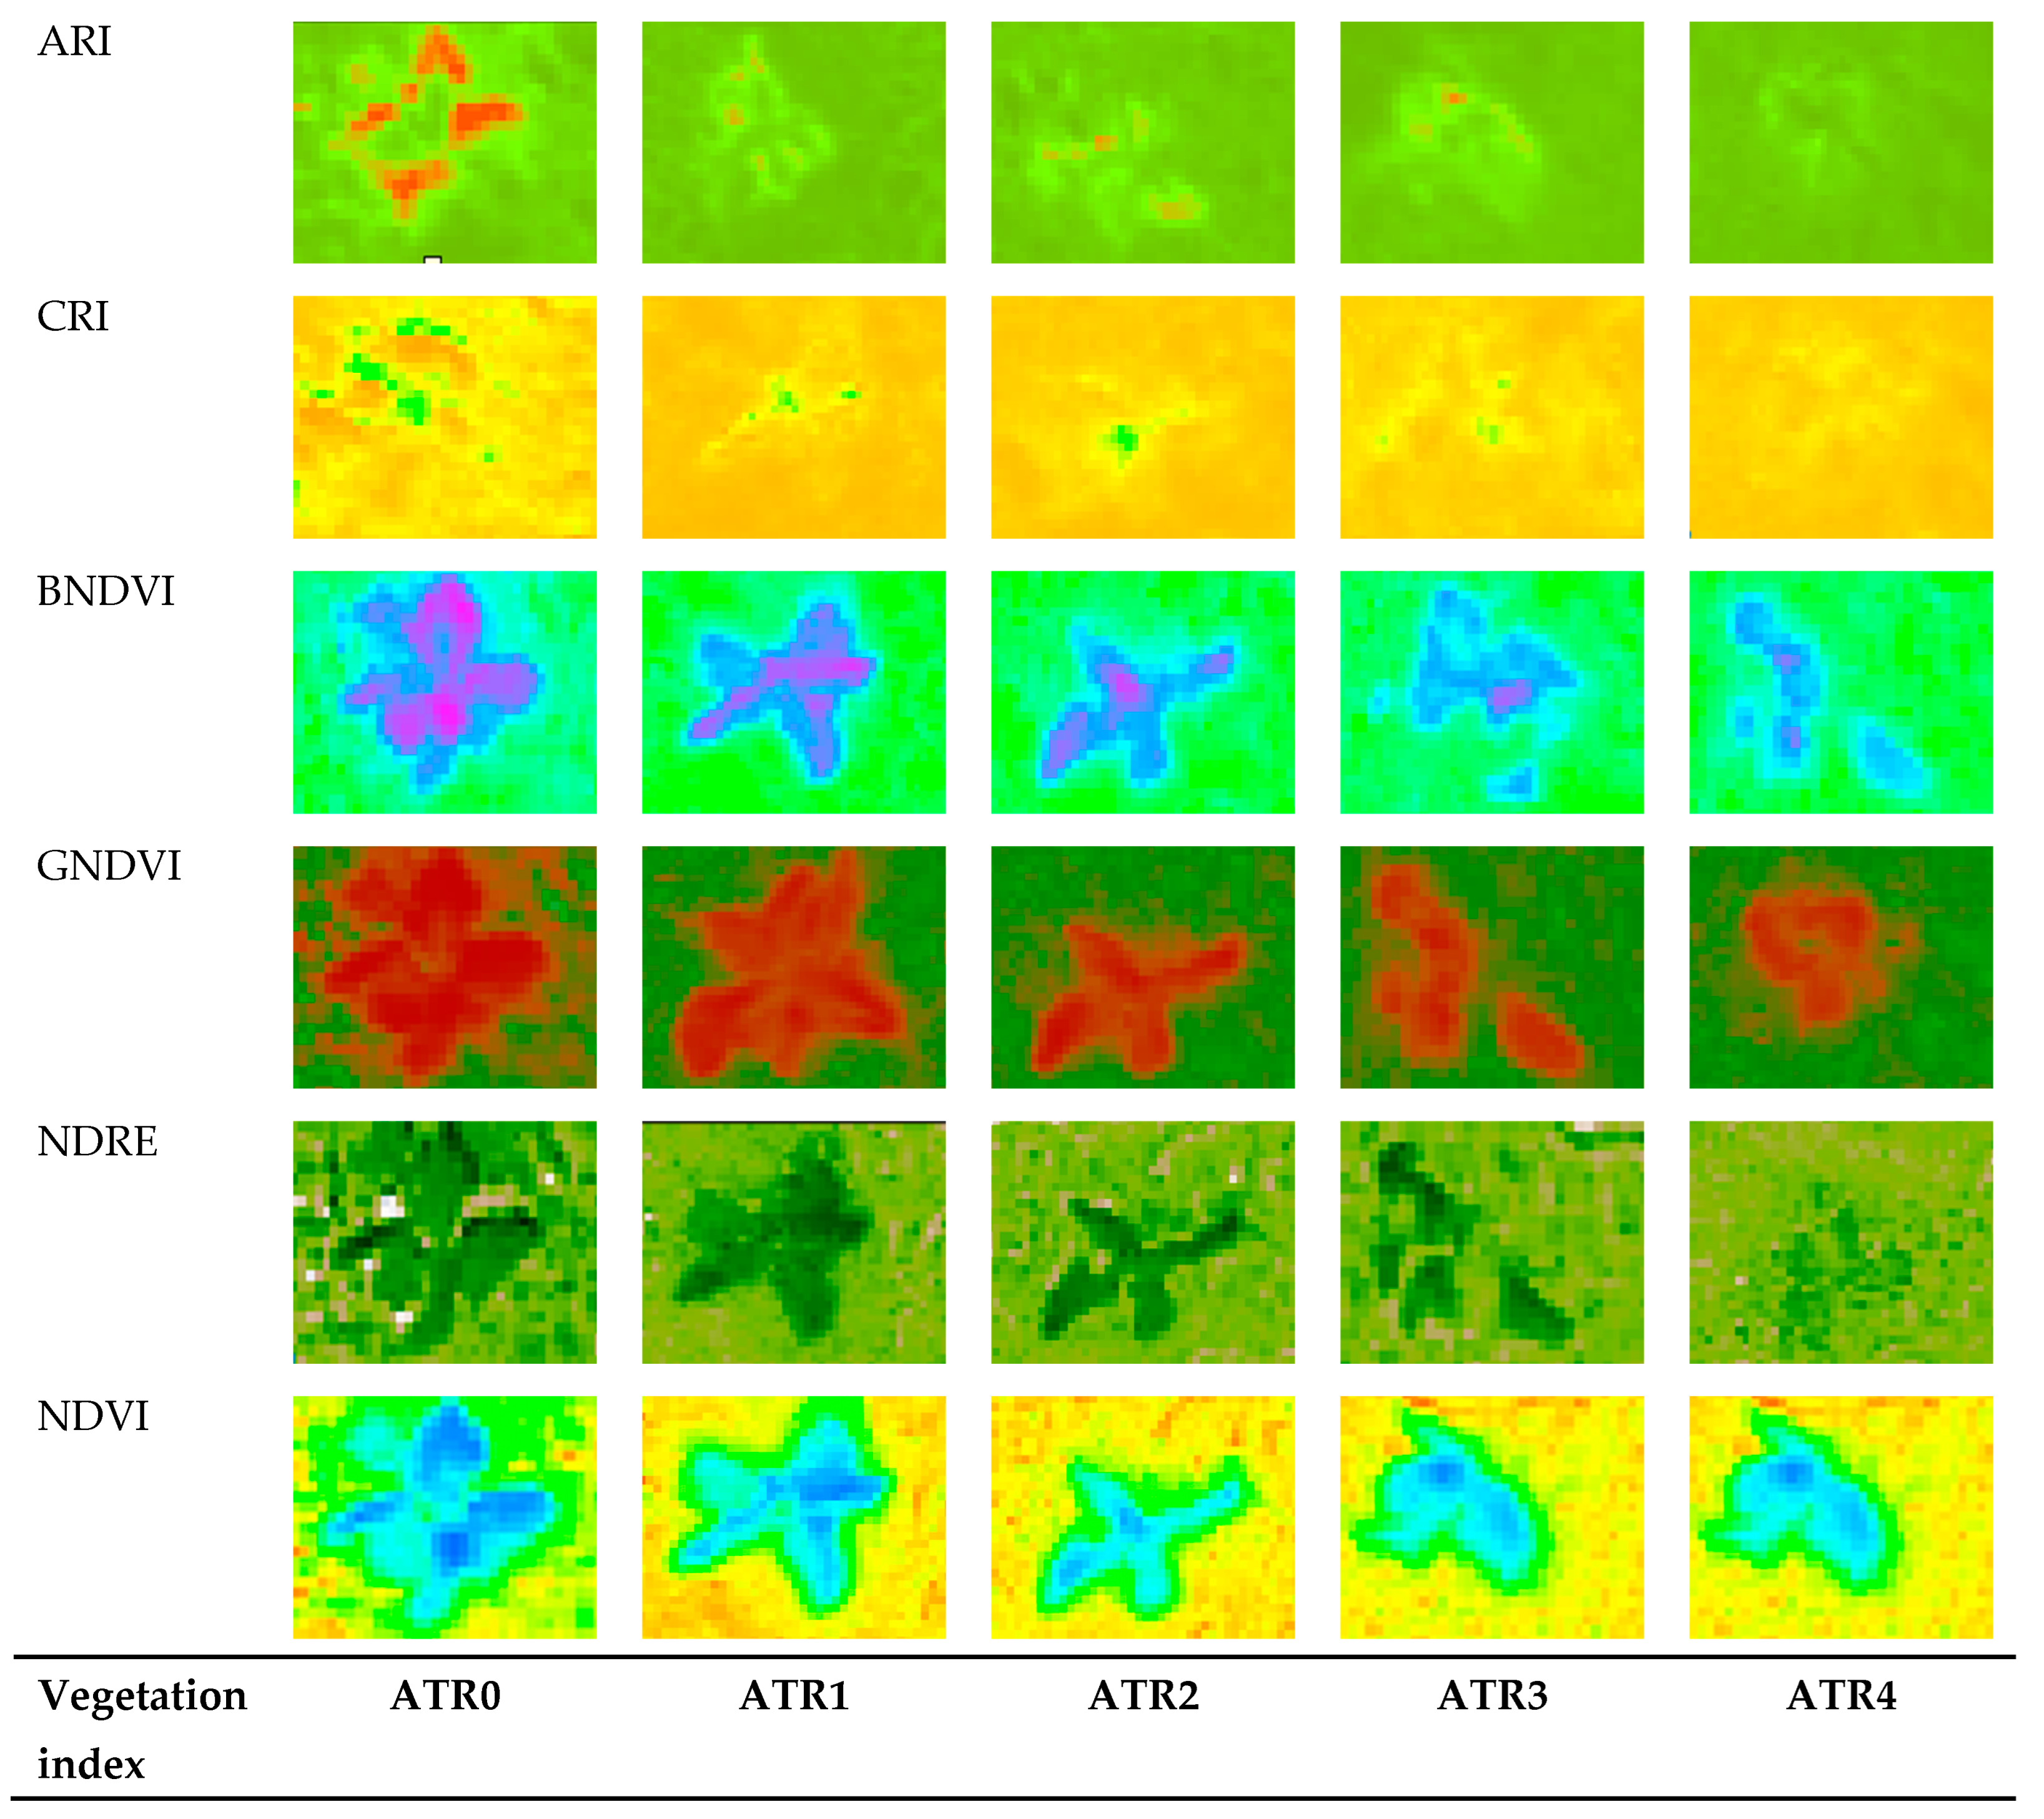
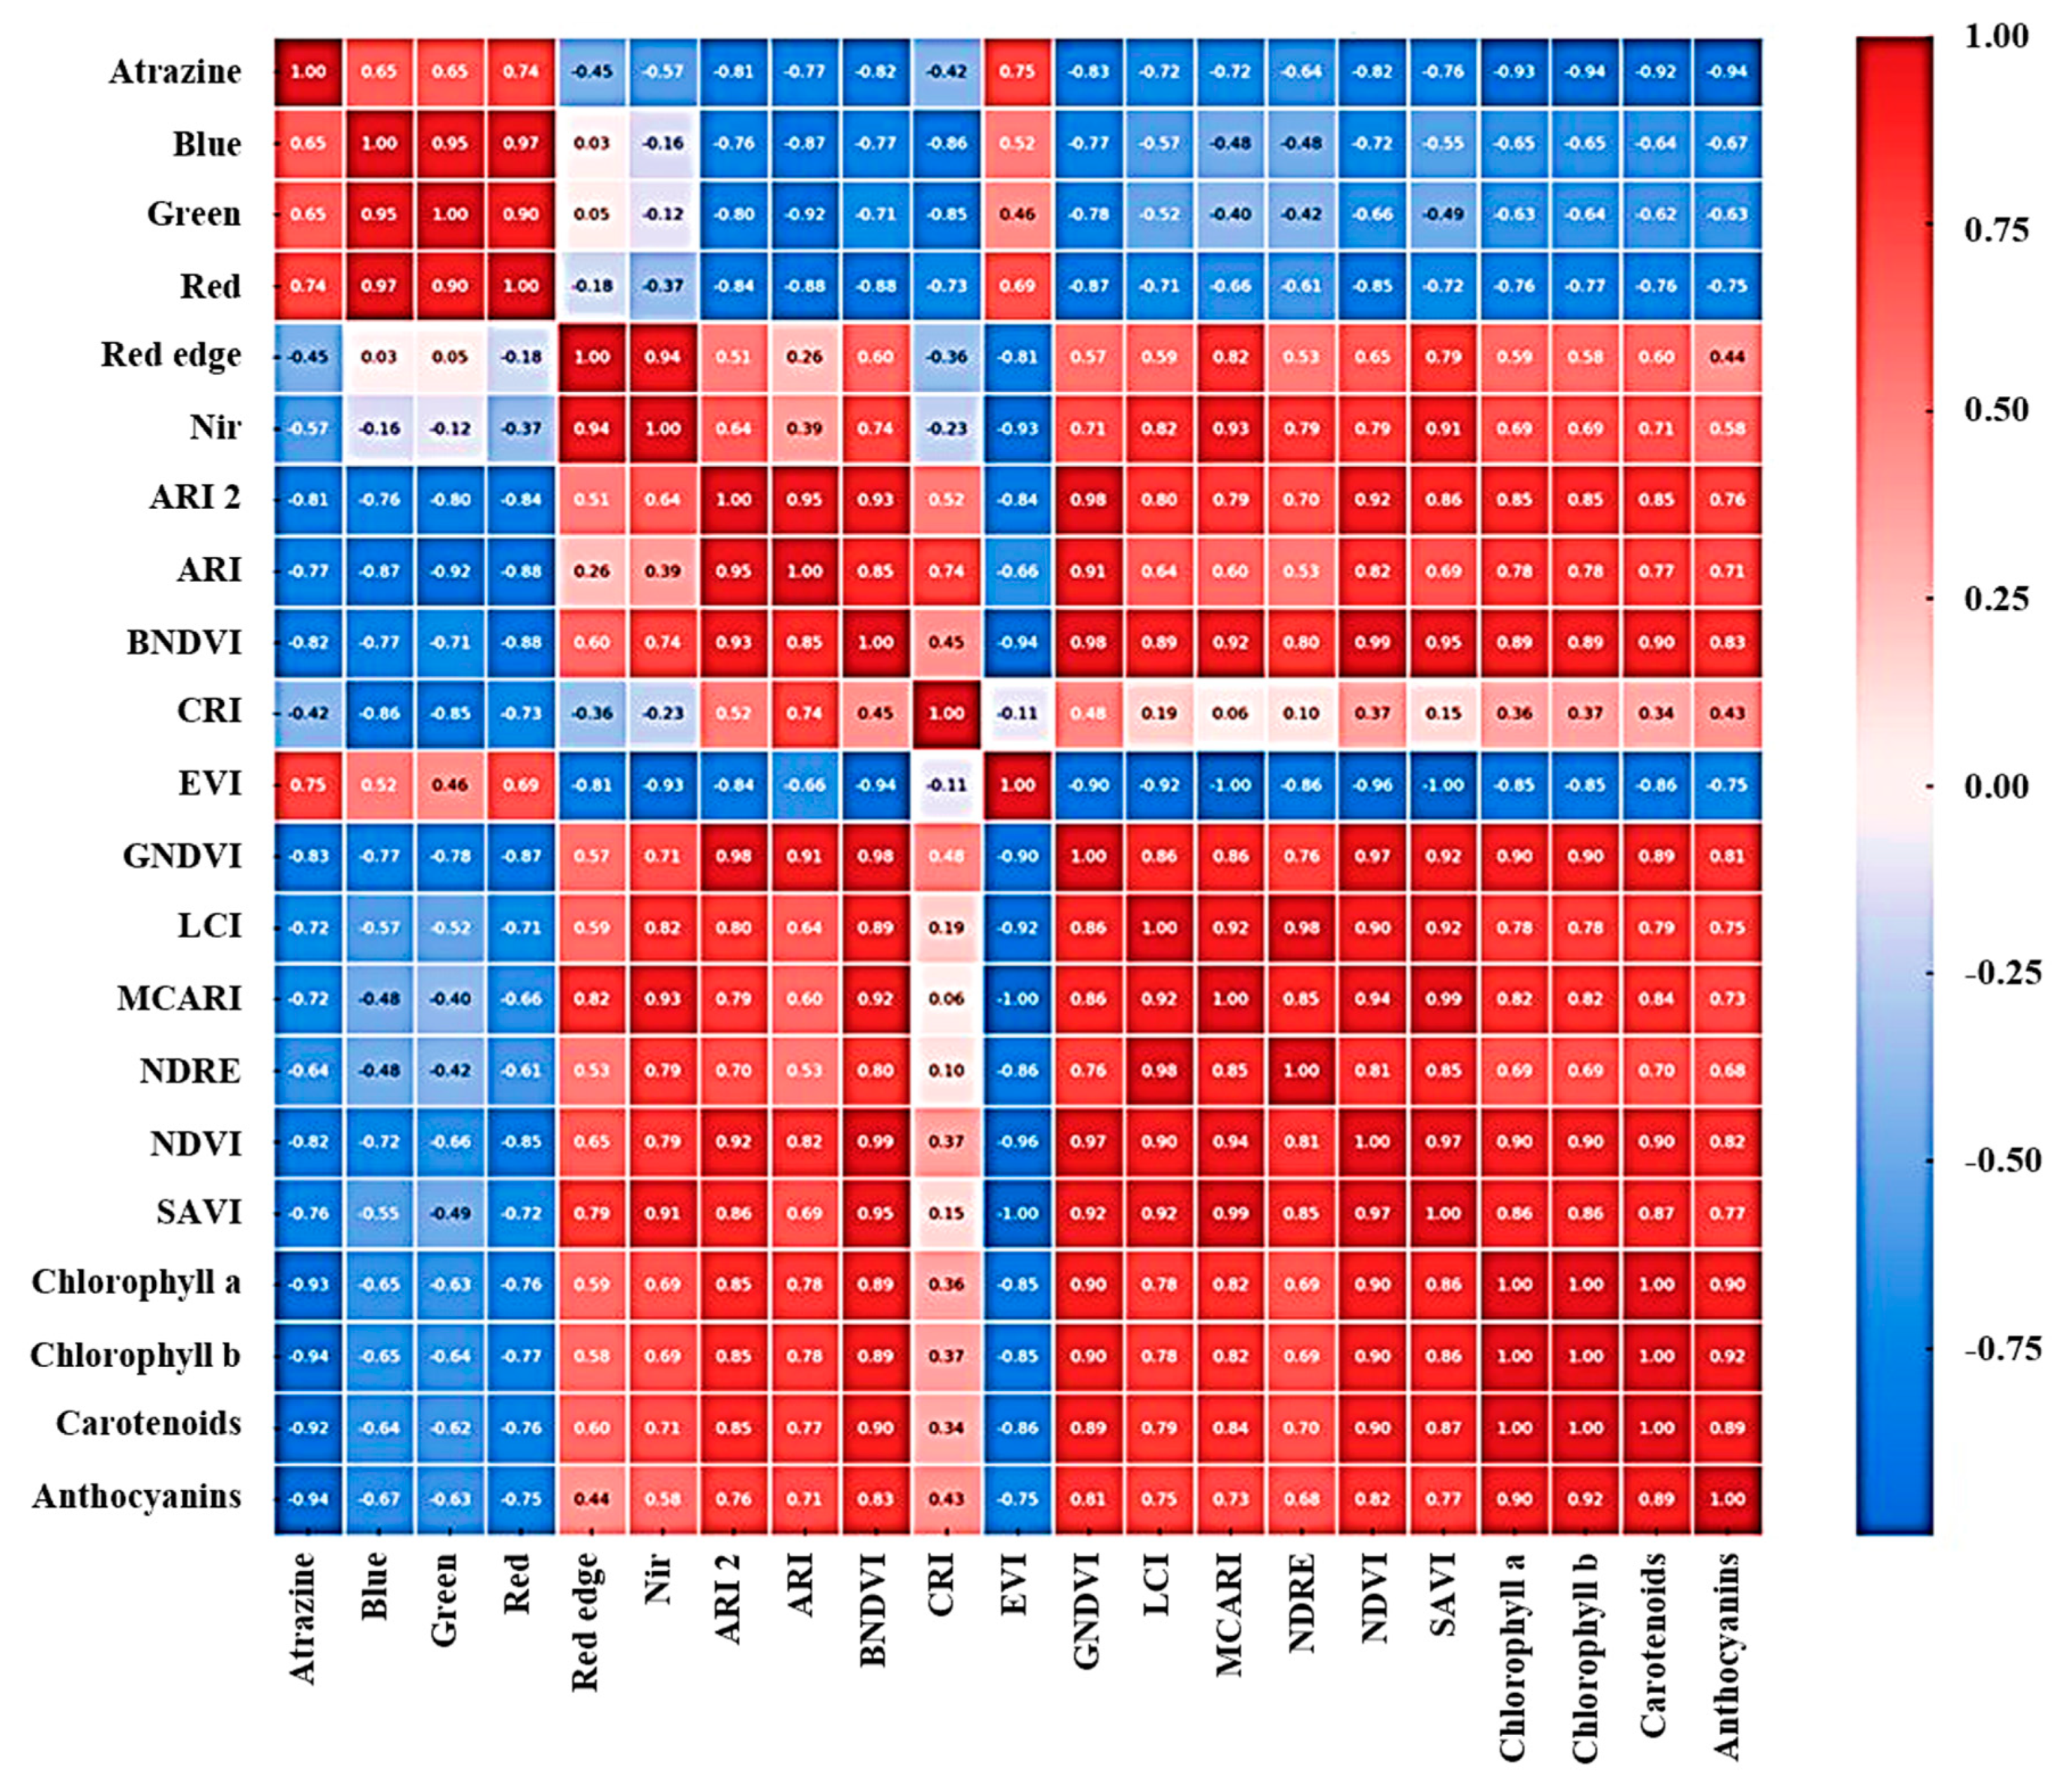
3.3. Insights from Heatmap Analysis

The spectral reflectance of Red Cos lettuce captured by UAVs, ranging from 475 to 842 nm, in response to varying ATR concentrations is illustrated in Figure 5. The data indicate distinct reflectance patterns corresponding to different ATR concentrations. Lettuce samples subjected to higher ATR concentrations exhibited higher reflectance levels between 475 and 668 nm compared to those with lower or no ATR application. Conversely, in the range of 717 to 842 nm, lower reflectance was observed in samples with higher ATR concentrations.
The impact of ATR application on pigments, as demonstrated by various vegetation indices, is illustrated in Figure 6. Elevated orange levels in the ARI images suggest increased anthocyanin concentrations in plant tissues. Likewise, heightened green levels in CRI, purple in BNDVI, red in GNDVI, dark green in NDRE, and blue in NDVI indicate a higher concentration of chlorophyll and other pigments in Red Cos lettuce.
To identify UAV-derived multispectral indices that are strongly correlated with the pigment classes of Red Cos lettuce affected by ATR application, we conducted a heatmap analysis (Figure 7). The results revealed a significant negative correlation between ATR and all pigment classes, with coefficients of −0.93 for chlorophyll a, −0.94 for chlorophyll b, −0.92 for carotenoids, and −0.94 for anthocyanins. Among the indices, EVI showed the strongest negative correlation with chlorophyll a and chlorophyll b, with coefficients of −0.85 each. Conversely, NDVI, GNDVI, BNDVI, SAVI, ARI 2, MCARI, ARI, and LCI demonstrated strong positive correlations with these pigments, with coefficients greater than 0.75. A similar trend was observed for carotenoids. Interestingly, the carotenoid-sensitive index CRI, often used for measuring stressed vegetation, showed a low positive correlation (0.34) with carotenoids after ATR application. Regarding anthocyanins, EVI exhibited the strongest negative correlation, but with a coefficient of −0.75, which was lower than those for chlorophyll and carotenoids. Only BNDVI, NDVI, GNDVI, SAVI, ARI 2, and LCI exhibited strong positive correlations with anthocyanins, with coefficients greater than 0.75.

4. Discussion

4.1. Atrazine Uptake Dynamics and Pigment Changes in Red Cos Lettuce under Soil Application

The high levels of ATR found in lettuce samples corresponded to a decrease in ATR levels in soil samples (Figure 2), indicating a correlation between soil and plant uptake. This behavior is primarily attributed to pesticide movement in soils through root uptake mechanisms, as described by Miller et al. [45]. Phloem transport is crucial for distributing pesticides within plant tissues, facilitating their movement from leaves to roots, fruits, and buds, as highlighted by Liu et al. [46] and Chen et al. [47]. Briggs et al. [48] noted that the translocation of organic compounds is influenced by their lipophilic properties, such as the octanol–water partition coefficient (KOW). ATR, with a log KOW of 2.56 at 25 °C, follows similar patterns. This finding aligns with Roeth and Lavy [49], who reported that ATR uptake by corn and sorghum was directly proportional to soil concentration. The detection of ATR in lettuce samples from plot ATR0 may be linked to previous ATR applications by farmers, who occasionally used it for weed control in the soil. Despite allowing the soil samples to remain undisturbed for 2–3 months before the experiment, trace amounts of ATR residues were still detectable in the soil. It is worth noting that pesticide uptake by plants can affect their metabolism, subsequently influencing the quantity and quality of the plants [50,51], including pigments.
In this study, the decrease in chlorophyll a and chlorophyll b levels with increasing ATR uptake in plants (Figure 3 and Figure 4) is linked to ATR’s ability to induce the formation of reactive oxygen species (ROS). These ROS molecules degrade chlorophyll a and b, crucial components for photosynthesis. ATR disrupts the electron transfer process in photosynthesis by competitively blocking the electron acceptor protein, photosystem II (PS II) [52,53]. This action inhibits the flow of electrons in chloroplasts, leading to reduced adenosine triphosphate (ATP) and nicotinamide adenine dinucleotide phosphate hydrogen (NADPH) production, essential for carbon dioxide (CO2) fixation [54,55]. Consequently, this disruption causes an accumulation of short-lived singlet chlorophyll, some of which transforms into more reactive triplet chlorophylls. These excess triplet chlorophylls react with oxygen, producing singlet oxygen. Both triplet chlorophylls and singlet oxygen then extract hydrogen from unsaturated lipids, initiating lipid peroxidation [56,57,58]. The rapid and prolonged production of ROS overwhelms the quenching capacity of photoprotective components near PS II [59,60], such as carotenoids, xanthophylls, tocopherol, and flavonoids. This imbalance leads to severe oxidative damage to proteins, lipids, and pigments, ultimately resulting in cell membrane destruction and plant death [61]. Similar observations were reported in studies by Bai et al. [52], Wang et al. [58], and Zhu et al. [55]. Changes in chlorophyll content are prominent indicators of plant health, reflecting stress responses, nutrient deficiencies, and overall physiological condition [62,63]. Monitoring chlorophyll levels aids in early issue identification and intervention to maintain or improve plant health.
Similar to chlorophyll, herbicides such as ATR can indirectly impact carotenoids by disrupting chloroplast electron transport, leading to the breakdown of a pre-existing photo-protection mechanism. This disruption occurs through the inhibition of cyclic electron flow around PS I, particularly affecting the functioning of the reaction center, P700. Carotenoids, notably β-carotene, associated with PS I, play a crucial role in dissipating excess light energy, thus essential for plant protection [64]. Ridley [65] demonstrated that herbicides inhibiting cyclic electron flow around PS I can induce the photo-destruction of carotenoids. This disruption not only affects carotenoid synthesis but also inhibits their protective function indirectly, which is crucial for maintaining the photo-protection mechanism in plants.
In contrast to these findings, some studies suggest different outcomes regarding anthocyanins. When plants are stressed by herbicide applications, they often undergo metabolic and physiological changes, including alterations in shoot/root biomass, reduced photosynthesis and nutrient uptake, and inhibited flowering and seed formation, ultimately reducing plant growth and productivity [66]. Excessive ROS levels can disrupt cellular redox homeostasis, leading to membrane instability, nucleic acid and protein damage, reduced photosynthetic efficiency, and potentially plant death [67]. In response to this stress, plants have developed mechanisms to scavenge ROS, including upregulating anthocyanin-related genes and inducing anthocyanin synthesis, which contribute to cellular homeostasis and plant adaptation to stress [68,69,70]. The decrease in anthocyanin levels observed in this study may be due to plants prioritizing other pathways over anthocyanin production under stress conditions. This prioritization could result in a decrease in anthocyanin levels, as resources are allocated to other stress response mechanisms. However, it is essential to consider other factors such as direct inhibition of anthocyanin biosynthesis or changes in resource allocation, as these could also contribute to the observed results.

4.2. Capabilities of Heatmap Analysis in Predicting Pigment Changes

When analyzing the spectral reflectance of Red Cos lettuce in response to varying ATR concentrations, higher ATR levels were associated with increased reflectance levels between 475 and 668 nm, encompassing the visible light spectrum crucial for photosynthesis and pigment absorption [71]. Conversely, lower reflectance was observed in the 717 to 842 nm range, falling within the red edge and NIR region. NIR reflectance is influenced by leaf structure, water content, and various photo pigments such as anthocyanins, xanthophylls, carotenoids, and chlorophyll [72,73]. These changes in reflectance indicate that ATR application affects the spectral reflectance of Red Cos lettuce, particularly in these wavelength ranges, suggesting potential impacts on plant health and physiology. Hallik et al. [74] noted that the spectral region most effective for predicting chlorophyll a and other pigments is located at wavelengths much longer than the absorption of the PS I reaction center at 700 nm. This region is believed to be absorbed by specific pigment–protein complexes known as “far-red chlorophylls” [75,76], which can transfer light energy to both PS II and PS I [77,78]. While the presence of such pigments has been demonstrated and studied in plant physiology, this knowledge has not yet been widely applied in remote sensing and ecosystem-level research. In remote sensing studies of leaf optics, the NIR plateau is traditionally regarded as a reference region unaffected by pigments. However, subtle changes in leaf transmittance at 820 nm are commonly measured to assess PS I performance in plant physiology studies [79]. PS I complexes have absorption and emission bands at lower energies than the reaction center (700 nm) [80]. Some studies suggest that extremely long-wavelength chlorophylls may also be present in the PS II antenna system [78,81].
Due to ATR application altering the spectral reflectance of lettuce samples, its impact on pigments can be evaluated using various vegetation indices (Figure 6). The ARI is particularly sensitive to anthocyanin pigments [36], responsible for red, purple, and blue colors in plants. Higher orange levels in the ARI images may indicate increased anthocyanin concentrations in plant tissues. Similarly, the CRI is influenced by carotenoid content [36], with higher green levels in the CRI images indicating greater carotenoid concentrations. Moreover, indices like the BNDVI, GNDVI, NDRE, and NDVI are mainly affected by chlorophyll [37,42,43]. Elevated pink, red, dark green, and blue levels in the images of these indices, respectively, could suggest a higher concentration of chlorophyll pigments. This relationship is rooted in the fact that these indices are influenced by the total amount of chlorophyll and other pigments present in plant leaves. Since different pigments absorb light in distinct parts of the spectrum, an increase in color levels could indicate a higher overall concentration of pigments.
When heatmap analysis was employed to elucidate the correlation between vegetation indices and ATR or pigment classes (Figure 7), a notable negative correlation with ATR was observed across all pigment classes. These strong negative correlations align with previous findings, suggesting that higher levels of ATR corresponded to lower pigment concentrations. Among the indices, EVI exhibited the most robust negative correlation with all pigment classes. EVI is a critical indicator of vegetation health and stress, directly linked to factors such as soil, water, environment, and management practices [82,83]. For example, in a study by Parida and Kumari [84], EVI showed a strong association with foliage pigments like leaf chlorophyll and nitrogen levels, suggesting its sensitivity to changes in plant pigment content. Other studies have also highlighted the effectiveness of EVI in capturing variations in plant pigments, emphasizing its utility as a tool for monitoring plant health and physiological status [82,85,86].
NDVI, GNDVI, BNDVI, SAVI, ARI 2, MCARI, ARI, and LCI demonstrated strong positive correlations with chlorophyll a, chlorophyll b, and carotenoids. On the other hand, only BNDVI, NDVI, GNDVI, SAVI, ARI 2, and LCI exhibited strong positive correlations with anthocyanins. The robust relationship between pigments and NDVI, GNDVI, and BNDVI can be attributed to the way plants absorb and reflect electromagnetic radiation. These indices rely on the difference in reflectance between NIR and visible red, green, or blue light, which is influenced by the presence of chlorophyll, α-carotene, β-carotene, and water in plant tissues [87,88]. According to Haboudane et al. [41], indices comprising red-edge and NIR bands outperformed others in predicting crop chlorophyll content. Kopačková-Strnadová [28] reported a slightly higher correlation between NDVI and chlorophyll content, while NDVI red edge showed the highest correlation with carotenoid content. However, NDVI is highly sensitive to changes in spatial heterogeneity within a field and tends to saturate when the local biological coverage reaches medium-to-high levels [89]. A weak correlation between CRI and carotenoids could be explained by a discrepancy in the wavelength ranges used in this study. While the study employed a center wavelength range of 475 nm for blue and 560 nm for green, the actual CRI equation involves reciprocal reflectance at 510 and 550 nm. Although the bandwidth was correct, this misalignment could lead to distorted readings in that specific wavelength range, potentially affecting the accuracy of CRI in assessing carotenoid levels in the Red Cos lettuce samples.
These findings suggest that different vegetation indices may be more adept at detecting specific changes in pigment concentrations. This highlights the critical importance of selecting the most suitable index for precise pigment analysis. Each index is like a unique tool in a scientist’s toolbox, with its own strengths and weaknesses in detecting specific pigment variations. Understanding these nuances allows researchers to choose the most appropriate index for their specific study, ensuring accurate and meaningful results in pigment analysis.

5. Conclusions

The study showed that increasing ATR application in soil led to higher uptake by Red Cos lettuce, causing significant reductions in chlorophyll a, chlorophyll b, carotenoids, and anthocyanins, especially in plots with higher ATR levels. A direct linear relationship was found between ATR uptake and pigment levels, indicating the herbicide’s direct impact on pigment concentrations. From heatmap analysis, UAV-derived multispectral indices demonstrated strong correlations with the affected pigment classes, suggesting their potential for predicting pigment concentrations in lettuce. For future research, an innovative approach could involve integrating hyperspectral imaging techniques with UAV technology to conduct a more detailed analysis of pigment changes in Red Cos lettuce. This integration would help identify specific wavelengths associated with different pigments, enabling more precise monitoring and assessment of plant health and stress responses. Additionally, applying machine learning algorithms could enhance the analysis of hyperspectral data, providing valuable insights into the interactions between ATR uptake and pigment concentrations. Collaborative efforts among researchers, agronomists, and technology developers will be crucial for advancing these innovative approaches to enhance crop management practices and promote healthy agricultural products.

Author Contributions

Conceptualization, P.K.; methodology, T.B.; formal analysis, T.B.; conducting experiment, T.B.; investigation, P.U.; writing—original draft preparation, T.B. and P.U.; writing—review and editing, P.K.; supervision, P.K. All authors have read and agreed to the published version of the manuscript.

Funding

This work was conducted as part of the PhD program in Environmental Engineering at the Faculty of Engineering, Chiang Mai University, with the support of the CMU Presidential Scholarship and partial financial support from Chiang Mai University. Additionally, it received financial support from the NSRF through the Program Management Unit for Human Resources & Institutional Development, Research, and Innovation (grant number B40G660030).

Data Availability Statement

Data will be made available on request.

Acknowledgments

We would like to acknowledge all support from Chaing Mai University.

Conflicts of Interest

The authors declare no conflicts of interest.

Appendix A. Procedure for Heatmap Generation

In this study, an extensive correlation analysis was conducted to explore the relationships among various environmental variables, including atrazine concentration, plant pigments (chlorophyll a, chlorophyll b, carotenoids, and anthocyanins), and multiple multispectral indices. The dataset, sourced from an Excel file, underwent initial preprocessing to address missing values and validate data types for subsequent statistical examination. Pearson correlation coefficients were calculated to quantify linear associations between each pair of variables, and the results were organized into a correlation matrix.
To visually represent the strength and polarity of these correlations, a heatmap was utilized. The color intensities in the heatmap directly reflected the magnitudes of the correlations, with a legend providing interpretative accuracy. A diverging color scheme was used to clearly differentiate positive from negative correlations, with particularly notable correlations being accentuated. The finalized correlation matrix was saved as a CSV file, and the heatmap was rendered into a high-resolution JPEG image, ensuring clarity for analysis and suitability for publication. Python libraries such as Pandas, NumPy, and Seaborn were essential for data processing, statistical computation, and generating visual aids, ensuring the analysis was both rigorous and replicable.
1.
Data Preparation:
  • Load the dataset from the Excel file, including variables like atrazine concentration, plant pigments, and multispectral indices;
  • Perform necessary preprocessing steps, such as handling missing values and confirming appropriate data types for correlation analysis.
2.
Correlation Analysis:
  • Calculate Pearson correlation coefficients between all pairs of variables;
  • Organize correlation coefficients into a matrix format, with rows and columns corresponding to variables.
3.
Heatmap Visualization:
  • Use a heatmap to visualize the correlation matrix, with color intensity indicating the strength and direction of correlations;
  • Include clear labels for variables along each axis;
  • Apply a diverging colormap to distinguish positive from negative correlations, and highlight significant correlations as needed.

References

  1. Giannini-Kurina, F.; Borello, J.; Cañas, I.; Hang, S.; Balzarini, M. Mapping atrazine persistence in soils of central Argentina using INLA. Soil Tillage Res. 2022, 219, 105320. [Google Scholar] [CrossRef]
  2. Huang, M.Y.; Zhao, Q.; Duan, R.Y.; Liu, Y.; Wan, Y.Y. The effect of atrazine on intestinal histology, microbial community and short chain fatty acids in Pelophylax nigromaculatus tadpoles. Environ. Pollut. 2021, 288, 117702. [Google Scholar] [CrossRef] [PubMed]
  3. Zhao, X.; Wang, L.; Ma, F.; Bai, S.; Yang, J.; Qi, S. Pseudomonas sp, ZXY-1 a newly isolated and highly efficient atrazine-degrading bacterium and optimization of biodegradation using response surface methodology. J. Environ. Sci. 2017, 54, 52–159. [Google Scholar] [CrossRef] [PubMed]
  4. Cheng, M.; Zeng, G.; Huang, D.; Lai, C.; Xu, P.; Zhang, C.; Zhu, Y. Degradation of atrazine by a novel Fenton-like process and assessment the influence on the treated soil. J. Hazard. Mater. 2016, 312, 184–191. [Google Scholar] [CrossRef]
  5. Szewczyk, R.; Różalska, S.; Mironenka, J.; Bernat, P. Atrazine biodegradation by mycoinsecticide Metarhizium robertsii: Insights into its amino acids and lipids profile. J. Environ. Manag. 2020, 262, 110304. [Google Scholar] [CrossRef] [PubMed]
  6. Chang, J.; Fang, W.; Chen, L.; Zhang, P.; Zhang, G.; Zhang, H.; Liang, J.; Wang, Q.; Ma, W. Toxicological effects, environmental behaviors and remediation technologies of herbicide atrazine in soil and sediment: A comprehensive review. Chemosphere 2022, 307 Pt 3, 136006. [Google Scholar] [CrossRef] [PubMed]
  7. Rostami, S.; Jafari, S.; Moeini, Z.; Jaskulak, M.; Keshtgar, L.; Badeenezhad, A.; Azhdarpoor, A.; Rostami, M.; Zorena, K.; Dehghani, M. Current methods and technologies for degradation of atrazine in contaminated soil and water: A review. Environ. Technol. Innov. 2021, 24, 102019. [Google Scholar] [CrossRef]
  8. Zhu, S.; Zhang, T.; Wang, Y.; Zhou, X.; Wang, S.; Wang, Z. Meta-analysis and experimental validation identified atrazine as a toxicant in the male reproductive system. Environ. Sci. Pollut. Res. 2021, 28, 37482–37497. [Google Scholar] [CrossRef]
  9. Singh, S.; Kumar, V.; Chauhan, A.; Datta, S.; Wani, A.B.; Singh, N.; Singh, J. Toxicity, degradation and analysis of the herbicide atrazine. Environ. Chem. Lett. 2018, 16, 211–237. [Google Scholar] [CrossRef]
  10. Department of Agriculture. 2022. Available online: https://www.doa.go.th/ard/wp-content/uploads/2023/02/%E0%B8%AA%E0%B8%A3%E0%B8%B8%E0%B8%9B%E0%B8%82%E0%B9%89%E0%B8%AD%E0%B8%A1%E0%B8%B9%E0%B8%A5%E0%B8%AA%E0%B9%88%E0%B8%87%E0%B8%AD%E0%B8%AD%E0%B8%81%E0%B8%9B%E0%B8%B5-2565-%E0%B8%A3%E0%B8%B2%E0%B8%A2%E0%B8%A5%E0%B8%B0%E0%B9%80%E0%B8%AD%E0%B8%B5%E0%B8%A2%E0%B8%94.pdf (accessed on 10 February 2024).
  11. Almberg, K.S.; Turyk, M.E.; Jones, R.M.; Rankin, K.; Freels, S.; Stayner, L.T. Atrazine contamination of drinking water and adverse birth outcomes in community water systems with elevated Atrazine in Ohio, 2006–2008. Int. J. Environ. Res. Public Health 2018, 15, 1889. [Google Scholar] [CrossRef]
  12. Hu, Y.; Jiang, Z.; Hou, A.; Wang, X.; Zhou, Z.; Qin, B.; Cao, B.; Zhang, Y. Impact of atrazine on soil microbial properties: A meta-analysis. Environ. Pollut. 2023, 323, 121337. [Google Scholar] [CrossRef] [PubMed]
  13. Pérez, D.J.; Doucette, W.J.; Moore, M.T. Atrazine uptake, translocation, bioaccumulation and biodegradation in cattail (Typha latifolia) as a function of exposure time. Chemosphere 2022, 287 Pt 1, 132104. [Google Scholar] [CrossRef]
  14. Urseler, N.; Bachetti, R.; Morgante, V.; Agostini, E.; Morgante, C. Atrazine behavior in an agricultural soil: Adsorption–desorption, leaching, and bioaugmentation with Arthrobacter sp. strain AAC22. J. Soils Sediments 2022, 22, 93–108. [Google Scholar] [CrossRef]
  15. Zhang, Y.; Yang, W.; Sun, Y.; Chang, C.; Yu, J.; Zhang, W. Fusion of multispectral aerial imagery and vegetation indices for machine learning-based ground classification. Remote Sens. 2021, 13, 1411. [Google Scholar] [CrossRef]
  16. Liu, H.; Yuan, Z.; Zhang, J.; Shuai, G. Highly efficient paddy classification using UAV-based orthorectified image. In Proceedings of the IGARSS 2017—2017 IEEE International Geoscience and Remote Sensing Symposium IEEE, Fort Worth, TX, USA, 23–28 July 2017. [Google Scholar]
  17. Pölönen, I.; Saari, H.; Kaivosoja, J.; Honkavaara, E.; Pesonen, L. Hyperspectral imaging-based biomass and nitrogen content estimations from light-weight UAV. In Proceedings of the SPIE—The International Society for Optical Engineering 8887, Dresden; SPIE: Florence, Italy, 2013. [Google Scholar] [CrossRef]
  18. Maimaitijiang, M.; Sagan, V.; Sidike, P.; Maimaitiyiming, M.; Hartling, S.; Peterson, K.T.; Maw, M.J.W.; Shakoor, N.; Mockler, T.; Fritschi, F.B. Vegetation Index Weighted Canopy Volume Model (CVMVI) for soybean biomass estimation from Unmanned Aerial System-based RGB imagery. ISPRS J. Photogramm. Remote Sens. 2019, 151, 27–41. [Google Scholar] [CrossRef]
  19. Zhou, X.; Zheng, H.B.; Xu, X.Q.; He, J.Y.; Ge, X.K.; Yao, X.; Cheng, T.; Zhu, Y.; Cao, W.X.; Tian, Y.C. Predicting grain yield in rice using multi-temporal vegetation indices from UAV-based multispectral and digital imagery. ISPRS J. Photogramm. Remote Sens. 2017, 130, 246–255. [Google Scholar] [CrossRef]
  20. Gilliot, J.M.; Michelin, J.; Hadjard, D.; Houot, S. An accurate method for predicting spatial variability of maize yield from UAV-based plant height estimation: A tool for monitoring agronomic field experiments. Precis. Agric. 2020, 22, 897–921. [Google Scholar] [CrossRef]
  21. Romero, M.; Luo, Y.; Su, B.; Fuentes, S. Vineyard water status estimation using multispectral imagery from an UAV platform and machine learning algorithms for irrigation scheduling management. Comput. Electron. Agric. 2018, 147, 109–117. [Google Scholar] [CrossRef]
  22. Qiao, L.; Tang, W.; Gao, D.; Zhao, R.; An, L.; Li, M.; Sun, H.; Song, D. UAV-based chlorophyll content estimation by evaluating vegetation index responses under different crop coverages. Comput. Electron. Agric. 2022, 196, 106775. [Google Scholar] [CrossRef]
  23. Xue, J.; Su, B. Significant remote sensing vegetation indices: A review of developments and applications. J. Sens. 2017, 2017, 1353691. [Google Scholar] [CrossRef]
  24. He, Y.; Peng, J.; Liu, F.; Zhang, C.U.; Kong, W. Critical review of fast detection of crop nutrient and physiological information with spectral and imaging technology. Trans. Chin. Soc. Agric. Eng. 2015, 31, 174–189. [Google Scholar] [CrossRef]
  25. Abdulridha, J.; Min, A.; Rouse, M.N.; Kianian, S.; Isler, V.; Yang, C. Evaluation of stem rust disease in wheat fields by drone hyperspectral imaging. Sensors 2023, 23, 4154. [Google Scholar] [CrossRef] [PubMed]
  26. Wu, C.; Niu, Z.; Tang, Q.; Huang, W. (Estimating chlorophyll content from hyperspectral vegetation indices: Modeling and validation. Agric. For. Meteorol. 2008, 148, 1230–1241. [Google Scholar] [CrossRef]
  27. Yu, K.; Lenz-Wiedemann, V.; Chen, X.; Bareth, G. Estimating leaf chlorophyll of barley at different growth stages using spectral indices to reduce soil background and canopy structure effects. ISPRS J. Photogramm. Remote Sens. 2014, 97, 58–77. [Google Scholar] [CrossRef]
  28. Kopačková-Strnadová, V.; Koucká, L.; Jelének, J.; Lhotáková, Z.; Oulehle, F. Canopy top, height and photosynthetic pigment estimation using parrot sequoia multispectral imagery and the unmanned aerial vehicle (UAV). Remote Sens. 2021, 13, 705. [Google Scholar] [CrossRef]
  29. Cao, R.; Chen, Y.; Shen, M.; Chen, J.; Zhou, J.; Wang, C.; Yang, W. A simple method to improve the quality of NDVI time-series data by integrating spatiotemporal information with the Savitzky-Golay filter. Remote Sens. Environ. 2018, 217, 244–257. [Google Scholar] [CrossRef]
  30. Liu, Y.; Liu, S.; Li, J.; Guo, X.; Wang, S.; Lu, J. Estimating biomass of winter oilseed rape using vegetation indices and texture metrics derived from UAV multispectral images. Comput. Electron. Agric. 2019, 166, 81–91. [Google Scholar] [CrossRef]
  31. Zeng, Y.; Hao, D.; Huete, A.; Dechant, B.; Berry, J.; Chen, J.M.; Joiner, J.; Frankenberg, C.; Bond-Lamberty, B.; Ryu, Y.; et al. Optical vegetation indices for monitoring terrestrial ecosystems globally. Nat. Rev. Earth Environ. 2022, 3, 477–493. [Google Scholar] [CrossRef]
  32. Pérez-Patricio, M.; Camas-Anzueto, J.L.; Sanchez-Alegría, A.; Aguilar-González, A.; Gutiérrez-Miceli, F.; Escobar-Gómez, E.; Voisin, Y.; Rios Rojas, C.; Grajales-Coutiño, R. Optical method for estimating the chlorophyll contents in plant leaves. Sensors 2018, 18, 650. [Google Scholar] [CrossRef]
  33. Song, J.; Huang, H.; Song, S.; Zhang, Y.; Su, W.; Liu, H. Nutritional quality, mineral and antioxidant content in lettuce affected by interaction of light intensity and nutrient solution concentration. Sci. Rep. 2020, 10, 2796. [Google Scholar] [CrossRef]
  34. Islam, M.Z.; Lee, Y.-T.; Mele, M.A.; Choi, I.-L.; Kang, H.-M. The effect of phosphorus and root zone temperature on anthocyanin of red romaine lettuce. Agronomy 2019, 9, 47. [Google Scholar] [CrossRef]
  35. Elhadary, A.; Rabah, M.; Ghanim, E.; Mohie, R.; Taha, A. The influence of flight height and overlap on UAV imagery over featureless surfaces and constructing formulas predicting the geometrical accuracy. NRIAG J. Astron. Geophys. 2022, 11, 210–223. [Google Scholar] [CrossRef]
  36. Gitelson, A.; Merzlyak, M.; Chivkunova, O.B. Optical properties and nondestructive estimation of anthocyanin content in plant leaves. Photochem. Photobiol. 2001, 71, 38–45. [Google Scholar] [CrossRef]
  37. Banerjee, B.P.; Sharma, V.; Spangenberg, G.; Kant, S. Machine learning regression analysis for estimation of crop emergence using multispectral UAV imagery. Remote Sens. 2021, 13, 2918. [Google Scholar] [CrossRef]
  38. Huete, A.; Didan, K.; Miura, T.; Rodriguez, E.P.; Gao, X.; Ferreira, L.G. Overview of the radiometric and biophysical performance of the MODIS vegetation indices. Remote Sens. Environ. 2002, 83, 195–213. [Google Scholar] [CrossRef]
  39. Gitelson, A.A.; Merzlyak, M.N. Remote sensing of chlorophyll concentration in higher plant leaves. Adv. Space Res. 1998, 22, 689–692. [Google Scholar] [CrossRef]
  40. Datt, B. Remote sensing of water content in eucalyptus leaves. Aust. J. Bot. 1999, 47, 909–923. [Google Scholar] [CrossRef]
  41. Haboudane, D.; Miller, J.R.; Pattey, E.; Zarco-Tejada, P.J.; Strachan, I.B. Hyperspectral vegetation indices and novel algorithms for predicting green LAI of crop canopies: Modeling and validation in the context of precision agriculture. Remote Sens. Environ. 2004, 90, 337–352. [Google Scholar] [CrossRef]
  42. Thompson, C.N.; Guo, W.; Sharma, B.; Ritchie, G.L. Using normalized difference red edge index to assess maturity in cotton. Crop Sci. 2019, 59, 2167–2177. [Google Scholar] [CrossRef]
  43. Carlson, T.N.; Ripley, D.A. On the relation between NDVI, fractional vegetation cover, and leaf area index. Remote Sens. Environ. 1997, 62, 241–252. [Google Scholar] [CrossRef]
  44. Huete, A. A soil-adjusted vegetation index (SAVI). Remote Sens. Environ. 1988, 25, 295–309. [Google Scholar] [CrossRef]
  45. Miller, E.L.; Nason, S.L.; Karthikeyan, K.G.; Pedersen, J.A. Root uptake of pharmaceuticals and personal care product ingredients. Environ. Sci. Technol. 2016, 50, 525–541. [Google Scholar] [CrossRef] [PubMed]
  46. Liu, J.; Zhou, B.; Zhang, H.; Ma, J.; Mu, B.; Zhang, W. A novel biochar modified by chitosan-Fe/S for tetracycline adsorption and studies on site energy distribution. Bioresour. Technol. 2019, 294, 122152. [Google Scholar] [CrossRef] [PubMed]
  47. Chen, X.; Duan, M.; Zhou, B.; Cui, L. Effects of biochar nanoparticles as a soil amendment on the structure and hydraulic characteristics of a sandy loam soil. Soil Use Manag. 2021, 38, 836–849. [Google Scholar] [CrossRef]
  48. Briggs, G.G.; Bromilow, R.H.; Evans, A.A. Relationship between lipophilicity and root uptake and translocation of non-ionised chemicals by barley. Pestic. Sci. 1982, 13, 495–504. [Google Scholar] [CrossRef]
  49. Roeth, F.W.; Lavy, T.L. Atrazine uptake by Sudangrass, sorghum, and corn. Weed Sci. 1971, 19, 93–97. [Google Scholar] [CrossRef]
  50. Kaur, H.; Kaur, R.; Singh, S.; Jagota, N.; Sharma, A. Chapter 4—Pesticide biology in plants: Plant uptake, translocation, and accumulation. In Pesticides in the Environment; Sharma, A., Kumar, V., Zheng, B., Eds.; Elsevier: Amsterdam, The Netherlands, 2024; pp. 67–86. [Google Scholar] [CrossRef]
  51. Sandanayake, S.; Hettithanthri, O.; Buddhinie, P.K.C.; Vithanage, M. Plant uptake of pesticide residues from agricultural soils. In The Handbook of Environmental Chemistry; Rodríguez-Cruz, M.S., Sánchez-Martín, M.J., Eds.; Springer: Cham, Switerzerland, 2021; Volume 113. [Google Scholar] [CrossRef]
  52. Bai, X.; Sun, C.; Xie, J.; Song, H.; Zhu, Q.; Su, Y.; Qian, H.; Fu, Z. Effects of atrazine on photosynthesis and defense response and the underlying mechanisms in Phaeodactylum tricornutum. Environ. Sci. Pollut. Res. 2015, 22, 17499–17507. [Google Scholar] [CrossRef]
  53. Yang, L.; Zhang, Y. Effects of atrazine and its two major derivatives on the photosynthetic physiology and carbon sequestration potential of a marine diatom. Ecotoxicol. Environ. Saf. 2020, 205, 111359. [Google Scholar] [CrossRef]
  54. Qian, H.F.; Sheng, G.D.; Liu, W.P.; Lu, Y.; Fu, Z.W. Inhibitory effects of atrazine on Chlorella vulgaris as assessed by real-time polymerase chain reaction. Environ. Toxicol. Chem. 2008, 27, 182–187. [Google Scholar] [CrossRef]
  55. Zhu, J.; PATRoldt, W.L.; Radwan, O.; Tranel, P.J.; Clough, S.J. Effects of photosystem-II interfering herbicides atrazine and bentazon on the soybean transcriptome. Plant Genome 2009, 2, 191–205. [Google Scholar] [CrossRef]
  56. Krieger-Liszkay, A.; Fufezan, C.; Trebst, A. Singlet oxygen production in photosystem II and related protection mechanism. Photosynth. Res. 2008, 98, 551–564. [Google Scholar] [CrossRef] [PubMed]
  57. Sharma, P.; Jha, A.B.; Dubey, R.S.; Pessarakli, M. Reactive oxygen species, oxidative damage, and antioxidative defense mechanism in plants under stressful conditions. J. Bot. 2012, 2012, 217037. [Google Scholar] [CrossRef]
  58. Wang, Y.; Yu, J.; Zhou, B.; Sapkota, S.; Wei, F.; Wang, Z. Atrazine and mesotrione-induced oxidative stress and impact on antioxidant enzymes and chlorophyll content in Bermudagrass. Planta Daninha 2018, 36, e018172227. [Google Scholar] [CrossRef]
  59. Loll, B.; Kern, J.; Saenger, W.; Zouni, A.; Biesiadka, J. Towards complete cofactor arrangement in the 3.0 Å resolution structure of photosystem II. Nature 2005, 438, 1040–1044. [Google Scholar] [CrossRef] [PubMed]
  60. Trebst, A. Function of beta-carotene and tocopherol in photosystem II. J. Biosci. 2003, 58, 609–620. [Google Scholar] [CrossRef]
  61. Xu, Z.; Mahmood, K.; Rothstein, S.J. ROS induces anthocyanin production via late biosynthetic genes and anthocyanin deficiency confers the hypersensitivity to ROS-generating stresses in Arabidopsis. Plant Cell Physiol. 2017, 58, 1364–1377. [Google Scholar] [CrossRef] [PubMed]
  62. Li, Y.; He, N.; Hou, J.; Xu, L.; Liu, C.; Zhang, J.; Wang, Q.; Zhang, X.; Wu, X. Factors influencing leaf chlorophyll content in natural forests at the Biome scale. Front. Ecol. Evol. 2018, 6, 64. [Google Scholar] [CrossRef]
  63. Pavlovic, D.; Nikolic, B.; Durovic, S.; Waisi, H.; Andelkovic, A.; Marisavljevic, D. Chlorophyll as a measure of plant health: Agroecological aspects. Pestic. Phytomedicine 2014, 29, 21–34. [Google Scholar] [CrossRef]
  64. Sandmann, G. Bleaching herbicides: Action mechanism in carotenoid biosynthesis, structural requirements and engineering of resistance. In Herbicide Classes in Development; Böger, P., Wakabayashi, K., Hirai, K., Eds.; Springer: Berlin/Heidelberg, Germany, 2002. [Google Scholar] [CrossRef]
  65. Ridley, S.M. Carotenoids and herbicide action. In Carotenoid Chemistry and Biochemistry; Britton, G., Goodwin, T.W., Eds.; Elsevier: Pergamon, UK, 1982; pp. 353–369. [Google Scholar] [CrossRef]
  66. Kaur, S.; Tiwari, V.; Kumari, A.; Chaudhary, E.; Sharma, A.; Ali, U.; Garg, M. Protective and defensive role of anthocyanins under plant abiotic and biotic stresses: An emerging application in sustainable agriculture. J. Biotechnol. 2023, 361, 12–29. [Google Scholar] [CrossRef]
  67. Li, Z.; Ahammed, G.J. Plant stress response and adaptation via anthocyanins: A review. Plant Stress 2023, 10, 100230. [Google Scholar] [CrossRef]
  68. Kaur, S.; Kumari, A.; Sharma, N.; Pandey, A.K.; Garg, M. Physiological and molecular response of colored wheat seedlings against phosphate deficiency is linked to accumulation of distinct anthocyanins. Plant Physiol. Biochem. 2022, 170, 338–349. [Google Scholar] [CrossRef] [PubMed]
  69. Naing, A.H.; Kim, C.K. Abiotic stress-induced anthocyanins in plants: Their role in tolerance to abiotic stresses. Physiol. Plant. 2021, 172, 1711–1723. [Google Scholar] [CrossRef] [PubMed]
  70. Khan, A.; Jalil, S.; Cao, H.; Tsago, Y.; Sunusi, M.; Chen, Z.; Shi, C.; Jin, X. The purple leaf (pl6) mutation regulates leaf color by altering the anthocyanin and chlorophyll contents in rice. Plants 2020, 9, 1477. [Google Scholar] [CrossRef]
  71. Liu, J.; van Iersel, M.W. Photosynthetic physiology of blue, green, and red light: Light intensity effects and underlying mechanisms. Front. Plant Sci. 2021, 12, 619987. [Google Scholar] [CrossRef] [PubMed]
  72. Kuska, M.T.; Behmann, J.; Mahlein, A.K. Potential of hyperspectral imaging to detect and identify the impact of chemical welfare compounds on plant tissue. Pure Appl. Chem. 2018, 90, 1615–1624. [Google Scholar] [CrossRef]
  73. Slaton, M.R.; Hunt, E.R., Jr.; Smith, W.K. Estimating near-infrared leaf reflectance from leaf structural characteristics. Am. J. Bot. 2001, 88, 278–284. [Google Scholar] [CrossRef] [PubMed]
  74. Hallik, L.; Kazantsev, T.; Kuusk, A.; Galmes, J.; Tomas, M.; Niinemets, U. Generality of relationships between leaf pigment contents and spectral vegetation indices in Mallorca (Spain). Reg. Environ. Change 2017, 17, 2097–2109. [Google Scholar] [CrossRef]
  75. Melkozernov, A.N. Excitation energy transfer in photosystem I from oxygenic organisms. Photosynth. Res. 2001, 70, 129–153. [Google Scholar] [CrossRef]
  76. Gibasiewicz, K.; Szrajner, A.; Ihalainen, J.A.; Germano, M.; Dekker, J.P.; van Grondelle, R. Characterization of low-energy chlorophylls in the PSI-LHCI supercomplex from Chlamydomonas reinhardtii. A site-selective fluorescence study. J. Phys. Chem. B 2005, 109, 21180–21186. [Google Scholar] [CrossRef]
  77. Oja, V.; Bichele, I.; Hüve, K.; Rasulov, B.; Laisk, A. Reductive titration of photosystem I and differential extinction coefficient of P700+ at 810–950 nm in leaves. Biochim. Biophys. Acta Bioenerg. 2004, 1658, 225–234. [Google Scholar] [CrossRef]
  78. Pettai, H.; Oja, V.; Freiberg, A.; Laisk, A. The long-wavelength limit of plant photosynthesis. FEBS Lett. 2005, 579, 4017–4019. [Google Scholar] [CrossRef] [PubMed]
  79. Oja, V.; Eichelmann, H.; Peterson, R.B.; Rasulov, B.; Laisk, A. Deciphering the 820 nm signal: Redox state of donor side and quantum yield of photosystem I in leaves. Photosynth. Res. 2003, 78, 1–15. [Google Scholar] [CrossRef] [PubMed]
  80. Ihalainen, J.A.; Jensen, P.E.; Haldrup, A.; van Stokkum, I.H.M.; van Grondelle, R.; Scheller, H.V.; Dekker, J.P. Pigment organization and energy transfer dynamics in isolated, photosystem I (PSI) complexes from Arabidopsis thaliana depleted of the PSI-G, PSI-K, PSI-L, or PSI-N subunit. Biophys. J. 2002, 83, 2190–2201. [Google Scholar] [CrossRef] [PubMed]
  81. Thapper, A.; Mamedov, F.; Mokvist, F.; Hammarström, L.; Styring, S. Defining the far-red limit of photosystem II in spinach. Plant Cell 2009, 21, 2391–2401. [Google Scholar] [CrossRef] [PubMed]
  82. Gitelson, A.A.; Gritz, Y.; Merzlyak, M.N. Relationships between leaf chlorophyll content and spectral reflectance and algorithms for non-destructive chlorophyll assessment in higher plant leaves. J. Plant Physiol. 2003, 160, 271–282. [Google Scholar] [CrossRef] [PubMed]
  83. Singh, N.; Parida, B.R. Environmental factors associated with seasonal variations of night-time plant canopy and soil respiration fluxes in deciduous conifer forest, Western Himalaya, India. Trees 2019, 33, 599–613. [Google Scholar] [CrossRef]
  84. Parida, B.R.; Kumari, A. Mapping and modeling mangrove biophysical and biochemical parameters using Sentinel-2A satellite data in Bhitarkanika National Park, Odisha. Model. Earth Syst. Environ. 2021, 7, 2463–2474. [Google Scholar] [CrossRef]
  85. Cheng, Q.; Wu, X. Correlation analysis of simulated MODIS vegetation indices and the red edge and rice agricultural parameter. In Remote Sensing for Agriculture, Ecosystems, and Hydrology IX; Neale, C.M.U., Owe, M., D’Urso, G., Eds.; SPIE: Florence, Italy, 2007; p. 67420U. [Google Scholar]
  86. Frampton, W.J.; Dash, J.; Watmough, G.; Milton, E.J. Evaluating the capabilities of Sentinel-2 for quantitative estimation of biophysical variables in vegetation. ISPRS J. Photogramm. Remote Sens. 2013, 82, 83–92. [Google Scholar] [CrossRef]
  87. da Silva, E.E.; Baio, F.H.R.; Teodoro, L.P.R.; da Silva Junior, C.A.; Borges, R.S.; Teodoro, P.E. UAV-multispectral and vegetation indices in soybean grain yield prediction based on in situ observation. Remote Sens. Appl. Soc. Environ. 2020, 18, 100318. [Google Scholar] [CrossRef]
  88. Silva Junior, C.A.; Nanni, M.R.; Shakir, M.; Teodoro, P.E.; de Oliveira-Júnior, J.F.; Cezar, E.; Shiratsuchi, L.S. Soybean varieties discrimination using non imaging hyperspectral sensor. Infrared Phys. Technol. 2018, 89, 338–350. [Google Scholar] [CrossRef]
  89. Duan, B.; Liu, Y.; Ging, Y.; Peng, Y.; Wu, X.; Zhu, R.; Fang, S. Remote estimation of rice LAI based on Fourier spectrum texture from UAV image. Plant Methods 2019, 15, 124. [Google Scholar] [CrossRef] [PubMed]
Figure 1. Study area in the experiment’s region of interest (a) and the experimental plots (b).
Agronomy 14 00814 g001
Figure 2. Atrazine (ATR) concentration in Red Cos lettuce of each plot. a−d signify significant differences according to the LSD test (p < 0.05). ATR0 = no ATR application; ATR1 = ATR 75 μg kg−1 in soil, ATR2 = ATR 150 μg kg−1 in soil; ATR3 = ATR 225 μg kg−1 in soil; and ATR4 = ATR 300 μg kg−1 in soil.
Agronomy 14 00814 g002
Figure 3. Content of chlorophyll a (a); chlorophyll b (b); carotenoids (c); and anthocyanins (d) in Red Cos lettuce as a result of atrazine (ATR) application. a−c signify significant differences according to the LSD test (p < 0.05). ATR0 = no ATR application; ATR1 = ATR 75 μg kg−1 in soil, ATR2 = ATR 150 μg kg−1 in soil; ATR3 = ATR 225 μg kg−1 in soil; and ATR4 = ATR 300 μg kg−1 in soil.
Agronomy 14 00814 g003
Figure 4. Correlation between pigment profiles and atrazine (ATR) uptake in Red Cos lettuce.
Agronomy 14 00814 g004
Figure 5. Spectral reflectance of Red Cos lettuce in response to different atrazine (ATR) concentrations, ranging from 475 nm to 842 nm. ATR0 = no ATR application; ATR1, ATR2 represent medium ATR concentrations with 75 μg kg−1 and 150 μg kg−1 in soil, respectively; ATR3, ATR4 represent high ATR concentrations with 225 μg kg−1 and 300 μg kg−1 in soil, respectively.
Agronomy 14 00814 g005
Figure 6. Visualization of various vegetation indices (VIs) of Red Cos lettuce in response to atrazine (ATR) application. ATR0 = no ATR application; ATR1 = ATR 75 μg kg−1 in soil, ATR2 = ATR 150 μg kg−1 in soil; ATR3 = ATR 225 μg kg−1 in soil; and ATR4 = ATR 300 μg kg−1 in soil.
Agronomy 14 00814 g006
Figure 7. Heatmap showing the correlation between UAV-derived multispectral indices and plant pigments.
Agronomy 14 00814 g007
Table 1. Spectral vegetation indices (VIs), equation, and resources.
Vegetation IndicesSynonymDescriptionEquationReference
Anthocyanin Reflectance IndexARIMeasures the levels of anthocyanin content, which can indicate stress responses or senescence in plants. A R I = 1 G r e e n 1 R e d   e d g e [36]
Anthocyanin Reflectance Index 2ARI 2Measures the levels of anthocyanin content, which can indicate stress responses or senescence in plants. A R I   2 = N I R × ( 1 G r e e n 1 R e d   e d g e ) [36]
Carotenoid Reflectance IndexCRIMeasures the concentration of carotenoids, pigments that play a crucial role in plant health and stress tolerance. C R I = 1 B l u e 1 G r e e n [36]
Blue Normalized Difference Vegetation IndexBNDVIAssesses whether the target being observed contains live green vegetation, indicating biomass and health, but uses blue light for better detection of vegetation in areas with high soil background reflectance. B N D V I = N i r B l u e N i r + B l u e [37]
Enhanced Vegetation IndexEVIOptimized to enhance the vegetation signal with improved sensitivity in high biomass regions, and to facilitate better vegetation monitoring by de-coupling the canopy background signal and reducing atmospheric influences. E V I = 2.5 × ( R e d   e d g e R e d R e d   e d g e + 6 × R e d 7.5 × G r e e n + 1 ) [38]
Green Normalized Difference Vegetation IndexGNDVIUtilizes green wavelengths and is sensitive to chlorophyll concentration, indicating plant health and photosynthetic capacity. G N D V I = N i r G r e e n N i r + G r e e n [39]
Leaf Chlorophyll IndexLCIEstimates the chlorophyll content of leaves, which is an indicator of plant health and nitrogen content. L C I = N i r R e d   e d g e R e d   e d g e + R e d   [40]
Modified Chlorophyll Absorption in Reflectance IndexMCARIDesigned to monitor subtle changes in chlorophyll content, making it useful for assessing vegetation health and stress. M C A R I = R e d   e d g e R e d                                                         0.2 × ( R e d   e d g e                                                         G r e e n ) × ( R e d   e d g e R e d   ) [41]
Normalized Difference Red EdgeNDREMeasures the chlorophyll content in plants, especially useful in later stages of crop growth when the NDVI becomes less sensitive. N D R E = N i r R e d   e d g e N i r + R e d   e d g e [42]
Normalized Difference Vegetation IndexNDVIAssesses whether the target being observed contains live green vegetation or not, indicating biomass and health. N D V I = N i r R e d N i r + R e d [43]
Soil Adjusted Vegetation IndexSAVICorrects the NDVI for the influence of soil brightness when vegetation cover is low. S A V I = ( 1 + L ) × ( N i r R e d ) ( N i r + R e d + L ) [44]
Table 2. Correlation between level of atrazine (ATR) uptake and level of pigments in Red Cos lettuce.
PigmentEquationR2
Chlorophyll a[Chlorophyll a] = −0.0032 [ATR] + 0.13880.8713
Chlorophyll b[Chlorophyll b] = −0.0016 [ATR] + 0.08890.8817
Carotenoids[Carotenoids] = −0.0046 [ATR] + 0.21190.8457
Anthocyanins[Anthocyanins] = −0.0002 [ATR] + 0.01610.8833
Disclaimer/Publisher’s Note: The statements, opinions and data contained in all publications are solely those of the individual author(s) and contributor(s) and not of MDPI and/or the editor(s). MDPI and/or the editor(s) disclaim responsibility for any injury to people or property resulting from any ideas, methods, instructions or products referred to in the content.

