Article

Characterization and RNA-Seq Analysis of Yellow-Green Leaf Mutants in Tomato

College of Horticulture and Landscape Architecture, Northeast Agricultural University, Harbin 150030, China
*
Author to whom correspondence should be addressed.
Agronomy 2024, 14(4), 828; https://doi.org/10.3390/agronomy14040828
Submission received: 7 March 2024 / Revised: 10 April 2024 / Accepted: 15 April 2024 / Published: 16 April 2024
(This article belongs to the Section Crop Breeding and Genetics)

Abstract

:
Leaves are the main site of photosynthesis in plants, and leaf color plays a major role in crop quality, yield, resistance, as well as other aspects. Although the genes related to photosynthesis have been well characterized in plants in general, yellow-green leaf mutants have not yet been fully studied in tomatoes. In the present study, a dark green leaf (GL) mutant was isolated from yellow-leaf tomato (wild-type). The dark GL displays a distinct yellow-green phenotype, and has a greater chlorophyll content and higher photosynthetic rate. Furthermore, the lamellae were clear, and the stroma and grana were orderly, with more stacking and larger starch grains according to the ultrastructure analysis of chloroplasts in GL leaves. Comparative transcriptome analysis of GL and wild-type plants was performed to identify the pathways and genes related to photosynthesis. In this work, a total of 292 differentially expressed genes (DEGs) between GL plants and WT plants were identified, of which 131 genes were upregulated and 161 genes were downregulated. The diterpenoid biosynthesis and photosynthesis antenna proteins were the two most significantly enriched in the first 20 pathways according to KEGG analysis. Most of the DEGs involved in diterpenoid biosynthesis and photosynthesis were antenna proteins. The photosynthesis antenna protein Solyc02g071030 (LHCB1) and the diterpenoid biosynthesis-related genes, Solyc08g005710 and Solyc09g059240, were significantly upregulated in GL leaves compared with WT leaves. The expression patterns of the DEGs were similar to those determined by qRT-PCR. Overall, our research not only revealed the diterpenoid biosynthesis and photosynthesis pathways involving in leaf color variation, but also identified the putative target genes for genetic manipulation in the future.

1. Introduction

Leaves are the primary photosynthetic organs in higher plants and play a crucial role in growth and development. However, leaf color is often variable and the main ways of generating leaf color mutants are natural variation and genetic mutation. Changes in leaf color are common phenomena in plants and usually affect their photosynthetic efficiency and growth. In addition, the chloroplast structural morphology has been identified as an important factor influencing leaf color. Most leaf color mutations are caused by reduced chlorophyll content in the leaves, and disruptions in chlorophyll metabolic pathways can also lead to leaf color mutations. Previous studies have reported that leaf color mutations result in abnormal structures, including those of the thylakoids and grana, in the chloroplasts. In contrast, the normal-colored leaves maintain their chloroplasts in a relatively intact form. The main reason for this difference is that the formation of chloroplasts is influenced during the stage of thylakoid and granum formation [1].
In higher plants, chlorophyll is synthesized from L-glutamate-tRNA through a total of 19 chemical reactions involving more than 20 different genes and 15 different enzymes, ultimately resulting in the formation of chlorophyll a and b [2]. The synthesis of chlorophyll is complex and can be divided into three main steps: the conversion of 5-aminolevulinic acid (ALA) to protoporphyrin IX in the chloroplast, the synthesis of chlorophyllide in the thylakoid membranes, and the synthesis of chlorophyll a and b in the thylakoid membranes. Any alteration in these reactions can lead to changes in enzyme activity, resulting in the accumulation of large amounts of intermediate reactive species and leading to long-term oxidative damage and cell death in plants. Furthermore, chlorophyll undergoes abnormal degradation by chlorophyll enzymes if the external environment changes, resulting in changes to the pigmentation of plant leaves and significant alterations in leaf color. The levels of chlorophyll and carotenoids in some leaf-color mutants are much lower than those in normal plants [3]. Previous studies have shown that a large number of genes were related to the leaf color. Gene mutations associated with chloroplast development can lead to the formation of yellow or green leaf color. Jung et al. found that the T-DNA insertion in the OsCHLI gene, which encodes the subunit of Mg chelatase, resulted in abnormal chlorophyll branching in the tetrapyrrole biosynthesis pathway, leading to incomplete development of chloroplast thylakoid membranes, resulting in chlorophyll deficiency and decreased content [4]. The yellowing in the apgl mutant is due to the inhibition of plastidic heme synthesis, which is required for chloroplast thylakoid and stromal membrane formation and leads to abnormal chloroplast grana and grana-thylakoid structures in plants [5]. Changes in chlorophyll degradation genes can accelerate or slow down chlorophyll degradation, leading to accumulation or loss of chlorophyll content. If the content is too high, the leaves will show dark green and stagnant green phenomena, and if too low, they will become light green or even white. For example, the gene A/KC7 of reductase (SDR) is a chlorophyll b reductase, which is involved in the regulation of light harvesting complex LHCII and thylakoid membrane [6]. Research conducted by Park et al. revealed that the reason for inhibition of the chlorophyll degradation pathway in the rice evergreen mutant Sgr is that the Sgr mutant inhibits the binding between LHCPIL (lighting-harvesting chlorophyll binding protein) and the mutant gene Sgr in chloroplasts during leaf senescence [7]. The earliest identified color mutant was aurea (au) mutant and was isolated from the natural mutant, yellow-green-2 (yg-2), which is derived from physical mutagenesis in tomatoes. Both of these mutants exhibited similar phenotypes, with reduced anthocyanin and chlorophyll contents. The publication of leaf color variation mechanisms in these two mutants led to research on leaf color mutants in tomatoes [8]. Overall, the dynamic balance of chlorophyll metabolism is closely related to leaf color. The changes in the chlorophyll content and characteristics mainly affect chlorophyll synthesis and metabolism processes.
Chlorophyll mutants are important genetic materials for studying photosynthesis. The dark green leaf mutant not only can be used as a trait marker in tomato hybrid breeding but can also play an important role in the formation of yield. In the present study, the dark green leaf (GL) line was isolated from wild-type plants. The chlorophyll content, photosynthetic characteristics, and comparative transcriptome were measured. Transcriptome sequencing of GL and wild-type plants was performed to determine the mechanism of leaf color regulation. This study will not only help us to understand the relationship between physiological changes and gene expression changes but also provide the gene resources for a high photosynthetic effect and high yield breeding in tomatoes.

2. Materials and Methods

2.1. Plant Material Cultivation

The stable dark green leaf (GL) mutant is derived from the natural mutant of inbred line “716” (wild-type). This mutant has been continuously cultivated for three generations and the phenotype was stable. The dark green leaf mutant and the normal green leaf inbred line (wild-type) were planted in the solar greenhouse (126°54 5′8″ E, 45°46′23″ N) of Northeast Agricultural University. Small holes (1 cm deep) were dug on the surface of each soil block, and one seed was sown in each hole. The seeds were subsequently covered with dry soil and covered with a nonwoven cloth to keep the planting area moist. After germination, the plants were not watered until the soil was completely dry; watering was then performed every 2 to 3 days when the soil looked dry. Seedlings were transplanted from the planting bed to the nutrient broth at 4 weeks of age, after which they grew 4 leaves before being established in the greenhouse. The experiment was performed based on the randomized block with three biological replicates.

2.2. Measurement of Phenotypic and Physiological Trait

At the four leaves stage, the seedlings were selected for the measurement of phenotypic and physiological traits. The portable photosynthesis measurement system (Li-6400 from LI-COR company, Lincoln, NE, USA) was used to measure the photosynthetic rate and chlorophyll content of the same leaf position, including wild-type tomato “716” and dark green leaf (GL) mutants. Ten plants of each line were measured and the average value was taken. The leaves of the wild-type tomato “716” and dark green leaf (GL) mutants were sampled for analysis using transmission electron microscopy. The experiment was performed with three biological replicates. In addition, the tomato leaves were cut into 50 nm sections in 2.5% solution at 4 °C for 48 h, rinsed with 0.1 M phosphate buffer solution and fixed with 1% fixing solution, then dehydrated and embedded. The samples were dyed with uranyl acetate and lead citrate at 25 °C, and rinsed thoroughly with double distilled water. Finally, the H-7650 transmission electron microscope, produced by Hitachi in Japan, was used to observe the chloroplast ultrastructure.

2.3. Sample Preparation for Sequencing

The wild-type tomato “716” and the stable dark green leaf (GL) mutants were subjected to RNA-seq. The leaves of the plants were taken, and the samples in the control group were denoted as WT (WT_1, WT_2, and WT_3). The GL mutant group samples were denoted as GL1 (GL1_1, GL1_2, and GL1_3 in triplicate). The total RNA was extracted for the library construction.

2.4. Transcriptome Library Construction

The process of constructing a sequencing library includes: processing the total RNA by mRNA enrichment, segmenting the obtained RNA using a break buffer, reverse transcription using random N6 primers, and synthesizing double stranded cDNA. The process subsequently includes: flattening the end of the synthesized double-stranded DNA and phosphorylating it at the 5′ end, forming a protruding sticky end at the 3′ end, and connecting it to a bubbly junction with a protruding “T” at the 3′ end. The connecting products were amplified by PCR using specific primers, and finally, used for machine sequencing.

2.5. RNA-Seq Data Analysis

Data filtering was performed using SOAPnuke for statistical analysis [9]. The filtering software SOAPnuke 2.0 version was used for removing low-quality reads with an unknown base (N) content greater than 5% [9], and reads with a proportion of bases with a quality value below 10 where greater than 20% of the total number of bases in that read were also defined as low-quality reads. After obtaining clean reads, the Hierarchical Indexing for Spliced Alignment of Transcripts (HISAT2) software was used to align the clean reads to the reference genome sequence [10]. Subsequently, we performed an overall analysis of RNA-Seq after alignment quality control (QC), including the differentially expressed genes (DEGs) between selected samples, GO enrichment analysis, KEGG network analysis, clustering analysis, and WGCNA.

2.6. qRT-PCR Verification of Differentially Expressed Genes

In order to validate the reliability of the RNA-Seq results, significantly enriched differentially expressed genes (DEGs) were selected for qRT-PCR verification. The qRT-PCR primers were designed Prime 5 software. The Actin gene was used as internal reference gene (Table S1). The experiment was performed using AceQ® qPCR SYBR® Green Master Mix (Vazyme, Nanjing, China) and a qTOWER3G detection system (Analytik Jena, Jena, Germany). The gene expression analysis was conducted using the 2−∆∆CT method [11]. The qRT-PCR reaction program includes four steps: pre-denaturation at 95 °C for 7 min, and 40 cycles of reaction at 95 °C for 10 s, 57 °C for 30 s, and 72 °C for 20 s. The SPSS 7.0 software was used to analyze qRT-PCR data, and significant differences were compared using the Waller–Duncan (W) test at a significance level of p < 0.05 [12].

3. Results

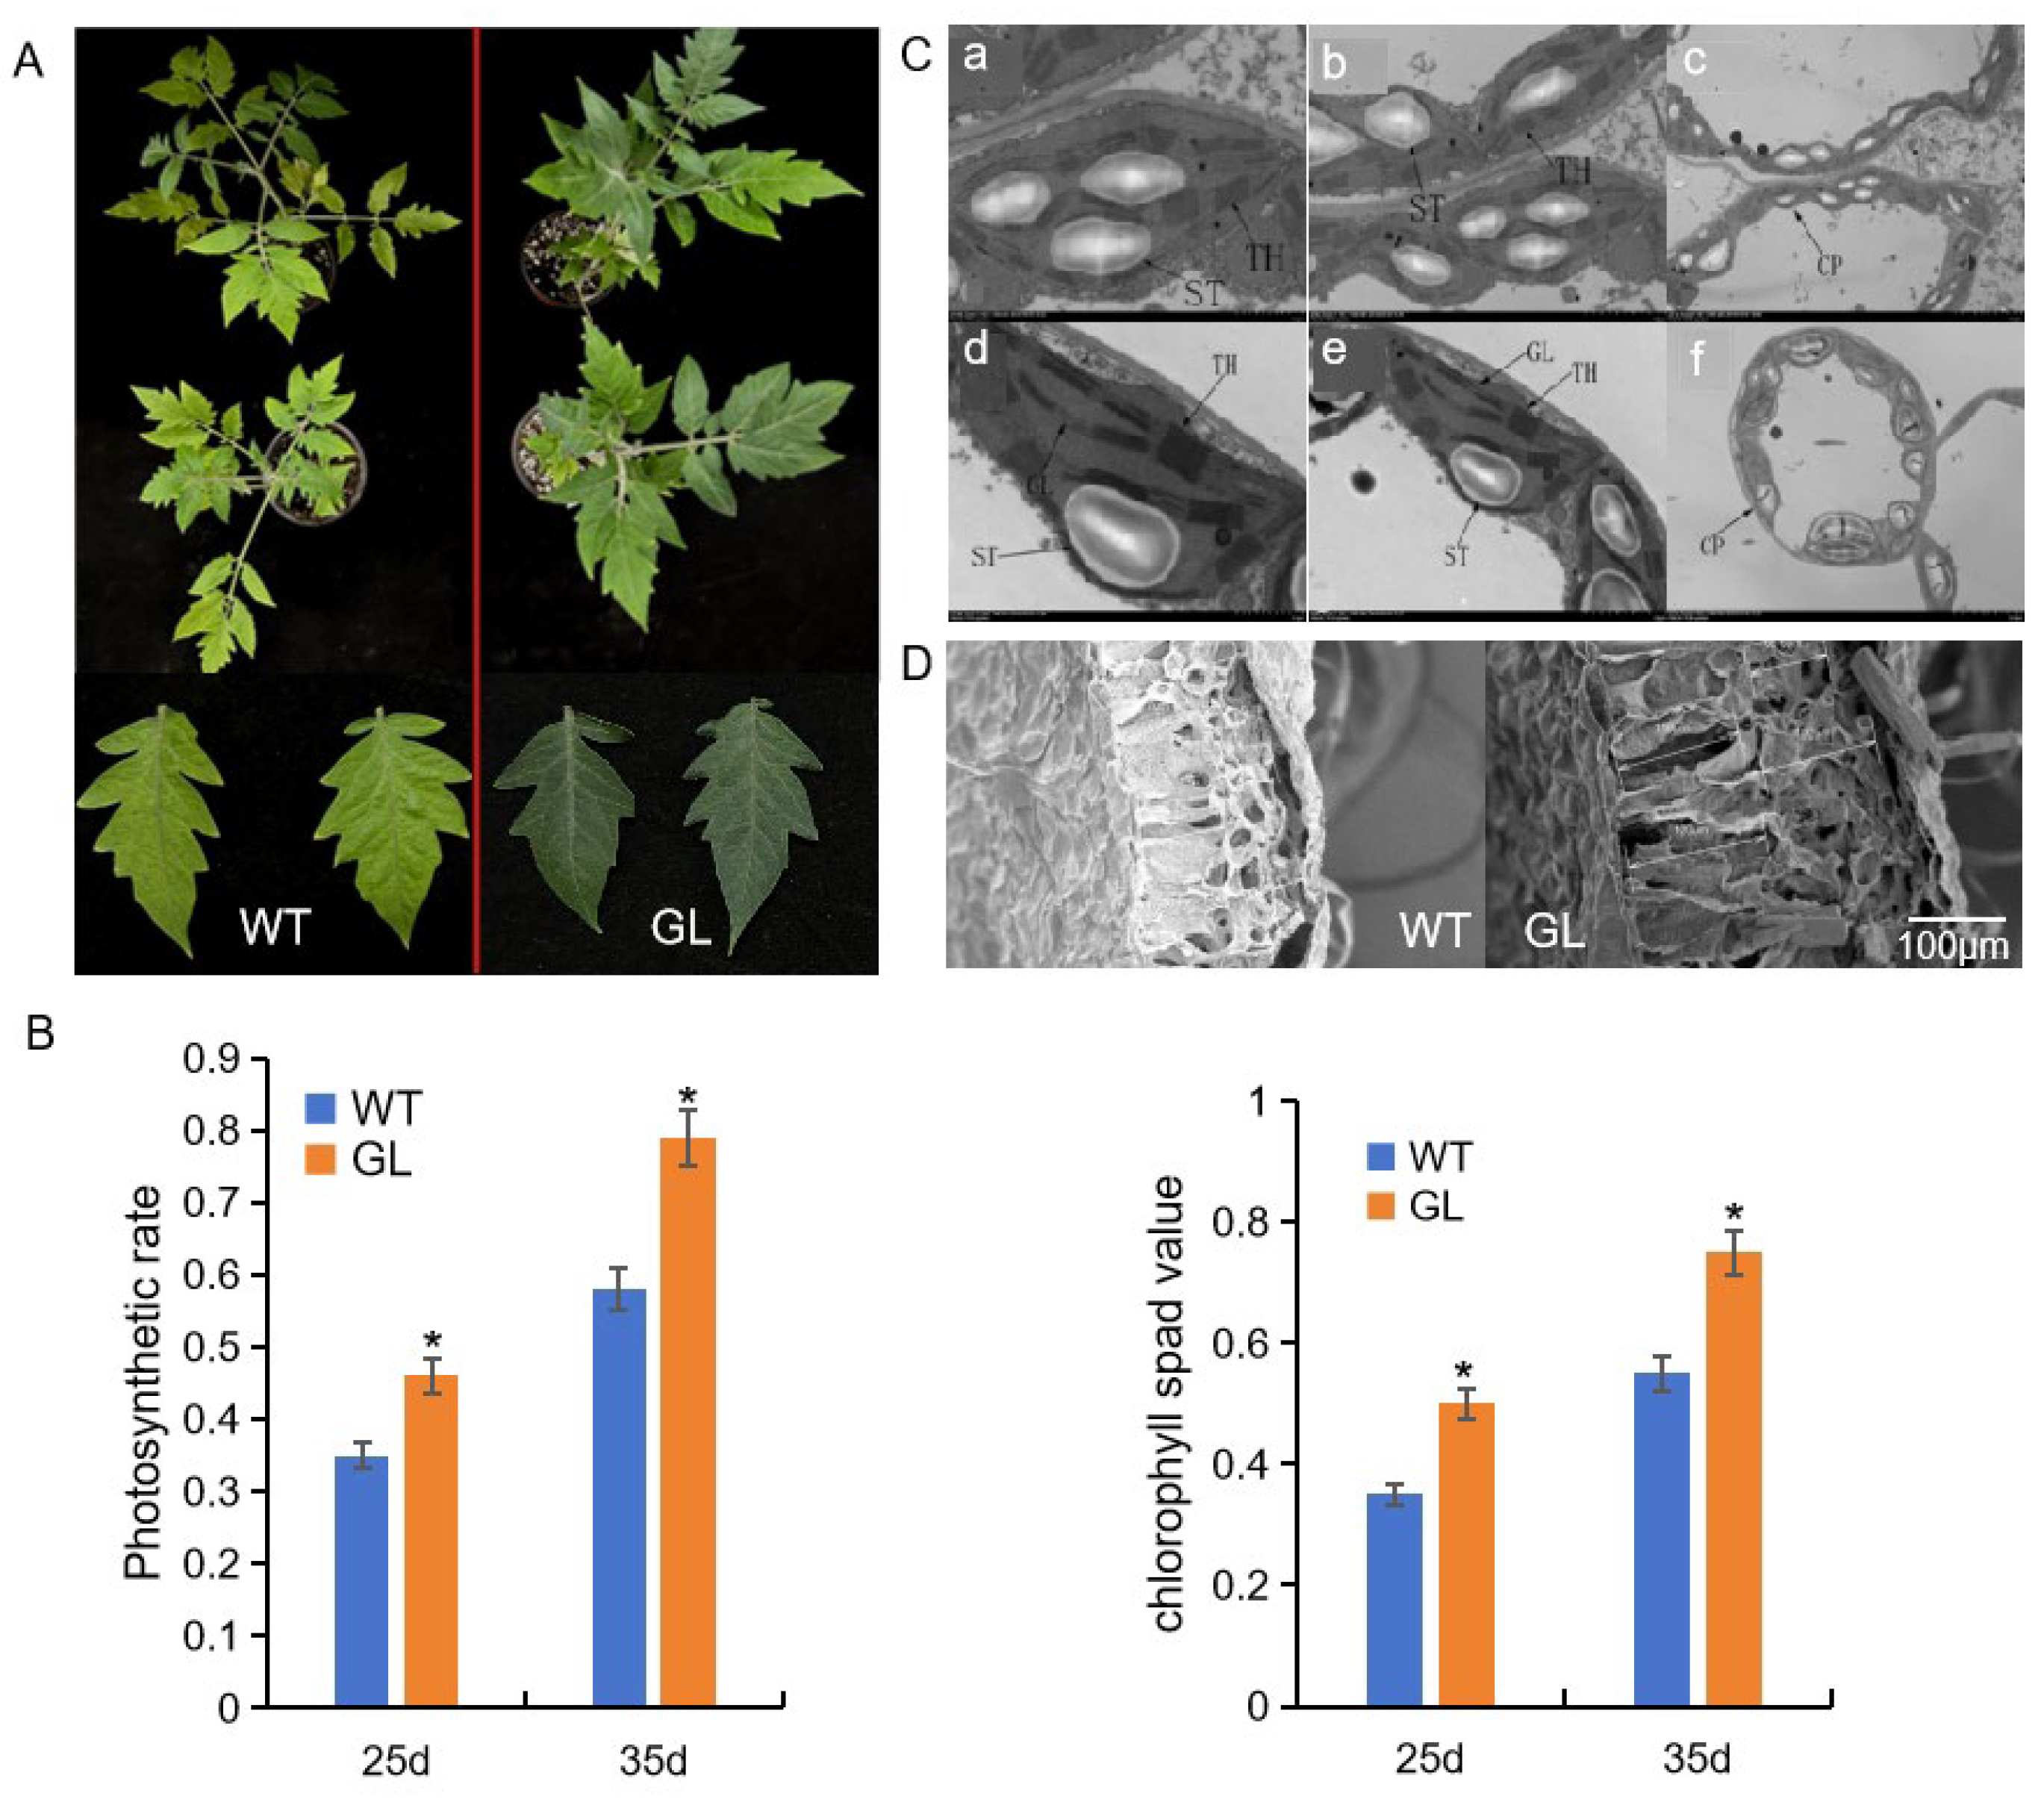
3.1. Phenotype, Physiological, and Microstructural Analyses

In this study, a stable dark green leaf (GL) mutant gene was isolated from yellow-leaf tomato material. Compared to those of the WT plants, the leaves of the GL plants were dark green (Figure 1A), had a greater chlorophyll content and had a higher photosynthetic rate (Figure 1B). Moreover, compared to those of the wild-type plants, the leaf mesophyll tissue of the GL plants was more developed, and the palisade tissue cells were more closely arranged (Figure 1C). The chloroplast ultrastructure in GL leaves was normal, the lamellae were clear, and the stroma and grana were orderly, with more stacking and larger starch grains (Figure 1(Ca–Cf)).

3.2. Total RNA Extraction and Quality Analysis

The RNA extraction and quality analysis were performed for all samples, with consistent results observed between the two sets of tomato samples. The total number of clean reads obtained after filtering was 40.62 Gb, of which the average clean bases in the control samples was 6.78 Gb and in the three GL samples was 6.76 Gb. Among the six sets of results, the percentage of quality control Q30 bases were more than 93.5%, indicating that the quality and accuracy of the sequencing data were high, which could meet the requirements of subsequent analysis (Table 1). To evaluate the correlation of gene expression among samples, Spearman correlation coefficients were calculated for all gene expression levels, and these coefficients are presented in the form of heatmaps (Figure 2). The coefficient between all six samples was greater than 0.9, indicating good correlation between the samples.

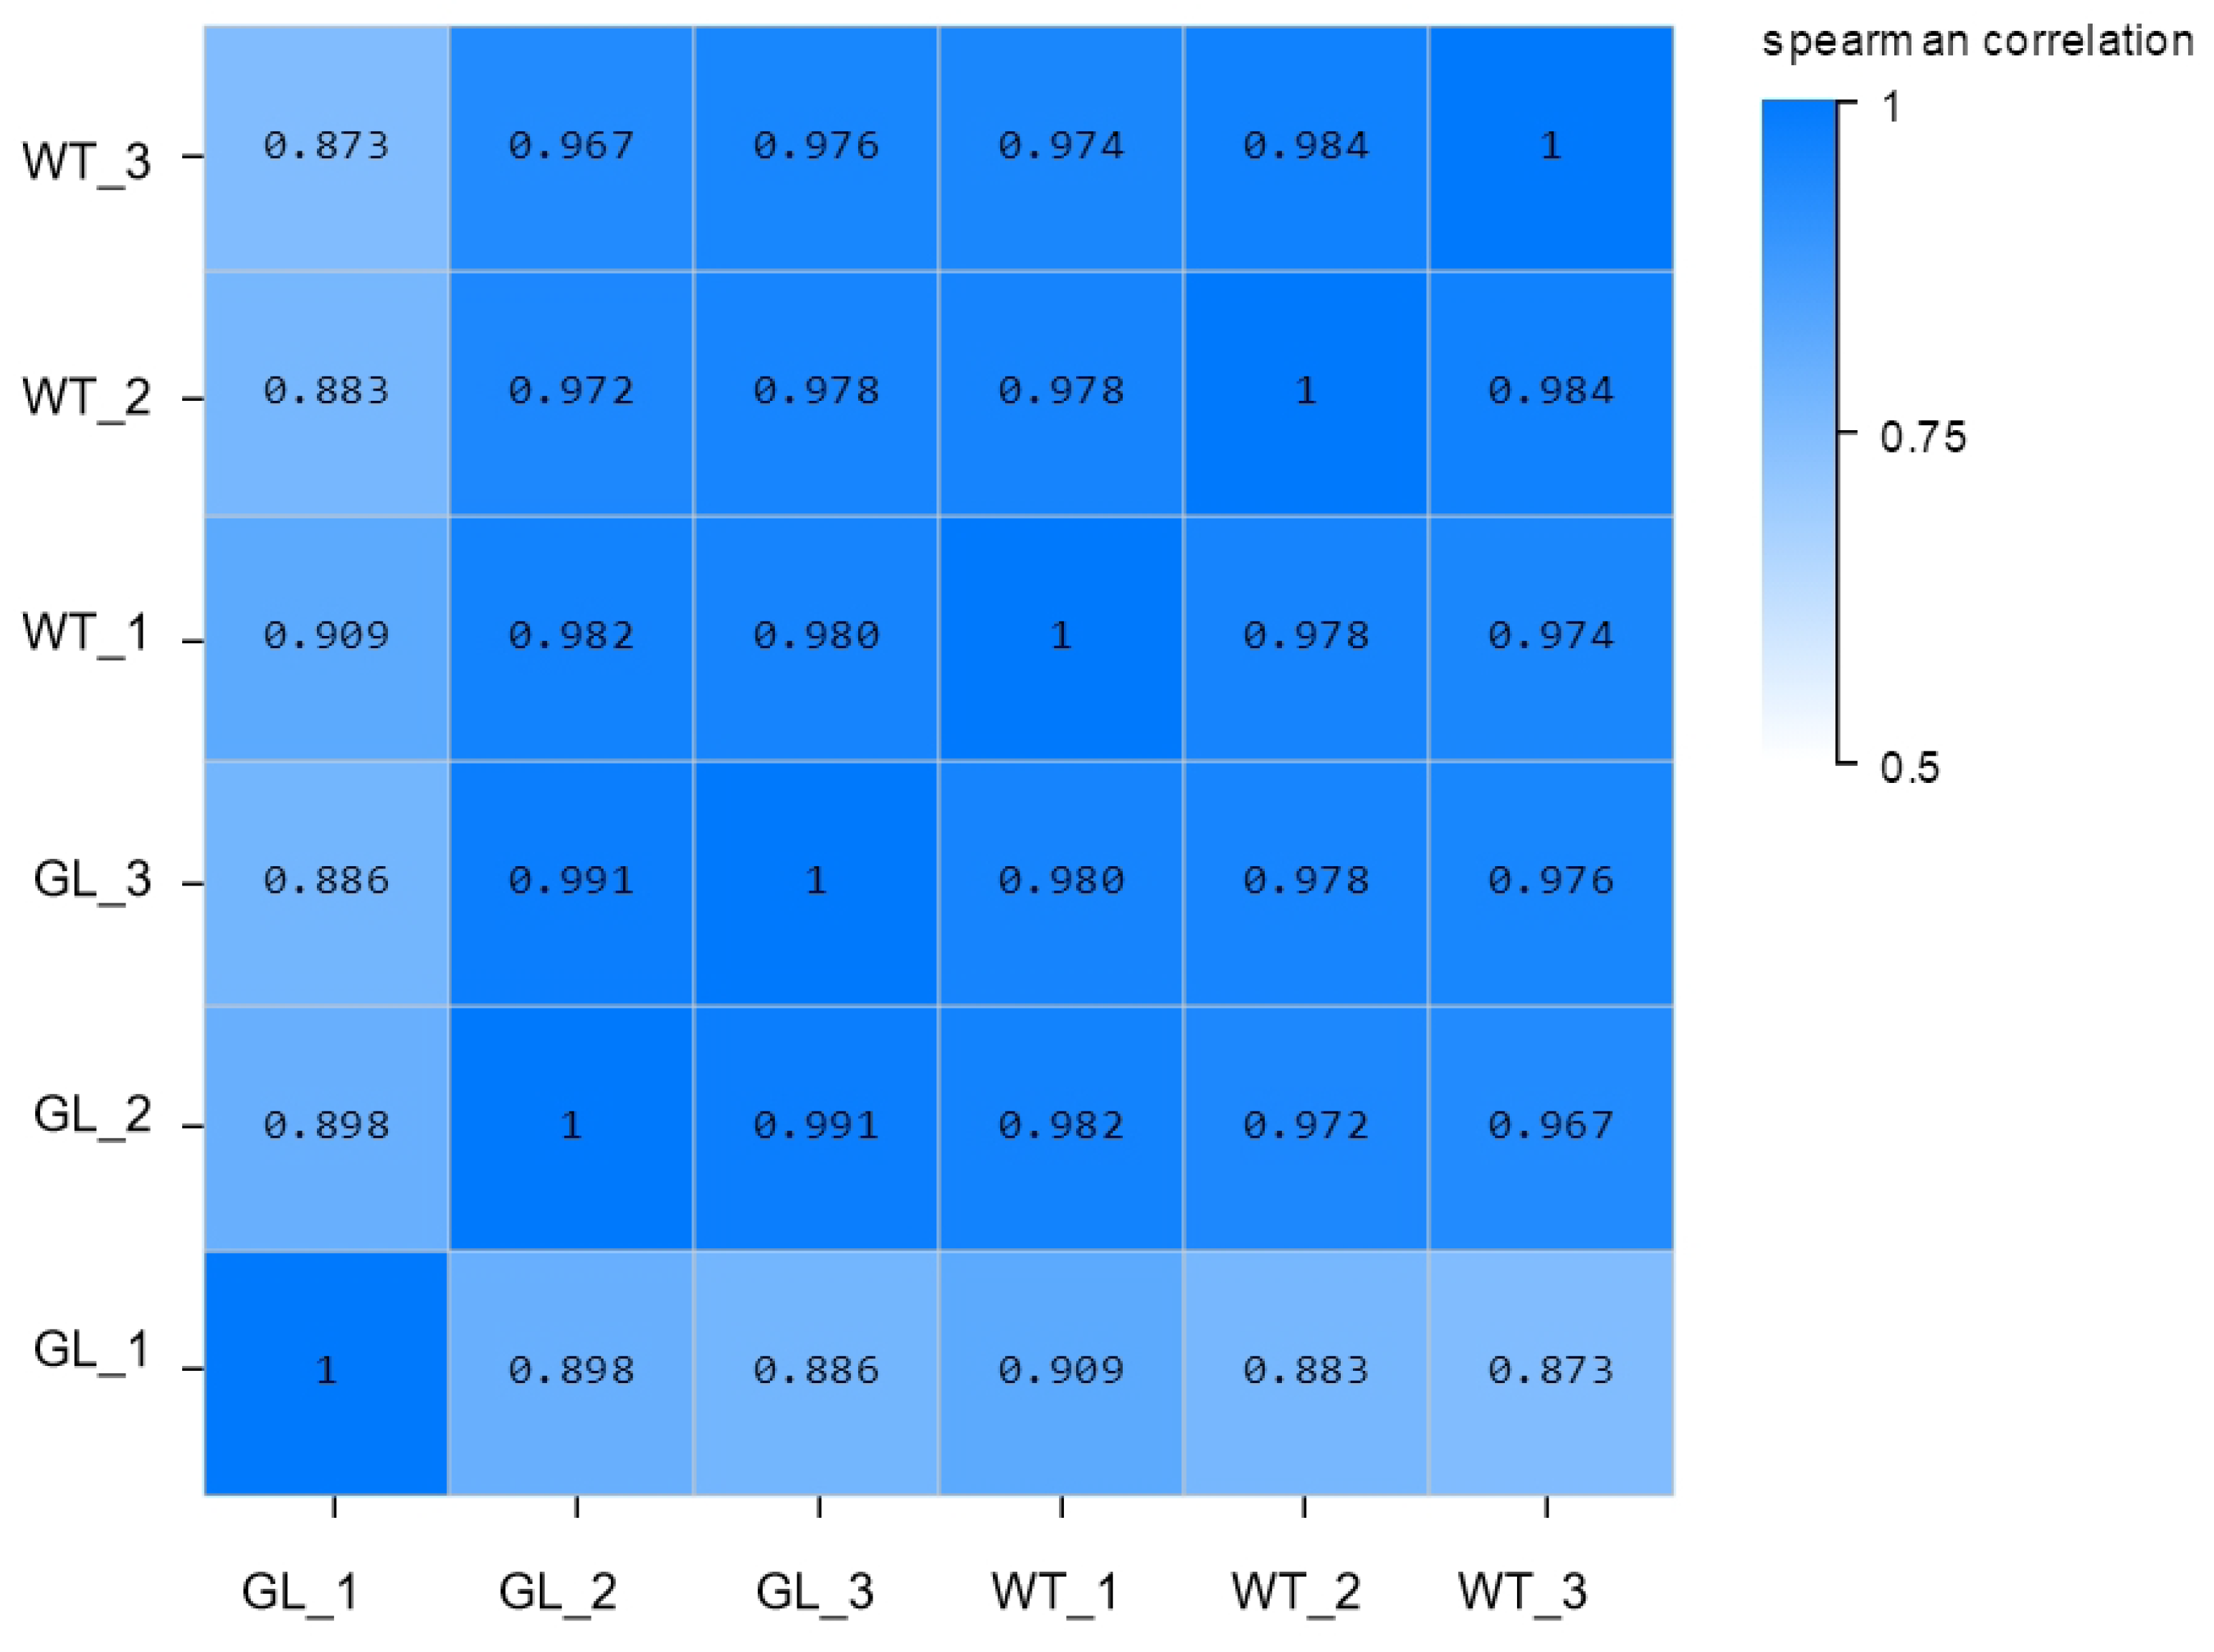
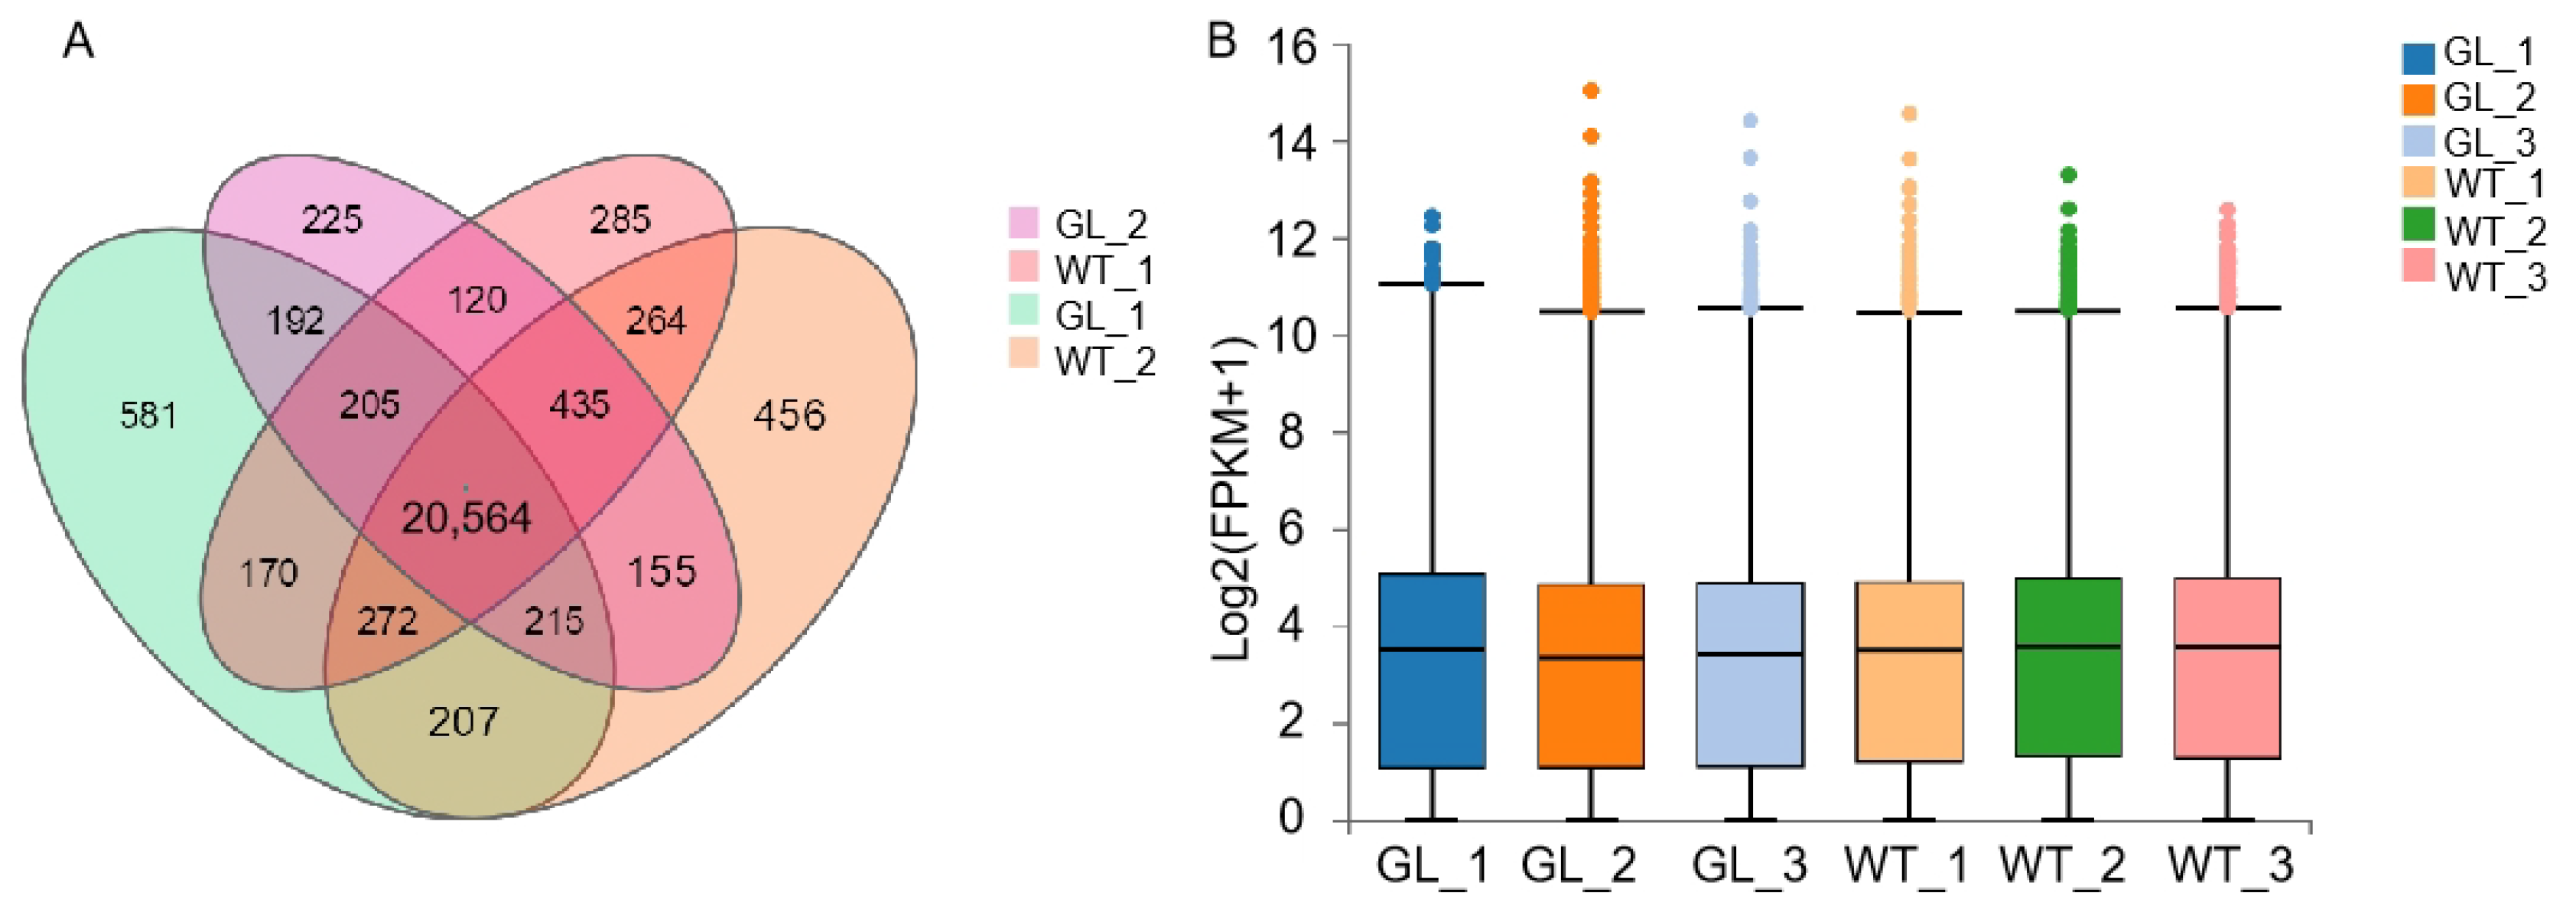
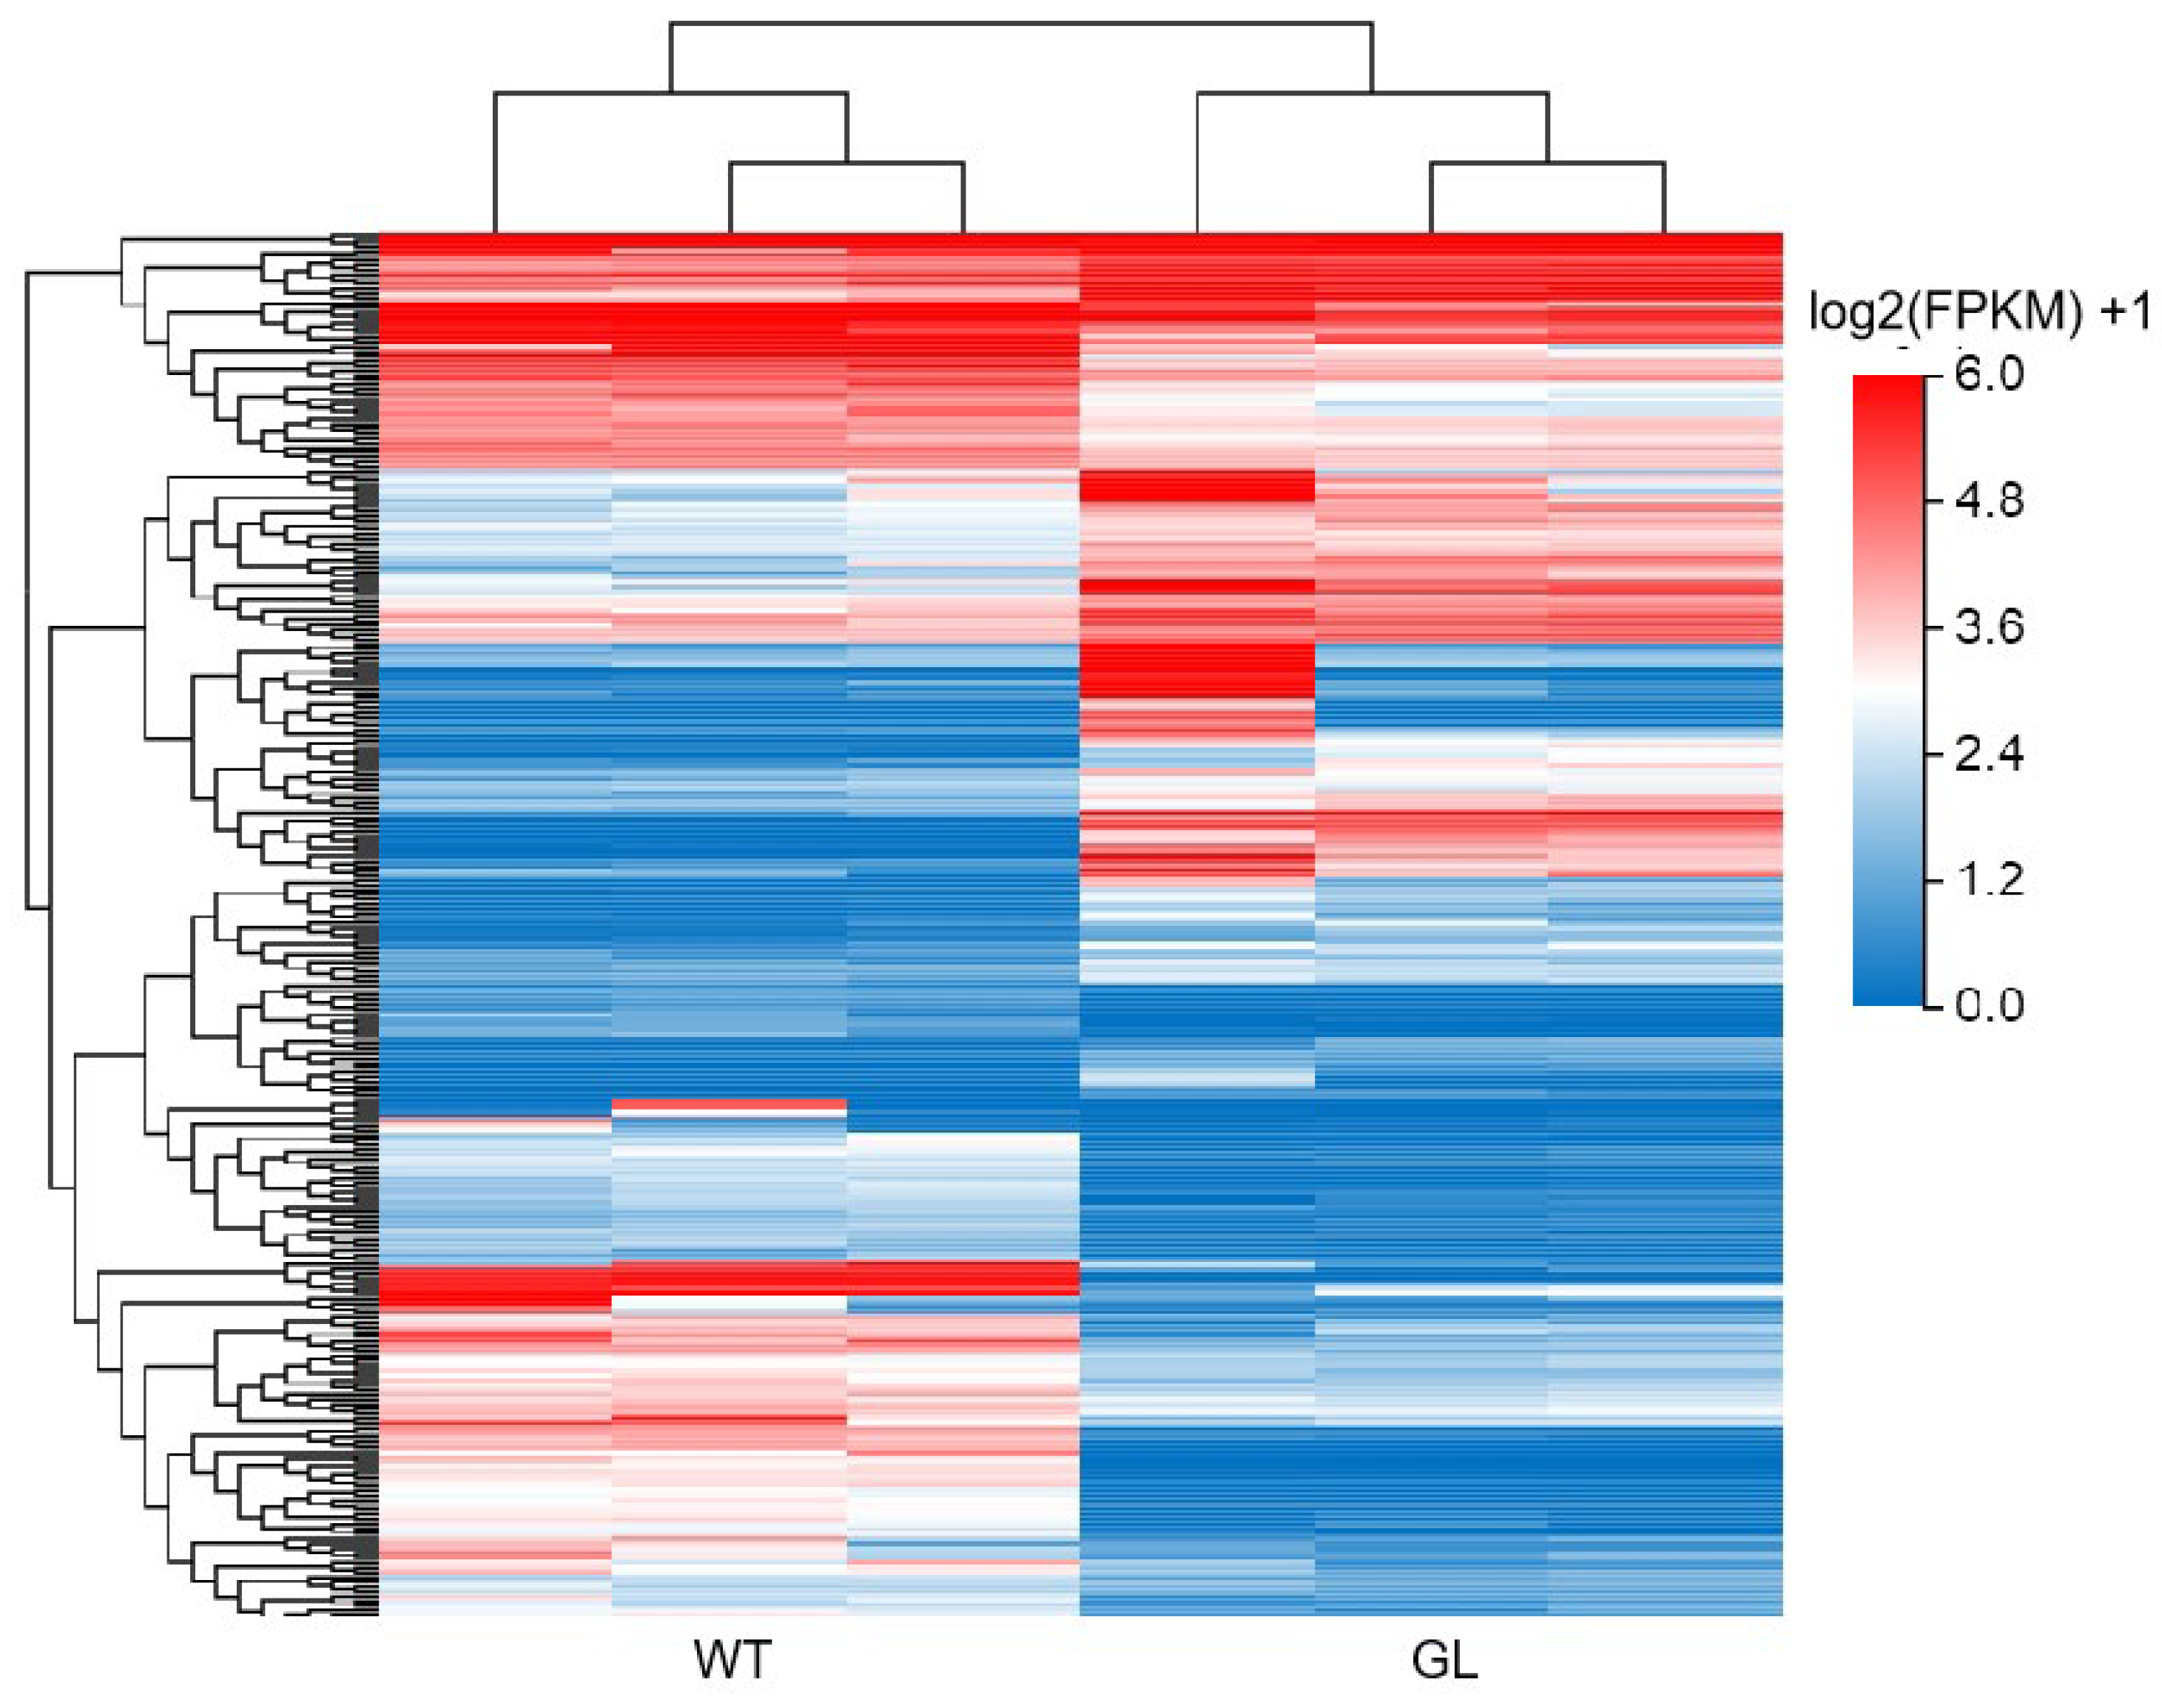
3.3. Gene Expression Analysis

A Venn diagram (Figure 3A) shows the total number of genes in the six samples. In addition, boxplots can be used to display the standardization effect among the data. As shown in Figure 3B, the overall gene expression levels were consistent among the six samples, resulting in a consistent distribution of the data. A differentially expressed gene cluster heatmap (Q value ≤ 0.05, |log2FPKM| ≥ 1) was constructed to illustrate the number of upregulated/downregulated DEGs between the GL and WT plants (Figure 4). There was a total of 292 DEGs identified, of which 131 genes were upregulated and 161 genes were downregulated.

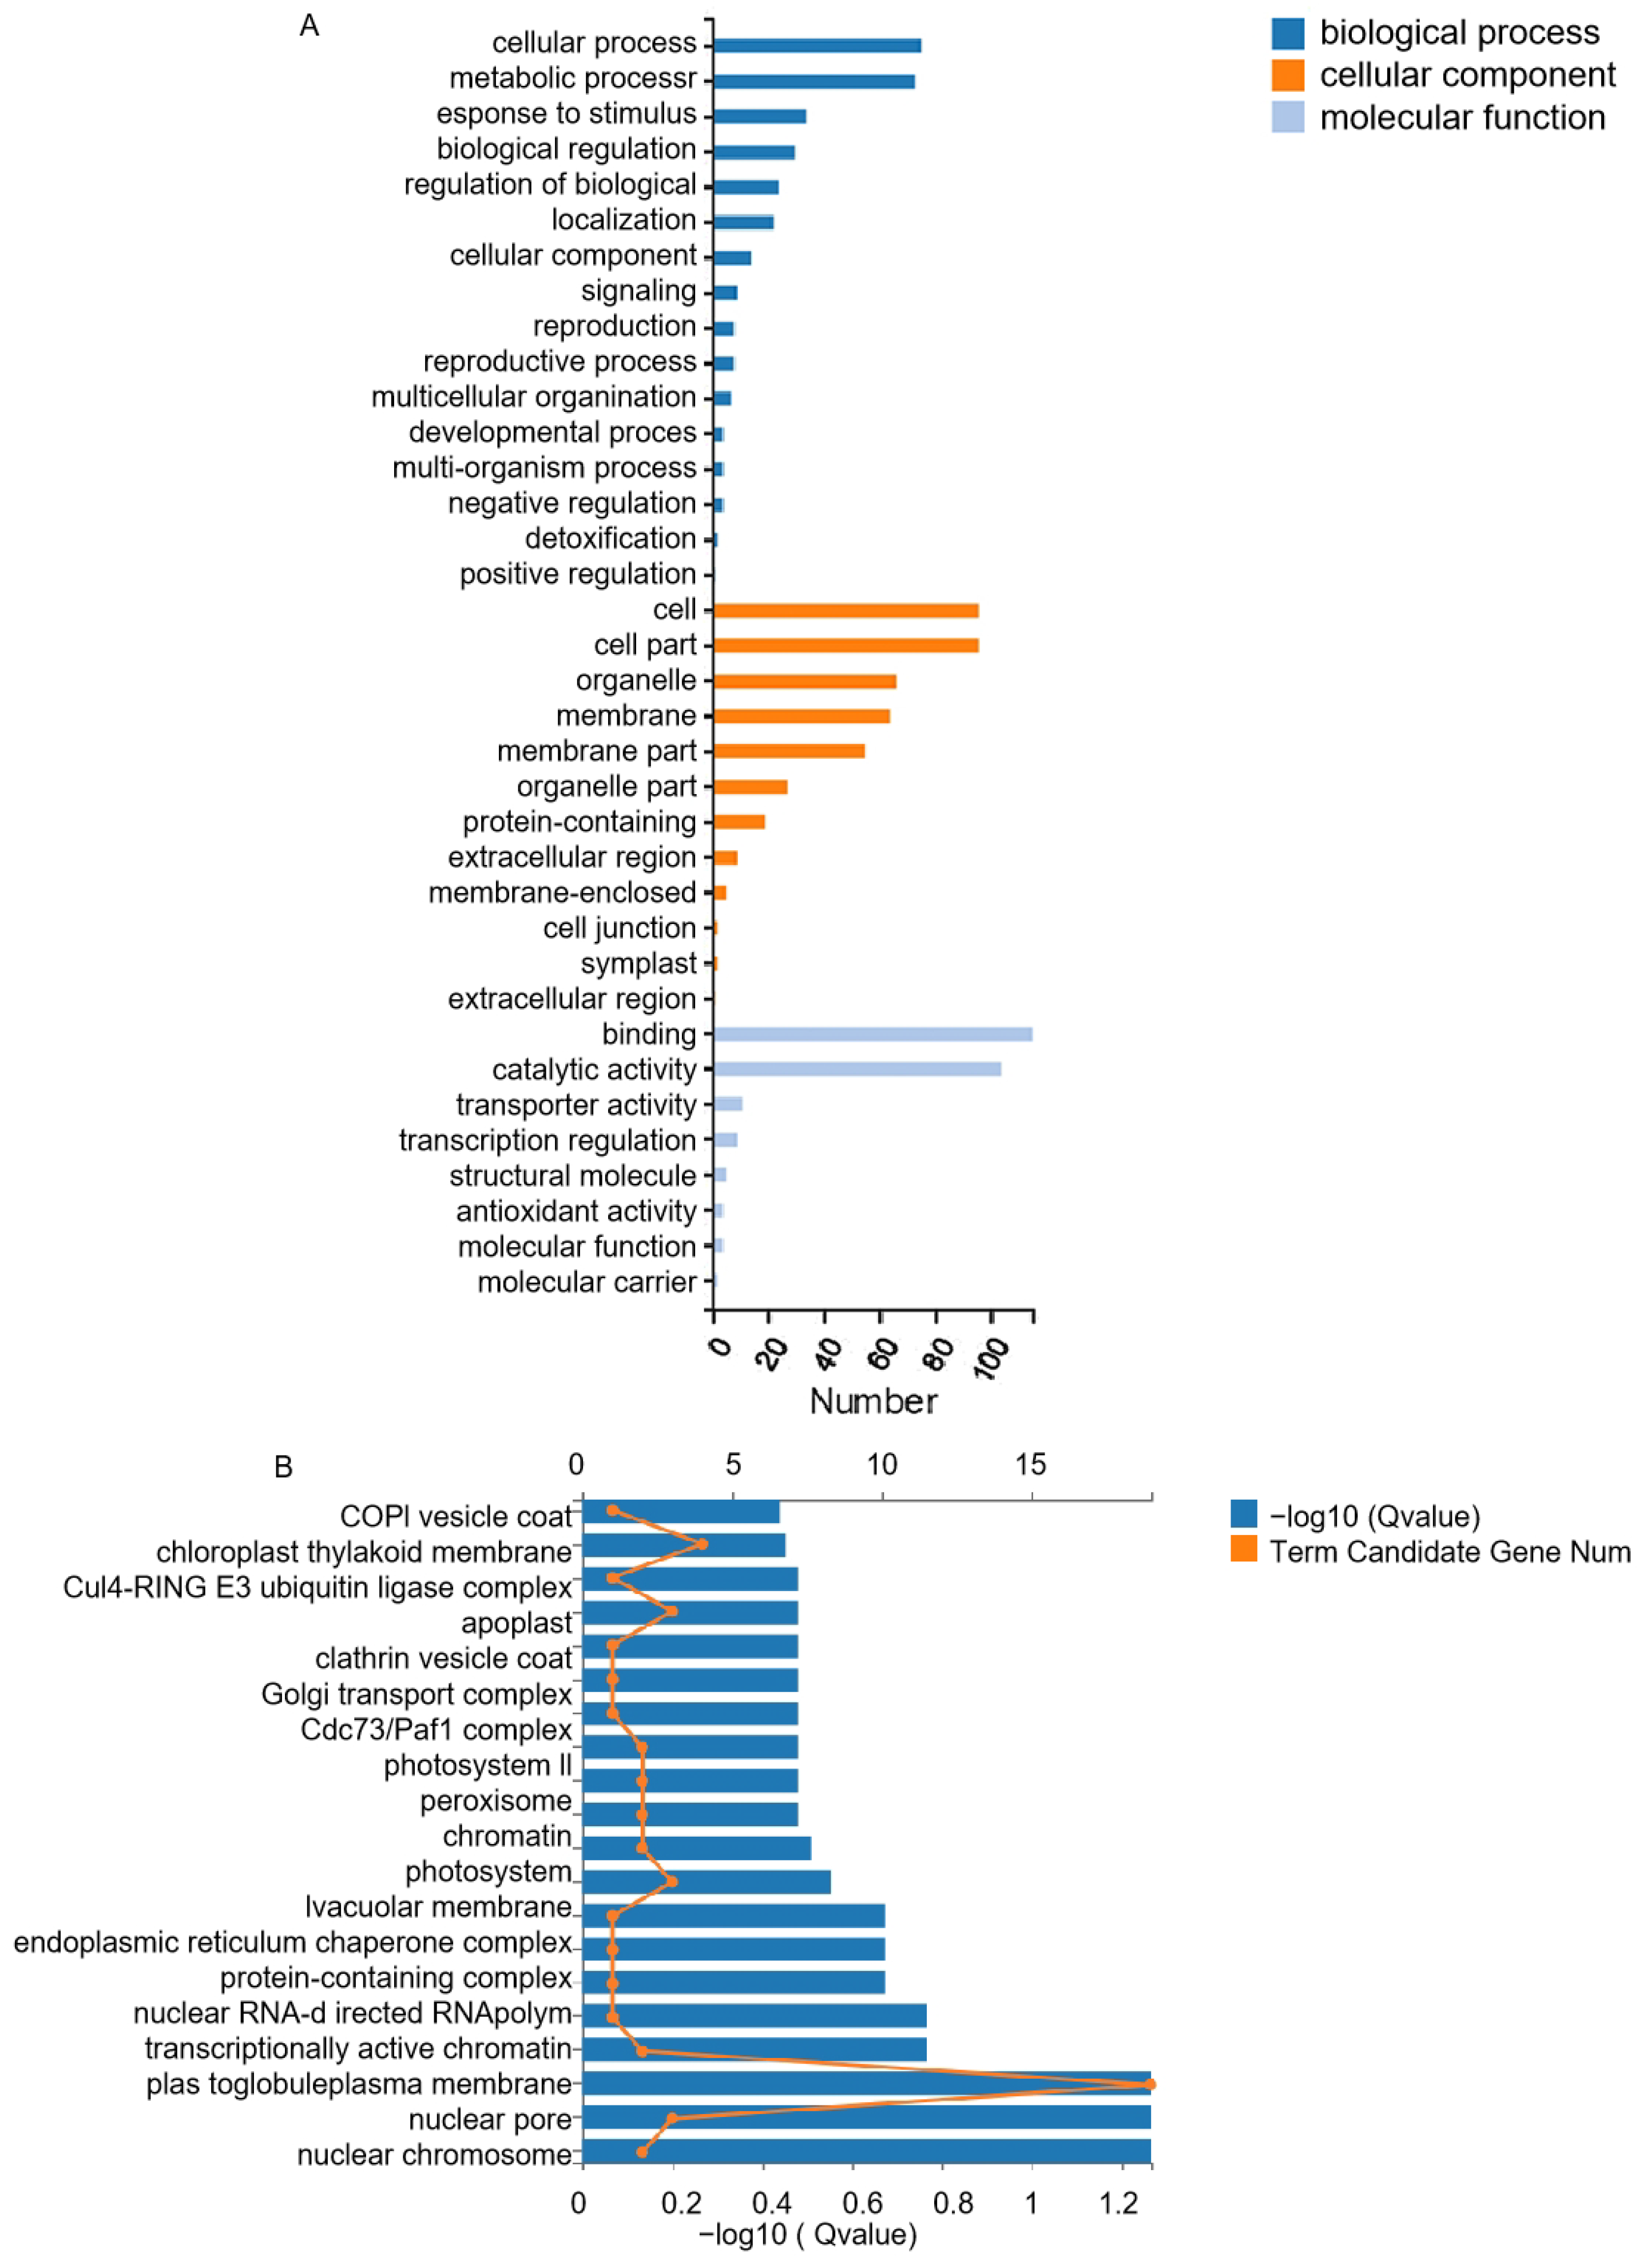
3.4. GO Analysis of DEGs

To identify the DEGs related to photosynthesis in tomatoes, a GO enrichment analysis was performed and the results showed that the genes associated with the cellular process and metabolic process were the most significantly enriched according to the biological process classification between the WT and the dark green leaf (GL) mutants (Figure 5A). In the analysis of the cellular components, differentially expressed genes (DEGs) were mainly enriched in the extracellular matrix, organelles, and membranes. These genes were significantly enriched in molecular functional categories related to catalytic activity and binding. In addition, the chloroplast thylakoid membrane, the Golgi transport complex, photosystem II, and photosystem I were identified among the enriched DEGs according to the GO cellular component analysis (Figure 5B).

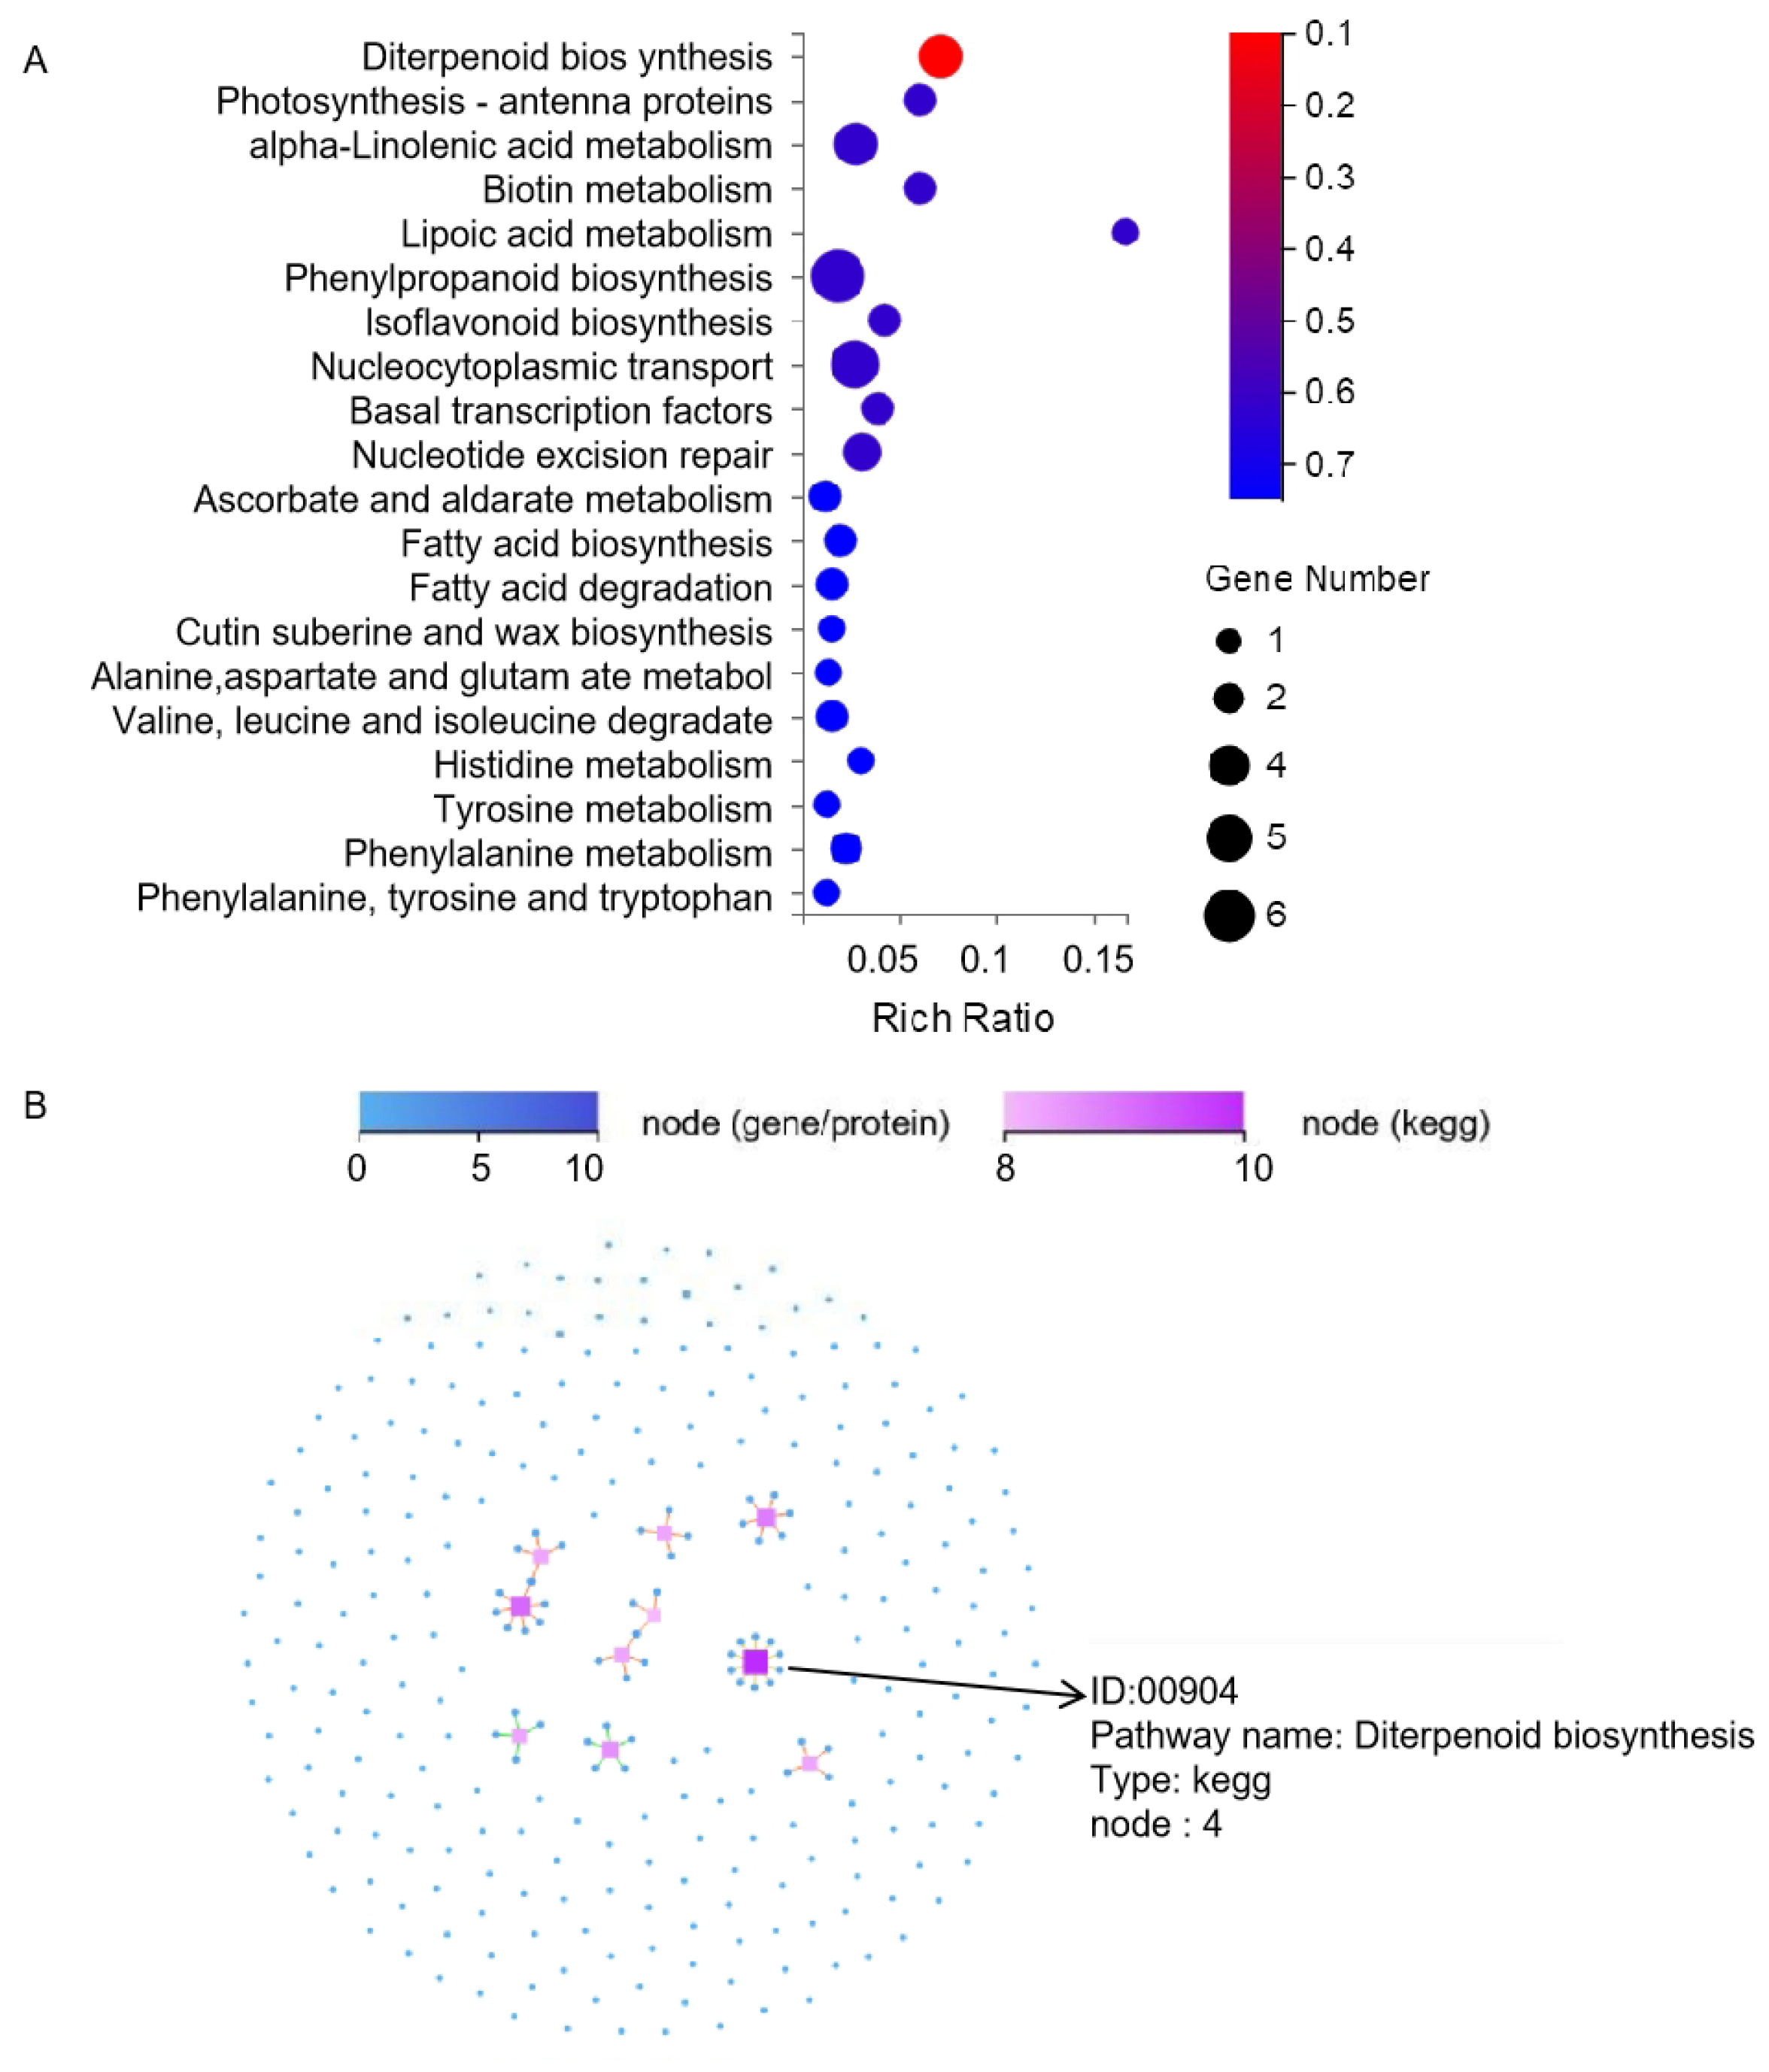
3.5. KEGG Analysis of DEGs

To further screen the DEGs in photosynthesis, a KEGG enrichment of the DEGs was analyzed based on the KEGG database. DEGs between GL and WT were enriched in 20 pathways, which were mainly involved in diterpenoid biosynthesis, photosynthesis of antenna proteins, alpha-linolenic acid metabolism, biotin metabolism, and lipoic acid metabolism (Figure 6A). Five DEGs were enriched in photosynthesis-antenna proteins, the most common among all pathways. The KEGG pathway relationship network was constructed based on the 10 pathways with the largest number of genes (Figure 6B). Different shapes represent different contents: squares represent KEGG pathways, dots represent mRNA, etc. The color and size indicate the number of genes or transcripts connected to the node. In the present pathway, the two differentially expressed genes, Solyc08g067330 and Solyc02g071030, were also shown to be enriched with photosynthesis-antenna proteins.

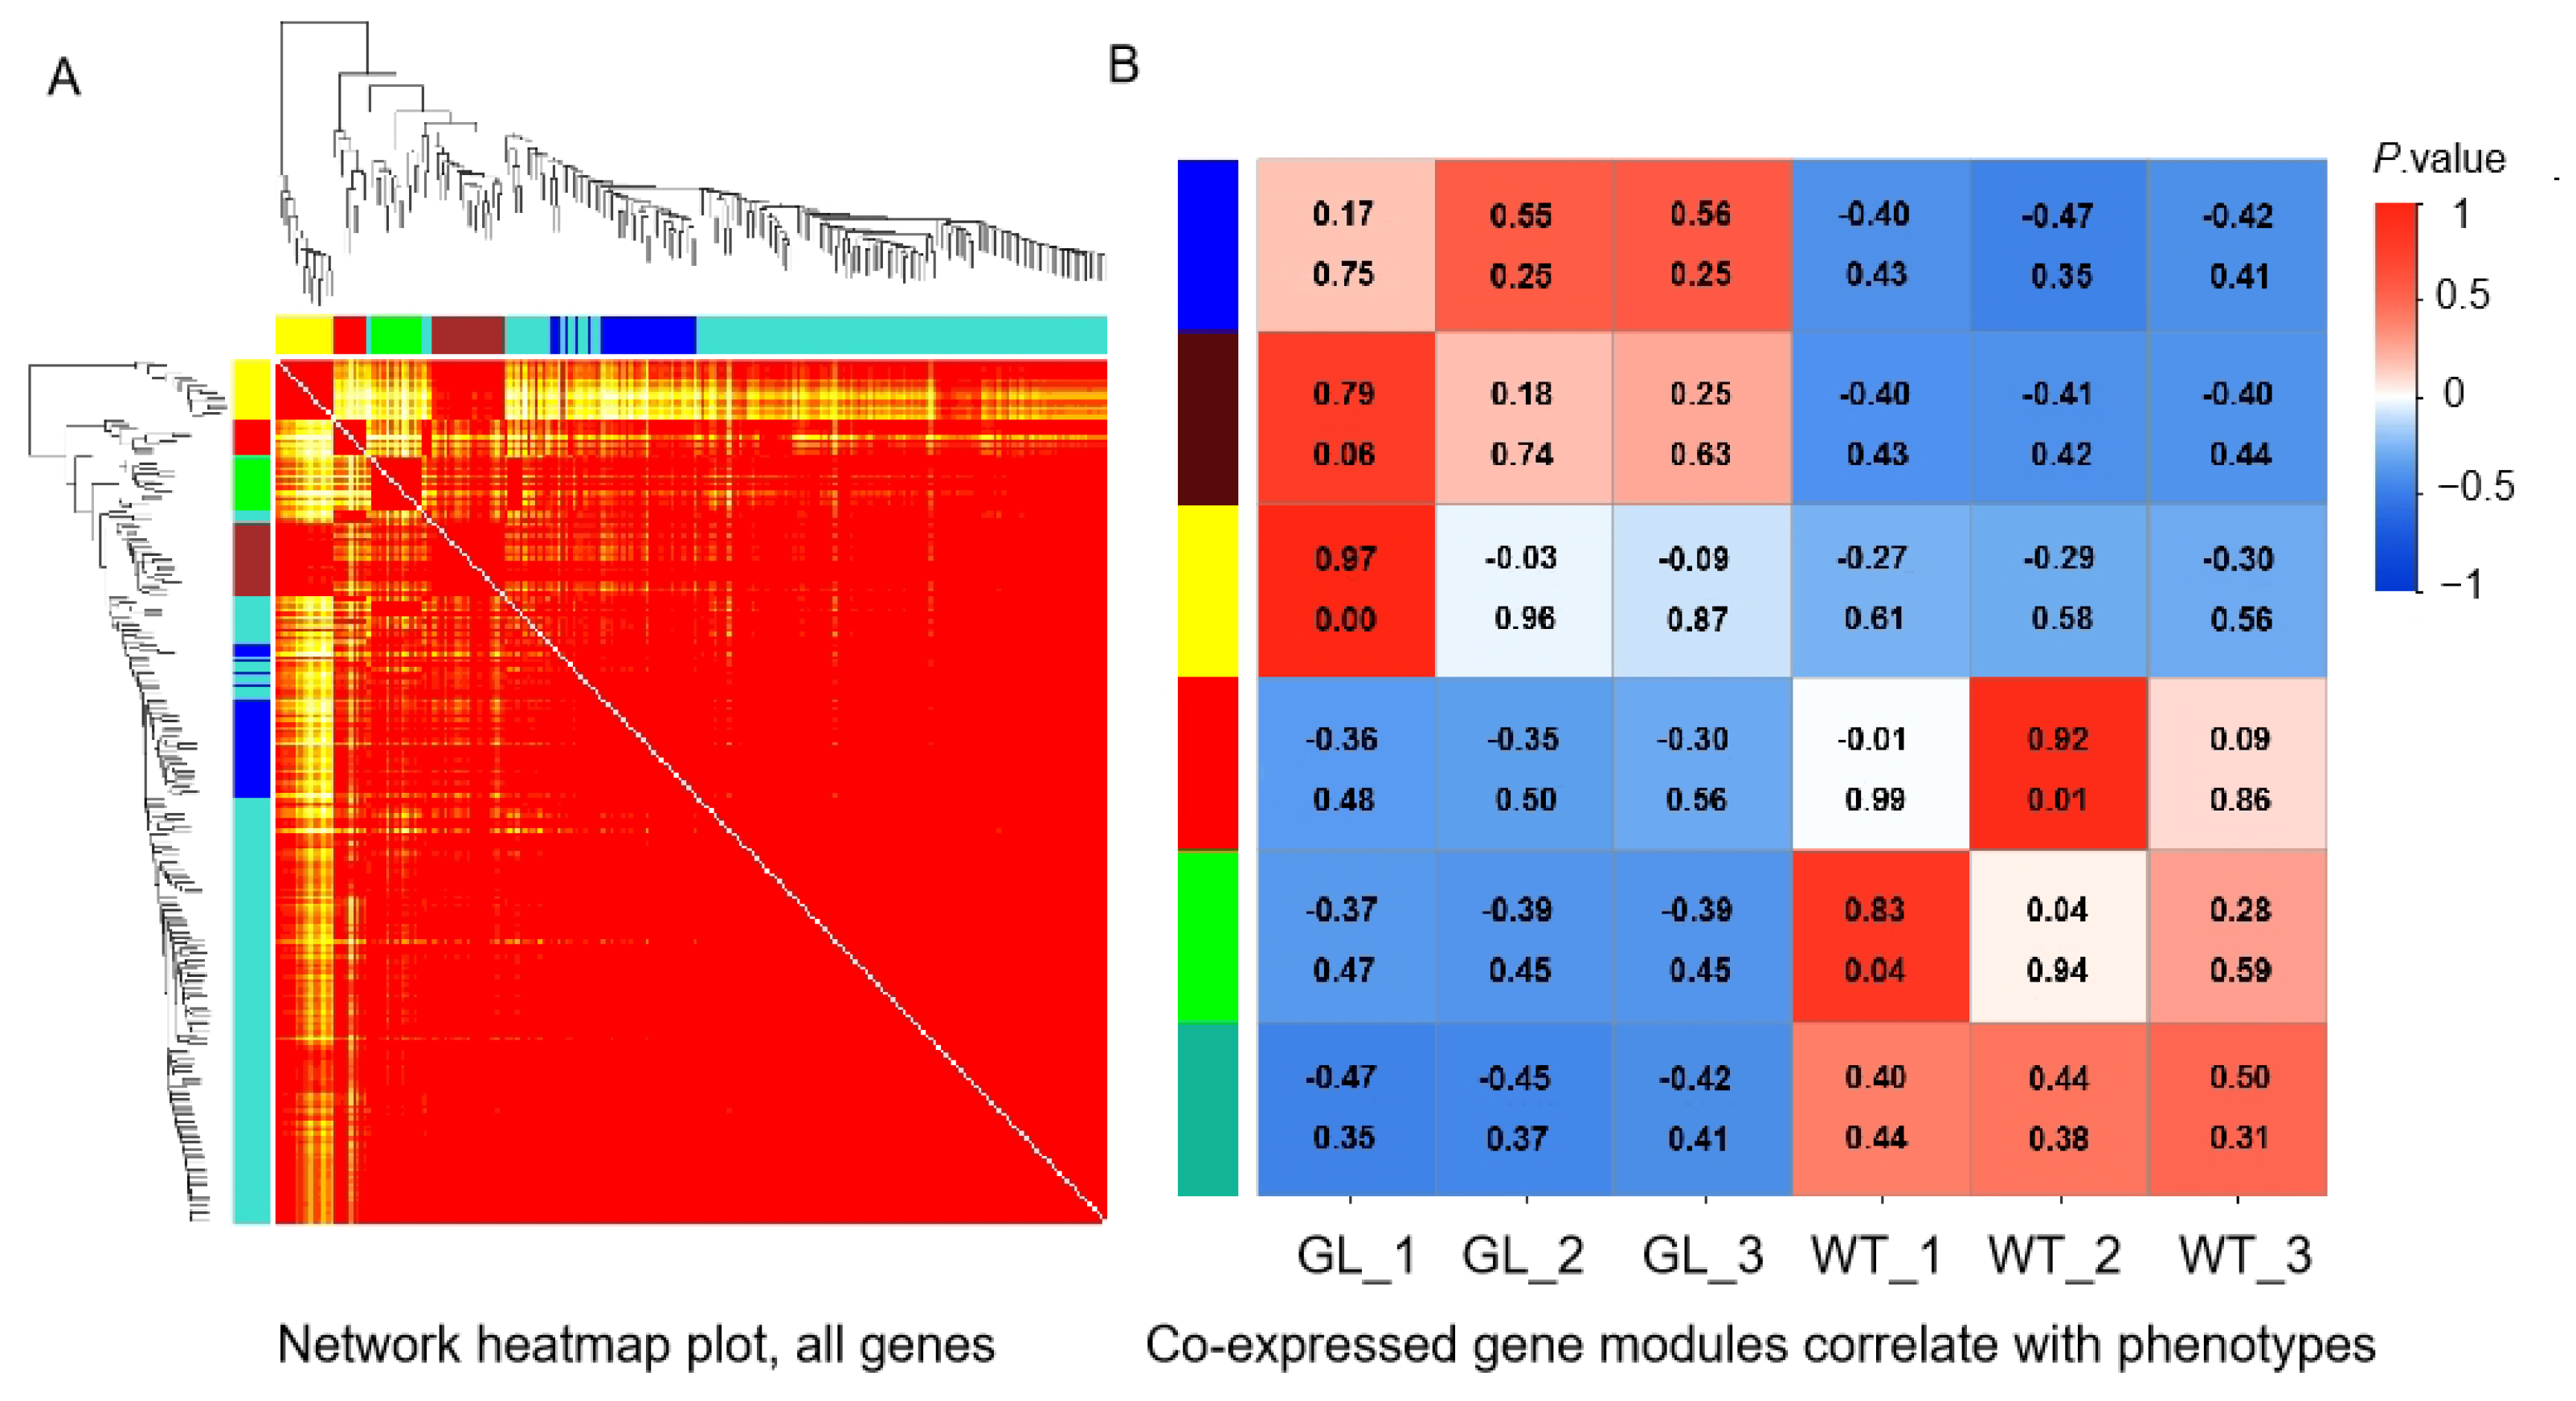
3.6. Weighted Gene Coexpression Network Analysis of (WGCNA) DEGs

WGCNA is a tool suitable for the analysis of various complex data. WGCNA was performed on the transcriptome data of the GL and WT sample groups (Figure 7). A gene clustering dendrogram with module identity (Figure 7A) and a heatmap of coexpressed module–sample correlations (Figure 7B) are presented. Observing the correlation coefficients of the modules, the results indicated that the genes in the green module showed a high specificity between GL and WT samples. A KEGG enrichment analysis of genes in the turquoise module revealed that genes were enriched in diterpenoid biosynthesis, photosynthesis antenna proteins, and other pathways (Figure 7A).

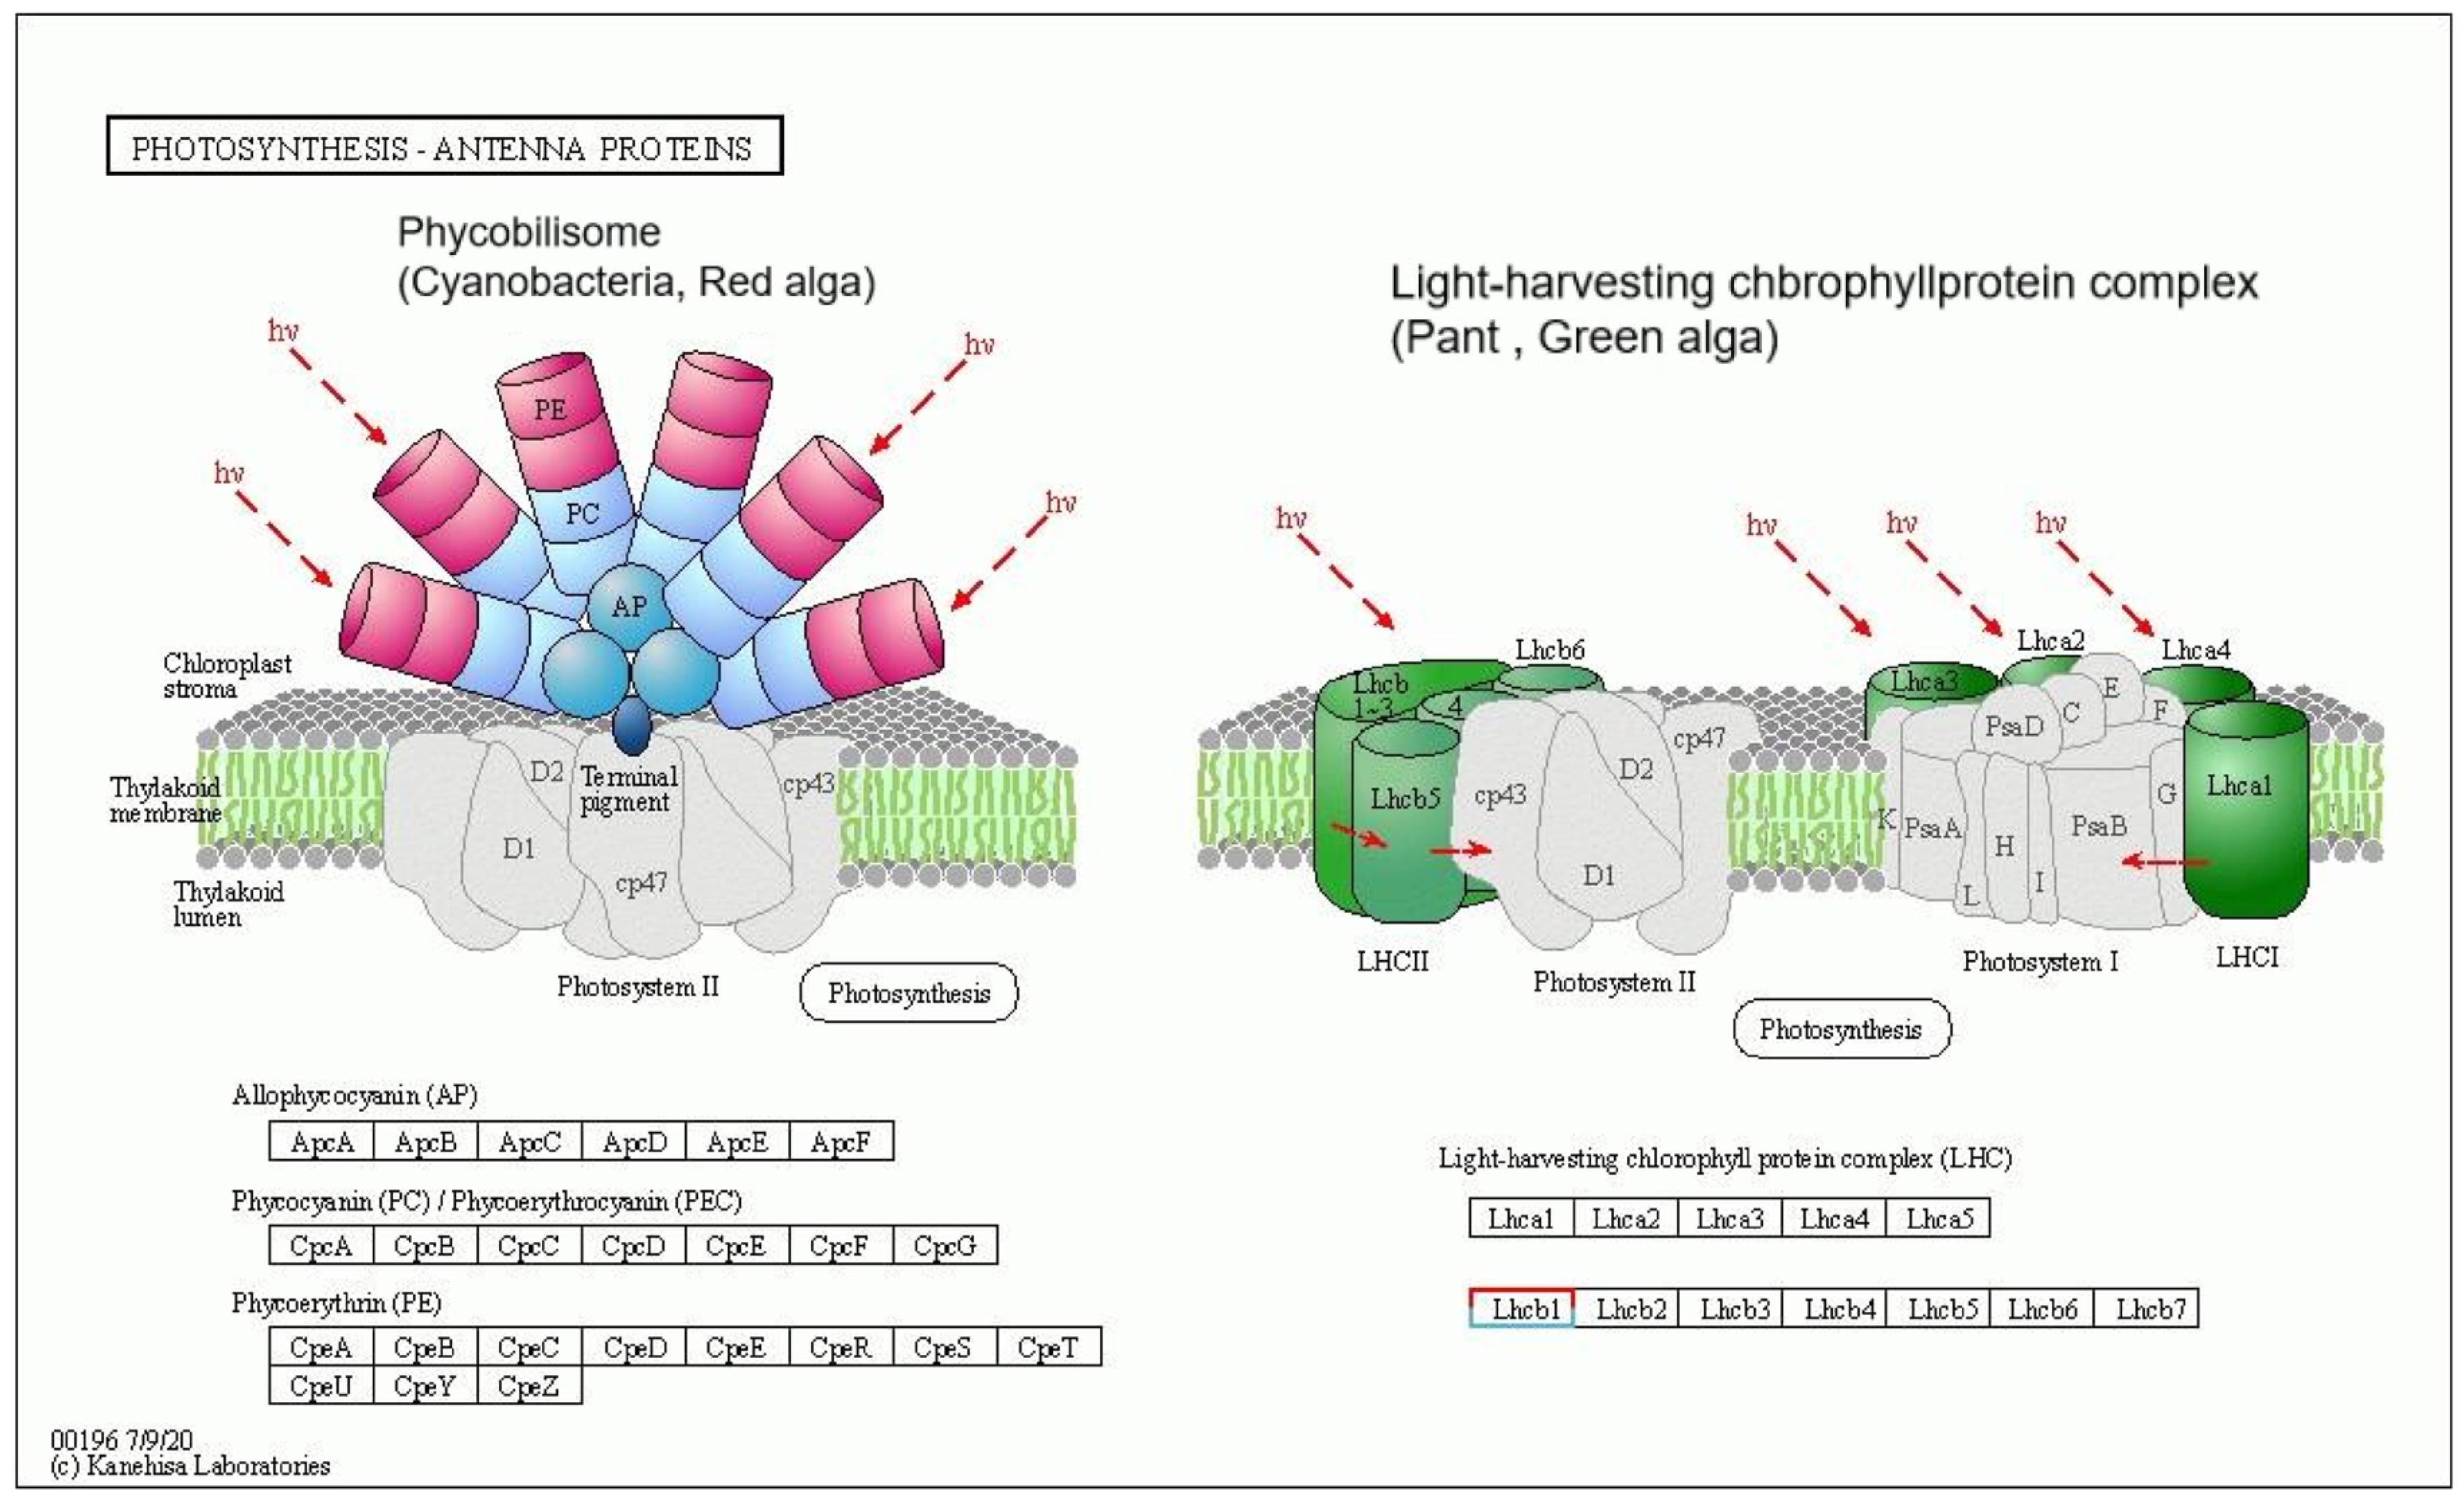
3.7. Network Analysis of Photosynthesis Antenna Proteins

Two DEGs, Solyc08g067330 and Solyc02g071030, were enriched in the photosynthesis-antenna protein pathway (Figure 8). The results showed that Solyc02g071030 was significantly upregulated, while Solyc08g067330 was significantly downregulated. The two genes are both chlorophyll a/b binding proteins (LHCB1), which are a class of thylakoid membrane proteins that can bind with pigment molecules to form complexes and transfer light energy to the reaction centers of photosystems (PSI and PSII). Therefore, the Solyc02g071030 may play the key role in PSI/PSI antenna remodeling during a state transition as shown in Figure 8.

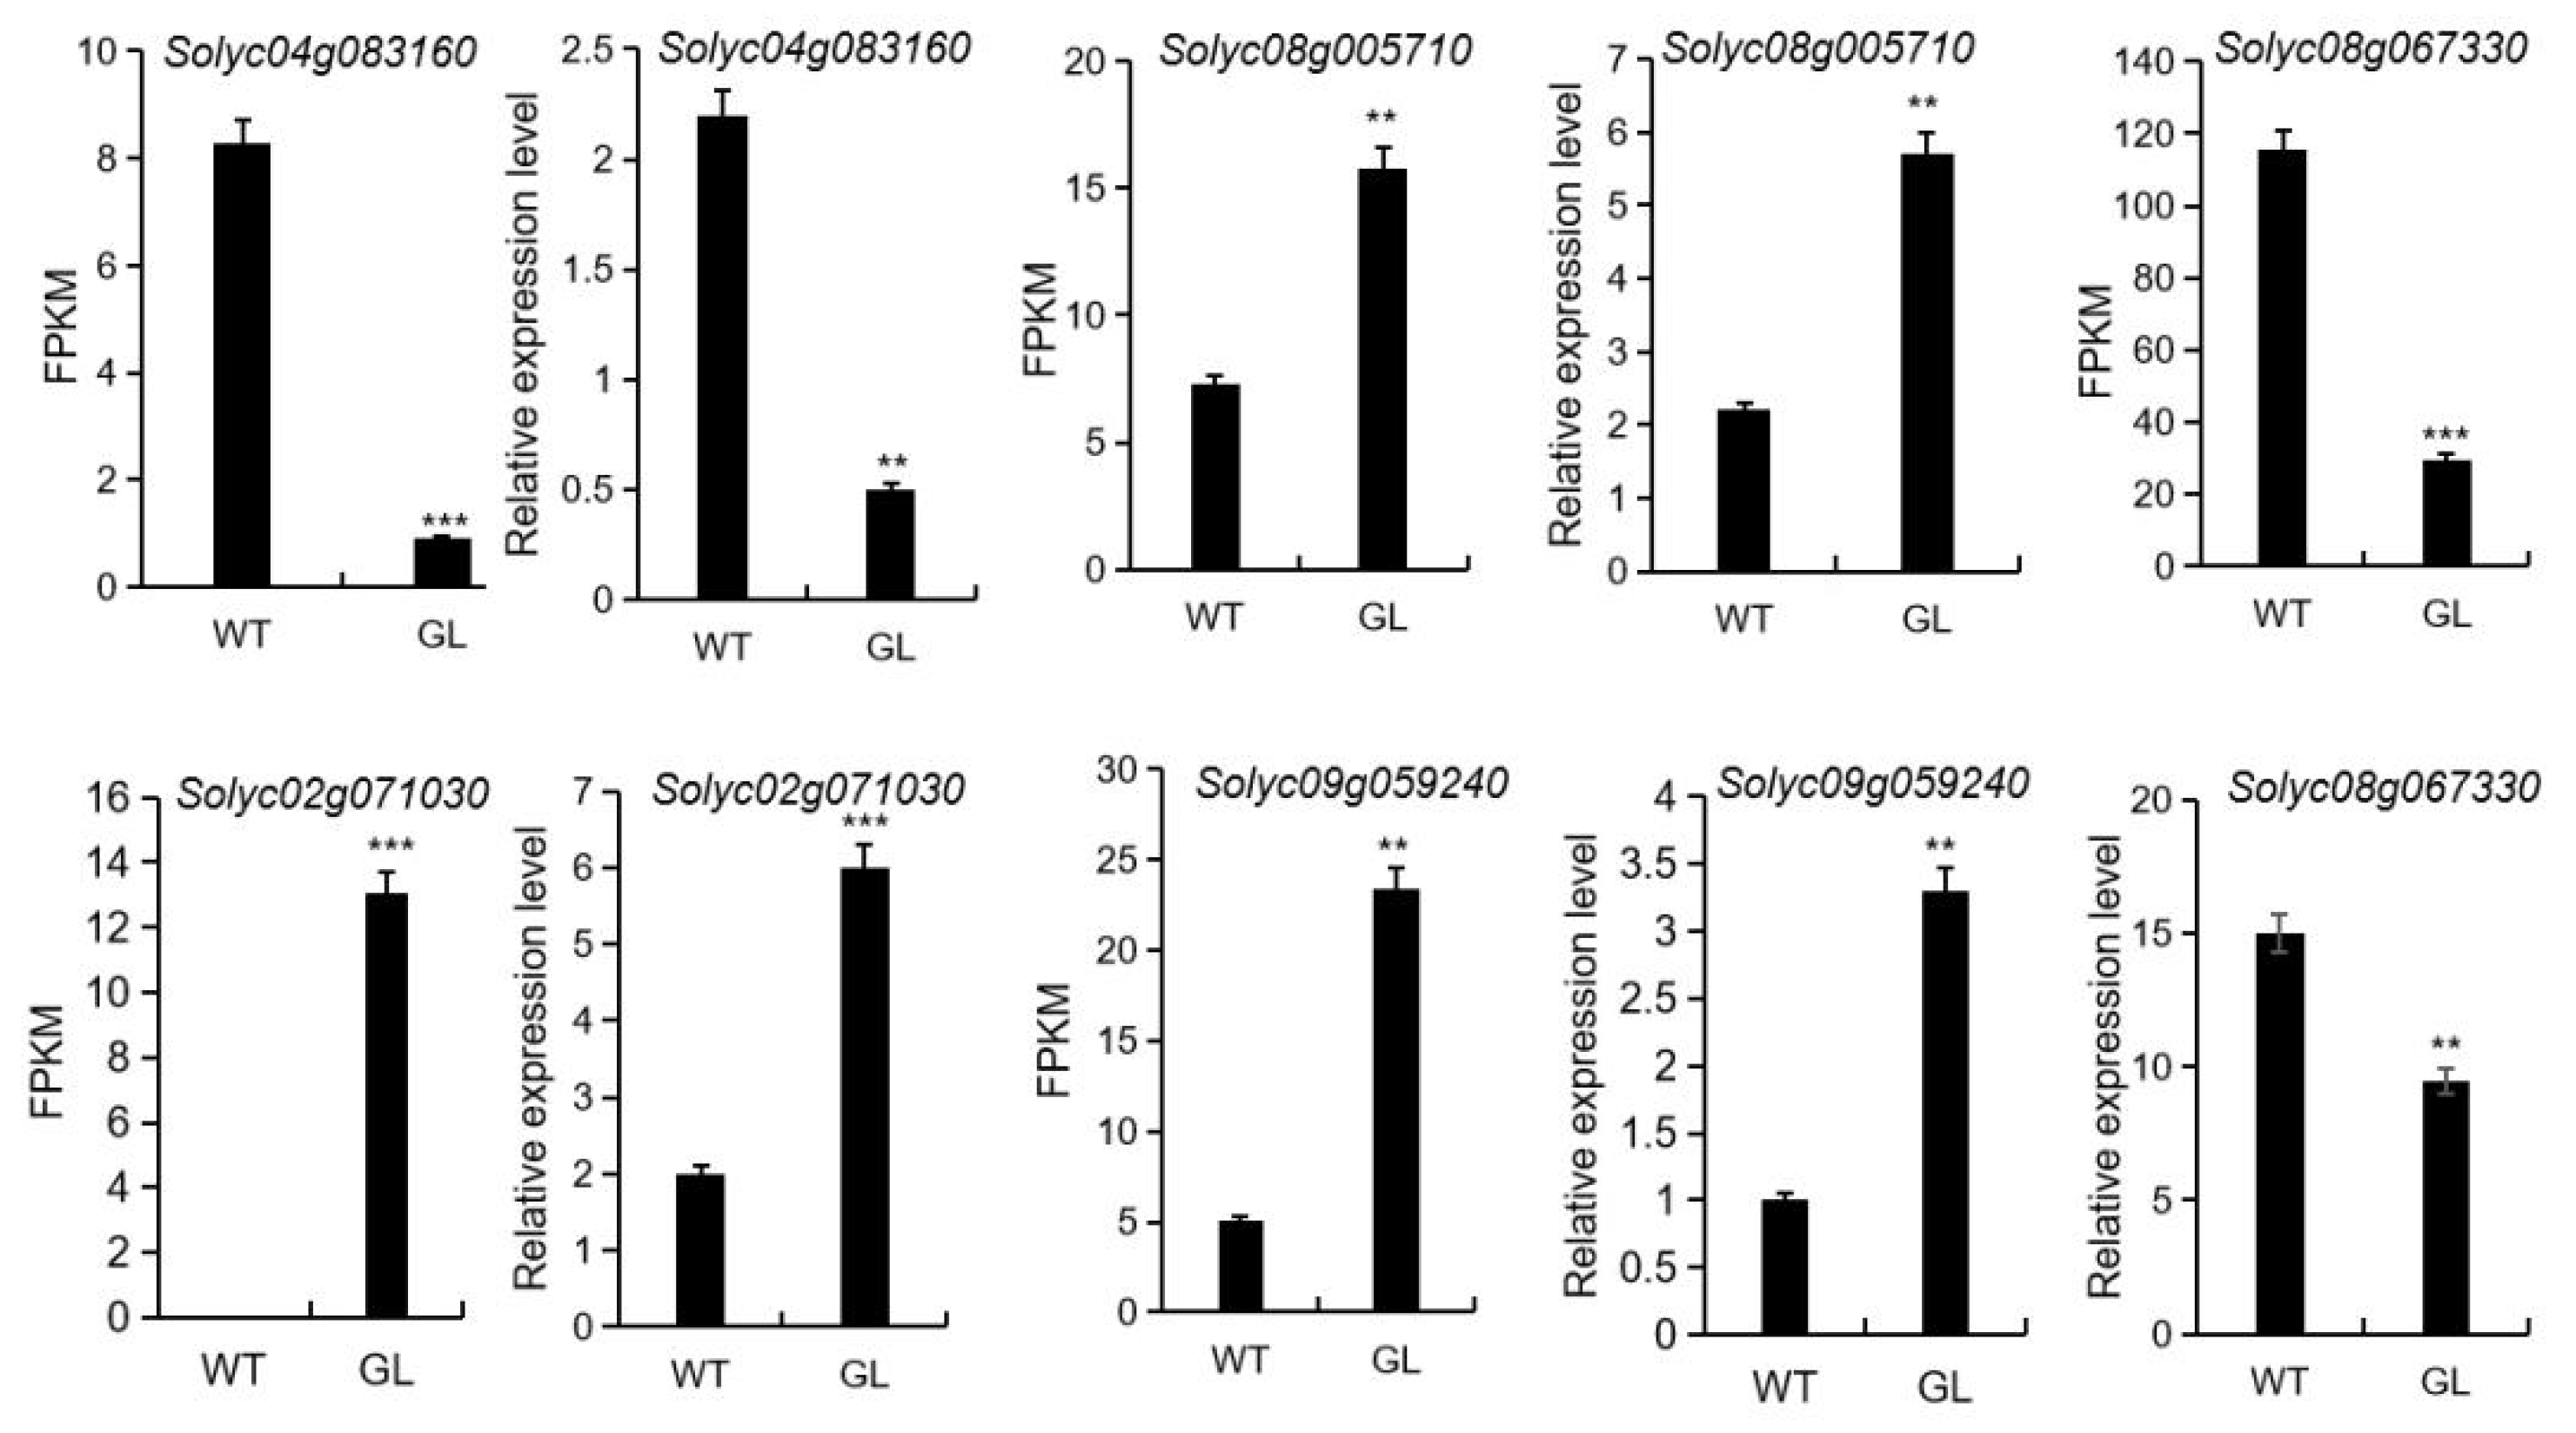
3.8. qRT-PCR Analysis of Genes Involved in Photosynthesis

Five candidate DEGs (Solyc04g083160, Solyc08g005710, Solyc08g067330, Solyc09g059240, and Solyc02g071030) potentially involved in yellow-green leaf regulation were selected for qRT-PCR analysis. qRT-PCR was performed with the gene-specific primers designed in Primer 5 (Table S1). The results showed that the gene expression pattern of all of the samples had similar qRT-PCR and the FPKM values (Figure 9), indicating that the results of transcriptome sequencing were feasible. In addition, the photosynthesis-antenna protein, Solyc02g071030 (LHCB1), and the diterpenoid biosynthesis-related genes, Solyc08g005710 and Solyc09g059240, were significantly upregulated in GL leaves compared with WT leaves.

4. Discussion

4.1. Characterization of Photosynthesis between WT and GL Plants

The leaf is an organ that provides photosynthetic products for plants. Chloroplasts are important organelles in leaves that not only serve as important sites of photosynthesis but also play crucial roles in crop yield and quality. Chlorophyll (Chl) in chloroplasts plays an important role in collecting and transferring light energy and driving electron transfer processes [13,14]. Plant leaf color variation is a common characteristic in plants, since gene mutations often affect the synthesis and degradation of chlorophyll. A previous study reported that chloroplast structural changes lead to mutations in leaf color genes [15]. Similarly, in the present study, a dark green leaf (GL) mutant with more developed and more closely arranged palisade tissue than normal leaf-color plants was reported. In general, thylakoids are carriers of pigments in plant leaves, and the accumulation of pigments is directly influenced by the stacking state of thylakoid layers [16]. Consistently, we also found that the lamellae were clear and that the stroma and grana were orderly, with more stacking and larger starch grains, as determined by observing the ultrastructure of the chloroplasts in GL leaves. Therefore, we speculate that the developed chloroplast in dark green leaf (GL) mutants’ leaves results in an upregulated expression of related genes in the chlorophyll synthesis pathway, and further enhances the efficiency of chlorophyll synthesis.

4.2. DEGs in Photosynthesis Antenna Proteins Pathways

In higher plants, light-harvesting chlorophyll a/b binding proteins (LHCPs) are a class of thylakoid membrane proteins that can bind with pigment molecules to form complexes and transfer light energy to the reaction centers of photosystems (PSI and PSII). PS I and PSII have their own respective light-harvesting complexes: LHGI and LHCII. LHCI consists of four classes of light-harvesting pigment proteins encoded by LHCA7, LHCA2, LHCA3, and LHCA4. LHCII consists of chlorophyll a/b binding proteins (LHCB) that bind pigments and are encoded by the nuclear gene Lhcb subfamily. These proteins include three major light-harvesting pigment proteins, LHCB1, LHC82, and LHCB3 and three minor light-harvesting pigment proteins, LHCB4 (CP29), LHCBS (CP24), and LHCB6 (CP26). These two classes of proteins constitute the peripheral antenna proteins of PSII and are involved in the transmission and capture of light energy, dissipation and protection of excess light energy, regulation of the energy balance in the photosystems, and maintenance of the thylakoid membrane [17,18,19,20]. Recently, many studies have reported that abnormal chlorophyll-binding protein pathways lead to leaf color variations in some plants. In the present study, we found that the chloroplast content was significantly greater in the GL leaves than in the WT plants. These results were similar to reports on grapes [21], Rhododendron championae [22], Litchi [23], and the photosynthetic pigment content in elm leaves, which were likewise accompanied by leaf edge withering caused by a reduction in chlorophyll. Similarly, the expression levels of the photosynthesis-antenna proteins, Solyc02g071030, and LHCB1 were also significantly upregulated in the GL leaves compared with those in the WT leaves. In addition, a previous study has demonstrated the important role of Lhcb2 (the homologous gene of Solyc02g071030 in Arabidopsis) phosphorylation in PSI/PSI antenna remodeling during state transition, which reported the existence of a previously unrecognized Lhcb2-independent component in the redox balance mechanism [24]. Nevertheless, the role of Solyc02g071030 phosphorylation in PSI/PSII antenna during state transition remain unknown. Therefore, it is necessary to verify its function using gene editing technology on the tomatoes.

4.3. DEGs in Diterpenoid Biosynthesis Pathways

Plant diterpenoids, such as chlorophyll, carotene, and other light-capturing pigments involved in photosynthesis, have very important physiological functions, and chloroplasts are the main site for the synthesis of plant terpenoids. In this study, we found that the diterpenoid biosynthesis-related genes, Solyc08g005710 and Solyc09g059240, were significantly upregulated in GL plants compared with WT plants, suggesting that these genes are very crucial to photosystems involved in the development of green leaf color in tomatoes. Furthermore, photosynthetic organisms also have an additional demand for Fe, as Fe is a cofactor in the electron transfer chain of photosynthesis. The content of Fe in chloroplasts accounts for 90% of mesophyll cells, and Fe is mainly concentrated in the chloroplast matrix and thylakoid membrane [25,26,27,28]. Fe starvation has the greatest impact on photosystem I (PSI), as each monomer of PSI contains 12 Fe atoms during the synthesis of chlorophyll [29,30]. The lack of Fe leads to a decrease in chlorophyll synthesis, ultimately resulting in leaf yellowing. Most notably, the homologous gene of the significantly upregulated gene, Solyc09g059240, (Cytochrome P450) in mutants is CYP82C in Arabidopsis, which encodes a cytochrome P450 enzyme [31]. It has been reported that CYP82C4 played a key role in the early Fe deficiency response in Arabidopsis. Although it has been reported in Arabidopsis, it has not yet been reported in tomatoes. In this study, Solyc09g059240 (Cytochrome P450) was also significantly upregulated in the GL leaves compared with those in the WT leaves, indicating that the Solyc09g059240 was also involved in Fe response. We speculate that the upregulation of Solyc09g059240 in GL leaves results in the dark green leaf color in tomatoes. Next, the functional analysis of the identified key genes related to photosynthesis would be performed by gene knockout. Together, the study would lay the foundation for the elucidation of the color change in tomatoes and provide a basis for high photosynthetic breeding in crops.

5. Conclusions

In summary, a stable dark green leaf (GL) mutant gene was isolated from yellow leaf tomato material. Compared to those of the WT plants, the leaves of the GL plants were dark green, had a greater chlorophyll content and a higher photosynthetic rate, with well-developed palisade tissue cells. Then, we constructed comprehensive tomato transcriptomes from dark green leaf (GL) mutants and WT plants. By considering ten different pathways, we identified three significantly upregulated genes: the photosynthesis-antenna protein, Solyc02g071030, and the diterpenoid biosynthesis-related genes, Solyc08g005710 and Solyc09g059240, which were significantly upregulated in GL plants compared with those in WT plants. In general, plant photosynthesis is an important factor affecting the quality and yield. This study will provide a basis for studying the structure of photosynthetic systems, functional genomics, and genetic breeding in tomatoes.

Supplementary Materials

The following supporting information can be downloaded at: https://www.mdpi.com/article/10.3390/agronomy14040828/s1. Table S1: Primers used in this study.

Author Contributions

X.G., writing; P.Z., performed the observation of electron microscopy and analysis of data for the work; X.F., made the figures and revised the manuscript; H.Y., funding acquisition and supervision. All authors have read and agreed to the published version of the manuscript.

Funding

This research was funded by the Special Postdoctoral Funding from Heilongjiang Province (LBH-TZ2306).

Data Availability Statement

The data in this article were deposited in NCBI accession number GSE164164. Sequence data can be downloaded from this link (https://solgenomics.net/content/coffee.pl, accessed on 15 November 2023). Solyc02g071030.1.1, Chlorophyll a/b binding protein; Solyc04g083160.1.1, Cytochrome P450; Solyc08g005710.2.1, Ent-copalyl diphosphate synthase; Solyc08g067330.1.1, Chlorophyll a-b binding protein 3C-like; Solyc09g059240.2.1, Cytochrome P450.

Conflicts of Interest

The authors declare no conflict of interest.

References

  1. Gao, Y.; Zhao, Y. Self-processing of ribozyme-flanked RNAs into guide RNAs in vitro and in vivo for Crispr-mediated genome editing. J. Integr. Plant Biol. 2014, 56, 343–349. [Google Scholar] [CrossRef] [PubMed]
  2. Beale, S.I. Green genes gleaned. Trends Plant Sci. 2005, 10, 309–312. [Google Scholar] [CrossRef] [PubMed]
  3. Wang, Z.; Zou, Y.; Li, X.; Chen, L.; Wu, H.; Su, D.; Chen, Y.; Guo, J.; Luo, D.; Long, Y.; et al. Cytoplasmic male sterility of rice with boro II cytoplasm is caused by a cytotoxic peptide and is restored by two related PPR motif genes via distinct modes of m RNA silencing. Plant Cell 2006, 18, 676–687. [Google Scholar] [CrossRef] [PubMed]
  4. Jung, K.H.; Hur, J.; Ryu, C.H.; Choi, Y.; Chung, Y.Y.; Miyao, A.; Hirochika, H.; An, G. Characterization of a Rice Chlorophyll-Deficient Mutant Using the T-DNA Gene-Trap System. Plant Cell Physiol. 2003, 44, 463–472. [Google Scholar] [CrossRef] [PubMed]
  5. Motohashi, R.; Ito, T.; Kobayashi, M.; Taji, T.; Nagata, N.; Asami, T.; Yoshida, S.; Yamaguchi-Shinozaki, K.; Shinozaki, K. Functional analysis of the 37 kDa inner envelope membrane polypeptide in chloroplast biogenesis using a Ds-tagged Arabidopsis pale-green mutant. Plant J. 2003, 34, 719–731. [Google Scholar] [CrossRef] [PubMed]
  6. Kusaba, M.; Ito, H.; Morita, R.; Lida, S.; Sato, Y.; Fujimoto, M.; Kawasaki, S.; Tanaka, R.; Hirochika, H.; Nishimura, M.; et al. Rice NON-YELLOW COLORING1 Is Involved in Light-Harvesting Complex II and Grana Degradation during Leaf Senescence. Plant Cell 2007, 19, 1362–1375. [Google Scholar] [CrossRef] [PubMed]
  7. Park, S.Y.; Yu, J.W.; Park, J.S.; Li, J.; Yoo, S.C.; Lee, N.Y.; Lee, S.K.; Jeong, S.W.; Seo, H.S.; Koh, H.J.; et al. The Senescence-Induced Staygreen Protein Regulates Chlorophyll Degradation. Plant Cell 2007, 19, 1649–1664. [Google Scholar] [CrossRef] [PubMed]
  8. Kendrick, R.E.; Terry, M.J. The aurea and yellow-green-2 Mutants of Tomato Are Deficient in Phytochrome Chromophore Synthesis. J. Biol. Chem. 1996, 271, 21681–21686. [Google Scholar] [CrossRef]
  9. Cock, P.J.A.; Fields, C.J.; Goto, N.; Heuer, M.L.; Rice, P.M. The Sanger FASTQ file format for sequences with quality scores, and the Solexa/Illumina FASTQ variants. Nucleic Acids Res. 2010, 38, 1767–1771. [Google Scholar] [CrossRef] [PubMed]
  10. Kim, D.; Langmead, B.; Salzberg, S.L. HISAT: A fast spliced aligner with low memory requirements. Nat. Methods 2015, 12, 357–360. [Google Scholar] [CrossRef] [PubMed]
  11. Livak, K.J.; Schmittgen, T.D. Analysis of Relative Gene Expression Data Using Real-Time Quantitative PCR and the 2−ΔΔCT Method. Methods 2002, 25, 402–408. [Google Scholar] [CrossRef] [PubMed]
  12. Zhang, Y.; Zhang, A.; Yang, W.; Jia, X.; Fu, Q.; Zhao, T.; Jiang, J.; Li, J.; Yang, H.; Xu, X. Transcriptome Analysis and Screening of Genes Associated with Flower Size in Tomato (Solanum lycopersicum). Int. J. Mol. Sci. 2022, 23, 15624. [Google Scholar] [CrossRef] [PubMed]
  13. Liang, H.M.; Wang, L.; Wang, Q.; Zhu, J.; Jiang, J.G. High-value bioproducts from microalgae: Strategies and progress. Crit. Rev. Food Sci. Nutr. 2019, 59, 2423–2441. [Google Scholar] [CrossRef] [PubMed]
  14. Zhao, Y.; Li, D.; Xu, J.W.; Zhao, P.; Li, T.; Ma, H.; Yu, X. Melatonin enhances lipid production in Monoraphidium sp. QLY-1 under nitrogen deficiency conditions via a multi-level mechanism. Bioresour. Technol. 2018, 259, 46–53. [Google Scholar] [CrossRef] [PubMed]
  15. Yang, Y.L.; Xu, J.; Rao, Y.C.; Zeng, Y.J.; Liu, H.J.; Zheng, T.T.; Zhang, G.H.; Hu, J.; Guo, L.B.; Qian, Q.; et al. Cloning and functional analysis of pale-green leaf (PGL10) in rice (Oryza sativa L.). Plant Growth Regul. 2016, 78, 69–77. [Google Scholar] [CrossRef]
  16. Zuo, L.; Zhang, S.; Liu, Y.; Huang, Y.; Yang, M.; Wang, J. The Reason for Growth Inhibition of Ulmus pumila ‘Jinye’: Lower Resistance and Abnormal Development of Chloroplasts Slow Down the Accumulation of Energy. Int. J. Mol. Sci. 2019, 20, 4227. [Google Scholar] [CrossRef] [PubMed]
  17. Klimmek, F.; Sjödin, A.; Noutsos, C.; Leister, D.; Jansson, S. Abundantly and Rarely Expressed Lhc Protein Genes Exhibit Distinct Regulation Patterns in Plants. Plant Physiol. 2006, 140, 793–804. [Google Scholar] [CrossRef] [PubMed]
  18. Teramoto, H.; Ono, T.A.; Minagawa, J. Identification of Lhcb gene family encoding the light-harvesting chlorophyll-a/b proteins of photosystem II in Chlamydomonas reinhardtii. Plant Cell Physiol. 2001, 42, 849–856. [Google Scholar] [CrossRef] [PubMed]
  19. Luciński, R.; Jackowski, G. The structure, functions and degradation of pigment binding proteins of photosystem II. Acta Biochim. Pol. 2006, 53, 693–708. [Google Scholar] [CrossRef]
  20. Liu, C.; Zhang, Y.; Cao, D.; He, Y.; Kuang, T.; Yang, C. Structural and functional analysis of the antiparallel strands in the lumenal loop of the major light-harvesting chlorophyll a/b complex of photosystem II (LHCIIb) by site-directed mutagenesis. J. Biol. Chem. 2008, 283, 487–495. [Google Scholar] [CrossRef] [PubMed]
  21. Dou, F.F.; Zhang, L.P.; Wang, Y.K.; Yu, K.; Liu, H.F. Effects of high-temperature stress on photosynthesis and gene expression of different grape cultivars. J. Fruit. Sci. 2021, 38, 871–883. [Google Scholar] [CrossRef]
  22. Yang, H.; Song, X.Z.; Zheng, G.L.; Shen, J. Effects of High-temperature stress on Physiological Indexes and Growth of Rhododendron championae. Acta Agric. Univ. Jiangxiensis 2020, 42, 259–265. [Google Scholar]
  23. Zhang, L.; Yang, Z.Q.; Sun, J.H.; Hong, J.W.; Li, S.G.; Wang, J.B. Genetic and transcriptome analysis of albino mutants of litchi (Litchi chinensis Sonn.) leaves. Mol. Plant Breed. 2020, 18, 5943–5950. [Google Scholar] [CrossRef]
  24. Cutolo, E.A.; Caferri, R.; Guardini, Z.; Dall’Osto, L.; Bassi, R. Analysis of state 1-state 2 transitions by genome editing and complementation reveals a quenching component independent from the formation of PSI-LHCI-LHCII supercomplex in Arabidopsis thaliana. Biol. Direct 2023, 18, 49. [Google Scholar] [CrossRef] [PubMed]
  25. Terry, N.; Abadia, J. Function of iron in chloroplasts. J. Plant Nutr. 1986, 9, 609–646. [Google Scholar] [CrossRef]
  26. Landsberg, E.C. Regulation of iron stress response by whole plant activity. J. Plant Nutr. 1984, 7, 609–621. [Google Scholar] [CrossRef]
  27. Bughio, N.; Takahashi, M.; Yoshimura, E.; Nishizawa, N.; Mori, S. Light-dependent iron transport into isolated barley chloroplasts. Plant Cell Physiol. 1997, 38, 101–105. [Google Scholar] [CrossRef]
  28. Shikanai, T.; Muller, P.; Munekaga, Y.; Niyogi, K.; Pilon, M. PAA1, a P-type ATPase of Arabidopsis, functions in copper transport in chloroplasts. Plant Cell 2003, 15, 1333–1346. [Google Scholar] [CrossRef] [PubMed]
  29. Moseley, J.; Quinn, J.; Eriksson, M.; Merchant, S. The Crdl gene encodes a putative di-iron enzyme required for photosystem I accumulation in copper deficiency and hypoxia in Chlamydomonas reinhardtii. EMBO J. 2014, 19, 2139–2151. [Google Scholar] [CrossRef] [PubMed]
  30. Tottey, S.; Mlock, M.A.; Allen, M.; Westergren, T.; Albrieux, C.; Scheller, H.V.; Merchant, S.; Jense, P.E. Arabidopsis CHL27, located in both envelope and thylakoid membranes, is required for the synthesis of protochlorophyllide. Proc. Natl. Acad. Sci. USA 2003, 100, 16119–16124. [Google Scholar] [CrossRef] [PubMed]
  31. Murgia, I.; Tarantino, D.; Soave, C.; Morandini, P. Arabidopsis CYP82C4 expression is dependent on Fe availability and circadian rhythm, and correlates with genes involved in the early Fe deficiency response. J. Plant Physiol. 2011, 168, 894–902. [Google Scholar] [CrossRef]
Figure 1. Phenotypic analysis and physiological determination between GL and WT plants. (A) Phenotypic analysis of GL and WT plants; (B) Chlorophyll content and photosynthetic rate; (C) Ultrastructure of leaf chloroplasts of GL (df) and WT plants (ac). (D) Scanning electron microscopy observation of palisade tissue and sponge tissue of leaves in WT and GL plants. (* p < 0.05, two-sided t-test). The abbreviations indicated by the arrows in the ultrastructure chart are CP: Chloroplast; GL: Grana Lamella; TH: Thylakoid; and St: Starch Granule.
Agronomy 14 00828 g001
Figure 2. Heat map of sample correlation. Both X and Y axes represent each sample. Color represents the correlation coefficient (darker color represents higher correlation, lighter color represents lower correlation).
Agronomy 14 00828 g002
Figure 3. Venn diagram and Box-plot of genes in WT-vs-GL. (A) Venn diagram of GL and WT plants; (B) Box-plot of genes in WT-vs-GL.
Agronomy 14 00828 g003
Figure 4. Heatmap of differentially expressed genes (DEGs) (GL/WT). The horizontal axis represents the log2 (FPKM + 1) value of the sample, and the vertical axis represents the gene. The more red the color block is, the stronger the expression, and the more blue the color is, the weaker the expression.
Agronomy 14 00828 g004
Figure 5. GO_CFP and GO pathway analysis of differentially expressed genes. (A) GO_CFP analysis of DEGs in WT and GL plants; (B) GO pathway analysis of of DEGs in WT and GL plants.
Agronomy 14 00828 g005
Figure 6. KEGG pathway and network analysis. (A) KEGG enrichment bubble plot of genes differentially expressed between GL and WT. Note: Rich Ratio: enrichment ratio; and the larger the bubble is, the greater the number of genes. (B) KEGG pathway network analysis. Different shapes represent different contents (nodes, nodes) where squares represent KEGG pathways, dots represent mRNAs, etc. Both color and size indicate the number of genes or transcripts connected to that node. Darker colors and larger squares indicate more genes or transcripts connected to that node.
Agronomy 14 00828 g006
Figure 7. Expression patterns of genes in tomato leaf samples were analyzed via WGCNA. (A) Gene cluster tree and module classification. (B) Module-sample association. The X-axis represents the phenotype (sample), and the Y-axis represents the different coexpressed gene modules. The heatmap color indicates high and low correlations. The Pearson correlation coefficient represents the correlation coefficient between the module and the sample, and the p-value represents the significance of the correlation coefficient.
Agronomy 14 00828 g007
Figure 8. The protein complexes of photosynthesis-antenna proteins.
Agronomy 14 00828 g008
Figure 9. Comparison of RNA-seq and qRT-PCR. Error bars indicate the SD of three biological replicates. The asterisk indicates significant differences compared to WT (** p < 0.01, *** p < 0.001, two-sided t-test).
Agronomy 14 00828 g009
Table 1. Quality statistics of filtered Reads.
SampleTotal Raw Reads (M)Total Clean Reads (M)Total Clean Bases (Gb)Q20 (%)Q30 (%)Ratio (%)
GL_147.1944.896.7397.8493.2795.13
GL_247.1945.036.7697.8693.1995.44
GL_347.1945.276.7997.9493.5295.93
WT_147.1945.166.7798.0893.995.71
WT_247.1945.136.7797.9393.3995.64
WT_347.1945.336.898.0293.796.07
Disclaimer/Publisher’s Note: The statements, opinions and data contained in all publications are solely those of the individual author(s) and contributor(s) and not of MDPI and/or the editor(s). MDPI and/or the editor(s) disclaim responsibility for any injury to people or property resulting from any ideas, methods, instructions or products referred to in the content.

