Abstract
Nowadays, many image processing and machine learning (ML) methods are used in mango-quality classification systems. Existing algorithms perform independently to capture the relationships between features in the dataset. Nevertheless, each method has its advantages and disadvantages. As a result, this study presents an ensemble-learning framework that combines the strengths of multiple ML algorithms to make predictions. Initially, different image processing algorithms are used to extract external mango features. Next, the dataset is constructed by combining those features with weight values from sensor signals. Following that, different ML algorithms are evaluated on the dataset to determine which ones are robust. Subsequently, various ensemble-learning approaches are deployed, such as bagging, boosting, and stacking. Finally, those models are evaluated and compared, to decide which model is suited for this study’s dataset. In the experimental part, the assessment of errors demonstrates the usefulness of image processing algorithms. Furthermore, evaluation of the training models revealed that the stacking model, which integrates several methods in both the base learner and meta-learner, produced the highest results in precision, recall, F1-score, and accuracy, with values of 0.9855, 0.9901, 0.9876, and 0.9863, respectively. These experimental results confirm the robustness of the proposed methodologies for classifying mango quality.
1. Introduction
In Vietnam, mango is widely consumed for its sweet taste and high nutrition, leading to its cultivation across vast areas to meet the substantial demand. During a specific season, mangoes are harvested from gardens and transported by distributors to various consumption locations. Mangoes cultivated in diverse regions exhibit varying qualities due to differences in soil and weather conditions. Despite this variability, many markets aim to import consistently high-quality and uniform fruit. Thus, the grading of mangoes based on quality becomes crucial to ensure a consistent supply of high-quality fruit for the market. Normally, mango sorting relies on manual assessment, in line with farmers’ experience [1]. However that method resulted in uncertain classifications, leading to an uneven classification [1,2]. To address the issue, farmers used various measuring tools such as rulers, and scale. Nevertheless, this approach incurred additional equipment costs and demanded substantial labor [2]. Moreover, in the context of an aging population and increasing labor costs, the expenses associated with agricultural production have risen significantly [3]. To tackle this challenge, commercial machines were designed and manufactured for the classification process of agricultural products [4].
In previous studies, fruit grading was carried out with the help of electronic nose devices to estimate fruit ripeness [5]. Another study in [6] describes an automated method for peach-fruit maturity grading using spectroscopy-based sensors and multivariate processing to reduce the operator’s intervention. By estimating fruit firmness through spectral data and employing a fuzzy classifier, the system offers reliable maturity categorization despite fruit variability. Those studies mainly involve maturity estimation via a non-vision-based approach. However, those systems have limitations in evaluating fruits on a large scale within a short time because the implementation process is quite complicated and requires a large amount of labor. Therefore, some subsequent studies have proposed fruit classification systems based on machine vision to improve classification accuracy. Machine learning (ML) algorithms are widely used in the field of computer vision to classify agricultural products due to their adaptability to many conditions. In Reference [7], Nandi et al. introduce an automated mango grading system that assesses maturity and quality based on shape and surface defects using machine vision. It categorizes mangoes into four groups, considering market distance and value, employing image processing and support vector regression for maturity prediction, and a fuzzy algorithm for grading. That study achieves an impressive 87% accuracy, and the system also demonstrates 100% repeatability. The effectiveness of ML algorithms in the fruit classification process has also been shown in some other studies. The authors in [8] present how to use visible images to grade mangoes based on their shapes, with a 98.3%-correct classification using discriminant analysis and a 100%-correct classification using support vector machines (SVMs). Furthermore, the study shows a good correlation of 94.0% between estimated and actual values by applying the cylinder approximation analysis method, which can be used to predict mango weight from images. A 95% accuracy in weight grading is produced by the derived formula, w = 2.256V − 157.7, where w is the predicted weight in grams and V is the estimated volume. That method shows that the simple approach to predicting fruit weight and volume is effective. Another study also applied ML to fruit classification. Schulze et al. [9] compare three models—simple linear regression (SLR), multiple linear regression (MLR), and artificial neural networks (ANNs)—for estimating the mass of mango fruits based on their features. Using independent datasets for calibration and validation, the study established a high-performance model suitable for mass–size estimation in machine-vision systems. ANNs emerged as the most accurate model, displaying robustness with a root-mean-squared error (RMSE) of 6.55 g, a mean absolute percentage error (MAPE) of 1.62%, and a coefficient of efficiency (E) of 0.99 during validation, making it the preferable choice for mango-mass estimation, with a success rate of 96.7%. In study in [10], the authors introduce an image processing system that automatically categorizes rice grains based on their commercial value by segmenting grains from the background, extracting key features, and using SVMs for classification. The experimental results of that study demonstrate the method’s effectiveness in accurately classifying grain samples. Agricultural product classification systems that apply ML are effective, but they are not powerful enough in complex cases [11]. Therefore, some researchers have proposed new classification systems using deep learning (DL) algorithms. Specifically, in research described in [11], Cao et al. present LightNet, a novel convolutional neural network (CNN) architecture designed to efficiently classify fresh zizania into high- and defective-quality categories. LightNet’s compressed block design reduces computational complexity by converting serial operations to a parallel structure, achieving 95.62% accuracy in zizania grading at a speed of 47 ms per image. Despite having fewer parameters and lower complexity than other networks, LightNet maintains comparable accuracy in zizania grading and achieves 99.31% accuracy in grading apples. In addition, the authors of a study in [12] introduced CNNs and transfer learning for seed-quality classification, showing that deep learning (specifically GoogLeNet) achieved a significantly higher accuracy of 95% compared to 79.2% using traditional machine learning (SURF+SVM). However, those DL algorithms often have a large number of computations, making classification systems with limited computational resources incapable of operating in real time. In addition, although the ML algorithms studied in [8,9,10,11] have less computation than DL, they were developed individually. That cannot take advantage of the different strengths of ML algorithms to achieve the best result. Furthermore, recent studies have primarily concentrated on developing intelligent algorithms for quality classification without providing comprehensive system research. Therefore, this research aims to construct a complete mango classification system and analyze the algorithms employed to extract external features, which are subsequently fed into the model for predicting mango quality. Notably, our proposed ensemble-learning model rectifies the limitations observed in the previous studies. Initially, various machine learning algorithms underwent evaluation using mango classification data. The most robust algorithms were then compared, followed by hyperparameter tuning aimed at enhancing accuracy. Subsequently, different ensemble-learning (EL) methods—such as bagging, boosting, and stacking—were applied to increase the individual model’s performance. Ultimately, the most robust model was integrated into the system.
The main contributions of this study are described as follows:
- (1)
- The proposed stacking ensemble method takes advantage of the strengths of many ML algorithms to increase the system’s prediction performance.
- (2)
- Successful application of the proposed stacking ensemble method to classifying mangoes, thereby improving the efficiency of the entire mango distribution process.
- (3)
- Easy application for classifying other agricultural fruits and vegetables such as sweet potatoes, tomatoes, etc., and promoting research to create intelligent methods and equipment for agriculture.
2. Materials and Methods
2.1. Structure of the Mango Sorting System
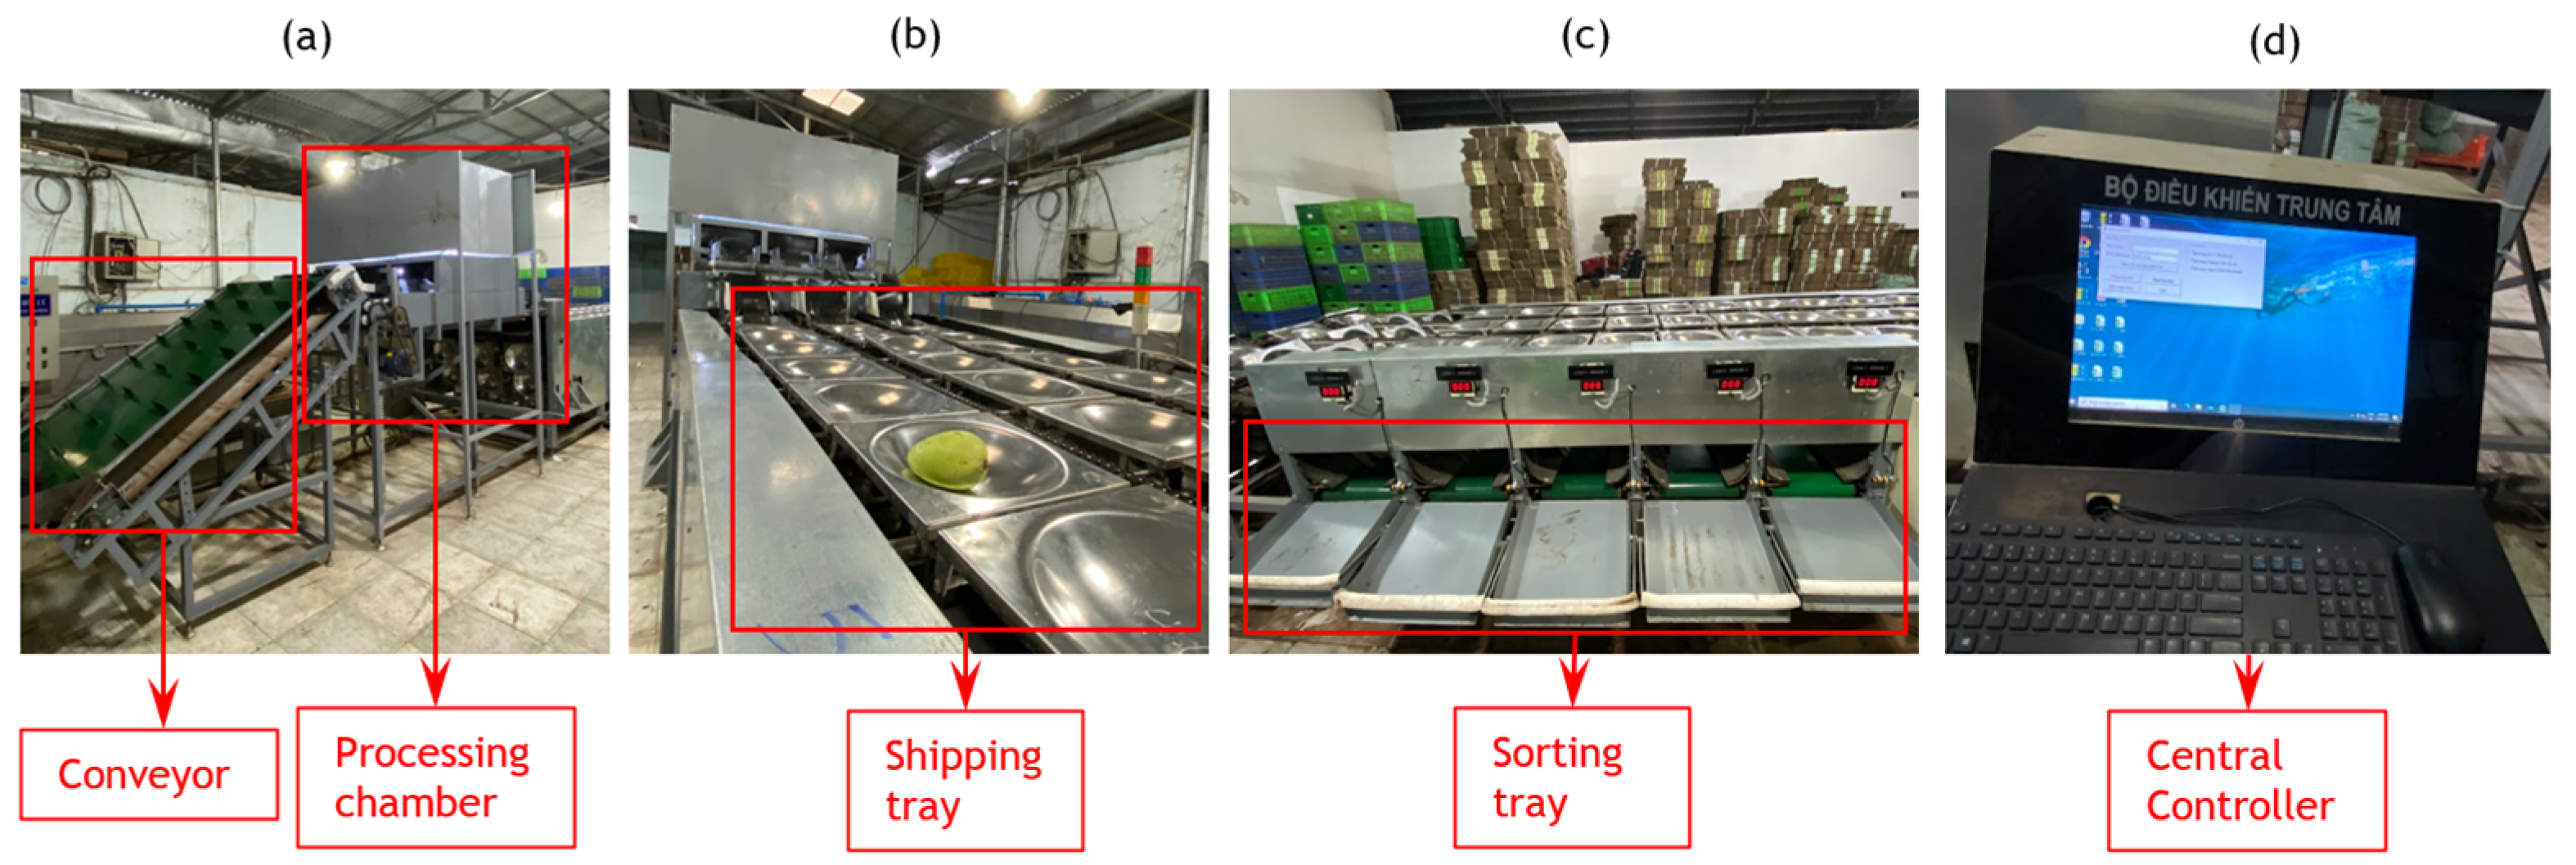
The mango sorting system, illustrated in Figure 1, comprises several integrated components that take mangoes as input and produce graded mangoes as output. Before entering the system, the mangoes undergo screening by farmers to eliminate overly small or significantly damaged ones. Then, the mangoes are placed onto the conveyor (depicted in Figure 1a) for transfer to the image processing chamber (shown in Figure 1a). In the chamber, a series of image processing algorithms are used to extract various features such as length, width, and defects of the mangoes. Subsequently, the mangoes pass through a weighing system equipped with loadcells. The signals from those sensors undergo filtration using the Kalman filter before being forwarded to the central processor for further analysis. This paper does not delve into processing signals from the loadcells. The derived weight is then combined with the external features of the mangoes to generate an essential input value for the classification model. Next, the mangoes are transferred to trays via the conveyor (shown in Figure 1b) for transportation to the grading tray area. At the sorting unit (shown in Figure 1c), mangoes of each specific type are directed to the corresponding trays by the classification system. At this point, a sorting process is completed based on central controller (Figure 1d).

Figure 1.
Mango-grading system including: (a) Conveyor and Processing chamber, (b) Tray conveyor, (c) Sorting Unit, and (d) Central Controller.
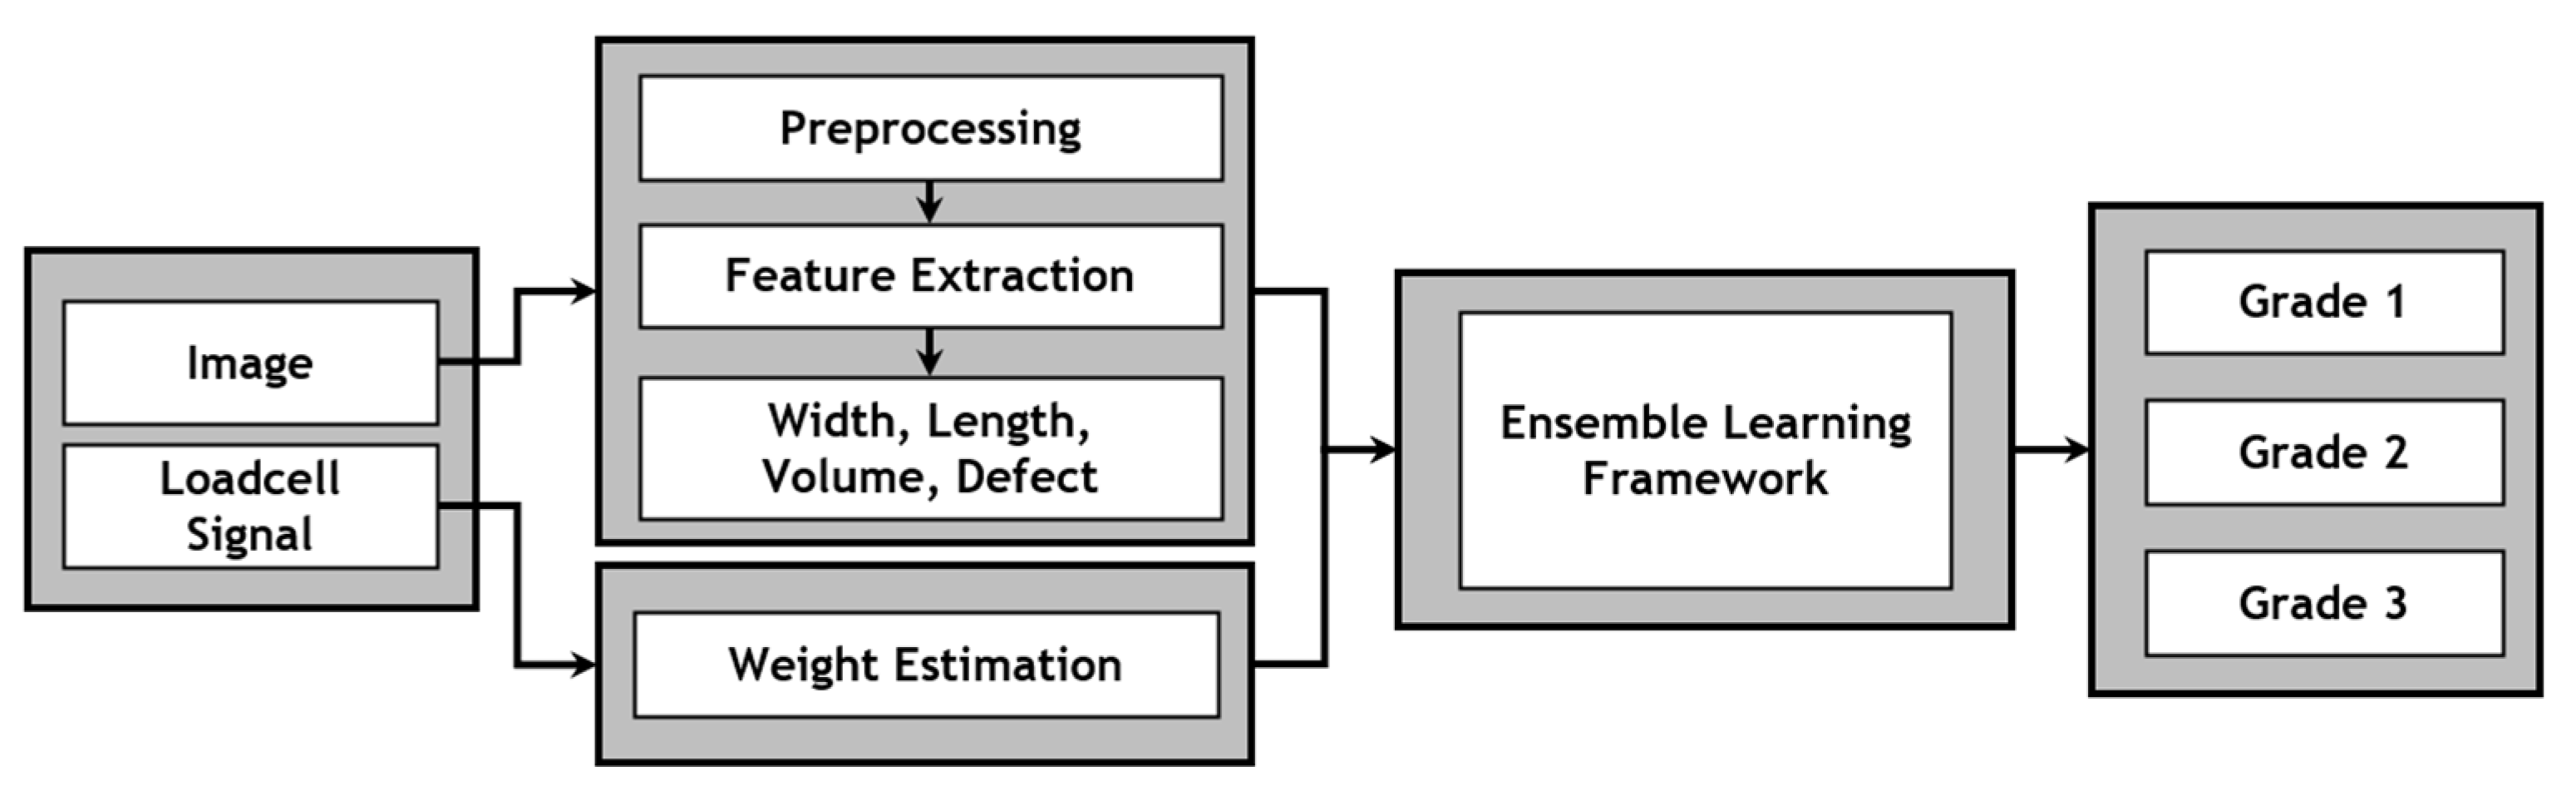
To initiate the classification process, external features are extracted by algorithms in the central processor. Subsequently, the information is combined with weight data obtained from the loadcells to generate a set of input data for the classification model. The features go through a series of processing steps aimed at eliminating noise and normalizing the data to make them suitable for the classification model’s requirements. The processed features are then fed into the model to generate predictions regarding mango quality. Upon identifying the specific type to which the mango belongs, the corresponding mechanism promptly operates, which ensures the accurate classification of the mango as depicted in Figure 2.

Figure 2.
Structure of mango-quality grading process.
2.2. Extracting External Features of Mangoes Using Image Processing
In this section, image processing algorithms are presented to extract external features of mangoes. The algorithms are included in the following steps: first, the mango is segmented from the background, and next, the length, width, volume, and defect features are extracted by the system.
2.2.1. Mango Segmentation
As presented in the previous section, mangoes were conveyed to the imaging chamber via a roller conveyor. Within the setup, the original mango is segmented from its background through binarization. Recent research has explored various algorithms for object segmentation, and the most robust approach involves the application of Deep Learning (DL). Specifically, Perez-Borrero et al. utilized the Mask RCNN model in their study [13] to segment strawberry fruit. Nevertheless, DL models often consume large computational resources, resulting in slower processing times for classification systems. To address that issue, classical image processing algorithms with lower computations have been employed for mango segmentation, such as the approach of utilizing a fixed threshold to segment objects from grayscale images, as described in the study in [14]. However, that method lacks adaptability when the color of the mangoes has changed. Hence, a suitable segmentation method in this context involves segmenting mangoes based on the HSV color space [4].
First, the image captured from the camera is an RGB color image (IRGB), and then it is converted to an HSV image (IHSV) using the following Equations (1)–(3).
In the image processing chamber, environmental conditions were established and adjusted to create favorable settings for subsequent processing steps. The setup is crucial for generating an input image with reduced noise and ensuring optimal conditions for image binarization. In the captured image (as shown in Figure 3), the green of the mangoes stands out against the background, facilitating segmentation. Subsequently, the captured HSV image (IHSV), is converted into a binary image (IB), as described in Equation (4). In the color space conversion, a range of values corresponding to the green color in the HSV color space is selected, with a lower bound of Tmin(H,S,V) = (30,15,17) and an upper bound of Tmax(H,S,V) = (80,255,255). Following the process, the resulting binary image comprises pixels with a value of 255, representing the color area of the mango, while a value of 0 corresponds to both the background and the mango’s defect area in the original image. Subsequently, a Gaussian blur filter with a kernel size of 3 × 3 is applied to smooth the binary image. Additionally, a dilate morphology method is utilized to eliminate noise in the binary image. The binary image outcomes of this process are illustrated in Figure 3.
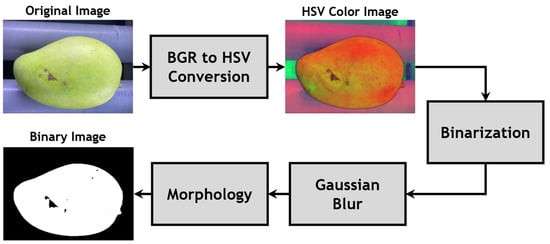
Figure 3.
Mango-segmentation method.
2.2.2. Mango External-Feature Extraction
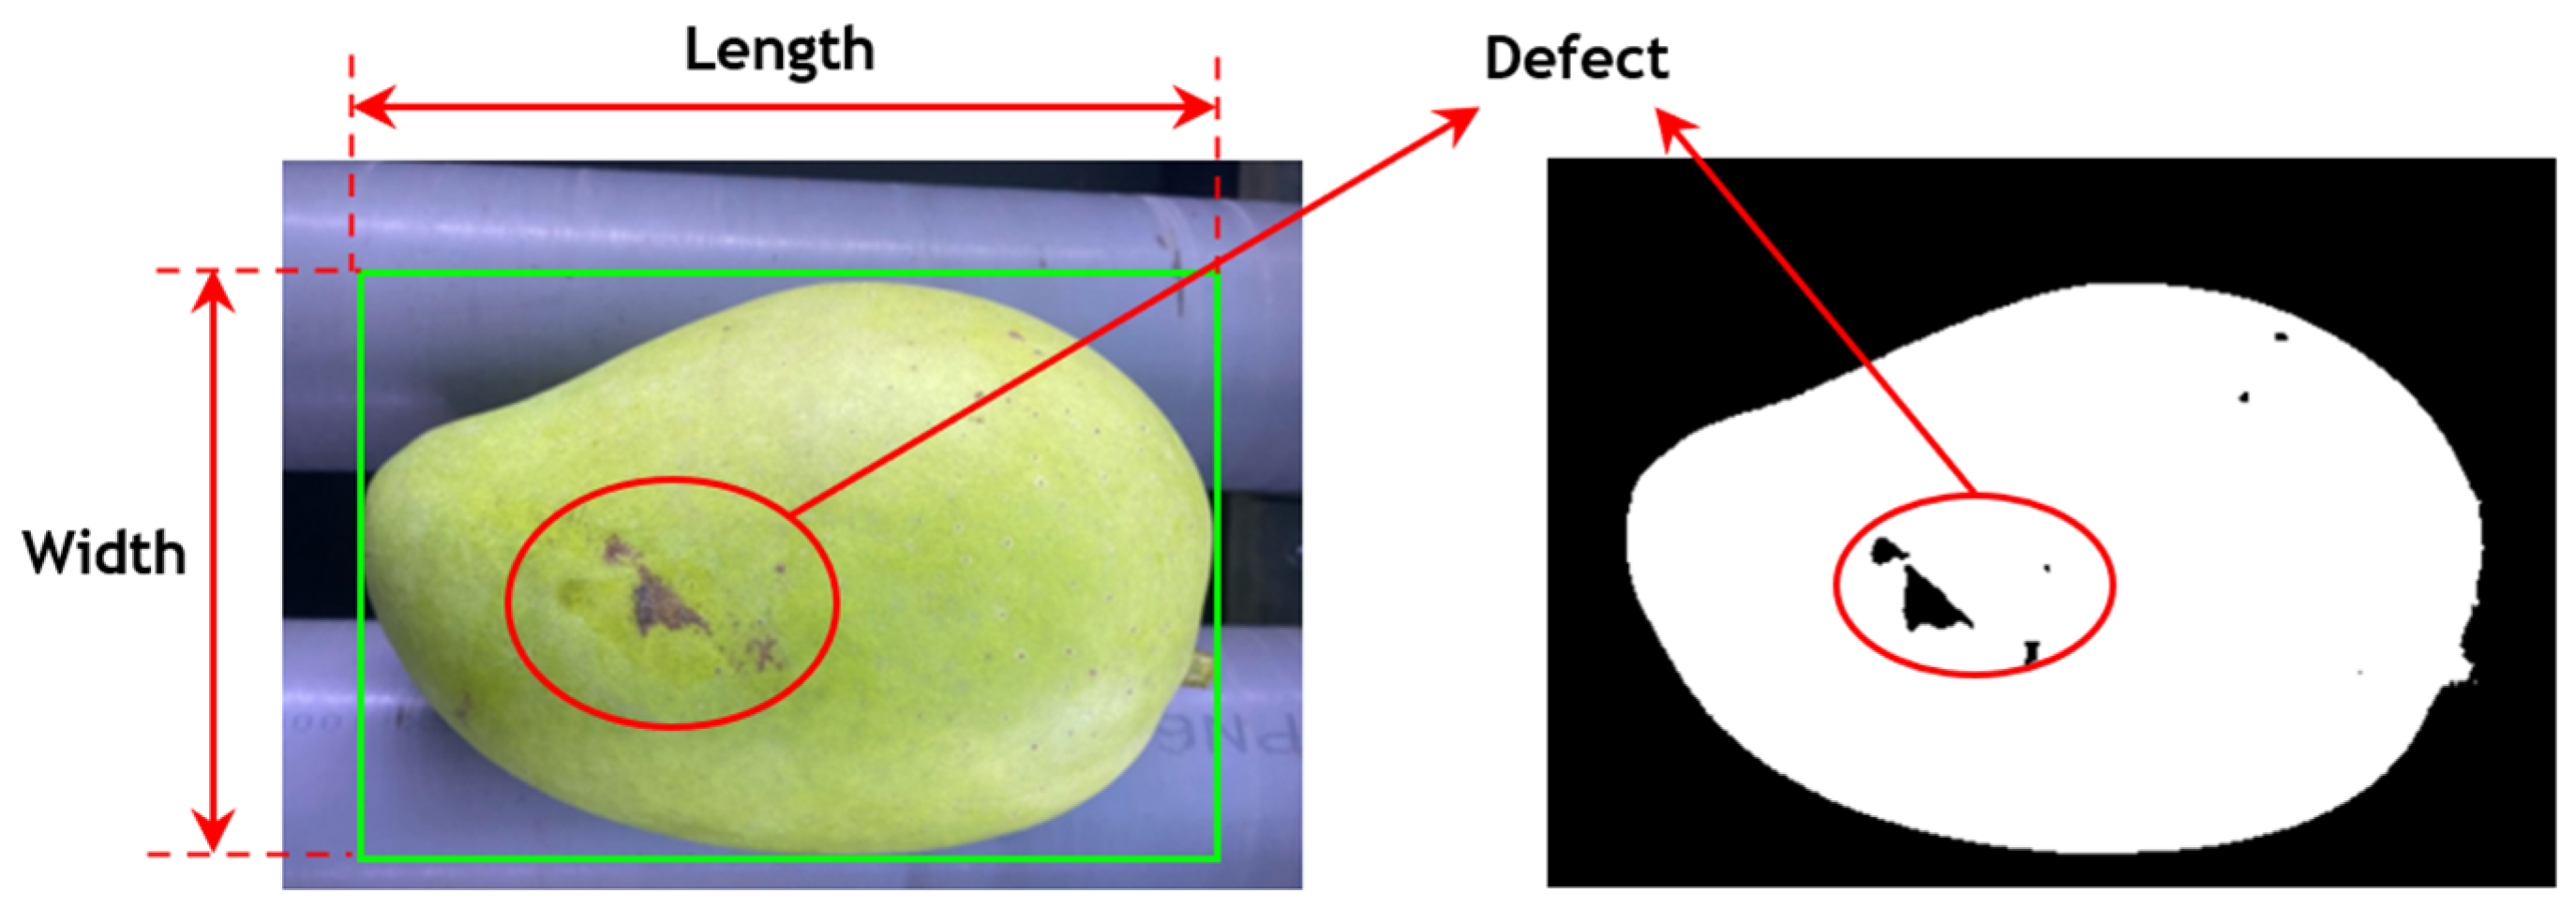
After segmenting the mango from the background via the image binarization process, those images go through various image processing algorithms to extract their external features. The input features were chosen from the analysis presented in study [15] for fruit classification. Based on that analysis, combined with the biological features of the mango, the length, width, volume and defects were then utilized as inputs for the classification model in this study, as illustrated in Figure 4.
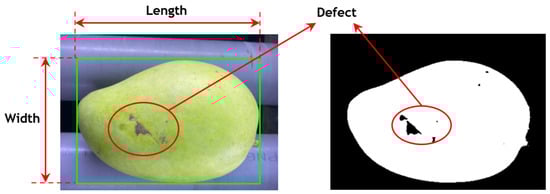
Figure 4.
Mango external-feature extraction.
Next, the mango rolls on a roller conveyor to capture all of its features using a bounding box rectangle. Specifically, the mango’s length in a series of images is considered constant, as there is not much change. However, because of the shape of the mango, this results in the parameter of widthmax, which is captured to enhance classification accuracy. Then, the volume value of the mango is estimated from the width and length, which are presented in the following section. Additionally, a mango defect is identified as a black area caused by damage. The cumulative defect area is calculated across the entire mango surface. As the mango rotates on the conveyor belt, the system can detect that entire defect area. Following the extraction of external features, these features are combined with the weight value obtained from the load cell sensor. This combination generates a full set of input features for the classification model, including length, width, volume, defect, and weight.
After the image binarization process, the obtained image consists of pixels with values of 0 and 1. Pixels with a value of 1 represent the area of the mango, while pixels with a value of 0 represent both the background and any defect area. Subsequently, the length, width, volume, and defect values are converted from pixel units to actual values. This conversion is achieved by multiplying the pixel value by a factor, as described in Equation (5).
where Wpixel represents the width in pixel value, Wactual represents the width in actual value, and k is a constant. However, as the mango moves along the roller conveyor, the distance between the mango and the camera changes, leading to a variation in the k coefficient. To ensure accuracy, an approximation for the coefficient k is necessary. As the mango moves, if the distance from the camera decreases, the number of pixels representing the mango increases. Consequently, as the number of pixels increases, the resulting actual value (multiplied by the coefficient k) also rises. Therefore, the approximate value of k must adhere to a function. After capturing a sequence of n images during the rotation, the average width value Wavg is calculated using the following Equation (6).
From Equation (6), the kestimated value is calculated as described in Equation (7).
Then, the final width value W of the mango and the error of k are calculated as follows, in (8) and (9).
A similar calculation for Equation (8) is applied to calculate the length value of the mango. Notably, the defects in the mango are recognized by the area of zero-valued pixels within the mango’s boundary in the binary image. This area is determined by the pixel-size ratio k where each pixel represents an area of k2. Equation (10) is used to calculate the actual defect value.
where Spixel represents the accumulated area of defects in pixels, while Sactual represents the accumulated area of defects in an actual value.
2.2.3. Mango-Volume Estimation
In the image processing chamber, the mango rotates continuously on the conveyor belt, causing a continuous change in its width value. Therefore, one more input feature is considered to enhance the accuracy of the model. Hence, the volume of the mango is considered a new feature, which represents the space occupation of the mango.
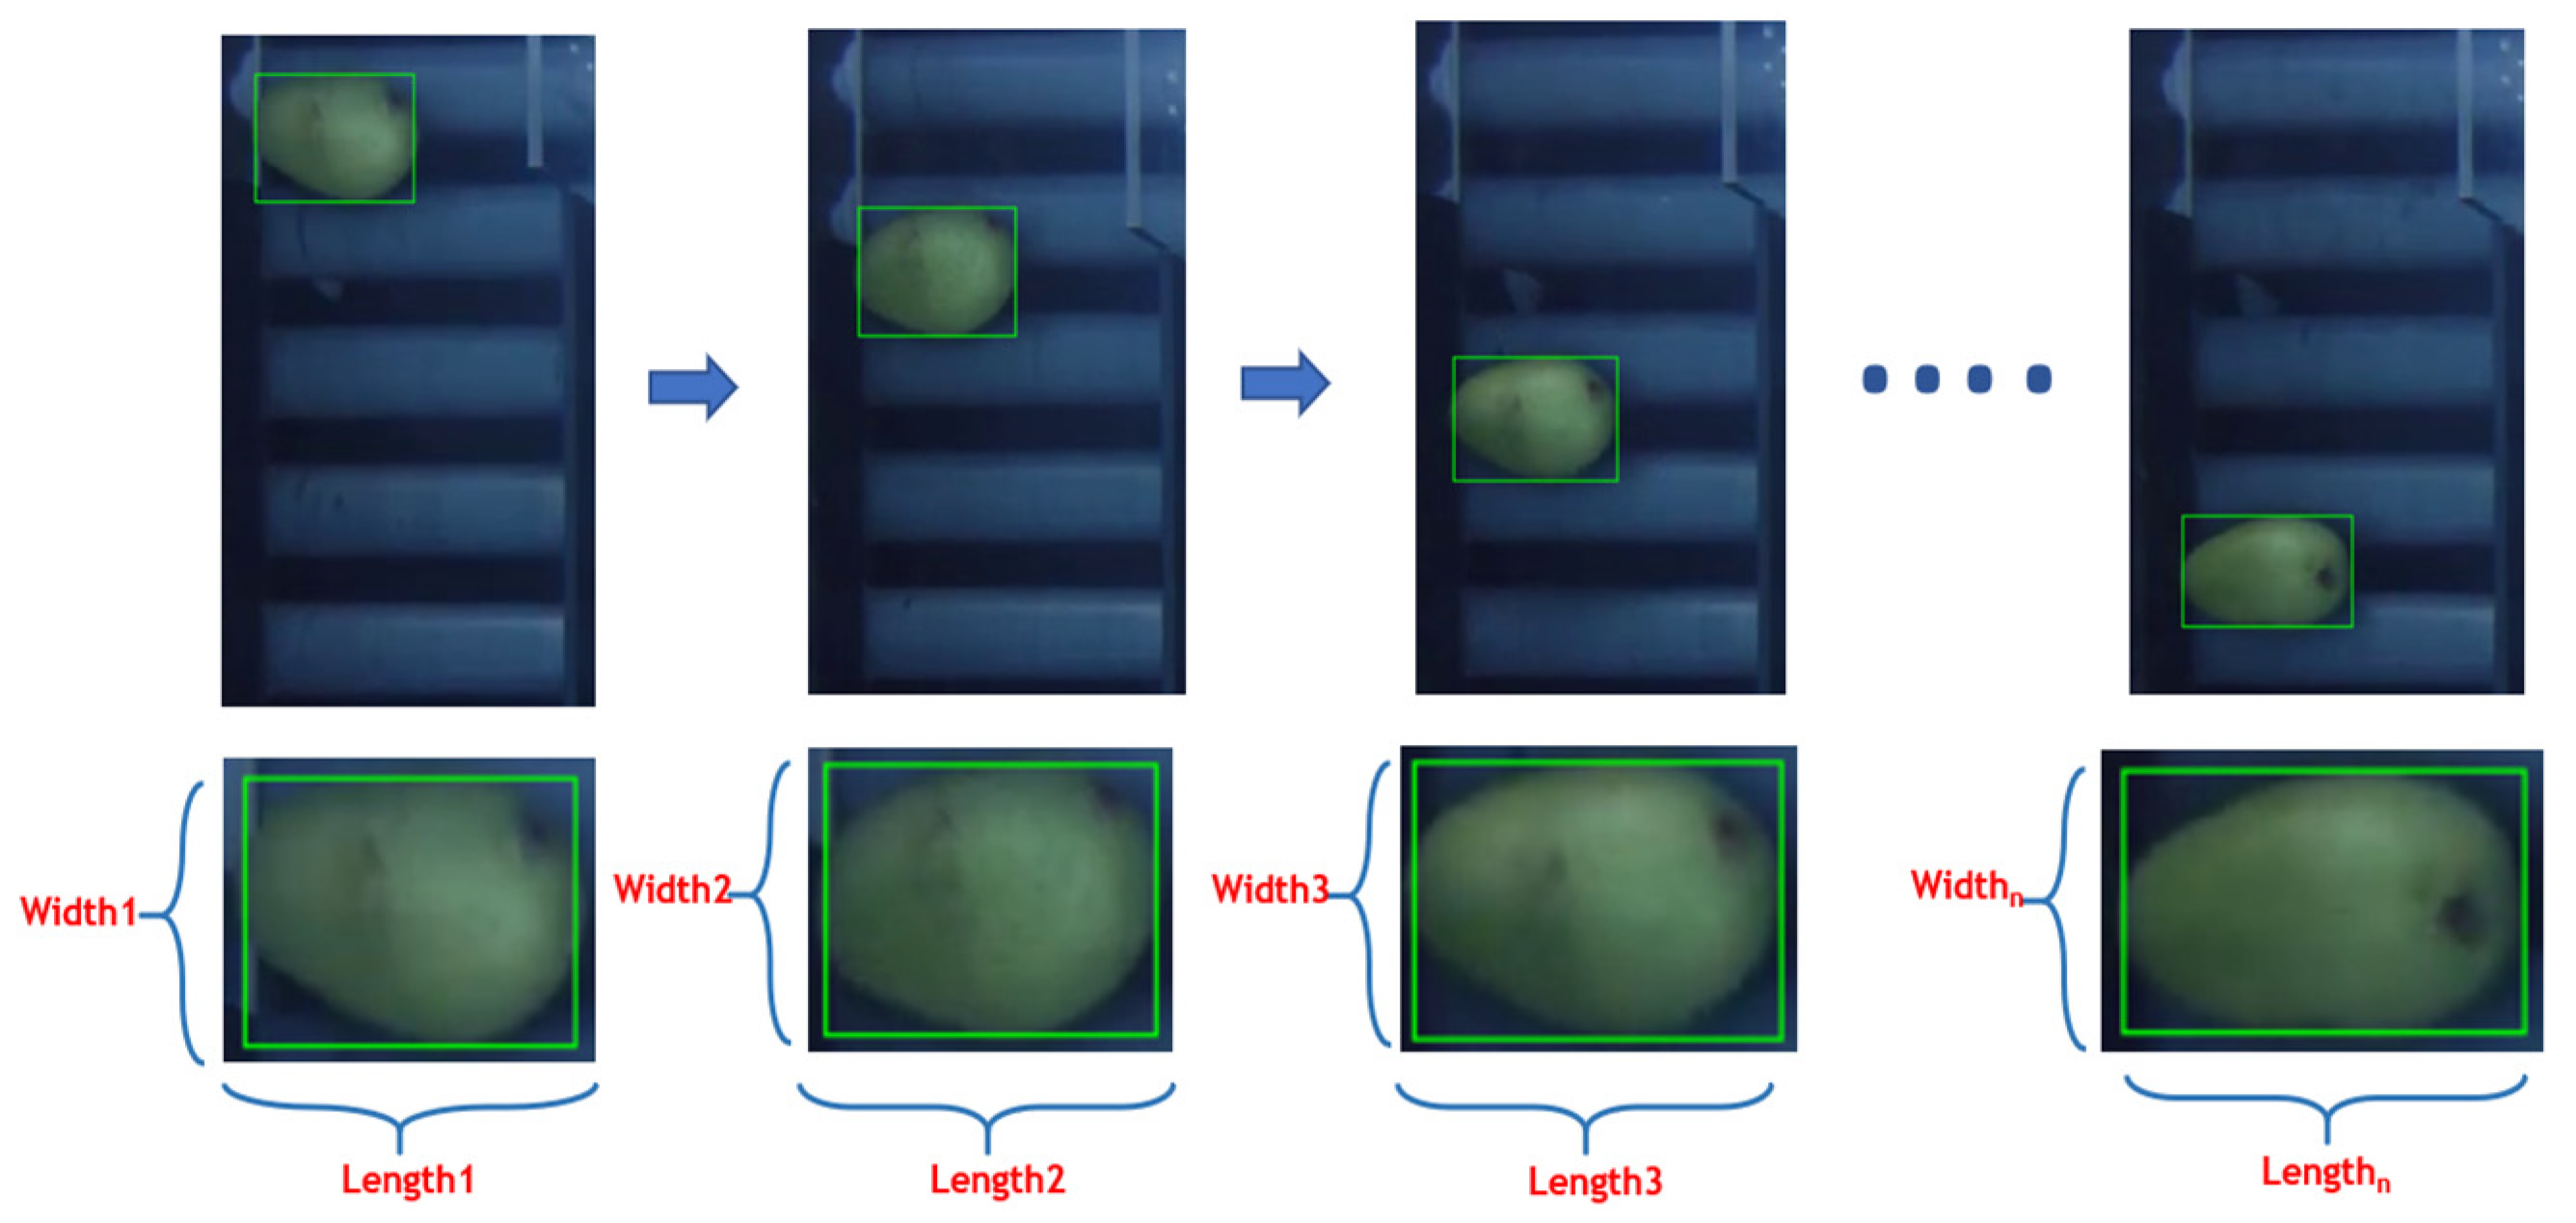
The shape of the mango, which varies by country and area, affects the assessment of volume. Consequently, the shape is extracted before the volume is estimated. Structured data that have been transformed from images and sensor signals make up the appropriate data for training models. There are three stages involved in volume estimation. A camera extracts the length, width, and defect from the collected image in the first stage. The volume is estimated using the length and width, and its errors are assessed in the second stage. In the end stage, the length, width, volume, and defect are added to the weight to obtain a completed dataset. Figure 5 shows a series of captured images to extract external features.
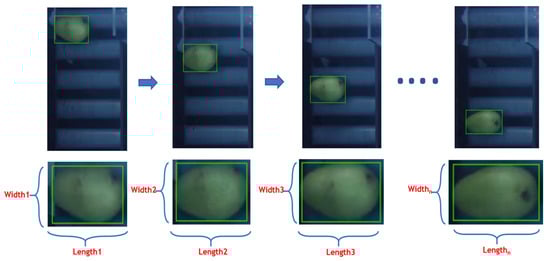
Figure 5.
Images of mangoes were captured at different locations.
Numerous techniques, like modeling and statistical analysis based on weight or size, are used to calculate the mango volume (V). However, two-dimensional images are used in this study to compute the volume of mangoes, since they are a quick and resource-efficient approach for processing. The image-processing process generates images of a mango in many orientations because of the mango’s intricate shape. Three factors are used in many studies to calculate the mango’s volume. Nevertheless, further research [16] has demonstrated a relationship between width (wid) and length (len); as a result, wid and len values are used to calculate volume. The len and wid values of the mango are obtained from the processed images. Mango orientations are random during feature extraction, with n places. Using image-processing algorithms, a rectangle that covers them indicates the presence of a mango. Len and wid are extracted n times at n places during the sampling process. Two features from the ith mango at n places are determined into n value pairs (wid, len) in Figure 5.
The volume is dependent upon two variables, namely length (len) and width (wid), according to the data gathered from images. Len, wid, and V variables are used in m samples of mangoes to quantify the mangoes. Predicting the volume from the length and width is the necessary task. Accordingly, V′ is a dependent variable that is determined by Equation (11), while len and wid are independent variables for the regression approach.
In volume prediction, an error ε is always existent. The variables’ coefficients are b0, b1, and b2. Volume value is calculated as Equation (12).
2.3. Proposed Method for Mango-Quality Classification
In this section, the data collection method and the model are presented to predict the quality of mango based on external features.
2.3.1. Data Collection
In model training, data play a crucial role and significantly impact the accuracy of the model. According to Behera et al., in study in [17], abundant and diverse data create favorable conditions for improving model accuracy. Therefore, a tabular dataset was collected across multiple harvest seasons and various mango farms in Dong Thap province, Vietnam. This dataset comprises 6 columns, with the first 5 columns representing the input features of the model: length, width, weight, volume, and defect. The last column denotes the label of each sample. A total of 1300 mango samples (as shown in Figure 6) were collected to construct the training data. Each feature value is measured n times. After that, the average value Am is calculated, as shown in Equation (13). These mangoes are labeled by experts. Therefore, the type of mango is selected based on Viet GAP standards (Vietnamese Good Agricultural Practices) for accurate classification. Criteria for Cat Chu mango quality in this study are presented in Table 1. Every feature is measured and recorded. These errors are then calculated to ascertain the variance between the system-calculated values and the actual values of each mango. The error evaluation is presented in the Experimental section.
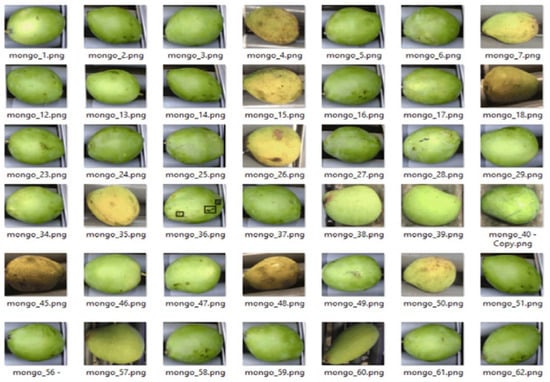
Figure 6.
Mango samples.

Table 1.
Mango-quality standards.
2.3.2. Data Preprocessing
After structuring the dataset, the statistical information from the dataset in this study is shown in Table 2. The data table reveals that each feature in the data has different ranges, with different mean and standard-deviation values. The complexity of the dataset effects model training [17]. Therefore, a data normalization method needs to be applied to reduce this influence. That method is a crucial preprocessing step in refining the tabular data for effective employment in ensemble-learning models in mango-quality classification. By standardizing the range and scale of features, normalization reduces differences stemming from differing magnitudes among features. This process ensures that no single feature dominates the learning algorithm due to its larger scale, resulting in more balanced model training. Additionally, normalization aids in improving convergence rates, enabling optimization algorithms to converge faster. Ultimately, by promoting uniformity and stability in the dataset, data normalization enhances robustness and accuracy, facilitating more precise classifications of mango quality. The correlation of features in the collected data is shown in Figure 7.
Table 2.
Statistics on the value of mango features.
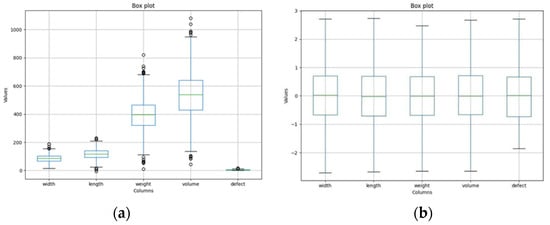
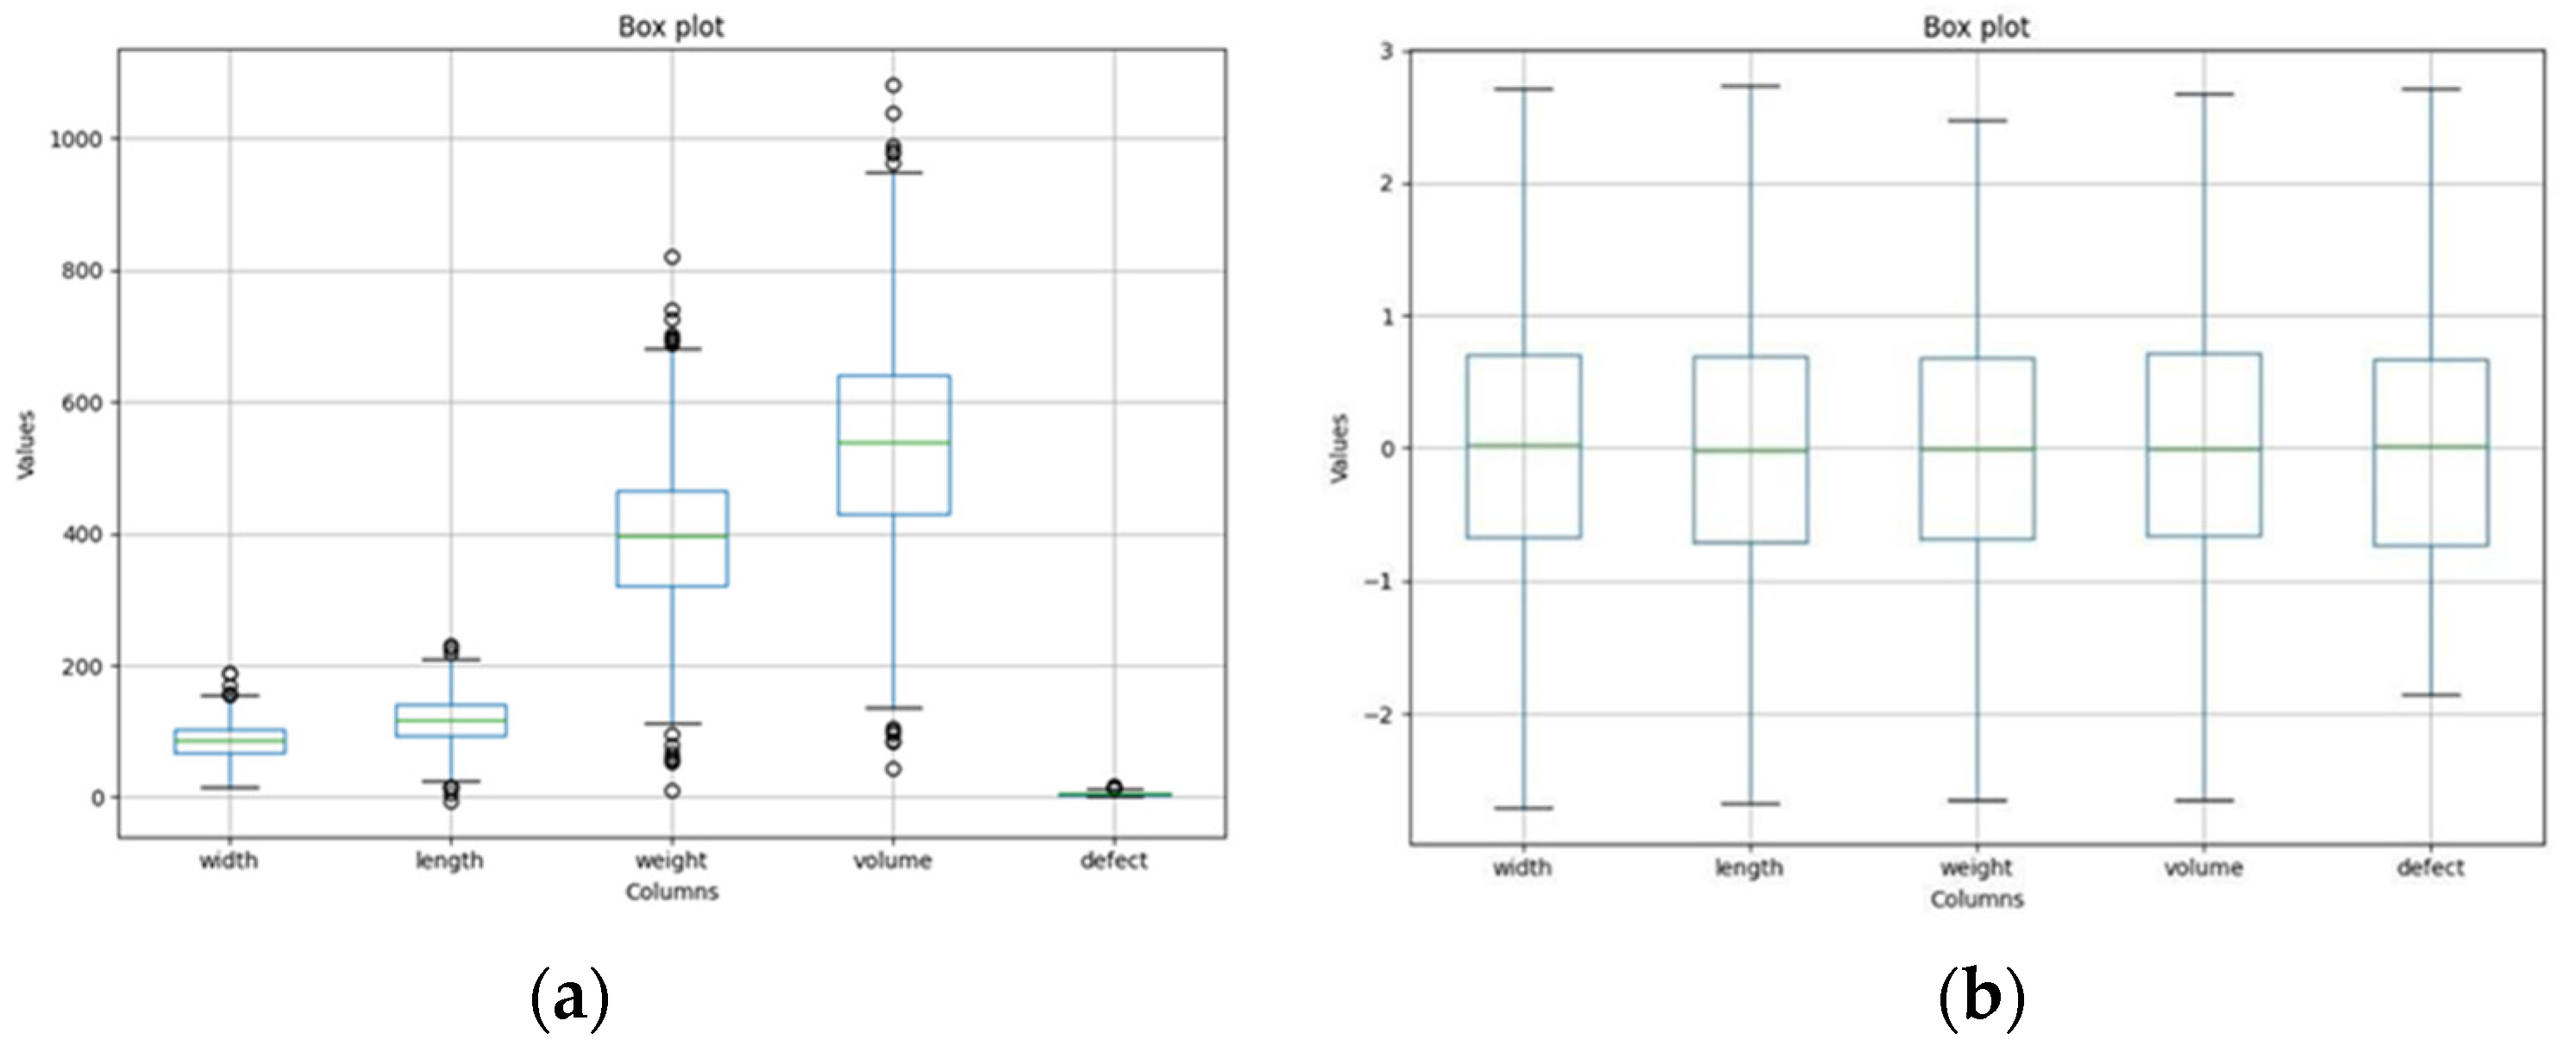
Figure 7.
Distribution of features in the dataset: (a) original data, (b) processed data.
The standard-scale method was employed to normalize the data, ensuring that all features were uniformly scaled and eliminating potential biases caused by differing scales among the features. It is a technique that was applied to standardize the dataset. This process involves transforming the data such that each feature has a mean of zero and a standard deviation of one, thereby eliminating differences arising from varying scales among the features. The equation for Standard Scaler is shown as follows (14).
where x represents the original value of the feature, μ is the mean of the feature’s values, σ is the standard deviation of the feature’s values, and z denotes the standardized value.
Furthermore, to enhance the robustness of the dataset, the interquartile range (IQR) method was utilized for outlier detection and subsequent removal. Outliers, which represent potential irregularities or noise in the data, were identified based on their deviation from the IQR boundaries and subsequently removed. This method involves calculating the IQR, represented as the difference between the third quartile (Q3) and the first quartile (Q1), denoted as follows (15).
Any data point falling below the (Q1 − 1.5 × IQR) value or above the (Q3 + 1.5 × IQR) value is considered an outlier, and subsequently removed from the dataset. This step aimed to enhance the dataset’s robustness by eliminating potentially noisy or irrelevant data points, thus improving performance and accuracy within the ensemble-learning framework for mango-quality classification. The distribution of the original data and the results of normalizing the data and removing outlines from the dataset are shown in Figure 7a,b, respectively.
Figure 7a shows the distribution of mango features. Figure 7a reveals that the mean values of the features increase in order from defect (5.14), width (85.77), length (118.2), weight (397.15), and volume (539.69). The mean value of volume reaches the largest value because it is calculated from many different features. A similar trend is also observed with the interquartile range (IQR) value when the defect is the smallest value, from 3.09 to 6.98, and the volume is the maximum, from 429.61 to 641.61. In addition, data points outside the maximum and minimum values are considered outliers. Those outliers are removed to facilitate the training process by the IQR method. After this process, the new distribution of the data is shown in Figure 7b, with the values of the features normalized with a mean of 0 and a standard deviation of 1.
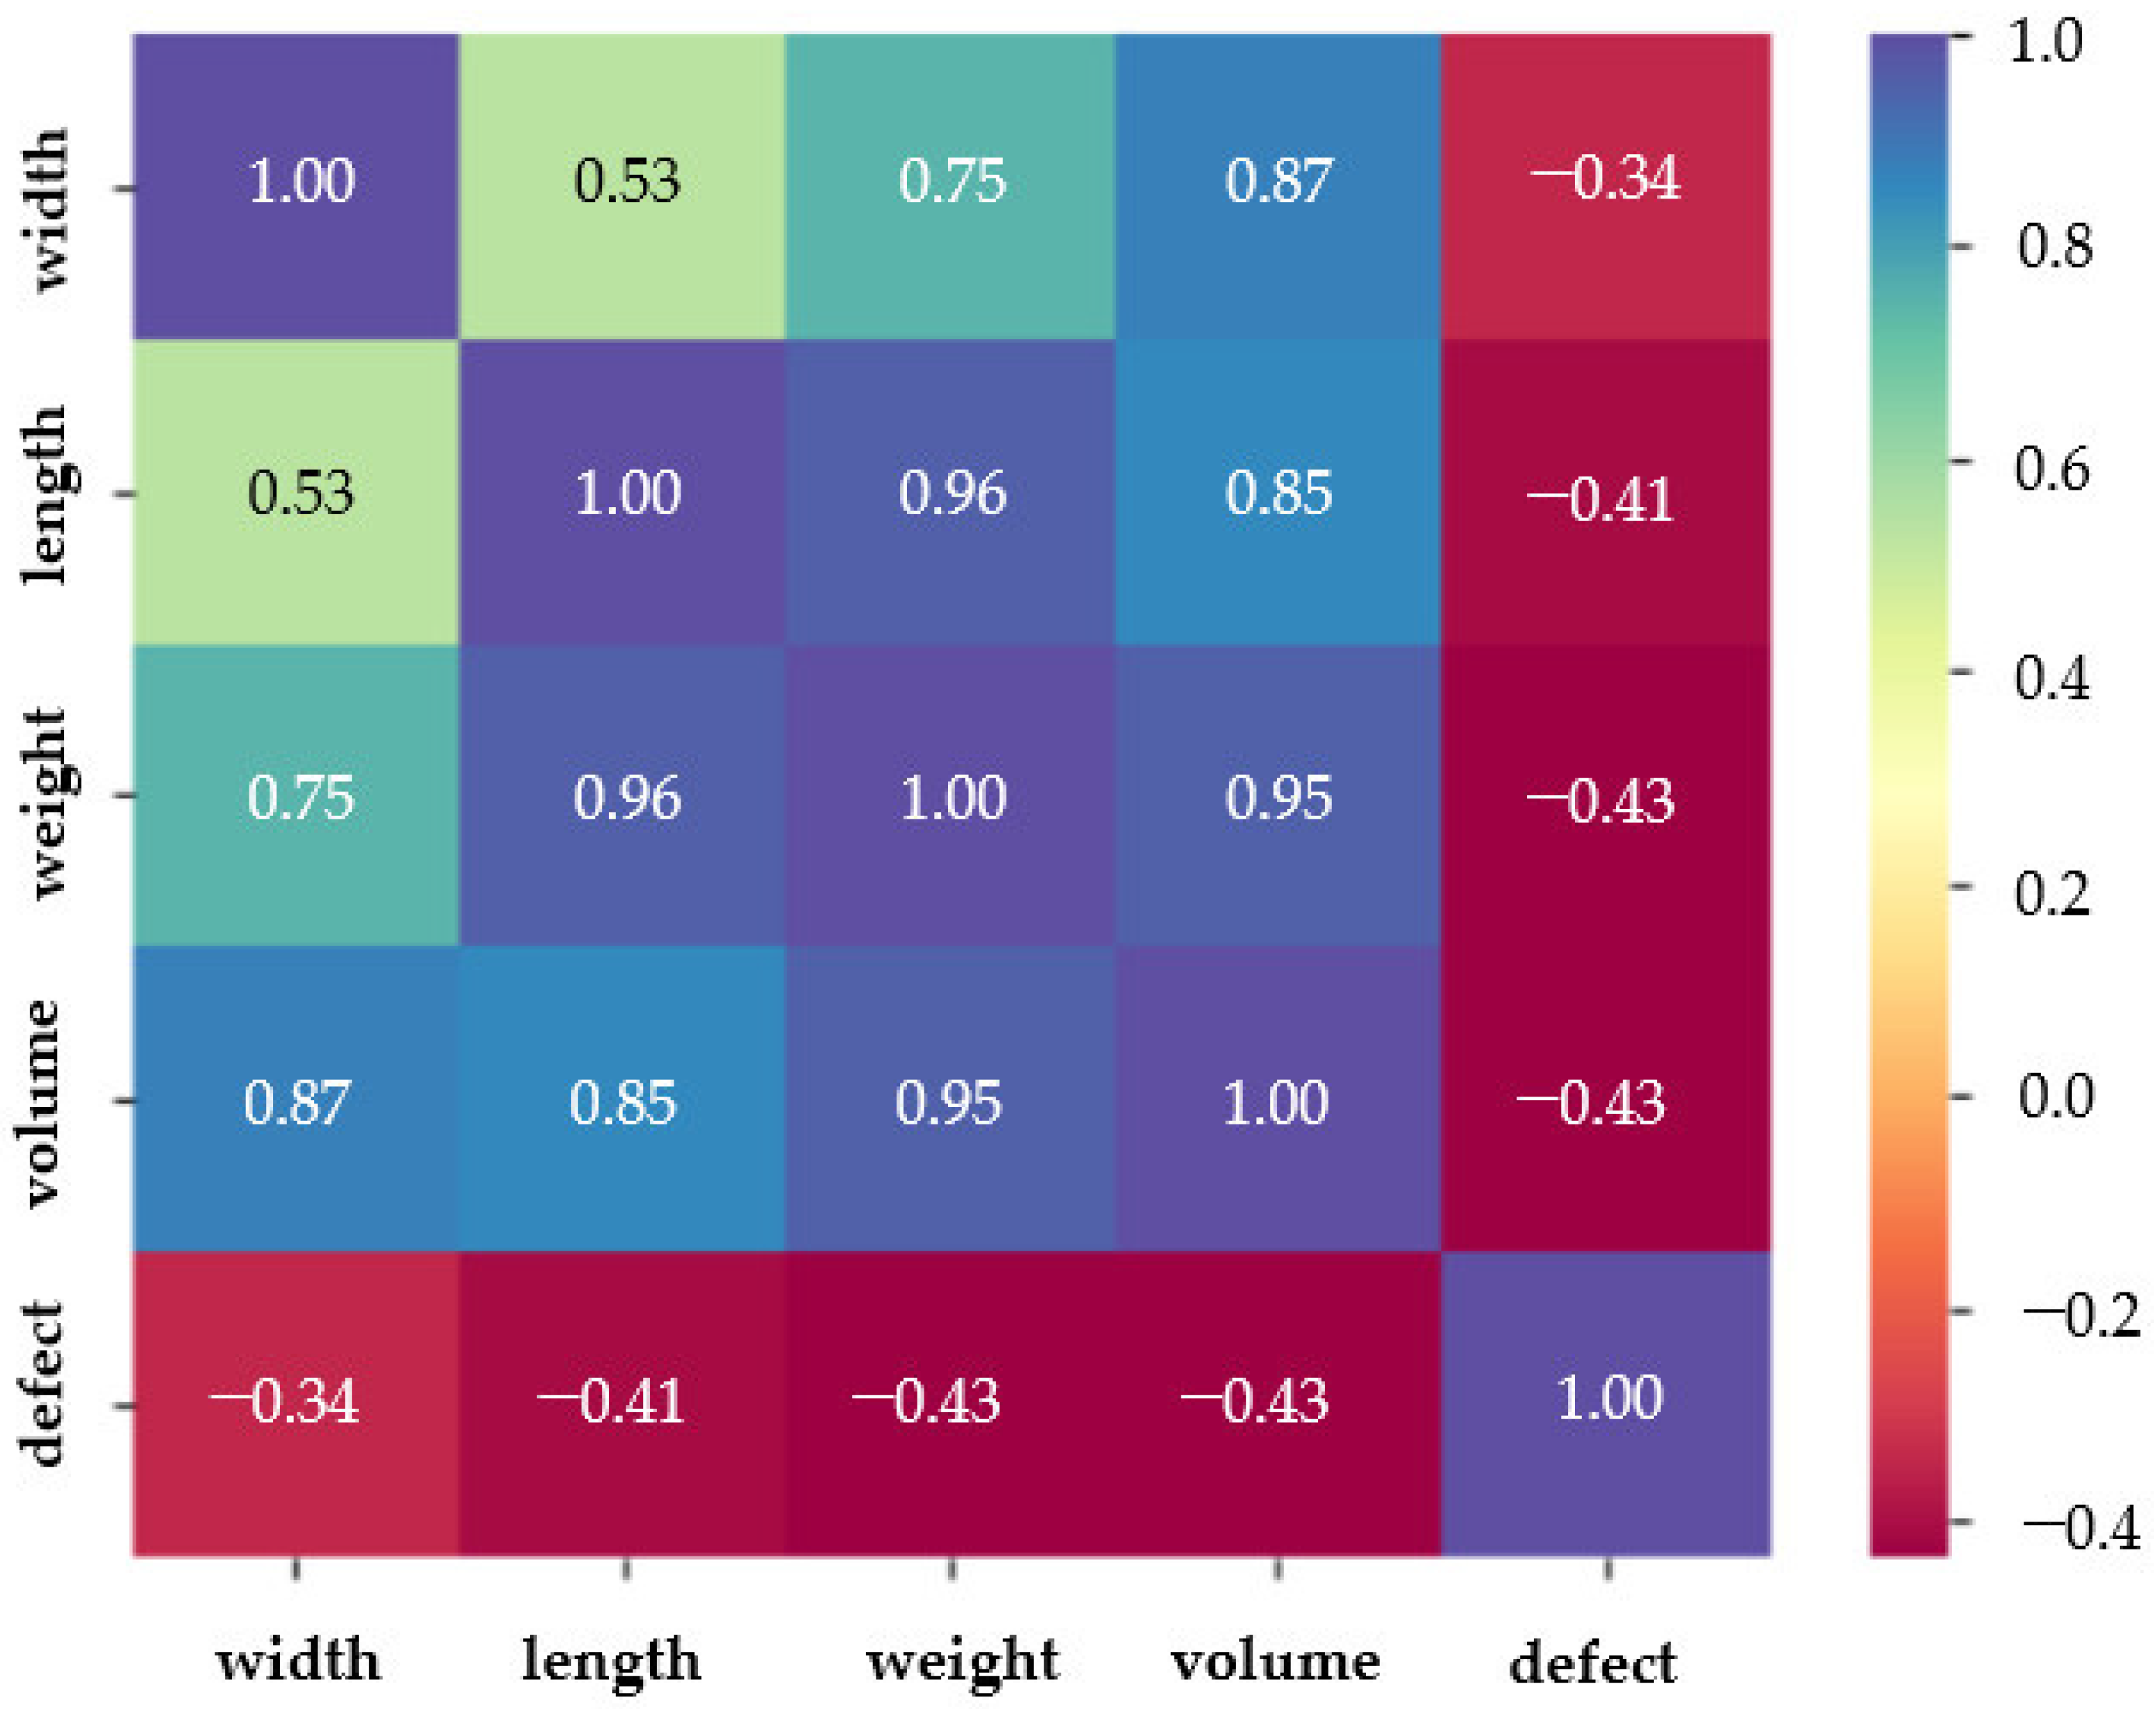
As illustrated in Figure 8, a heatmap is used to graphically depict the relationships between a variety of input parameters. The correlation coefficient, which measures the degree and direction of a relationship between two variables, is represented by each individual feature in the dataset. The degree of linear association between variables is shown by the correlation coefficient, a numerical value that ranges from −1 to 1. Values around 1 or −1 indicate a strong positive or negative linear relationship, respectively, whereas values near 0 indicate no linear relationship. In the context of this study, the heatmap demonstrated a positive linear relationship between the width, length, weight, and volume features. Meanwhile, the defect feature shows no relationship with the remaining features, because the defect’s correlation coefficient value compared to the remaining features is approximately zero.
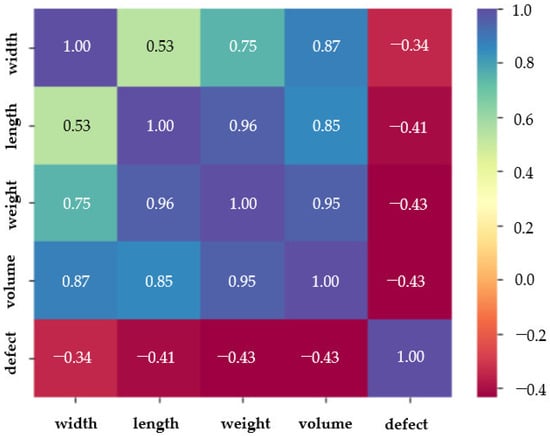
Figure 8.
Correlation between features.
2.3.3. Machine Learning Algorithms
In this section, individual ML models are utilized to predict mango quality based on external features. The selected ML algorithms are powerful in the classification based on the studies of [18,19]. They are evaluated and compared with each other to determine the best models for ensemble-learning methods, in the following section. The obtained data exhibit complex relationships; therefore, the objective is to discover robust models capable of capturing these complex relationships under various conditions. The description of these ML algorithms is as follows. Firstly, K-Nearest Neighbors [20] (KNN) is a simple yet effective algorithm used for classification. Given a new data point, KNN identifies its k-nearest neighbors based on a chosen distance metric (like Euclidean distance) in the feature space. The class label for the new data point is determined by a majority vote among its k neighbors. The output class is assigned based on the most frequently occurring class among these neighbors.
Decision Tree [18] (DT) is a versatile supervised learning algorithm used for both classification and regression tasks in machine learning. As a classifier, it makes predictions by learning simple decision rules inferred from the features in the training data. Random Forest [21] (RF) is an ensemble-learning method based on DTs. RF builds multiple DTs using random subsets of the training data and random subsets of features. Each tree in the forest independently makes a prediction, and in classification, the class predicted most frequently across all trees becomes the final prediction. Extra Trees Classifier [21] (ET) is an ML algorithm based on DTs, similar to RF, but with some key differences in the way trees are built. ET constructs multiple DTs using random subsets of the training data and random feature splits. Unlike RF, it selects random thresholds for each feature rather than finding the best possible thresholds for splitting nodes. This randomness allows ET to create more diverse trees, which can sometimes reduce variance and improve performance. AdaBoost [22] (ADB) is an ML algorithm that combines multiple weak learners into a strong classifier. ADB trains a series of weak classifiers (often decision trees) sequentially. Each model focuses on the instances that were misclassified by the previous models. During each iteration, the algorithm assigns higher weights to misclassified samples, making them more influential for subsequent models. Final predictions are made by combining the individual predictions of each weak classifier, where their importance is determined by their accuracy in the training process.
Gradient Boosting [23] (GB) builds a strong model by combining multiple weak learners, often decision trees, in a sequential manner. Unlike AdaBoost, GB focuses on minimizing the errors (residuals) of the previous models. GB builds a series of DTs sequentially, each one learning to correct the errors made by the preceding trees. Each new tree is trained on the residuals (the differences between actual and predicted values) of the previous model. The algorithm updates the model by optimizing the loss function, gradually reducing errors, and improving overall prediction accuracy. XGBoost [24] (XGB) is an ML algorithm that builds an ensemble of weak decision trees, optimizing the model by minimizing a defined loss function. It focuses on reducing errors by employing regularization techniques to prevent overfitting and by utilizing a gradient descent algorithm for efficient learning. Support Vector Machine [18] (SVM) is a powerful supervised learning algorithm. It finds the hyperplane that maximizes the margin, which is the distance between the hyperplane and the nearest data points (support vectors) of each class. It can handle linear and non-linear classification by using kernel functions to map data into higher-dimensional spaces.
2.3.4. Proposed Ensemble-Learning Method
This section presents the process of building and evaluating the model. This method involves several steps aimed at enhancing the model’s accuracy. Initially, the data undergo preprocessing to transform label values from strings to numbers. Subsequently, outlier detection and removal are performed on all features to reduce noise in the data. The data are then normalized to create optimal conditions for effective model training. Once this preparation is completed, the data are ready for input into the model. At this stage, eight ML models are selected for evaluation using the prepared dataset. The evaluation of these models is conducted independently by employing the Kfold cross-validation technique to ensure more accurate results. Following this stage, the outstanding algorithms are chosen, and hyperparameter tuning techniques are applied to enhance the performance of each model. Additionally, ensemble methods such as boosting, bagging, and stacking are employed to capture the intricate relationships within the data. Finally, these ensemble models undergo evaluation and comparison with each other to identify the most suitable model for the dataset in this study.
In evaluating ML algorithms, it is crucial to employ a method that assesses the performance and capabilities of the models in classifying mango quality. In this study, Kfold cross-validation is chosen as the method, due to its effectiveness. This method is widely utilized in other studies for evaluating ML algorithms [24]. Kfold cross-validation involves splitting the dataset into K subsets or “folds” of approximately equal size. The model is trained K times, each time using K-1 folds for training and the remaining fold for validation. This process allows for comprehensive validation, as each subset serves as both a training set and a validation set at different stages. The final performance metric is averaged over the K iterations, providing a reliable evaluation of the model’s performance. In addition, tuning hyperparameters is essential for optimizing the performance of the ML model. Various hyperparameter tuning techniques are employed in current research [22,23], including Bayesian optimization, random search, and grid search. Each method is utilized in distinct scenarios tailored to specific types of data. In this study, grid search is utilized to find the optimal parameters for the ML algorithm. The structure of building a mango-quality classification model is illustrated in Figure 9.
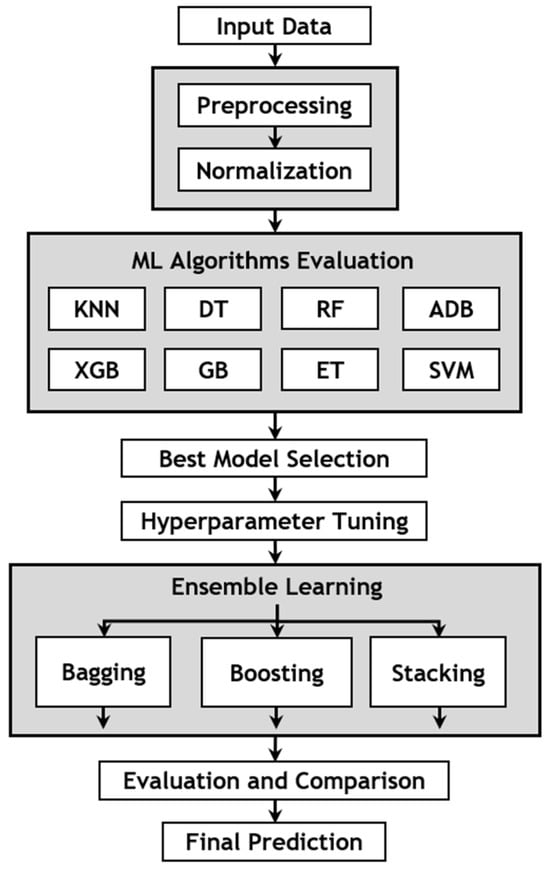
Figure 9.
Structure of proposed ensemble-learning method.
2.3.5. Performance Evaluation
The metrics used to evaluate the performance of models include precision (P), recall (R), F1-score (F), and accuracy (Acc), which are described in Equations (16)–(19). Firstly, accuracy measures the overall correctness of the model’s predictions. It signifies the proportion of correct predictions among all predictions made by the model. Secondly, precision assesses the accuracy of positive predictions. Precision focuses on minimizing false positive predictions, indicating how many of the predicted positive instances are actually positive. Next, recall evaluates the model’s ability to capture all positive instances. It emphasizes minimizing false negatives, indicating how many actual positive instances the model identifies correctly. Finally, the F1-score represents a balance between precision and recall, as in Equations (16)–(19).
where TP represents the instances where the model correctly predicts the positive class. TN represents the instances when the model correctly predicts the negative class. FP represents the instances where the model incorrectly predicts the positive class. FN represents the instances when the model incorrectly predicts the negative class.
3. Results and Discussions
3.1. External-Feature Extraction Evaluation
The external features of the mango were extracted by the image processing system. The classification of mango quality involves various features such as length, width, volume, and defects, which are crucial in determining overall fruit quality. Utilizing image processing algorithms to extract these features provides a quantitative means to classify mangoes. Then, a comparison between the predicted value and the measured value is made for an overall evaluation. The evaluation metrics of mean absolute error (MAE) and root-mean-squared error (RMSE) are used for assessing the accuracy of the image processing algorithm in estimating mango features. The equation of those metrics is presented in Equations (20) and (21).
where n is the number of samples, y is the actual value by measurement, and is the predicted value.
Table 3 presents the performance evaluation of mango features extracted using image processing algorithms. The extracted features, including width, length, volume, weight, and defect, were evaluated using MAE and RMSE metrics. The MAE values indicate the average magnitude of errors between the measured value and the algorithmically obtained value. In this table, lower MAE values, such as for weight (0.15986), width (0.54764), length (0.62954), and defect (0.03187), signify a small error between the actual and predicted values, suggesting higher accuracy in the estimation of these features. Conversely, features like volume (5.78345) display slightly higher MAE values, implying a comparatively greater deviation between actual and estimated values. The larger error value stems from the combined errors in the width and length features, as the volume feature is derived from these two parameters. Nonetheless, despite this relatively larger error, it remains within an acceptable range for practical use in the mango-quality grading system. Similarly, the RMSE values provide in-depth insight into errors, with lower RMSE values indicating a more precise estimation. That evaluation offers a comprehensive understanding of the algorithm’s efficacy in extracting mango features from images.
Table 3.
Evaluating errors in estimating the feature value of mangoes.
3.2. Model Evaluation
The previous experiment evaluated the external-feature extraction process, demonstrating the feasibility of image processing algorithms. In this section, eight ML algorithms undergo evaluation and comparison using the Kfold cross-validation method. The average values of the metrics are recorded in Table 4, with the first column indicating the algorithm type and the subsequent columns displaying precision, recall, F1-score, and accuracy values. The results are arranged in descending order based on accuracy. The evaluation of multiple ML algorithms based on their performance illuminates distinctive strengths and weaknesses. Table 4 reveals that KNN and DT are two algorithms with all P, R, F, and Acc values below 0.9, while ensemble algorithms from DT such as AD, GB, ET, RF, XGB, and SVM all reach above 0.9. This confirms the effectiveness of ensemble techniques in those models. Among the eight algorithms, three showed outstanding performances, such as XGBoost, Random Forest, and Extra Tree Classifier. XGBoost exhibits a remarkable precision of 0.98, indicating its robustness in minimizing false positives, coupled with an impressive accuracy rate of 0.97. Both Random Forest and Extra Tree Classifiers showcase strong overall performance, with an F1 score and an accuracy level above 0.96. Random Forest maintains a slightly lower recall of 0.95 compared to the Extra Tree Classifier’s recall of 0.97, implying a reduced false-negative rate in predictive results. The results also reveal that XGB is the model that achieves the most comprehensive power, with P, R, F, and Acc values of 0.98, 0.94, 0.96, and 0.97, respectively. This result is important for helping to find a robust algorithm suitable for the dataset to develop the ensemble-learning model that is presented below.
Table 4.
Performance of individual ML algorithms.
Next, hyperparameter tuning is applied to find the optimal parameters for the models, enhancing their performance and stability. Following this process, the three algorithms that achieve high performance undergo ensemble-learning techniques such as bagging, boosting, and stacking. Ensemble methods such as bagging, boosting, and stacking stand as powerful techniques aimed at exploiting the strengths of single algorithms to enhance predictive performance. The evaluation of the ensemble-learning method on both training and testing sets is recorded in Table 5. The findings indicated that bagging, boosting, and stacking achieved accuracies of 0.9793, 0.9885, and 0.9932 on the training data, respectively. Notably, the stacking method attained the highest accuracy value, suggesting greater robustness among the comparison models.
Table 5.
Results of different ensemble-learning models.
Among the individual algorithms, Table 5 illustrates the fact that the XGBoost algorithm demonstrates superior performance. Consequently, the bagging and boosting approaches leverage the strengths of the XGBoost algorithm as a base model. In this process, bagging operates by training multiple models independently on different subsets of the training data and subsequently aggregating their predictions through voting, mitigating overfitting, and fostering robustness. On the other hand, boosting focuses on the sequential improvement of models by assigning higher weights to misclassified instances, allowing subsequent models to rectify previous errors. This iterative refinement often leads to higher predictive accuracy.
The stacking method, a more intricate ensemble technique, combines diverse models’ predictions as input features for a meta-learner, enabling the creation of a higher-performing model by leveraging the varied strengths of base models. This method involves constructing a base model comprising multiple ML algorithms combined. These algorithms within the base model generate predictions, which subsequently serve as input data for a higher-level model to generate the final output. Among the eight ML models assessed, XGBoost, Random Forest, and Extra Tree Classifier demonstrated superior performance and were chosen for integration into the base model. Specifically, each model within the base model undergoes training on a part of the training data. Subsequently, each prediction serves as a data point in the meta-dataset. In a meta model, a high-level model is designated to produce the final prediction. The selection of the appropriate meta-learner depends on the specific problem. Notably, in a study by Cui et al. [25], the meta-learner was determined due to its highest performance among the base models. Specifically, in the context of mango data, the meta-learner is designed by the XGBoost algorithm. The results in Table 5 highlight the superiority of the stacking model over others, exhibiting higher values for precision, recall, f1-score, and accuracy at 0.9919, 0.9938, 0.9928, and 0.9932 on the training data, respectively. This superiority can be analyzed as follows: stacking outperforms both bagging and boosting models in ensemble learning, due to its capacity for sophisticated model combinations and adaptive learning. Unlike bagging, which aggregates predictions from parallel models, or boosting, which sequentially improves weak learners, stacking operates on multiple levels, utilizing a meta-learner to synthesize information from the predictions of diverse base models. This hierarchical approach allows the meta-learner to interpret the strengths of individual models, resulting in more accurate predictions. Stacking’s flexibility in selecting meta-learners suitable for specific problems allows it to adapt to a wider range of scenarios compared to fixed strategies like bagging and boosting. In the testing data, the stacking model exhibits a slight decrease in the values of precision, recall, f1-score, and accuracy by 0.9855, 0.9901, 0.9876, and 0.9863, respectively. This suggests the model’s stability, and indicates the absence of overfitting during testing. The obtained results confirm the robustness of the stacking model described in this study. This indicates its feasibility in achieving high accuracy for the mango-quality classification process.
3.3. Comparison with Different Studies
In this study, a stacking method is proposed within the ensemble-learning framework for classifying mango quality based on external features. The experimental results (as presented in Section 3.2) show the robustness of this method. In this section, the proposed method is compared with other approaches for classifying agricultural products. Table 6 showcases the performance outcomes of diverse methods for various fruits. Specifically, the convolutional neural network (CNN) in [26] achieved an accuracy of 95.64% in mango-quality classification, while the Random Forest algorithm in [27] attained 98.10%. In the other study in [28], the eight-layer CNN focused on general fruit classification and obtained an accuracy of 95.67%. Meanwhile, the fusion of image processing and ANN in [29] for dragon fruit classification resulted in an accuracy of 83.10%, and the combination of KNN and CNN in [29] for dragon fruit achieved 92.85%. Notably, the proposed method for mango-quality classification outperformed all other models, achieving the highest accuracy, of 98.63%. The strength of the proposed method lies in its ensemble-learning method, which synthesizes the predictive abilities of various models into a meta-learner, thus leveraging the strengths of individual models. The proposed method surpasses the performance of single models such as RF [27] and ANN [29] because the proposed approach mitigates individual model weaknesses, leading to more robust and accurate predictions tailored explicitly toward assessing mango quality. Additionally, the ensemble’s capacity to capture diverse aspects of mango features in base models, which have a feature extraction function similar to CNN layers in [26,28]. The extracted features are subsequently input into a robust model like XGBoost, previously evaluated for mango-classification data, to yield optimal results. That may explain the proposed method’s equivalent performance compared to deep learning-based methods.
Table 6.
Results of various studies on agricultural-product classification.
The results of the processing speed and accuracy of various methods are presented in Table 7. The system’s processing speed is calculated in frames per second (FPS), which is taken 2000 times and then calculated as an average value to obtain the final result. In Table 7, the results are sorted by the decreasing value of FPS. This table lists the traditional image processing, ML and DL methods used to classify each different object. Table 7 shows that LDA [30] is the method with the fastest processing speed, at 58 FPS. This can be understood because it is a method without a learning process. For the ML and DL methods, the processing speed has decreased because the learning process involves a larger number of calculations. Notably, the CNN networks of the authors in [31] achieve a processing speed of 18 FPS, which does not meet the real-time processing requirements. Meanwhile, ML methods achieve better processing speeds than DL methods. The reason for this is that ML models are often simpler and have fewer parameters. Table 7 also reveals that individual ML algorithms and ensemble-learning methods (EL) can operate in real time. Among them, XGBoost has the fastest processing speed, with 32 FPS, and the proposed ensemble-learning method (EL) reaches 26 FPS. The decrease in processing speed comes from the model size of the EL method reaching 5.2 M larger than XGB, RF, and ET with 1 M, 1.2 M, and 3.8 M, respectively. For the accuracy of the classification process, it is easy to see that the ML and DL methods outperform the LDA method. The reason comes from the fact that intelligent algorithms have a learning process that has the ability to extract features and adapt to the environment more strongly. Notably, the proposed EL method achieves the highest accuracy, of 98%. From the above analysis, it can be confirmed that it is feasible to apply the proposed EL method for classifying mango quality in practice.
Table 7.
Results of various studies on accuracy and processing speed in fruit classification.
4. Conclusions
This paper proposes an ensemble-learning method for mango-quality classification. In the experiment, the results showed that the stacking model, consisting of a combination of the base model and the meta-model, achieved the best results. This method established the relationship between the input data by building a model capable of combining the strengths of different ML models, leading to the creation of a final prediction with high reliability. The proposed method has improved efficiency in classifying mango quality. The feasibility of this study provides an effective method for researchers in the agricultural field to solve image-feature extraction problems and to build robust prediction models. This research is not limited to just the mango plant. It contributes to creating a solid foundation for building classification systems for other fruits, such as sweet potatoes, grapefruit, etc. Developing and evaluating the proposed ensemble-learning model can even be applied to solve prediction problems in other research fields. The ensemble-learning method in this study is a general approach. Therefore, it should be redesigned for application to specific problems by increasing the number of models at each level. Based on this approach, researchers in other fields, such as mechanical engineering or even economics, seeking a powerful prediction algorithm to solve specific problems can refer to this study in the future.
Author Contributions
Conceptualization, N.T.T., N.M.T. and W.C.L.; methodology, N.T.T., N.D.T. and N.M.T.; software, N.D.T. and N.M.T.; validation, N.T.T., N.D.T. and N.M.T.; formal analysis, N.T.T., N.D.T. and N.M.T.; investigation, N.M.T., N.D.T.; resources, N.T.T. and N.M.T.; data curation, N.D.T., N.T.T. and N.M.T.; writing—original draft preparation, N.D.T. and N.M.T.; writing—review and editing, N.T.T. and W.C.L.; visualization, N.M.T. and N.D.T.; supervision, N.T.T. and W.C.L.; project administration, N.T.T.; funding acquisition, N.T.T. All authors have read and agreed to the published version of the manuscript.
Funding
This research received no external funding.
Data Availability Statement
Data are contained within the article.
Acknowledgments
This research is funded by University of Economics Ho Chi Minh City—UEH, Vietnam.
Conflicts of Interest
The authors declare no conflicts of interest.
References
- Momin, M.; Rahman, M.; Sultana, M.; Igathinathane, C.; Ziauddin, A.; Grift, T. Geometry-based mass grading of mango fruits using image processing. Inf. Process. Agric. 2017, 4, 150–160. [Google Scholar] [CrossRef]
- Gururaj, N.; Vinod, V.; Vijayakumar, K. Deep grading of mangoes using convolutional neural network and computer vision. Multimed. Tools Appl. 2023, 82, 39525–39550. [Google Scholar] [CrossRef]
- Thong, N.D.; Thinh, N.T.; Cong, H.T. Mango sorting mechanical system combines image processing. In Proceedings of the 2019 7th International Conference on Control, Mechatronics and Automation (ICCMA), Delft, Netherlands, 6–8 November 2019; pp. 333–341. [Google Scholar]
- Trieu, N.M.; Thinh, N.T. A study of combining knn and ann for classifying dragon fruits automatically. J. Image Graph. 2022, 10, 28–35. [Google Scholar] [CrossRef]
- Brezmes, J.; Fructuoso, M.; Llobet, E.; Vilanova, X.; Recasens, I.; Orts, J.; Saiz, G.; Correig, X. Evaluation of an electronic nose to assess fruit ripeness. IEEE Sens. J. 2005, 5, 97–108. [Google Scholar] [CrossRef]
- Matteoli, S.; Diani, M.; Massai, R.; Corsini, G.; Remorini, D. A spectroscopy-based approach for automated nondestructive maturity grading of peach fruits. IEEE Sens. J. 2015, 15, 5455–5464. [Google Scholar] [CrossRef]
- Nandi, C.S.; Tudu, B.; Koley, C. A machine vision technique for grading of harvested mangoes based on maturity and quality. IEEE Sens. J. 2016, 16, 6387–6396. [Google Scholar] [CrossRef]
- Sa’ad, F.; Ibrahim, M.; Shakaff, A.; Zakaria, A.; Abdullah, M. Shape and weight grading of mangoes using visible imaging. Comput. Electron. Agric. 2015, 115, 51–56. [Google Scholar] [CrossRef]
- Schulze, K.; Nagle, M.; Spreer, W.; Mahayothee, B.; Müller, J. Development and assessment of different modeling approaches for size-mass estimation of mango fruits (Mangifera indica L., cv.‘Nam Dokmai’). Comput. Electron. Agric. 2015, 114, 269–276. [Google Scholar] [CrossRef]
- Mittal, S.; Dutta, M.K.; Issac, A. Non-destructive image processing based system for assessment of rice quality and defects for classification according to inferred commercial value. Measurement 2019, 148, 106969. [Google Scholar] [CrossRef]
- Cao, J.; Sun, T.; Zhang, W.; Zhong, M.; Huang, B.; Zhou, G.; Chai, X. An automated zizania quality grading method based on deep classification model. Comput. Electron. Agric. 2021, 183, 106004. [Google Scholar] [CrossRef]
- Huang, S.; Fan, X.; Sun, L.; Shen, Y.; Suo, X. Research on classification method of maize seed defect based on machine vision. J. Sens. 2019, 2019, 2716975. [Google Scholar] [CrossRef]
- Pérez-Borrero, I.; Marín-Santos, D.; Gegúndez-Arias, M.E.; Cortés-Ancos, E. A fast and accurate deep learning method for strawberry instance segmentation. Comput. Electron. Agric. 2020, 178, 105736. [Google Scholar] [CrossRef]
- Li, Z.; Yin, C.; Zhang, X. Crack Segmentation Extraction and Parameter Calculation of Asphalt Pavement Based on Image Processing. Sensors 2023, 23, 9161. [Google Scholar] [CrossRef] [PubMed]
- Ghazal, S.; Qureshi, W.S.; Khan, U.S.; Iqbal, J.; Rashid, N.; Tiwana, M.I. Analysis of visual features and classifiers for Fruit classification problem. Comput. Electron. Agric. 2021, 187, 106267. [Google Scholar] [CrossRef]
- Chithra, P.; Henila, M. Apple fruit sorting using novel thresholding and area calculation algorithms. Soft Comput. 2021, 25, 431–445. [Google Scholar] [CrossRef]
- Behera, S.K.; Rath, A.K.; Sethy, P.K. Maturity status classification of papaya fruits based on machine learning and transfer learning approach. Inf. Process. Agric. 2021, 8, 244–250. [Google Scholar] [CrossRef]
- T.K., B.; Annavarapu, C.S.R.; Bablani, A. Machine learning algorithms for social media analysis: A survey. Comput. Sci. Rev. 2021, 40, 100395. [Google Scholar] [CrossRef]
- Sen, P.C.; Hajra, M.; Ghosh, M. Supervised classification algorithms in machine learning: A survey and review. In Emerging Technology in Modelling and Graphics: Proceedings of IEM Graph 2018; Springer: Singapore, 2020; pp. 99–111. [Google Scholar]
- Zhang, S. Cost-sensitive KNN classification. Neurocomputing 2020, 391, 234–242. [Google Scholar] [CrossRef]
- Ghiasi, M.M.; Zendehboudi, S. Application of decision tree-based ensemble learning in the classification of breast cancer. Comput. Biol. Med. 2021, 128, 104089. [Google Scholar] [CrossRef]
- Ileberi, E.; Sun, Y.; Wang, Z. Performance evaluation of machine learning methods for credit card fraud detection using SMOTE and AdaBoost. IEEE Access 2021, 9, 165286–165294. [Google Scholar] [CrossRef]
- Bentéjac, C.; Csörgő, A.; Martínez-Muñoz, G. A comparative analysis of gradient boosting algorithms. Artif. Intell. Rev. 2021, 54, 1937–1967. [Google Scholar] [CrossRef]
- Qiu, Y.; Zhou, J.; Khandelwal, M.; Yang, H.; Yang, P.; Li, C. Performance evaluation of hybrid WOA-XGBoost, GWO-XGBoost and BO-XGBoost models to predict blast-induced ground vibration. Eng. Comput. 2021, 38, 4145–4162. [Google Scholar] [CrossRef]
- Cui, S.; Yin, Y.; Wang, D.; Li, Z.; Wang, Y. A stacking-based ensemble learning method for earthquake casualty prediction. Appl. Soft Comput. 2021, 101, 107038. [Google Scholar] [CrossRef]
- Wei, H.; Chen, W.; Zhu, L.; Chu, X.; Liu, H.; Mu, Y.; Ma, Z. Improved Lightweight Mango Sorting Model Based on Visualization. Agriculture 2022, 12, 1467. [Google Scholar] [CrossRef]
- Long, N.T.M.; Thinh, N.T. Using machine learning to grade the mango’s quality based on external features captured by vision system. Appl. Sci. 2020, 10, 5775. [Google Scholar] [CrossRef]
- Wang, S.-H.; Chen, Y. Fruit category classification via an eight-layer convolutional neural network with parametric rectified linear unit and dropout technique. Multimed. Tools Appl. 2020, 79, 15117–15133. [Google Scholar] [CrossRef]
- Trieu, N.M.; Thinh, N.T. Quality classification of dragon fruits based on external performance using a convolutional neural network. Appl. Sci. 2021, 11, 10558. [Google Scholar] [CrossRef]
- Blasco, J.; Cubero, S.; Gómez-Sanchís, J.; Mira, P.; Moltó, E. Development of a machine for the automatic sorting of pomegranate (Punica granatum) arils based on computer vision. J. Food Eng. 2009, 90, 27–34. [Google Scholar] [CrossRef]
- Fan, S.; Li, J.; Zhang, Y.; Tian, X.; Wang, Q.; He, X.; Zhang, C.; Huang, W. On line detection of defective apples using computer vision system combined with deep learning methods. J. Food Eng. 2020, 286, 110102. [Google Scholar] [CrossRef]


Disclaimer/Publisher’s Note: The statements, opinions and data contained in all publications are solely those of the individual author(s) and contributor(s) and not of MDPI and/or the editor(s). MDPI and/or the editor(s) disclaim responsibility for any injury to people or property resulting from any ideas, methods, instructions or products referred to in the content. |
© 2024 by the authors. Licensee MDPI, Basel, Switzerland. This article is an open access article distributed under the terms and conditions of the Creative Commons Attribution (CC BY) license (https://creativecommons.org/licenses/by/4.0/).